11email: aditya.k@iiap.res.in
Challenges in modeling the dark matter halo of NGC 1052-DF2: Cored versus cuspy halo models
Abstract
Aims. The discovery of NGC 1052-DF2 and subsequent modeling have shown that NGC 1052-DF2 is deficient in dark matter and is in conflict with the standard stellar-to-halo mass ratio. In this work, we aim to resolve the degeneracy between the dynamical models on the mass estimate of the NGC 1052-DF2.
Methods. We constructed mass models of NGC 1052-DF2 using an anisotropic distribution function with a radially varying anisotropy parameter and studied the effect of the various model parameters on the dark matter estimates. We used the observed stellar photometry as an input parameter to construct the distribution function and employed a Markov Chain Monte Carlo (MCMC) method to estimate the dark matter model parameters.
Results. We find that mass models with a cuspy dark matter halo have comparable to models with zero dark matter. Moreover, the cuspy dark matter halo fails to consistently account for the observed velocity dispersion in the inner and outer regions of the galaxy. Consequently, we rule out the possibility of a cuspy dark matter halo for describing the mass models of NGC 1052 - DF2. Our study shows that the cored dark matter halo model with a total mass of explains the observed kinematics but requires an extraordinarily large scale length (20kpc) and an outer cutoff radius (26kpc). While the cored mass model provides a comparatively better fit, our findings emphasize that the mass models are largely unconstrained by the available kinematic data. Our results suggest that NGC 1052 - DF2 may not only have an ultra-diffuse stellar distribution but that it can, within uncertainties in the available kinematic data, potentially host an ultra-diffuse dark matter distribution compatible with the standard stellar-to-halo mass relation (SHMR) predicted by galaxy formation and evolution models
Key Words.:
galaxies:individual:NGC 1052-DF2: galaxies:kinematics and dynamics: galaxies:structure1 Introduction
Ultra-diffuse galaxies (UDGs) are a subclass of low-surface-brightness galaxies
with the characteristic luminosity of a dwarf galaxy but an effective radius larger than that
expected for their mass content, and hence ultra-diffuse (Van Dokkum et al., 2015).
Ultra-diffuse galaxies are defined as having g-band central surface brightnesses,
, and effective radii, .
Deep photometric observations have identified UDGs in varied environments,
from groups to clusters and fields (Koda et al., 2015; Yagi et al., 2016; van der Burg et al., 2016; Román & Trujillo, 2017; Trujillo et al., 2019; Mancera Piña et al., 2019; Lee et al., 2020; Marleau et al., 2021).
In this work, we study the detailed mass models of NGC 1052 - DF2. The dark
matter content in this galaxy has been claimed to be in tension with the standard
stellar-to-halo mass relation (SHMR) (Behroozi et al., 2010)
but is instead consistent with zero dark matter content.
In this work, we show that the mass estimates are critically dependent on
the shape and structure of the dark matter halo and anisotropy of the stellar dispersion.
With a large number of UDGs being discovered in deep
surveys (Koda et al., 2015; Mihos et al., 2015; Merritt et al., 2016; Marleau et al., 2021; Zaritsky et al., 2022), the detailed mass models
presented in this work help us disentangle the role of different structural and
dynamical parameters on the mass estimates of the dark matter halos in these systems (Shi et al., 2021; Mancera Piña et al., 2022a; Mancera Piña et al., 2024).
NGC 1052-DF2 was previously identified by Fosbury et al. (1978) and
Karachentsev et al. (2000) and more recently by Van Dokkum et al. (2018); Emsellem et al. (2019); Fensch et al. (2019); Danieli et al. (2019)
as a satellite galaxy of the elliptical galaxy NGC 1052.
The dynamical mass of the galaxy within a given radius was estimated with
the mass estimator method (MTE) (Watkins et al., 2010) using the observed
kinematics of ten globular clusters of the galaxy. The MTE predicts
the total dynamical mass within 7.6 kpc to be less than
, which is on the order of
the estimated stellar mass of . This
surprising result implies that within 7.6kpc the mass of the galaxy
is mostly baryonic matter, and that the dark matter needed to
explain hierarchical structure formation in the
CDM scenario is significantly less than expected in NGC 1052 - DF2.
The CDM theory gives a remarkable description of the large-scale structure of galaxies (Springel et al., 2006) but shows discrepancies between simulations and observations (Bullock & Boylan-Kolchin, 2017) at galactic and sub-galactic scales. Using the zoom-in cosmological hydrodynamical simulations, it has been shown that UDGs like NGC 1052-DF2 are derivatives of dwarf galaxies that have had their gas removed and star formation quenched (Haslbauer et al., 2019; Tremmel et al., 2020; Liao et al., 2019; Chan et al., 2018). Further, the lack of dark matter in NGC 1052-DF2 has opened up avenues for testing alternative or modified gravity theories, for example (see Moffat & Toth (2019); Islam (2020); Müller et al. (2019); Famaey et al. (2018)). Thus, NGC 1052-DF2 poses interesting questions regarding the formation of galaxies with minimal dark matter content, astrophysical processes regulating the formation of such galaxies, and the potential nature of dark matter.
Previous studies on dynamical modeling of NGC 1052-DF2 by Wasserman et al. (2018); Hayashi & Inoue (2018) rely on solutions of spherically symmetric Jeans equations with a constant anisotropy parameter. Similarly, Nusser (2019) adopt a distribution function-based approach to estimating the dark matter mass consistent with the observed line of sight stellar dispersion. Wasserman et al. (2018) find that the models assuming the standard SHMR predict a large central velocity dispersion, whereas the models with halo mass kept as a free parameter describe the observation better. Studies by Wasserman et al. (2018) and Hayashi & Inoue (2018) find a similar mass estimate for the dark matter halo . The large number of parameters involved in dynamical modeling using spherical Jeans equations is riddled with degeneracies. Although detailed modeling methods exist for disentangling the degeneracy between different parameters (Mamon & Boué, 2010; Richardson & Fairbairn, 2014; Read & Steger, 2017), these methods require information about the kinematics of multiple stellar populations and higher-velocity moments. In this study, we construct dynamical models of NGC 1052-DF2 using a distribution function-based approach with a radially varying anisotropy parameter (Cuddeford, 1991; Vasiliev, 2019).
2 Dynamical model of NGC 1052-DF2
NGC 1052-DF2, a UDG, has been the subject of intense study due to its unusual dark matter content. The dark matter in NGC 1052-DF2 appears to be significantly lower than what is predicted by the standard SHMR. This study aims to resolve the discrepancies in the mass modeling of NGC 1052-DF2 by employing dynamical models based on an anisotropic distribution function. We constructed distribution function-based models using the stellar density as an input parameter and constrained the parameters corresponding to the dark matter halo using the Markov Chain Monte Carlo (MCMC) method. We used the observed velocity dispersion profile derived by (Wasserman et al., 2018; Van Dokkum et al., 2018) as a constraint on our model. We now describe the input parameter needed to construct the mass models of NGC 1052 - DF2.
2.1 Stellar density
The structure of the stellar body in NGC 1052-DF2 was parameterized by a Sérsic profile (Sersic, 1968):
| (1) |
with a Sérsic index of , axes ratio of , and effective radius of (Van Dokkum et al., 2018). The stellar mass of NGC 1052-DF2 is , assuming a mass-to-light ratio equal to 2.0 in the V band. The stellar density profile constitutes an input to the mass models of NGC 1052- DF2 and was implemented as a Sersic model in AGAMA.
2.2 Stellar velocity dispersion
We used the stellar dispersion profile of the NGC 1052-DF2 given in Van Dokkum et al. (2018); Wasserman et al. (2018). Using the Keck Cosmic Web Imager (KCWI), Danieli et al. (2019) report stellar dispersion to be equal to km s-1, whereas in another independent study, Emsellem et al. (2019) report stellar dispersion equal to km s-1using the Multi-Unit Spectroscopic Explorer (MUSE) at the ESO Very Large Telescope (VLT). We used the observed stellar dispersion profile derived by Wasserman et al. (2018); Van Dokkum et al. (2018) as a constraint on the dynamical model of NGC 1052 - DF2.
2.3 Dark matter density
We parameterized the dark matter profile using the general Hernquist model, which can mimic both the cored dark matter density and the cuspy one (Hernquist, 1990; Zhao, 1996):
| (2) |
where and are the central density and scale length, respectively, is the sharpness parameter of the transition from the inner slope, , to the outer slope, , and is the outer cutoff radius. The density profile was implemented as a Spheroid model in AGAMA. The Spheroid model in AGAMA can also be initialized with the total dark matter mass within using the argument mass. In the case of the cuspy profile, the total dark matter mass is related to the virial mass and the concentration parameter by , where is related to the virial radius and the scale length of the dark matter halo through . However, in the case of cored halo, is mass enclosed inside . We modeled the dark matter density as either a cored density profile () or a cuspy one () in our model.
2.4 Galaxy model
We combined the density of the stellar component and dark matter models to compute the total potential of the system using the AGAMA class Potential. The Potential class in AGAMA uses multipole expansion to compute the potential for any given density profile. The density was decomposed into spherical harmonics with radially varying amplitudes, and finally the potential corresponding to each spherical harmonics term was combined to compute the total potential (for details, see Vasiliev (2019)). Once the potential-density pairs were known, we inverted the density profiles to obtain the distribution function with the following form (Cuddeford, 1991):
| (3) |
The above distribution function produces a velocity anisotropy,
| (4) |
where and are the tangential and radial dispersions. In the above equation, is the anisotropy value at the center and is the anisotropy radius. The isotropic case was obtained by setting . was obtained through a more general Eddington inversion formula derived by Osipkov (1979); Merritt (1985); Cuddeford (1991); Vasiliev (2019):
| (5) |
In the above equations, is called augmented density and is expressed as a function of potential,
| (6) |
Once the total density of the system was self-consistently defined, we used the QuasiSpherical model implemented in the DistributionFunction class in AGAMA to numerically invert the potential in terms of the density and numerically estimate the distribution function. In the above equation, is the total potential obtained by adding the potential of the stellar and the dark matter component.
Finally, the line-of-sight velocity dispersion was computed using the moments module implemented in GalaxyModel class. The numerical details about the implementation can be found in detail in Vasiliev (2018, 2019). We used the observed line-of-sight velocity dispersion as a constraint on the model and compared it with the dispersion profile computed using AGAMA. We compared the model dispersion to the data using , defined as
| (7) |
where is the observed stellar dispersion, is the modeled line-of-sight dispersion, and is the error on the observed dispersion.
3 Results
We computed the posterior probability distribution of the model parameters using the “emcee” Markov Chain Monte Carlo (MCMC) ensemble sampler (Foreman-Mackey et al., 2013). We ran the sampler with 128 walkers for 30000 iterations and rejected the first 2000 iterations to ensure completely mixed chains. We adopted uniform priors on the model parameter:
-
1.
¡ ¡
-
2.
¡ ¡
-
3.
¡ ¡
-
4.
¡ ¡
-
5.
¡ ¡ .
The above priors on the model allowed us to explore the posterior distribution of dark matter halos over a large range of
dark matter mass and spatial extent . The range of priors also encompasses the stellar
distributions with tangentially biased anisotropy , a radially biased
anisotropy profile , and isotropic models .
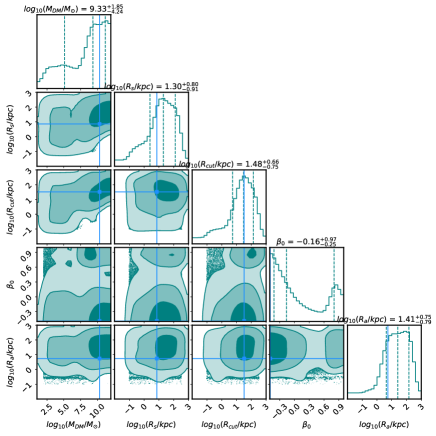
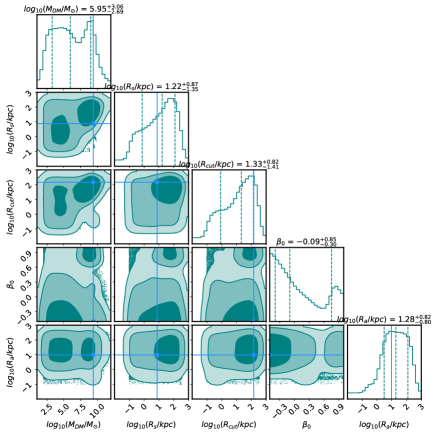
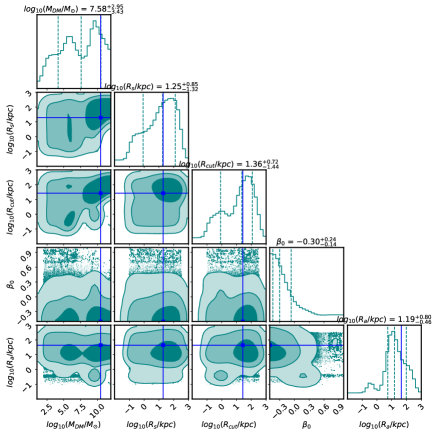
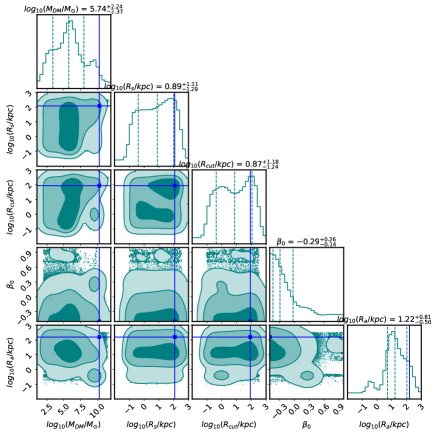
We present the posterior distribution of the model parameters adopting a cored () and
cuspy () dark matter halo in the top and bottom panels of Fig. 1, respectively.
Upon inspecting the posterior distribution of the cored and cuspy dark matter halo in Fig. 1,
we find that the mass models are largely unconstrained by the available kinematic data.
The cored dark matter halo a has total dark matter mass, , equal to with a scale length, , equal to and an outer cutoff, , equal to . The stellar distribution is described by a constant tangential anisotropy, with the value of anisotropy at the center equal to and a large anisotropy radius, , equal to . The cuspy dark matter model, on the other hand, has a total dark matter mass, , equal to with a scale length, , equal to and an outer cutoff, , equal to . Akin to the cored model, the stellar distribution in the case of the cuspy dark matter halo prefers a constant tangential anisotropy, with the value of anisotropy at the center equal to and a large anisotropy radius, , equal to . At face value, the cored dark matter halo not only has a higher total mass than the cuspy one but also encloses a comparatively higher mass inside ; for the cored halo and for the cuspy halo. However, it is important to emphasize that, within the uncertainties, both profiles are consistent with each other. Based on the posterior distribution, we find that the effective contribution to the dynamical mass inside is due to the stellar distribution. Further, we also note that both the cored and cuspy dark matter models have a large spatial extent; in other words, a large value of and . Similar to and , the anisotropy radius, , also extends beyond the spatial extent of the stellar distribution, indicating that is constant equal to within the galaxy. Further, it is evident from the posterior distribution that the available data does not allow us to obtain stringent constraints on the halo properties; both models also have a comparable value. Moreover, the for the model based on the median value of the posterior probability distribution is comparable to the models with , given by the dotted red line in Fig. 1. This indicates that NGC 1052 - DF2 has a sufficient stellar density to reproduce the observed dispersion in the inner region of the galaxy at the same levels as models with , without having to invoke the contribution of dark matter to the total potential. Mancera Piña et al. (2022b), in their study of the gas-rich UDG AGC 114905, find that dark matter halos that follow the standard concentration-mass relation fail to reproduce the observed rotation curve of the galaxy. Mancera Piña et al. (2022b) find that only a dark matter halo with an extremely low concentration parameter agrees with the data (see also Mancera Piña et al. (2020); Shi et al. (2021)). This indicates that it is hardly possible to constrain the shape of the dark matter halo or the concentration parameter for arbitrary small values of dark matter mass.
While we cannot resolve the degeneracy between the cored and cuspy dark matter model, we note that the posterior probability distribution for a cored halo tends to favor a higher total dark matter mass than the cuspy dark matter halo. Our analysis suggests that mass models of NGC 1052 - DF2 with a cored dark matter model can accommodate a higher dark matter within the spatial extent of the galaxy defined by the availability of the kinematic data (7.6 kpc). Using cosmological zoom-in simulations, Di Cintio et al. (2014) show that the core formation efficiency depends on the stellar-to-halo mass ratio and not just the halo mass. Di Cintio et al. (2014) point out that higher SHMR feedback can drive the expansion of the dark matter halo and generate the cored profiles. Cored dark matter profiles are not uncommon in low-mass systems. Read et al. (2016) using high-resolution simulations show that a dwarf galaxy with a stellar mass equal to and a dark matter mass equal to can form dark matter cores comparable to the stellar half mass radius.
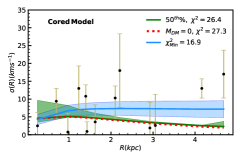
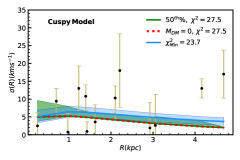
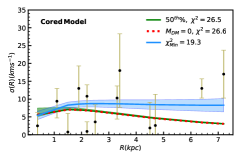
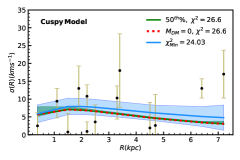
We find that the posterior probability distribution for our model is non-Gaussian, bimodal, and highly complex; thus, unlike the usual case, the percentile does not correspond to the minimum solution. In the top right corner of Fig. 1, we show the model with minimum for the cored halo dark matter halo model (top panel) and the cuspy one (bottom panel) using the blue line. The cored dark matter halo model that minimizes the has . The cored model has a total dark matter mass, , equal to with a scale length, , equal to and an outer cutoff, , equal to . The stellar distribution is described by a constant tangential anisotropy, with the value of anisotropy at the center equal to and an anisotropy radius, , equal to . On the other hand, the cuspy dark matter model that minimizes the has . The cuspy model has a total dark matter mass, , equal to with a scale length, , equal to and an outer cutoff, , equal to . Akin to other models, the model also has a constant tangential anisotropy, with the value of anisotropy at the center equal to and an anisotropy radius, , equal to . The values of and are unrealistically large for the cuspy dark matter halo, almost comparable to the projected distance between NGC 1052 -DF2 and the luminous elliptical galaxy NGC 1052 (Van Dokkum et al., 2018). The cored dark matter halo encloses dark matter mass, , inside 7.6kpc, whereas the cuspy model encloses . The models not only have a total dark matter mass comparable to values predicted by the SHMR but also enclose a higher dark matter mass inside the spatial extent of the galaxy () up to which the kinematic and photometric data are available. Further, we note that the model based on a cored dark matter halo consistently explains the small velocity dispersion observed in the inner region and the larger velocity dispersion in the outer region of the galaxy. The models that minimize the suggest that cored dark matter models can support higher dark matter masses consistent with the SMHR. However, the posterior distribution of the parameters is biased toward data points in the inner region with a low velocity dispersion. The data points in the inner region can be accounted for by mass models with (see the dotted red line in Fig. 1). It is crucial for the mass models to explain the velocity dispersion in the outer region because the velocity dispersion in the outer region traces the total potential of the galaxy. Accurate estimates of dark matter mass will only be achieved when the models consistently explain the velocity dispersion in both the inner and outer regions of the galaxy, as is highlighted by the minimum model. Therefore, we note that the available kinematic data is insufficient to derive stringent constraints on the dark matter models.
4 Discussion
4.1 Degeneracy in model parameters
The posterior probability distribution for our models is highly complex and deviates from Gaussianity. Further, we note that the posterior distribution is highly bimodal and does not show a clear maximum in the parameter space. Thus, the model parameters that minimize the do not correspond to the median value of the posterior probability distribution. The cored dark matter models that minimize the align with SHMR, whereas the models based on the median values of the posterior probability distribution minimize the contribution of dark matter within the observed spatial extent of the galaxy. This suggests that the current data is insufficient for deriving strong constraints on the dynamical models of NGC 1052 - DF2. Given the limited data, we draw the following observation regarding the inherent degeneracies within the model based on the posterior distribution of models obtained through MCMC analysis, as well as the models with the minimum chi-squared () value:
-
1.
Models with tangential anisotropy describe the observed stellar dispersion profile better than the isotropic and radially biased models.
-
2.
Mass models have a large anisotropy radius, indicating that models with constant anisotropy describe the observed dispersion profile better than the models with a radially varying anisotropy parameter.
-
3.
Mass models with a large scale length and a large outer cutoff radius explain the observed stellar dispersion profile better than those with a smaller scale length and outer cutoff.
-
4.
The cored dark matter models can accommodate a higher total dark matter mass consistent with the SHMR and, at the same time, explain the small stellar velocity dispersion at the center and larger velocity dispersion at the outer radius. Also, studies by Ogiya (2018) have shown in their N-body simulations that a cored dark matter halo explains the observed properties of the NGC 1052-DF2 better than the cuspy dark matter halo.
-
5.
Mass models with a cuspy dark matter halo with require an unrealistically large scale length and outer cutoff, comparable to the projected distance between NGC 1052 - DF2 and the luminous elliptical galaxy NGC 1052 - DF2. Further, the cuspy halo models based on a large scale length and outer cutoff are ineffective at explaining the observed velocity dispersion in the outer region. Thus, we can rule out the possibility of a cuspy dark matter halo in mass models of .
-
6.
The significance of dark matter within the observed spatial extent of a galaxy becomes apparent only when mass models successfully account for the stellar dispersion in the outer region because the velocity dispersion in the outer region traces the total potential of the galaxy. The velocity dispersion in the inner regions can be explained by models with zero dark matter that have comparable to the various dark matter models. Thus, any mass model of NGC 1052 - DF2 should consistently explain the velocity dispersion in both inner and outer regions.
4.2 Whether SHMR-based models can explain the observed stellar dispersion
Our analysis indicates that the cored dark matter halo, with a dark matter mass of ,
exhibits a smaller equal to 19.3 compared to the models assuming zero dark matter and the models based on the median value of the posterior probability distribution. The latter models have a comparable . Further, the cored model that yields a minimum
also encloses a dark matter mass, , inside 7.6kpc, maximizing the contribution of the dark
matter to the total potential. The results suggest that we cannot rule out the possibility that NGC 1052-DF2 might be a typical dark matter-dominated system, consistent with galaxy formation and evolution models. Our findings suggest that NGC 1052-DF2 within the uncertainties
could align with a higher dark matter mass, as was predicted by the SHMR, provided that the dark matter profile has a large scale length and a large cutoff radius.
Our findings indicate that NGC 1052 - DF2 not only
hosts an ultra-diffuse stellar distribution but possibly hosts an ultra-diffuse dark matter distribution as well.
We note that adopting an SHMR-based dark matter model for NGC 1052-DF2 would require an explanation for the
large scale length and outer cutoff radius, which is limited by the physical extent of the galaxy itself.
Usually, in rotation-supported systems, strong constraints on the shape of dark matter halo can be obtained
using the stellar distribution in the inner region and the distribution of neutral hydrogen in the outer region (for example, see (de Blok et al., 2001; Read et al., 2017; Iorio et al., 2017; Mancera Piña et al., 2022a)).
However, the paucity of neutral hydrogen (Chowdhury, 2018; Sardone et al., 2019) in this galaxy and
the limited radial extent of the optical tracers (Montes et al., 2021) makes it challenging to explain the
large scale length and outer cutoff radius needed for an SHMR-based model. A straightforward way of testing the SHMR-based models would be to study the properties of dark matter halos in galaxy formation simulations.
Recent galaxy formation simulations like Auriga (Liao et al., 2019), NIHAO (Di Cintio et al., 2017), and Romulus
(Van Nest et al., 2022) study the formation of UDGs in the cosmological scenario. Thus, studying
the structure and extent of the dark matter halos of the UDGs in these simulations may provide clues
for understanding if SHMR-based dynamical models for UDGs warrant a large scale length and a large
outer cutoff radius. In their ultra-deep imaging study of NGC 1052-DF2, Montes et al. (2021)
find that stellar distribution in NGC 1052- DF2 remains unperturbed up to a considerable distance and lacks the signature
of tidal disturbances like tidal tails. Using N-body simulations, Ogiya (2018) suggest that the stars are
tightly bound to the central dark matter core and are thus less susceptible to the tidal force of the massive host galaxies, whereas the
dark matter on the outskirts is more loosely bound and is prone to tidal stripping.
Thus, tidal stripping may be a possible mechanism that explains the large scale lengths and
the outer cutoff radius that we find in SHMR-based models.
4.3 Effect of distance on dark matter mass estimates
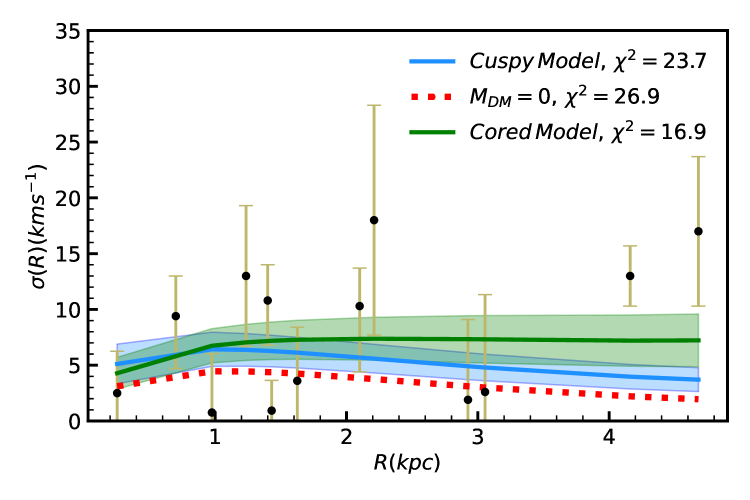
The dark matter mass in NGC 1052 - DF2 is distance-dependent, since the distance to the galaxy is required to derive the stellar mass from the 2D stellar distribution. Studies by van Dokkum et al. (2018) estimate the distance to NGC 1052 - DF2 as being equal to , whereas another independent study by Trujillo et al. (2019) indicates a much shorter distance equal to . Using a distance equal to , Trujillo et al. (2019) find that NGC 1052 - DF2 is akin to an ordinary low-surface-brightness galaxy with a stellar mass equal to and an effective radius equal to . The smaller stellar mass brings NGC 1052 - DF2 closer to the SHMR, allowing for a much larger dark matter contribution to the total mass. Trujillo et al. (2019) show that the cored and cuspy dark matter halo models, with total masses equal to and , respectively, result in a dynamical mass equal to within , making NGC 1052 - DF2 a dark-matter-dominated galaxy. Interestingly, Trujillo et al. (2019), akin to this study, find that a cored dark matter model with a large scale length can fit the observed dispersion with a higher dark matter mass. A smaller distance and a smaller stellar mass provide a natural solution to the dark matter conundrum; a smaller stellar mass naturally allows more room for dark matter. To gauge the effect of the smaller distance equal to 13 Mpc on the dynamical models, we derived the dynamical models assuming the photometric parameters derived by Trujillo et al. (2019). The smaller distance effectively changes the relative distance between the kinematic tracers and the spatial extent of the galaxy. At a distance equal to 20 Mpc, the kinematic tracers extend up to 7.6 kpc, whereas in the case of 13 Mpc, the spatial extent of kinematic tracers is reduced to 4.7 kpc. We show the dynamical models corresponding to minimum assuming a distance equal to 13 Mpc in Fig. 2 and show the posterior distribution in Fig. 3 in the appendix. Similar to the mass models at 20 Mpc, the posterior for the mass models at 13 Mpc is also biased toward the kinematic data in the inner region, which can be explained without the contribution of dark matter (see the dotted red line in Fig. 2). The cored dark matter halo, shown using a solid green line, has a total dark matter mass, , equal to with a scale length, , equal to and an outer cutoff, , equal to . The stellar distribution is described by a constant tangential anisotropy, with the value of anisotropy at the center equal to and a large anisotropy radius, , equal to . The cored dark matter encloses inside 4.7 kpc, indicating a significant contribution of the dark matter to the total mass budget inside 4.7kpc. The cored dark matter model has equal to 16.9. The cuspy dark matter model is shown using a solid blue line and has a total dark matter mass, , equal to with a scale length, , equal to and an outer cutoff, , equal to . The cuspy dark matter halo also prefers a constant tangential anisotropy, with the value of anisotropy at the center equal to and an anisotropy radius, , equal to . The cuspy dark matter encloses inside 4.7 kpc, and has equal to 23.6. Similar to our analysis at a distance equal to 20 Mpc, we find that even at 13 Mpc, the cored dark matter model explains the observed velocity dispersion better than the cuspy one. The cored dark matter, besides having smaller , consistently explains the observed dispersion profile in both the inner and outer regions. The cuspy dark matter halo model and the model with zero dark matter shown using a dotted red line explain the small velocity dispersion observed in the inner region but does not explain the relatively larger velocity dispersion in the outer region, which effectively traces the total dynamical mass of the system. The models at 13 Mpc and 20 Mpc exhibit qualitatively similar behavior. Our analysis of mass models adopting a distance equal to 13 Mpc shows that the posterior is biased toward kinematic data in the inner region. The kinematic data in the inner region can be explained without invoking the contribution of the dark matter (see the dotted red line in Fig. 1 and Fig. 2). But the significance of dark matter within the observed spatial extent of a galaxy becomes apparent only when mass models successfully account for the stellar dispersion in the outer region because the velocity dispersion in the outer region traces the total potential of the galaxy. Thus, similar to our findings for 20 Mpc, we emphasize that the kinematic data is insufficient to derive stringent constraints on mass models.
5 Conclusions
In this work, we have studied the dynamical model of UDG NGC 1052 - DF2 based on the anisotropic distribution function using the photometric and kinematic data available in the literature. NGC 1052 - DF2 challenges our current understanding of galaxy formation models in the scenario. Previous studies have shown that NGC 1052 - DF2 is deficient in dark matter and is in conflict with mass models based on the standard SHMR. We find that the stellar distribution is tangentially biased, and that the anisotropy parameter is constant with radius. Further, we find that models with a dark matter mass are riddled with degeneracy between the cored and cuspy halo, but models with a higher dark matter mass that explain the observed kinematics prefer cored halos with a large scale length and a large outer cutoff radius. The dark matter models consistent with SHMR need an extraordinarily large scale length (20kpc) and a large outer cutoff radius (26kpc), much larger than the spatial extent at which kinematic and photometric data are available. This provides a unique opportunity to study the properties of dark matter halos of UDGs in galaxy formation simulations like AURIGA, NIHAO, and ROMULUS and understand if UDGs are characterized by a large scale length and outer cutoff radius. Our results suggest that NGC 1052 - DF2 might not only have an ultra-diffuse stellar distribution but might potentially host an ultra-diffuse dark matter distribution compatible with the standard SHMR, as has been predicted by galaxy formation and evolution models, within uncertainties on the available kinematic data. Our results emphasize that the current kinematic data are insufficient for obtaining precise constraints on the dynamical models of NGC 1052 - DF2.
Acknowledgements.
Aditya would like to thank the referee for their insightful comments that improved the quality of this manuscript.-
•
References
- Behroozi et al. (2010) Behroozi, P. S., Conroy, C., & Wechsler, R. H. 2010, The Astrophysical Journal, 717, 379
- Bullock & Boylan-Kolchin (2017) Bullock, J. S. & Boylan-Kolchin, M. 2017, Annual Review of Astronomy and Astrophysics, 55, 343
- Chan et al. (2018) Chan, T., Kereš, D., Wetzel, A., et al. 2018, Monthly Notices of the Royal Astronomical Society, 478, 906
- Chowdhury (2018) Chowdhury, A. 2018, Monthly Notices of the Royal Astronomical Society: Letters, 482, L99
- Cuddeford (1991) Cuddeford, P. 1991, Monthly Notices of the Royal Astronomical Society, 253, 414
- Danieli et al. (2019) Danieli, S., van Dokkum, P., Conroy, C., Abraham, R., & Romanowsky, A. J. 2019, The Astrophysical Journal Letters, 874, L12
- de Blok et al. (2001) de Blok, W. J. G., McGaugh, S. S., Bosma, A., & Rubin, V. C. 2001, ApJ, 552, L23
- Di Cintio et al. (2017) Di Cintio, A., Brook, C. B., Dutton, A. A., et al. 2017, Monthly Notices of the Royal Astronomical Society: Letters, 466, L1
- Di Cintio et al. (2014) Di Cintio, A., Brook, C. B., Maccio, A. V., et al. 2014, Monthly Notices of the Royal Astronomical Society, 437, 415
- Emsellem et al. (2019) Emsellem, E., van der Burg, R. F., Fensch, J., et al. 2019, Astronomy & Astrophysics, 625, A76
- Famaey et al. (2018) Famaey, B., McGaugh, S., & Milgrom, M. 2018, Monthly Notices of the Royal Astronomical Society, 480, 473
- Fensch et al. (2019) Fensch, J., van der Burg, R. F., Jeřábková, T., et al. 2019, Astronomy & Astrophysics, 625, A77
- Foreman-Mackey et al. (2013) Foreman-Mackey, D., Hogg, D. W., Lang, D., & Goodman, J. 2013, Publications of the Astronomical Society of the Pacific, 125, 306
- Fosbury et al. (1978) Fosbury, R., Mebold, U., Goss, W., & Dopita, M. 1978, Monthly Notices of the Royal Astronomical Society, 183, 549
- Haslbauer et al. (2019) Haslbauer, M., Dabringhausen, J., Kroupa, P., Javanmardi, B., & Banik, I. 2019, Astronomy & Astrophysics, 626, A47
- Hayashi & Inoue (2018) Hayashi, K. & Inoue, S. 2018, Monthly Notices of the Royal Astronomical Society: Letters, 481, L59
- Hernquist (1990) Hernquist, L. 1990, The Astrophysical Journal, 356, 359
- Iorio et al. (2017) Iorio, G., Fraternali, F., Nipoti, C., et al. 2017, MNRAS, 466, 4159
- Islam (2020) Islam, T. 2020, Physical Review D, 102, 024068
- Karachentsev et al. (2000) Karachentsev, I., Karachentseva, V., Suchkov, A., & Grebel, E. 2000, Astronomy and Astrophysics Supplement Series, 145, 415
- Koda et al. (2015) Koda, J., Yagi, M., Yamanoi, H., & Komiyama, Y. 2015, The Astrophysical Journal Letters, 807, L2
- Lee et al. (2020) Lee, J. H., Kang, J., Lee, M. G., & Jang, I. S. 2020, ApJ, 894, 75
- Liao et al. (2019) Liao, S., Gao, L., Frenk, C. S., et al. 2019, Monthly Notices of the Royal Astronomical Society, 490, 5182
- Mamon & Boué (2010) Mamon, G. A. & Boué, G. 2010, Monthly Notices of the Royal Astronomical Society, 401, 2433
- Mancera Piña et al. (2019) Mancera Piña, P. E., Aguerri, J. A. L., Peletier, R. F., et al. 2019, MNRAS, 485, 1036
- Mancera Piña et al. (2022a) Mancera Piña, P. E., Fraternali, F., Oosterloo, T., et al. 2022a, MNRAS, 514, 3329
- Mancera Piña et al. (2022b) Mancera Piña, P. E., Fraternali, F., Oosterloo, T., et al. 2022b, MNRAS, 512, 3230
- Mancera Piña et al. (2020) Mancera Piña, P. E., Fraternali, F., Oman, K. A., et al. 2020, Monthly Notices of the Royal Astronomical Society, 495, 3636
- Mancera Piña et al. (2024) Mancera Piña, P. E., Golini, G., Trujillo, I., & Montes, M. 2024, arXiv e-prints, arXiv
- Marleau et al. (2021) Marleau, F. R., Habas, R., Poulain, M., et al. 2021, A&A, 654, A105
- Merritt et al. (2016) Merritt, A., van Dokkum, P., Danieli, S., et al. 2016, The Astrophysical Journal, 833, 168
- Merritt (1985) Merritt, D. 1985, The astronomical journal, 90, 1027
- Mihos et al. (2015) Mihos, J. C., Durrell, P. R., Ferrarese, L., et al. 2015, The Astrophysical Journal Letters, 809, L21
- Moffat & Toth (2019) Moffat, J. & Toth, V. 2019, Monthly Notices of the Royal Astronomical Society: Letters, 482, L1
- Montes et al. (2021) Montes, M., Trujillo, I., Infante-Sainz, R., Monelli, M., & Borlaff, A. S. 2021, The Astrophysical Journal, 919, 56
- Müller et al. (2019) Müller, O., Famaey, B., & Zhao, H. 2019, Astronomy & Astrophysics, 623, A36
- Nusser (2019) Nusser, A. 2019, Monthly Notices of the Royal Astronomical Society, 484, 510
- Ogiya (2018) Ogiya, G. 2018, Monthly Notices of the Royal Astronomical Society: Letters, 480, L106
- Osipkov (1979) Osipkov, L. 1979, Pisma v Astronomicheskii Zhurnal, 5, 77
- Read et al. (2016) Read, J., Agertz, O., & Collins, M. 2016, Monthly Notices of the Royal Astronomical Society, 459, 2573
- Read & Steger (2017) Read, J. & Steger, P. 2017, Monthly Notices of the Royal Astronomical Society, 471, 4541
- Read et al. (2017) Read, J. I., Iorio, G., Agertz, O., & Fraternali, F. 2017, MNRAS, 467, 2019
- Richardson & Fairbairn (2014) Richardson, T. & Fairbairn, M. 2014, Monthly Notices of the Royal Astronomical Society, 441, 1584
- Román & Trujillo (2017) Román, J. & Trujillo, I. 2017, MNRAS, 468, 703
- Sardone et al. (2019) Sardone, A., Pisano, D., Burke-Spolaor, S., Mascoop, J. L., & Pol, N. 2019, The Astrophysical Journal Letters, 871, L31
- Sersic (1968) Sersic, J. L. 1968, Cordoba
- Shi et al. (2021) Shi, Y., Zhang, Z.-Y., Wang, J., et al. 2021, ApJ, 909, 20
- Springel et al. (2006) Springel, V., Frenk, C. S., & White, S. D. 2006, nature, 440, 1137
- Tremmel et al. (2020) Tremmel, M., Wright, A. C., Brooks, A. M., et al. 2020, Monthly Notices of the Royal Astronomical Society, 497, 2786
- Trujillo et al. (2019) Trujillo, I., Beasley, M. A., Borlaff, A., et al. 2019, Monthly Notices of the Royal Astronomical Society, 486, 1192
- van der Burg et al. (2016) van der Burg, R. F., Muzzin, A., & Hoekstra, H. 2016, Astronomy & Astrophysics, 590, A20
- Van Dokkum et al. (2018) Van Dokkum, P., Danieli, S., Cohen, Y., et al. 2018, Nature, 555, 629
- van Dokkum et al. (2018) van Dokkum, P., Danieli, S., Cohen, Y., Romanowsky, A. J., & Conroy, C. 2018, The Astrophysical Journal Letters, 864, L18
- Van Dokkum et al. (2015) Van Dokkum, P. G., Abraham, R., Merritt, A., et al. 2015, The Astrophysical Journal Letters, 798, L45
- Van Nest et al. (2022) Van Nest, J. D., Munshi, F., Wright, A., et al. 2022, The Astrophysical Journal, 926, 92
- Vasiliev (2018) Vasiliev, E. 2018, arXiv preprint arXiv:1802.08255
- Vasiliev (2019) Vasiliev, E. 2019, Monthly Notices of the Royal Astronomical Society, 482, 1525
- Wasserman et al. (2018) Wasserman, A., Romanowsky, A. J., Brodie, J., et al. 2018, The Astrophysical Journal Letters, 863, L15
- Watkins et al. (2010) Watkins, L. L., Evans, N. W., & An, J. H. 2010, Monthly Notices of the Royal Astronomical Society, 406, 264
- Yagi et al. (2016) Yagi, M., Koda, J., Komiyama, Y., & Yamanoi, H. 2016, The Astrophysical Journal Supplement Series, 225, 11
- Zaritsky et al. (2022) Zaritsky, D., Donnerstein, R., Karunakaran, A., et al. 2022, The Astrophysical Journal Supplement Series, 261, 11
- Zhao (1996) Zhao, H. 1996, Monthly Notices of the Royal Astronomical Society, 278, 488
.
Appendix A Posterior distribution of models at a distance equal to 13 Mpc
In the appendix, we have shown the posterior distribution corresponding to the cored and cuspy dark matter halo, adopting a distance to NGC 1052 - DF2 equal to 13 Mpc.