Motion simulation of radio-labeled cells in whole-body positron emission tomography
Abstract
Cell tracking is a subject of active research gathering great interest in medicine and biology. Positron emission tomography (PET) is well suited for tracking radio-labeled cells in vivo due to its exceptional sensitivity and whole-body capability. For validation, ground-truth data is desirable that realistically mimics the flow of cells in a clinical situation. This study develops a workflow (CeFloPS) for simulating moving radio-labeled cells in a human phantom. From the XCAT phantom, the blood vessels are reduced to nodal networks along which cells can move and distribute to organs and tissues. The movement is directed by the blood flow which is calculated in each node using the Hagen-Poiseuille equation and Kirchhoff’s laws assuming laminar flow. Organs are voxelized and movement of cells from artery entry to vein exit is generated via a biased 3D random walk. The probabilities of whether cells move or stay in tissues are derived from rate constants of physiologically based compartment modeling. PET listmode data is generated using the Monte-Carlo simulation framework GATE based on the definition of a large-body PET scanner with cell paths as moving radioactive sources and the XCAT phantom providing attenuation data. From the flow simulation of 10000 cells, 100 sample cells were further processed by GATE and listmode data was reconstructed into images for comparison. As demonstrated by comparisons of simulated and reconstructed cell distributions, CeFloPS can realistically simulate the cell behavior of whole-body PET providing valuable data for development and validation of cell tracking algorithms.
1 Introduction
Cell imaging and tracking is a subject of active research gathering great interest in the medical and biomedical science community. Non-invasive imaging techniques using fluorescent or luminescent markers in optical imaging (OI), iron oxide particles in magnetic resonance imaging (MRI), or radio-labelled tracers in single photon emission computed tomography (SPECT) and positron emission tomography (PET) have been frequently used in preclinical studies to permit in vivo visualization of living cells [1]. For human application, MRI, PET and SPECT are the most promising tools as they provide either high spatial resolution (MRI) or excellent whole-body sensitivity (PET, SPECT). Of these imaging modalities, PET has become of special interest following labelled immune cells in the context of stem cell imaging and cell-based therapies [2].
PET is particularly advantageous because it combines exceptional sensitivity with the possibility of whole-body coverage which has been further advanced in recent years by the design of large-body PET systems with extended coverage of the axial field-of-view in the range of 1 to 2 meters, improved time-of-flight capabilities and excellent system sensitivities [3]. Using either long-lived isotopes or reporter genes, immunoPET has great potential to identify biomarkers allowing to treat patients based on their most likely response to a dedicated immunotherapy [4, 5, 6].
Following the idea of PET-based particle tracking developed originally for technical applications, the outstanding sensitivity of PET was recently used to track radio-labeled singular cells [7, 8, 9, 10]. In this context, a new image reconstruction algorithm for PET was introduced by our group using an optimal transport based regularization technique [11] showing great potential for tracking single and multiple radio-labeled cells within a human body scenario.
The current study is concerned with the development of a software workflow to accurately simulate the movement of radio-labeled cells within the human body in a clinical setting. This workflow generates dynamic cell flow data, which is then used in Monte Carlo simulations to model the underlying PET physics. Since the location and motion of the cells are known at all times, the cell flow PET simulation (CeFloPS) serves as ground-truth data for the development and validation of novel image reconstruction and tracking tools.
2 Methods
2.1 Simulation basis
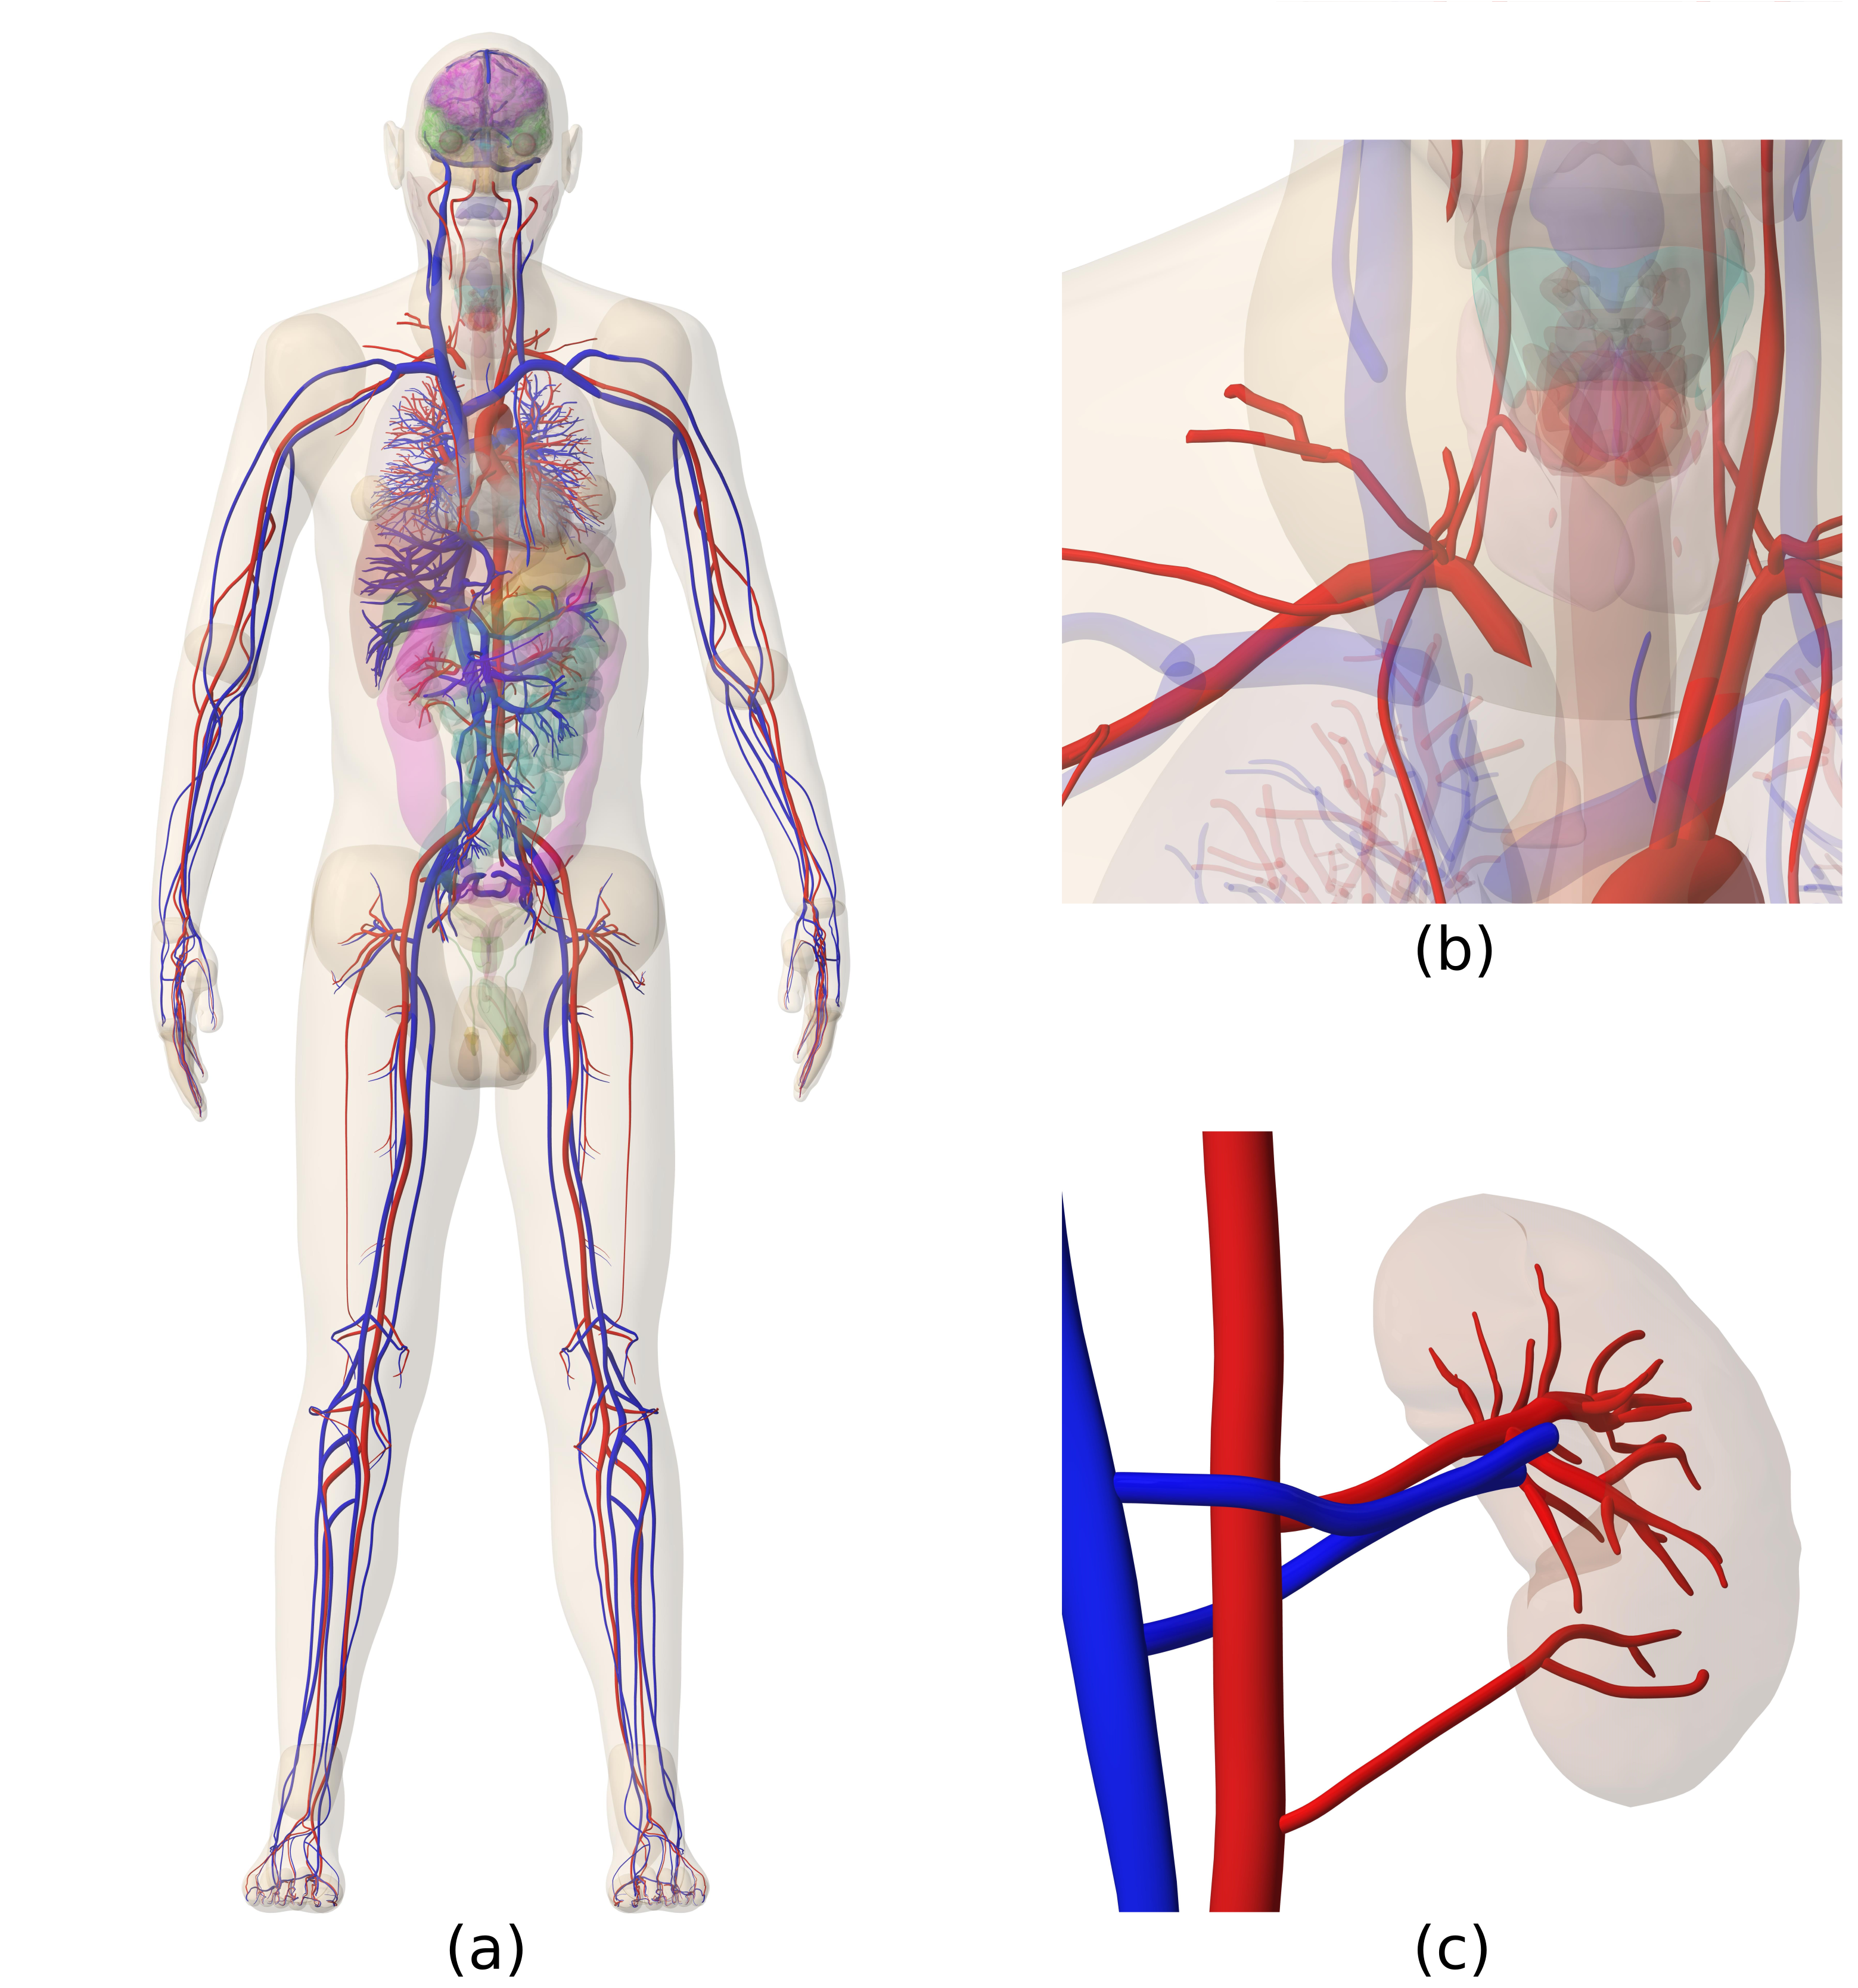
CeFloPS is based on a special version of the XCAT phantom with high resolution 3D models of all organs, blood vessels, bones and muscles (Fig. 1a) in the form of STEP files [12, 13]. Using Inventor (Version 2023, Autodesk Inc., San Rafael, USA), these STEP files were converted into StL files (StereoLithography file format), providing triangulated surface meshes of all organs and structures. The StL files were further processed in Python (Version 3.11.5, Python Software Foundation) with the help of the trimesh library [14], allowing for operations on the meshes and giving access to the coordinates of the vertices. For further processing, meshes of all muscles and internal organs were converted into voxelized volumes with voxel size 0.5 mm 0.5 mm 0.5 mm, while the complex anatomy of blood vessel meshes was simplified by reducing it to node networks. The nodes describe the possible paths a cell can take and are placed along the central axis of a blood vessel, storing information about (i) its spatial coordinates, (ii) which nodes are adjacent in the direction of blood flow and (iii) the radius of the blood vessel.
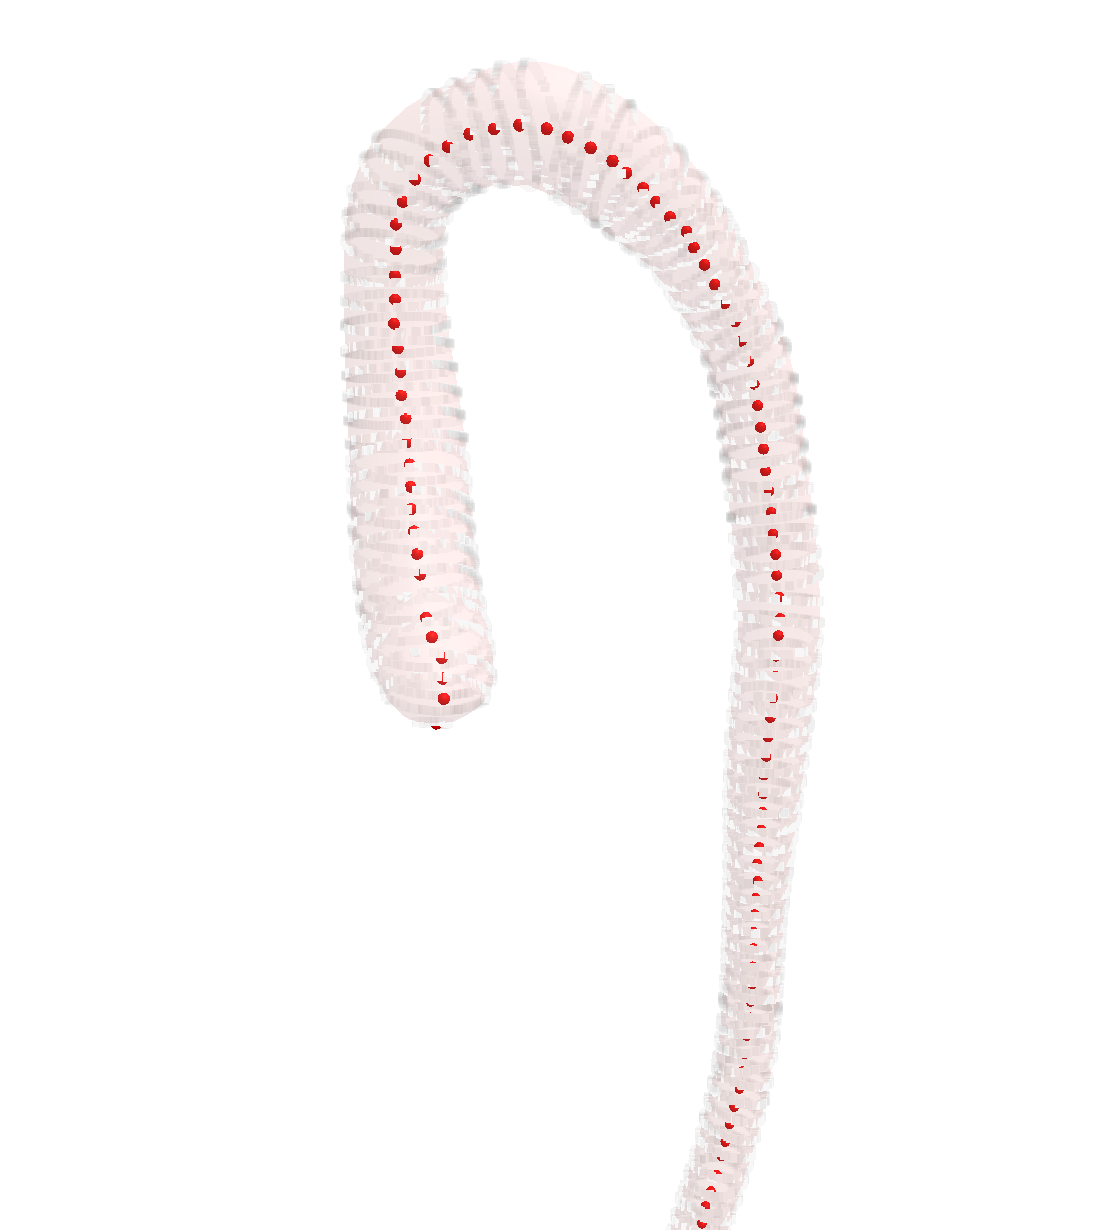
To generate the nodes, the blood vessels were divided into segments starting from one end point of a vessel. For each segment, the barycenter was formed of all vertices located in this segment, resulting in points lying inside a blood vessel. Starting from the first point inside a blood vessel, planes, orthogonal to the blood vessel, were then placed at an interval of 1 mm along the vectors between these points. Using the intersection of those planes with the blood vessel surface, the vessel radius and the new center point were calculated, resulting in the final 1 mm spaced nodes positions (see Fig. 2).
Nodes that lie at bifurcations of blood vessels and thus have more than one neighbor in the direction of blood flow were marked and are in the following referred to as links. Since the spatial resolution of the XCAT phantom is limited, some connections between vessels are missing, as seen in Fig. 1b. In this case we interpolate linearly between the nodes of those vessels to generate a connection. In addition, the spatial resolution of blood vessels varies from organ to organ. The smallest radius defined in XCAT is 0.15 mm and is located in the toes. Consequently, no capillary bed is included that connects the nodes of arteries and veins. (Fig. 1c). This results in a total of five separate networks of nodes: arteries, veins, portal vein, and pulmonary arteries and veins, all of which, except for the portal vein, are connected via the heart. In order to compensate for the lack of capillaries, these separate networks are artificially combined to form a single closed network in which opposing arteries and veins leading to the same organ are virtually connected.
2.2 Blood flow simulation
From the node networks, the mean blood flow rate as well as the vessel resistance were estimated for each node from a highly simplified flow model using Kirchhoff’s laws in combination with the Hagen-Poiseuille equation. This was done by assuming laminar flow in every vessel, treated as a cylinder [15, 16]:
| (1) |
| (2) |
| (3) |
for serial connections of vessels and
| (4) |
for parallel connections, with the blood pressure difference, the distance between two nodes, the radius of the vessel at the node position, the number of nodes in a branch and the dynamic viscosity of blood. The calculations were performed under the assumption of a cardiac output of 100 ml/s, a mean arterial blood pressure of 100 mmHg in the part of the aorta in close proximity to the heart, and 0 mmHg in the vena cava entering the heart. Furthermore, a constant blood viscosity of 3.5 mPas was presumed. Due to the lack of small blood vessels in the XCAT phantom, our flow model misses a large portion of high resistances which would add to the calculation of the total resistance in (3) and (4). By (1), this also affects the blood flow in each node. To compensate for this, we arbitrarily scaled the radii we determined in each node by a factor of 0.7 as this was found to lead to more realistic values for .
At a link, the probability with which a cell will move to the next possible node is calculated based on the blood flow in the link and in each following node:
| (5) |
and the number of following nodes of a link.
The individual velocity of a single cell is assigned by pseudo-random number sampling based on a cumulative distribution function (CDF). This ensures that a group of cells starting from the same node have different velocities and disperse over time in the blood vessels. The CDF was derived using the velocity profile of laminar flow in a tube [17]
| (6) |
where is the radial distance from the center. The distribution of blood flow over the profile of the vessels is then given by
| (7) |
Division by the mean blood flow rate yields the probability density function (PDF)
| (8) |
which by integration leads to the CDF:
| (9) |
The velocity of a cell is then obtained by (6) with a randomly picked according to (9).
2.3 Organ distribution simulation
Inside a voxelized organ, cell motion is guided by a biased 3D random walk along the voxels to simulate the capillary bed and the tissue exchange. This process is carried out in a series of discrete calculations, each with a defined time step. The current simulations have set the time step to 600 ms. To commence, voxels containing an artery entrance or a vein exit were identified and subsequently referred to as start-voxels and end-voxels, respectively. If an organ does not have an artery entrance and/or vein exit due to missing connections in the XCAT phantom, the nearest artery/vein is calculated and the closest voxel to that blood vessel is determined as start-/end-voxel.
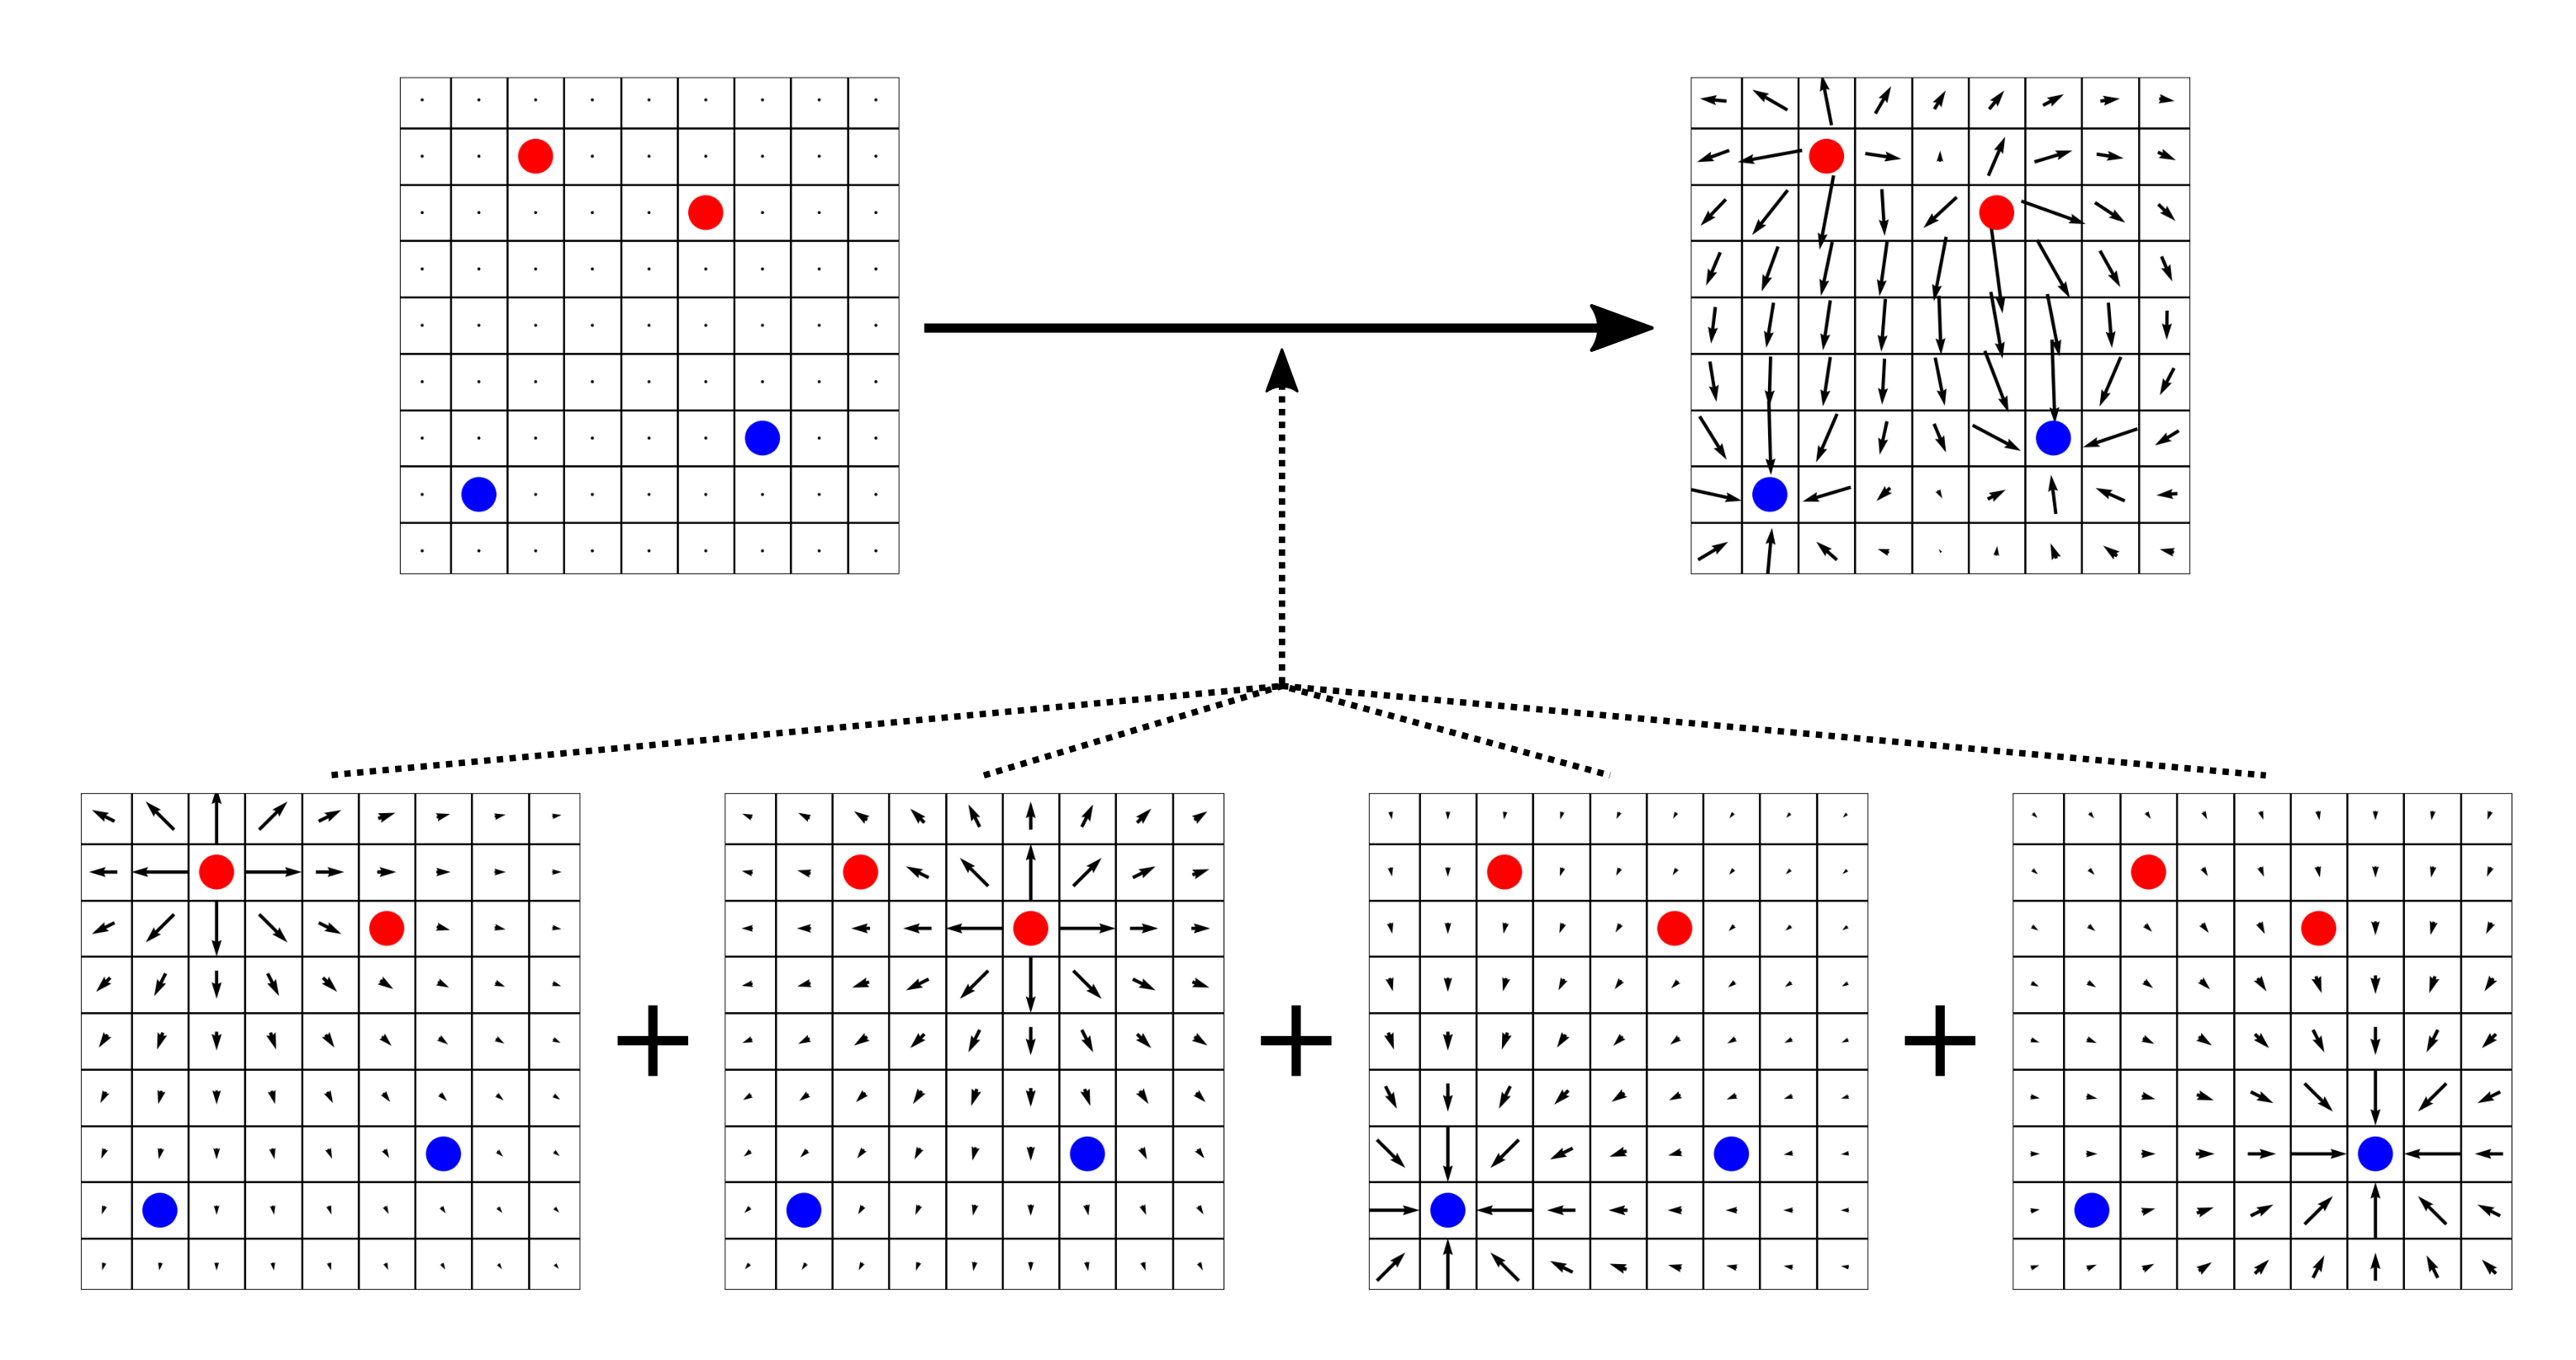
Remaining blood vessels are connected to an organ in the same way if their distance to that organ lies within a 2 cm threshold. To compensate for missing arterial branches in muscles and organs, each node of the arteries and veins can serve as entrance and exit for cells, respectively. For every voxel within an organ or muscle, direction vectors towards all start- and end-voxels were determined along with separate weighting values. As the distance between a voxel and its start/end voxel increases, these weightings decrease by a factor of , as shown in Fig. 3. The direction of the vectors is pointing away from start-voxel or towards end-voxel. The combination of those vectors represents the most probable directions for a cell to move. The weightings of vectors in start- and end-voxels were set to zero.
The random walk is initiated at a start-voxel, where a cell can move to one of the surrounding voxels. This gives 26 possible directions (provided the start-voxel does not reside on the organ’s periphery), all with the same probability. For the proceeding steps, the direction is biased in accordance with the previously determined weightings of the direction vectors in each voxel. If a cell reaches an end-voxel, the random walk concludes, followed by the cell exiting via the vein back into the nodal network for further blood flow simulation.
Besides the biased random walk, a compartment model was implemented in the organ distribution simulation which governs the duration a cell stays in an organ. In each organ voxel a cell can be located in different virtual compartments. The exchange between compartments is determined by rate constants which also define the probabilities of whether a cell moves during the next time step or not. The number and structure of these compartments as well as the values of the rate constants are depending on the pharmacokinetics and physiology of the cell and the organ. This information must be known in advance to the CeFloPS simulation.
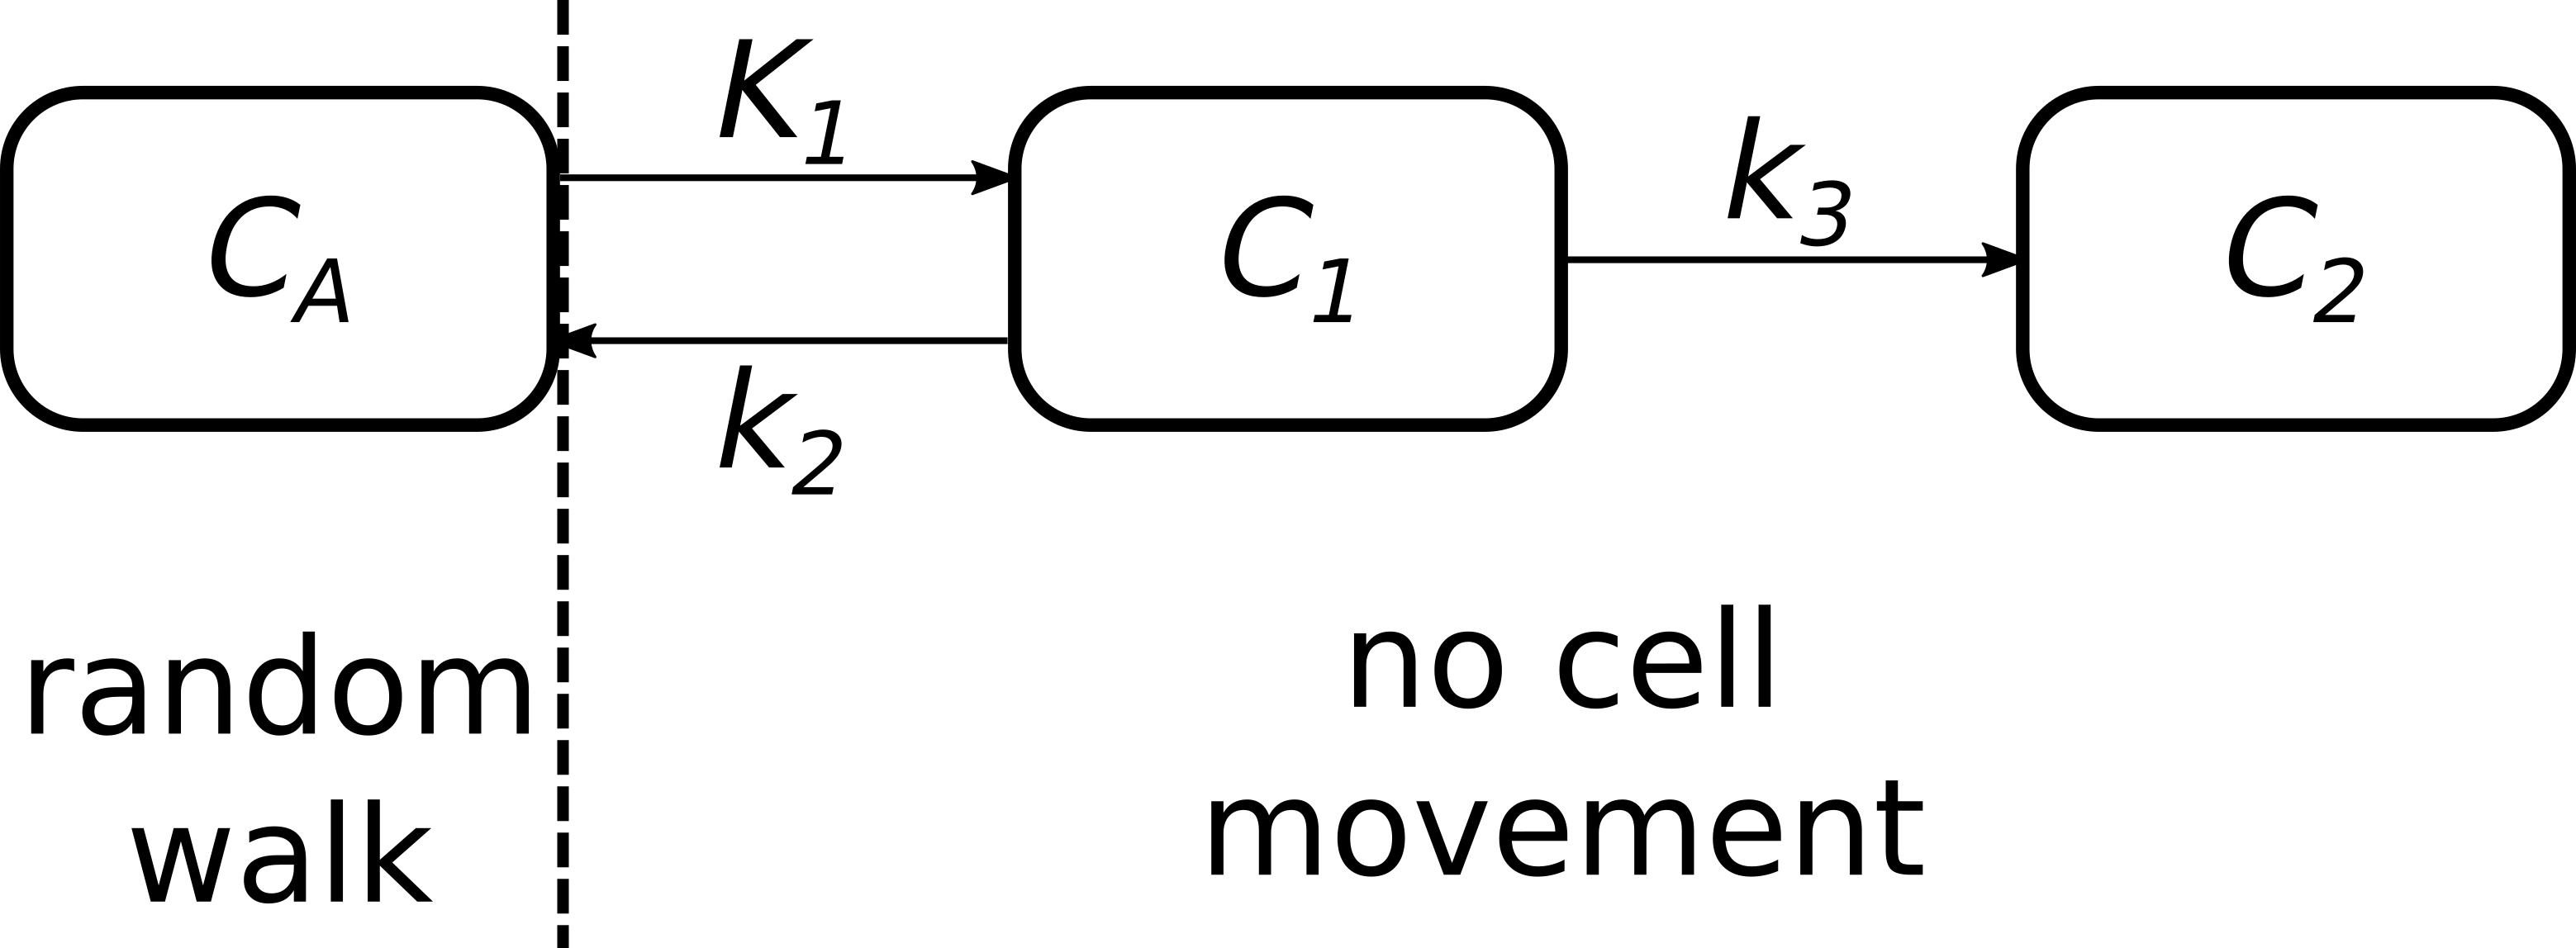
As a first example and as proof-of-principle, we implemented a two-compartment 18F-Fluordesoxyglucose (FDG) model as shown in Fig. 4. The simulated cells in this example therefore do not behave like real, existing cells, but like an FDG tracer. For this two-compartment model, and denote the unbound and bound states of an FDG molecule in tissue and the free FDG molecule in the blood supply of the tissue. As long as cells are located in they undergo the random walk. If they enter or , they stay at their position and do not move. The change in amount of cells in these compartments in dependency on the (arterial) blood can be described by the differential equations
| (10) | ||||
The differential equation for is put into brackets as usually is a measured quantity and not a compartment like and . For a better understanding of how the movement probabilities of a cell are derived, we still list the equations for as a compartment. In this example, the values of the rate constants , , and are taken from [18] and listed in Table 1.
| Tissue | [ml/min/ml] | [min-1] | [min-1] |
|---|---|---|---|
| lung | 0.023 | 0.205 | 0.001 |
| liver | 0.660 | 0.765 | 0.002 |
| spleen | 1.593 | 2.867 | 0.006 |
| gray matter | 0.107 | 0.165 | 0.067 |
| myocardium | 0.832 | 2.651 | 0.099 |
| muscle | 0.026 | 0.249 | 0.016 |
| resta | 0.553 | 1.213 | 0.039 |
| a For organs not included in [18] the rate constants were set to the values of ”all regions”. | |||
The differential equations in (10) can be analytically solved, yielding the following solutions for and :
| (11) | ||||
where * denotes the convolution operator. Since the solutions in (11) are linear combinations of exponential functions, we describe the time-dependent probability of transitions between compartments by the following equations based on the CDFs of exponential distributions:
| (12) | ||||
The equations in (12) indicate the probability of a transition between two compartments occurring from the beginning of the simulation up to time t. Based on these equations, a random decision is made at each time step as to whether a cell transitions or not. Cells entering a tissue are first located in the blood compartment . As long as cells are in they undergo the (biased) random walk in the organ. Cells that have transitioned into do not partake in the random walk but stay at their position. For these cells, the decision is made after each step as to whether they go back to and are able to move again or whether they stay in or transition to . A cell that transitions from back to is considered to be in the venous blood and undergoes random walk until reaching an end-voxel, without the possibility to reenter . If cells enter , they remain trapped in their position for the rest of the simulation and do no longer move.
For the FDG simulation, the paths and distributions of 10000 cells are simulated in parallel. For every time step, the organ and compartment in which each cell is located is recorded. This allows the generation of time profiles of cells in tissues. For a given tissue, the tissue concentration of cells per milliliter or the corresponding cell number (as the sum in and ) is calculated. The number of cells in the blood is made up of all cells that are still in the node network or in a compartment of an organ.
2.4 PET simulation
Raw PET data is generated using the Geant4 application for tomographic emission GATE (version 9.0) [19, 20]. The cell paths outputs from the CeFloPS simulations have the format of GATE placement files and thus are used as generic moving sources in the simulations. The sources, i.e. the cells, are simulated as spheres whose diameters and activities can be specified by the user. For the example shown in this work, a diameter of 10 µm and an activity of 1 kBq per cell were simulated for 100 cells. This activity per cell and number of cells does not correspond to a realistic scenario and was only chosen to serve as a proof-of-principle. The PET scanner used in the simulation is based on the Siemens Biograph Vision Quadra (Siemens Healthineers, Erlangen, Germany), a large-body PET system using approximately 250000 single lutetium oxyorthosilicate (LSO) detector elements covering an axial field of view (FOV) of 106 cm [21]. The background radiation in the scanner generated by the presence of 176Lu in the LSO crystals can be simulated if desired but was neglected in the current simulation. The attenuation map for gamma energies of 511 keV provided by the XCAT phantom was used as an attenuation phantom. The attenuation phantom was placed in the PET scanner so that the upper body including the head were in the FOV of the scanner. Since the simulated cell paths are based on the blood vessel and organ structure of the XCAT phantom, their positions correspond exactly to the anatomical structures in the attenuation phantom, making the simulation also realistic in view of the proportion of attenuated and scattered events. Although the lower body exceeds the FOV of the scanner, it is still simulated in case a cell is located there.
3 results
Starting at the aorta with a mean blood flow of ml/s, the blood distributes into all vessels and tissues depending on the resistances of the vessel system and the blood pressure differences (as listed exemplarily in Table 2). It is evident that the lungs receive all blood through the contraction of the right myocardium, which accounts for 100 % of the total blood flow. The main venous vessels, in contrast, share their blood flow, which is then fed into the right myocardium (inferior vena cava - 89 %, superior vena cava - 11 %). Notably, the kidneys receive a disproportionately higher blood flow than expected (46 %), with the left kidney’s blood flow (33 %) being more than twice as high as the right one (13%). This behavior is due to insufficient definition of the vascular structure of the kidneys and is further discussed later.
The biased 3D random walk that cells perform when they migrate from the blood into a tissue is illustrated in Fig. 5 using the example of the lung. Starting from arterial end-points (sources, red dots), cells follow random pathways (green dots) until they exit into a vein end-point (input, blue dots), or stay in a defined compartment. The biased random walk ensures that the entire organ tissue is potentially accessible by incoming cells.
| Blood vessel or organ | Percentage of total blood flowa |
|---|---|
| aorta | 100 % |
| inferior vena cava | 89 % |
| superior vena cava | 11 % |
| lung | 100 % |
| left | 47 % |
| right | 53 % |
| kidneys | 46 % |
| left | 33 % |
| right | 13 % |
| liver | 11 % |
| spleen | 0.7 % |
| pancreas | 0.7 % |
| aFor a cardiac output of 100 ml/s. | |
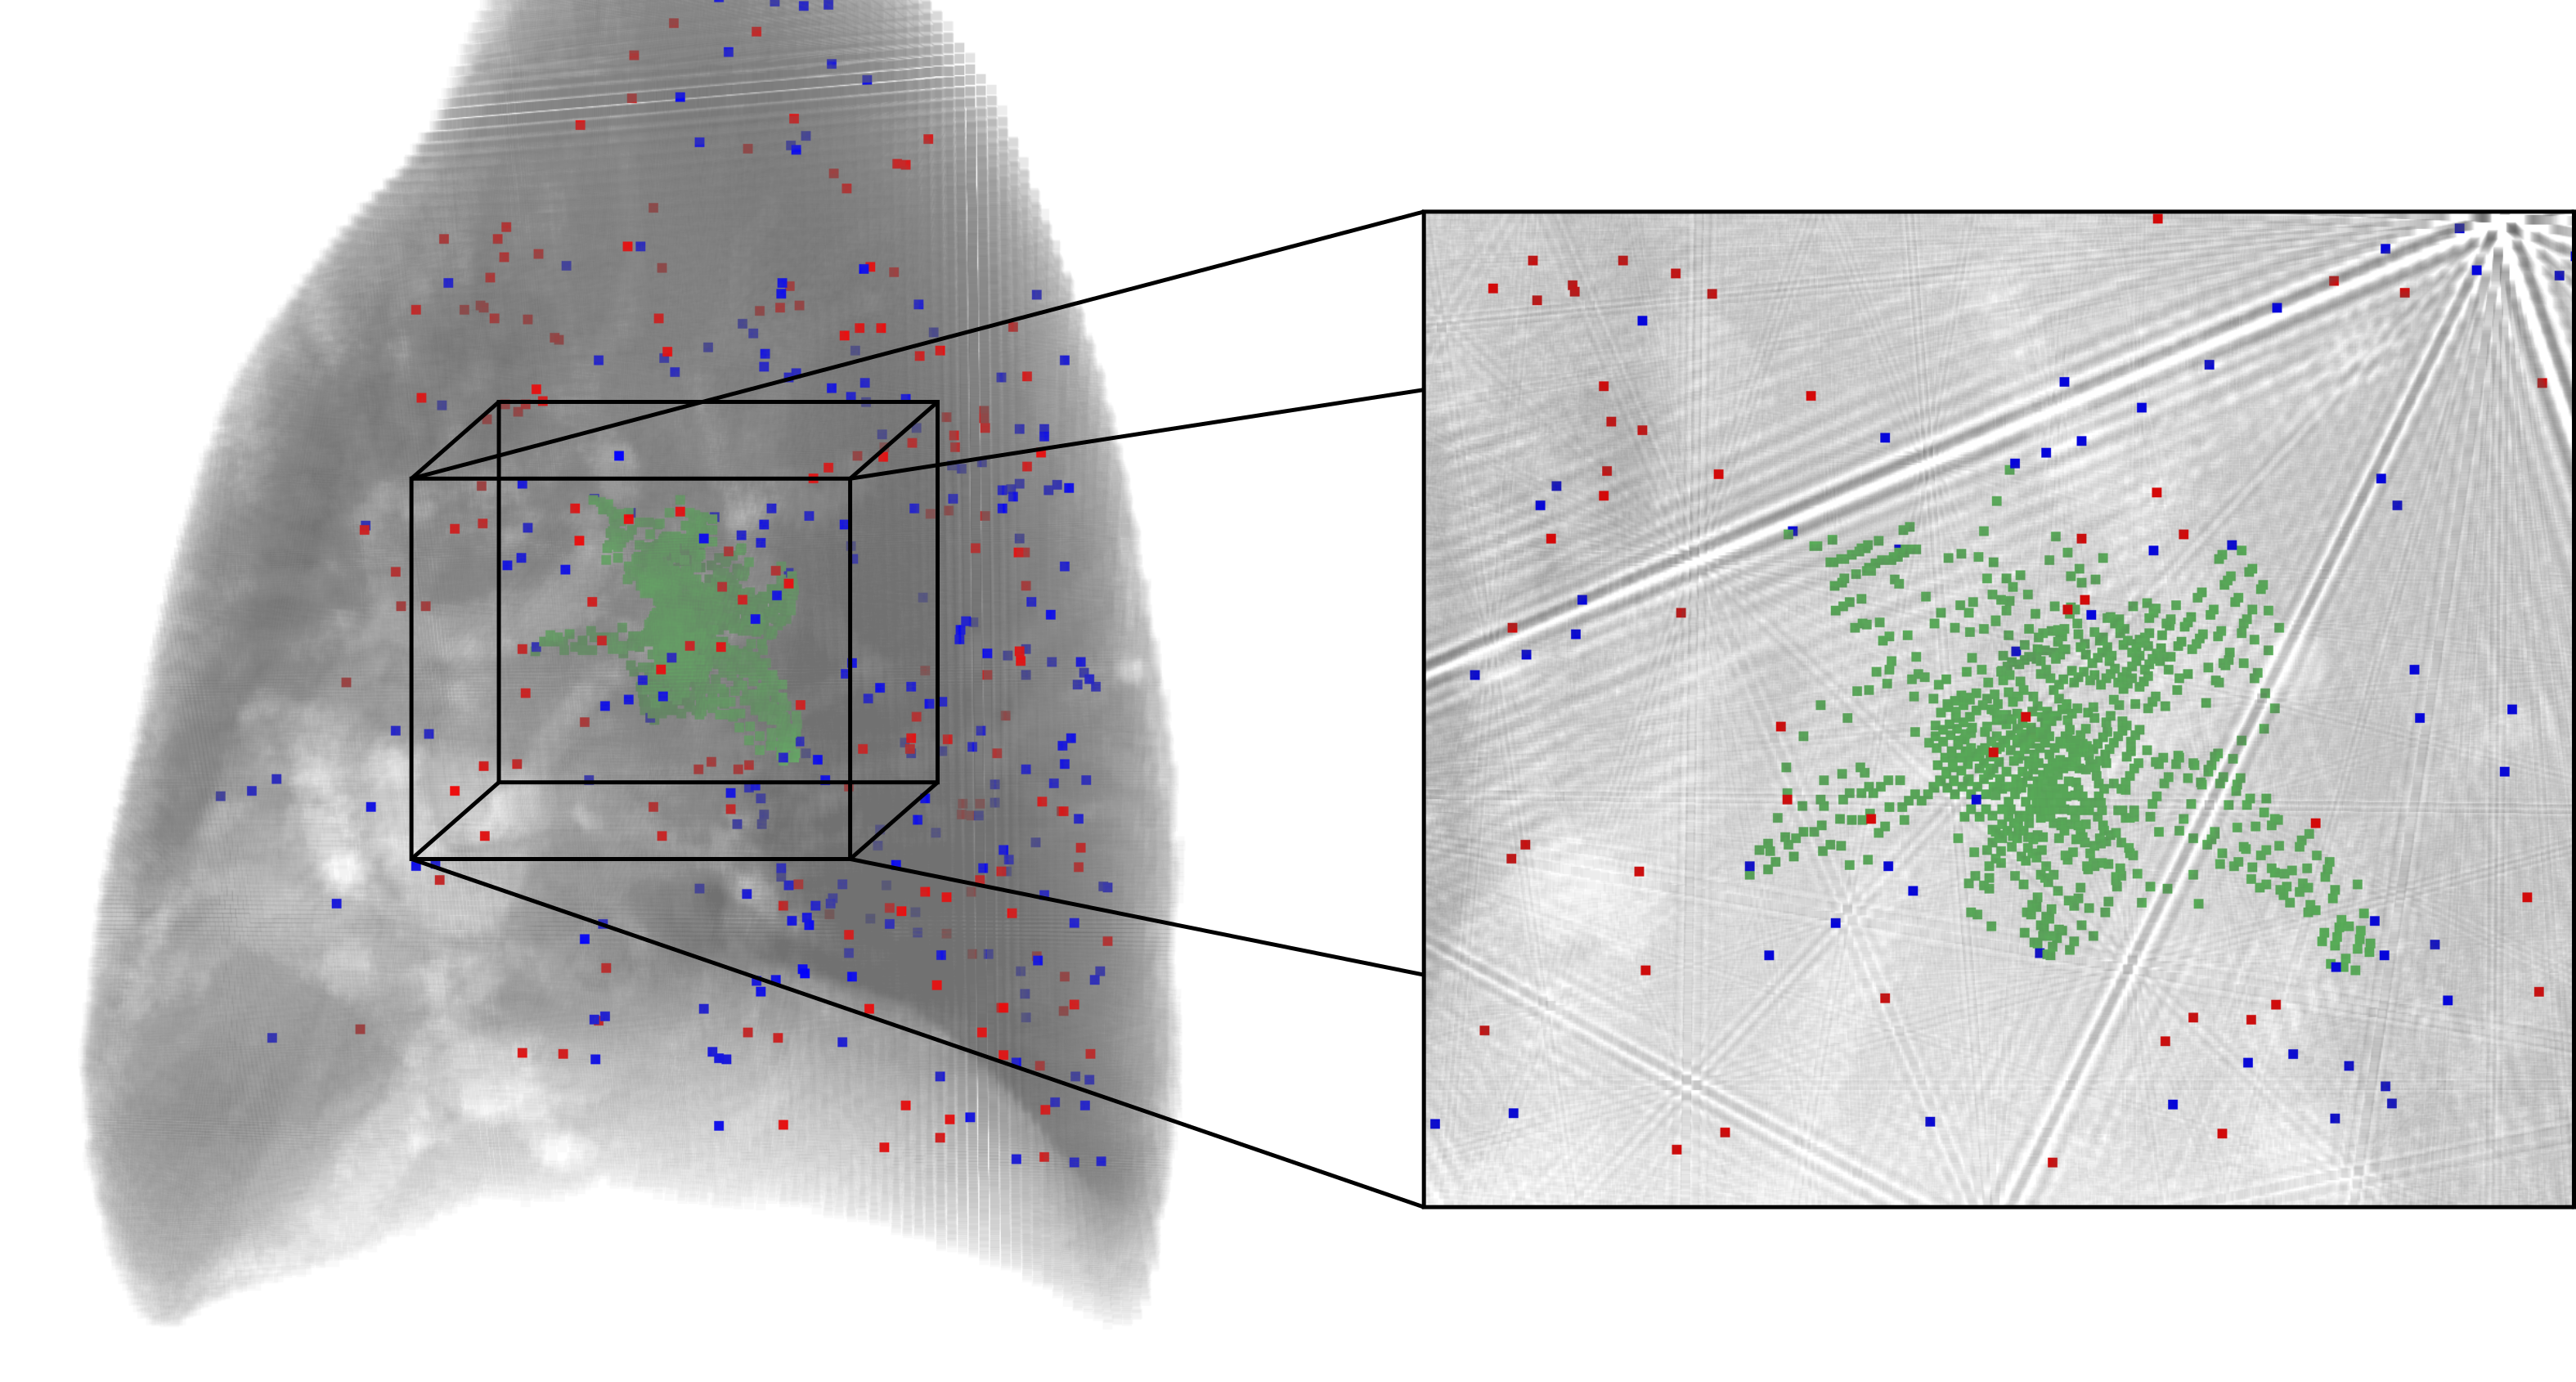
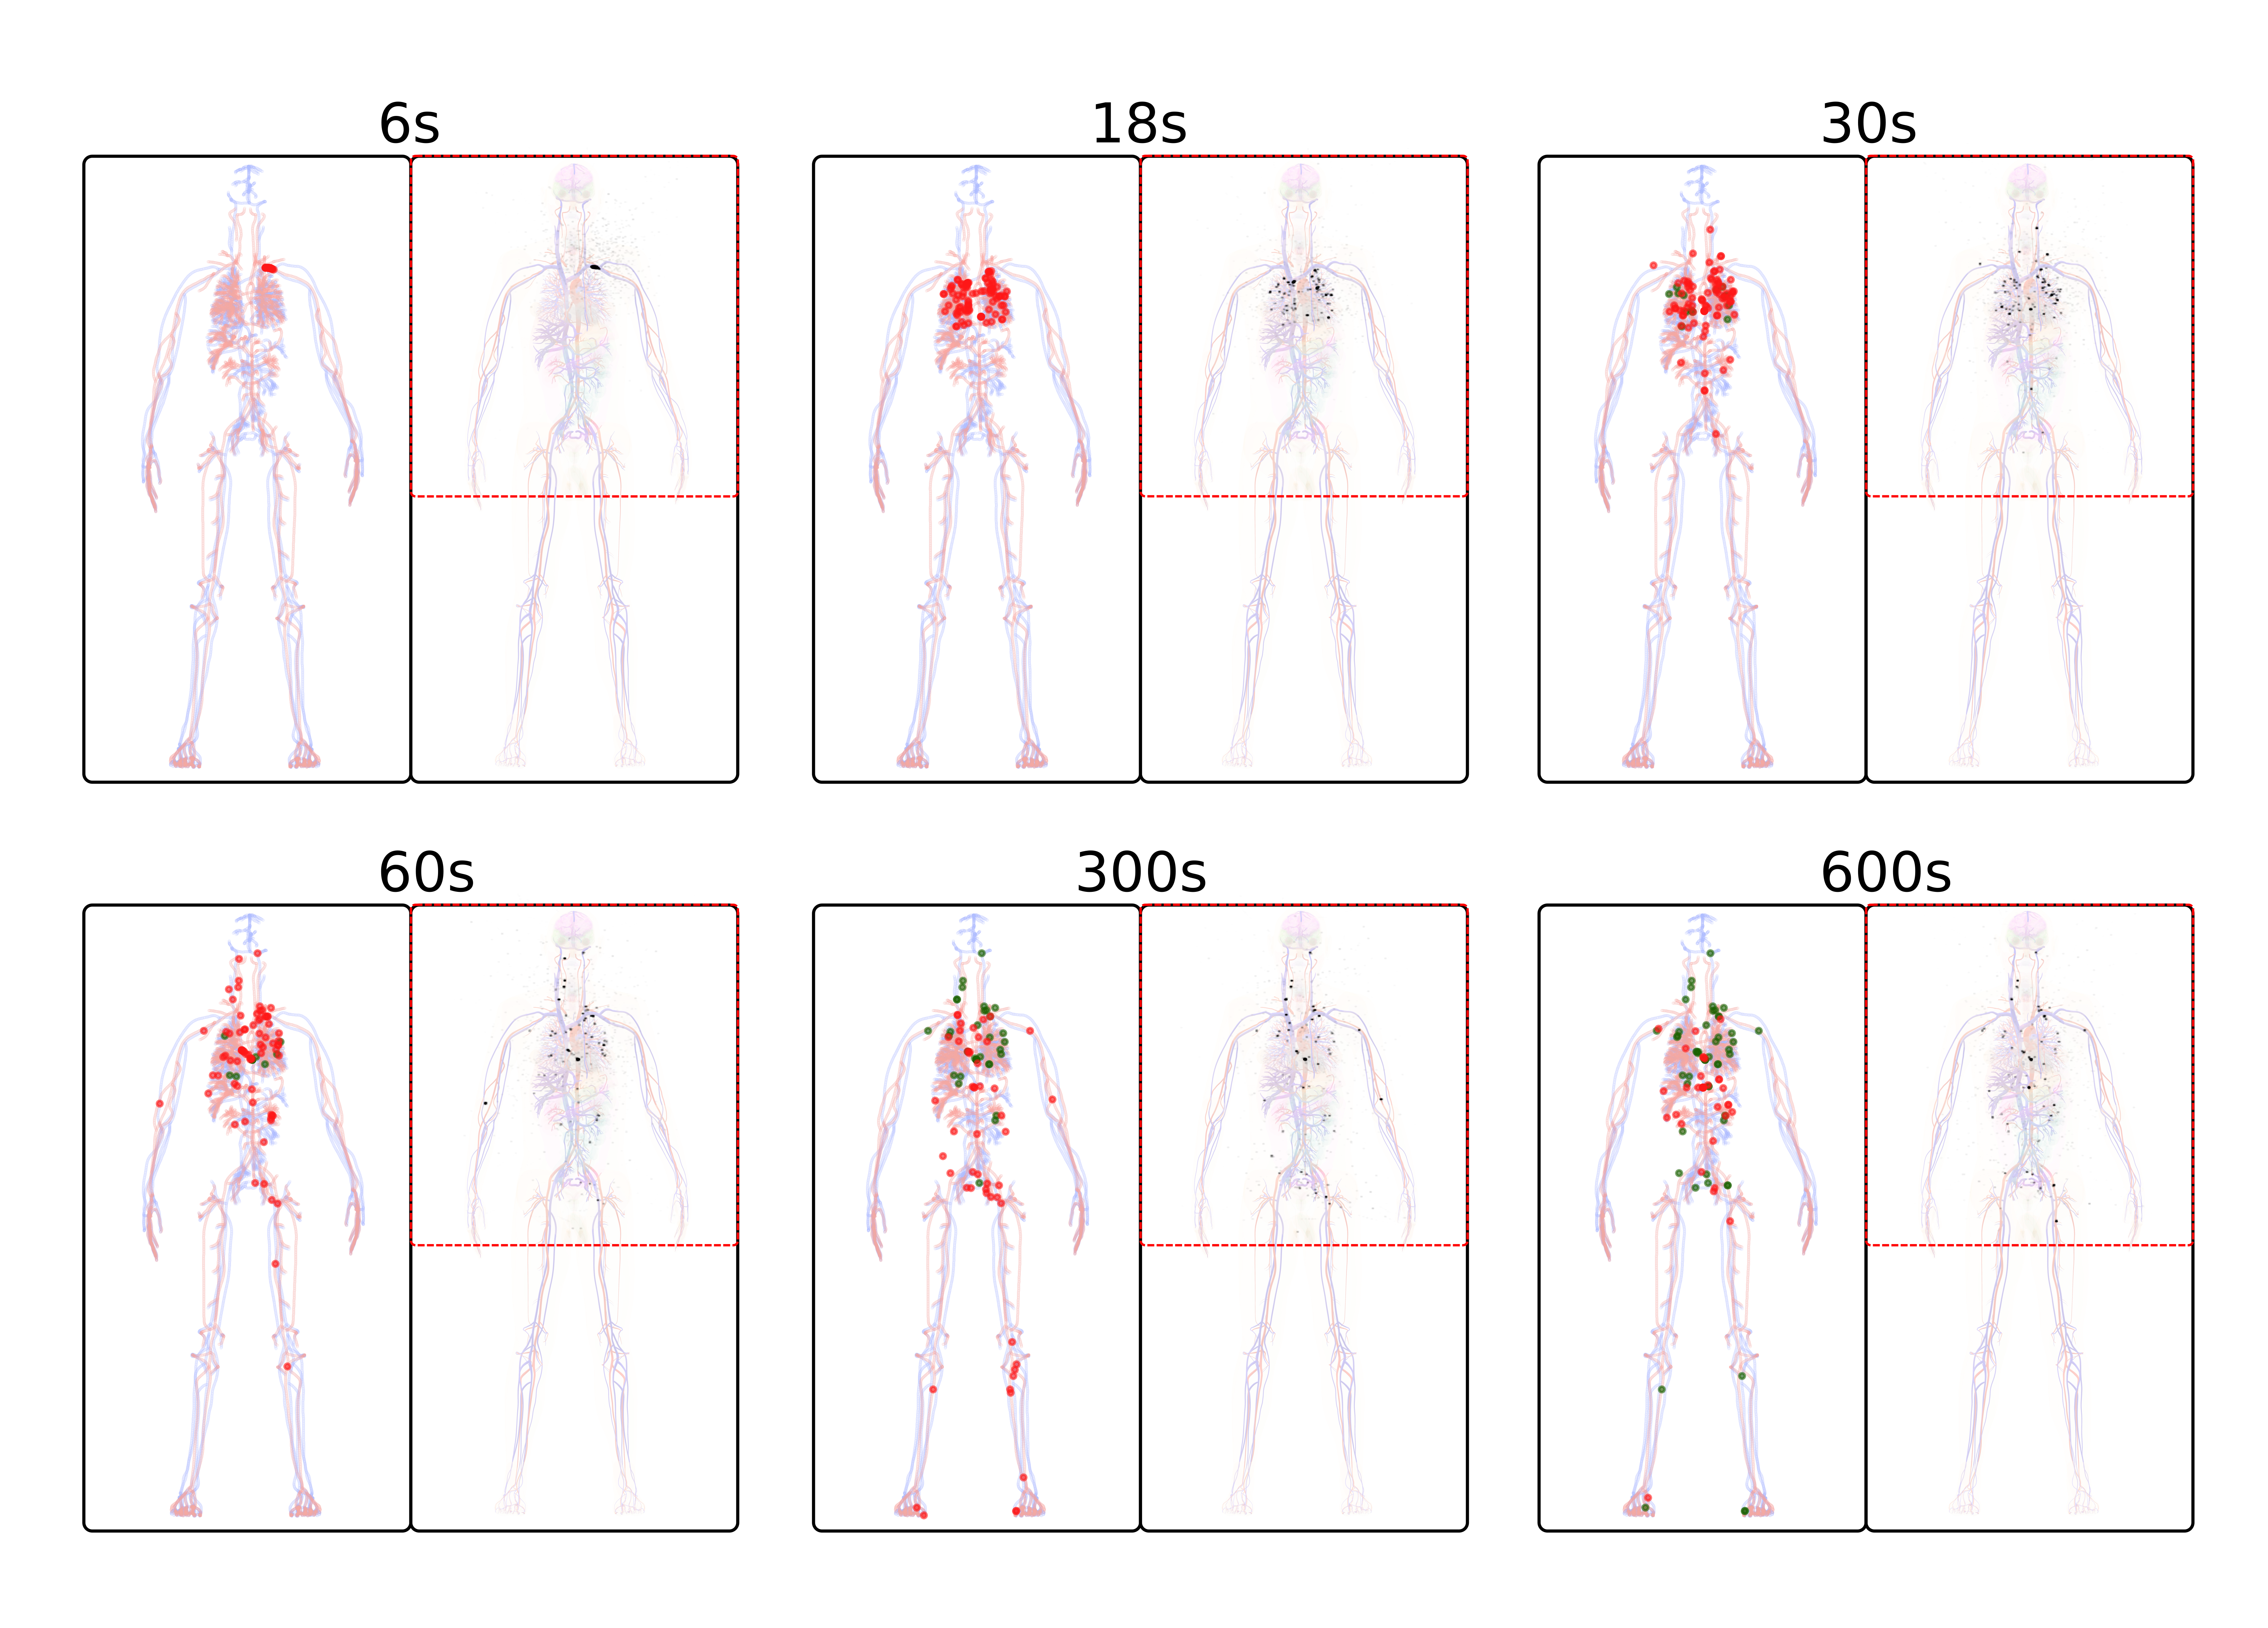
Fig. 6 illustrates the locations of 100 simulated cells within a node system at six time points, compared to maximum intensity projections (MIPs) reconstructed from PET data using an expectation maximization (EM) algorithm without attenuation correction. The reconstructed positions and cell counts align well with ground-truth positions, despite minor reconstruction artifacts in the MIPs causing low-intensity signals outside the body due to missing attenuation and scatter correction. Initially, cells (red spheres) are injected into the left arm vein (median cubital) over three seconds. After six seconds, cells migrate towards the left clavicle, appearing as a single dark spot in the MIP, making individual cells indistinguishable. By 18 seconds, most cells distribute within the lung, with some transitioning to arterial blood, allowing individual cells and clusters to be distinguishable in the MIP. After 30 seconds, cells predominantly remain in the lung; some transition to compartments or , changing color from red to green, while others disperse through the abdominal cavity and neck, identifiable in the MIP. At one minute, cells migrate further into the torso, with some returning to venous blood and lungs, and individual cells reach the head, right arm, and left leg (outside the scanner’s FOV). After five minutes, cells disperse body-wide, with some transitioning to compartment and , as seen in cells in the right arm; one cell remains, while the other leaves the arm. This dispersion continues over ten minutes, increasing the proportion of stationary cells in compartment and , thus facilitating the identification of individual cells in MIPs over time due to wider distribution and fewer clusters.
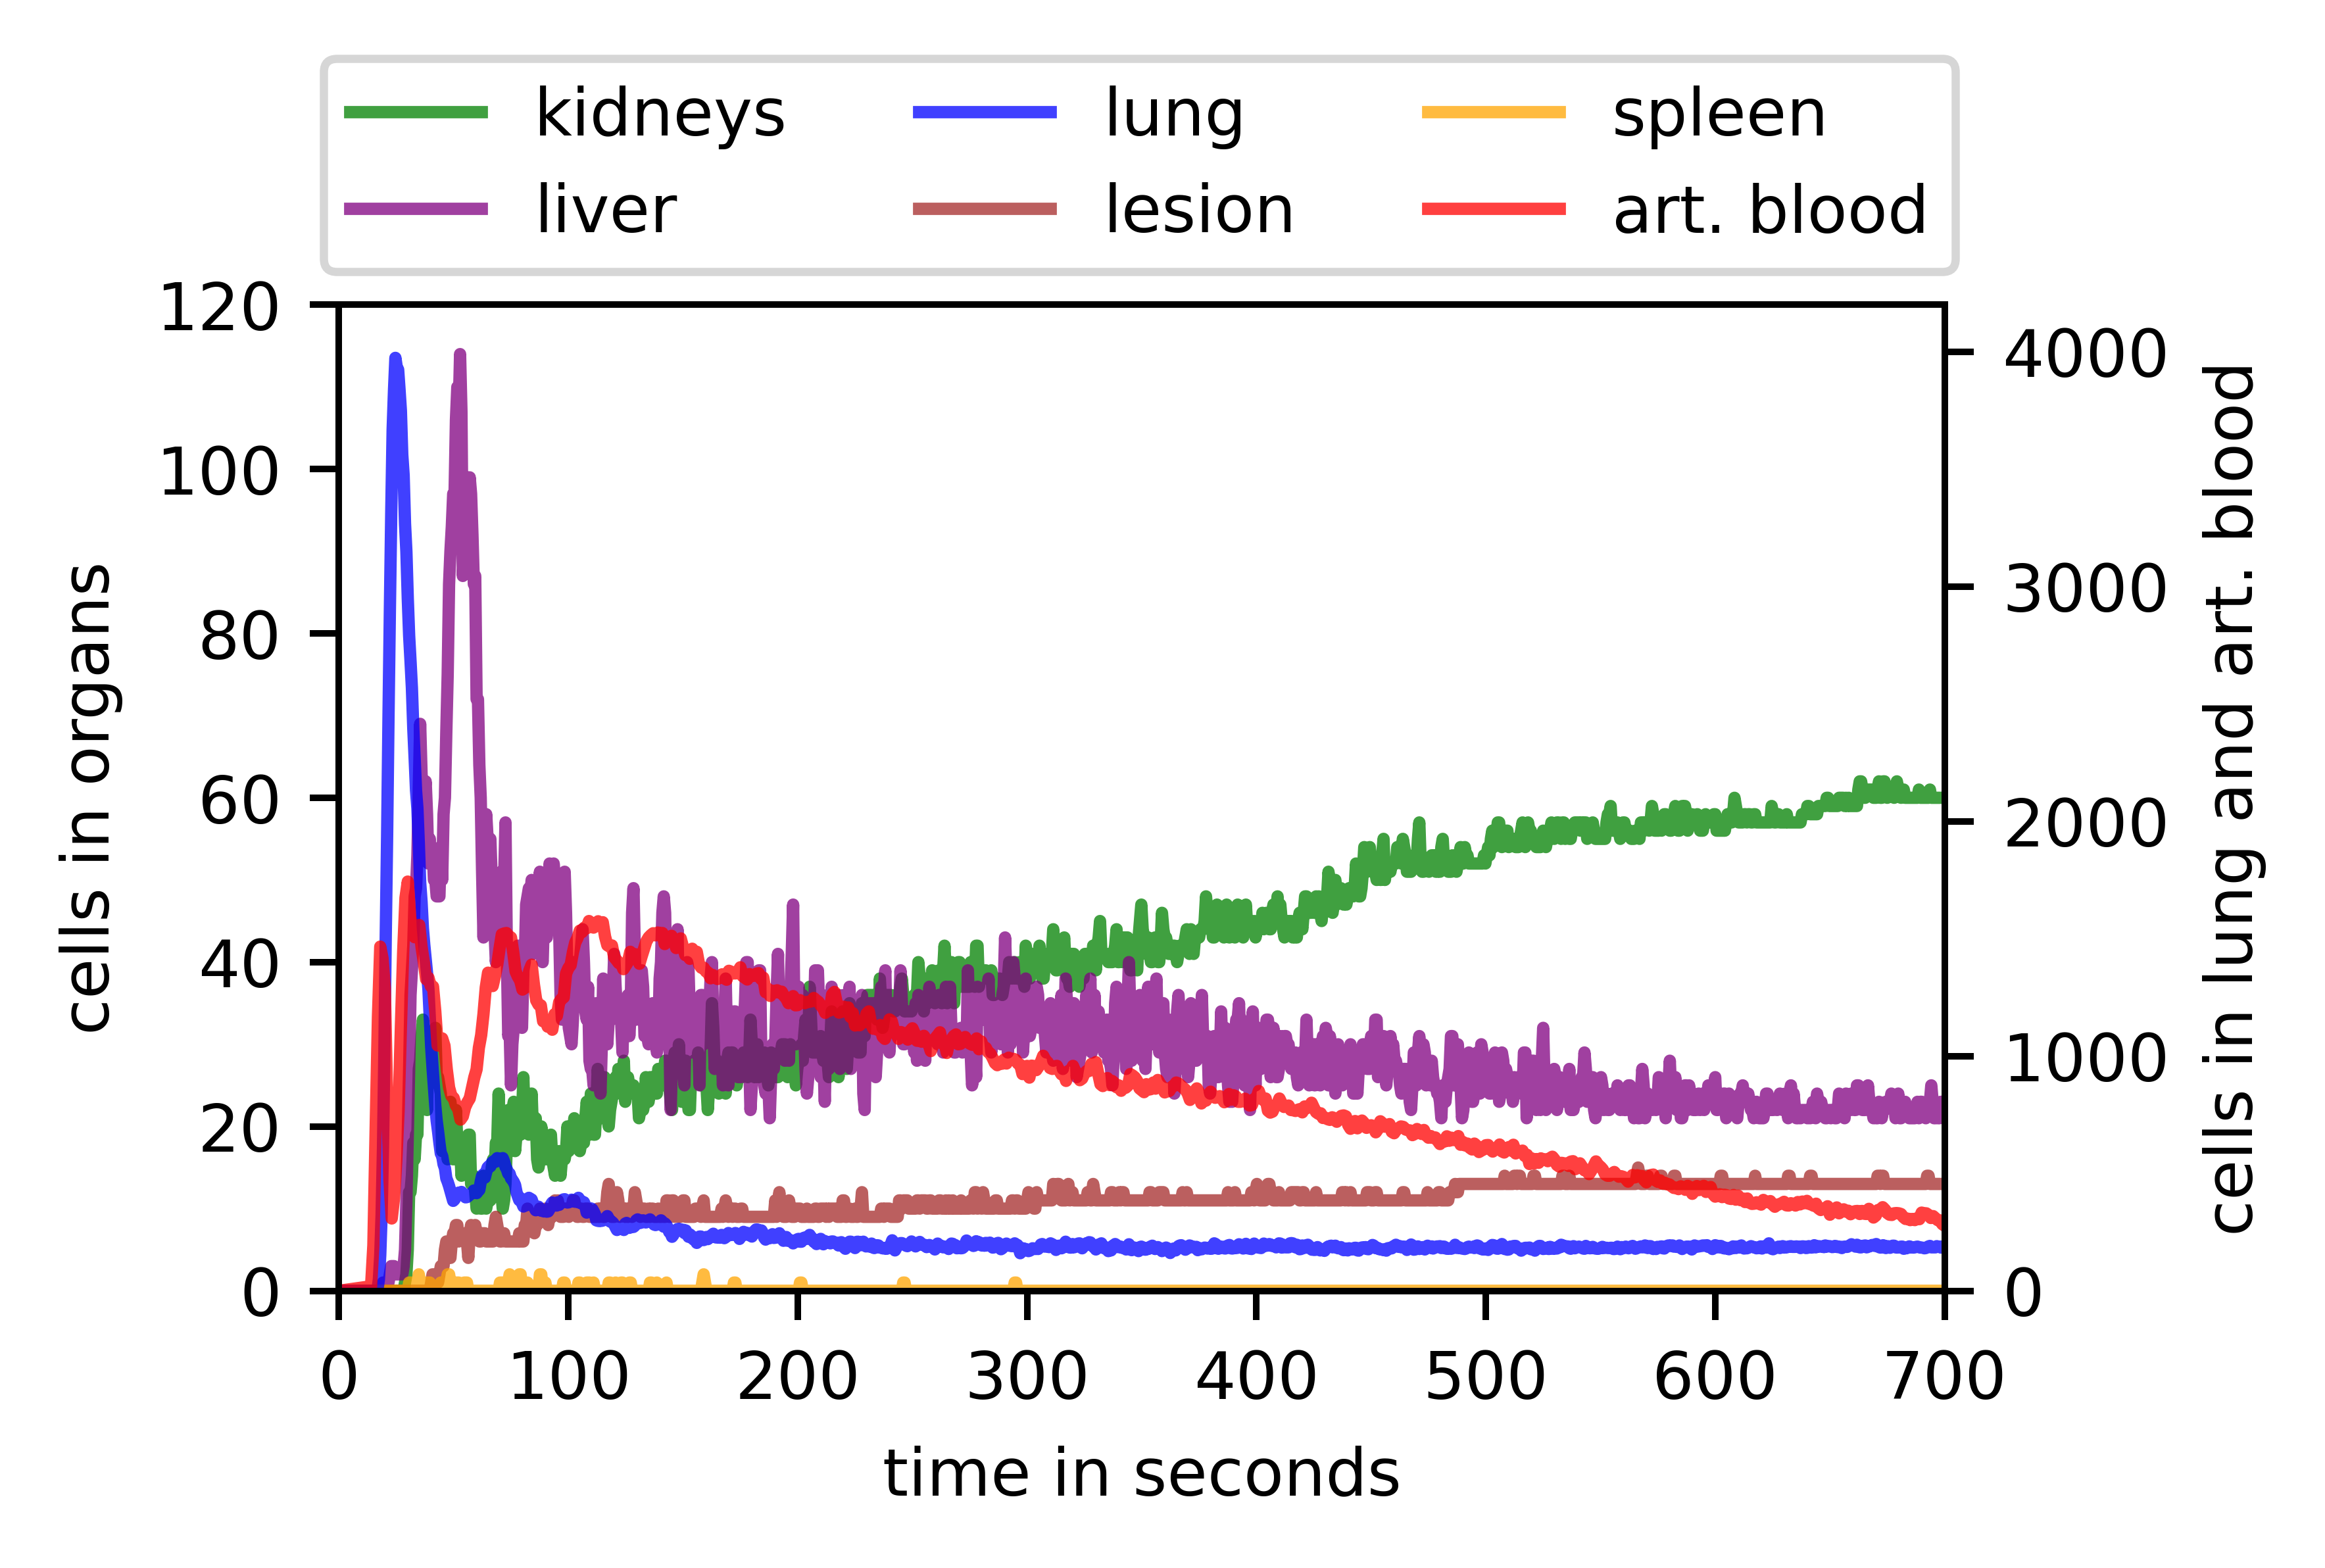
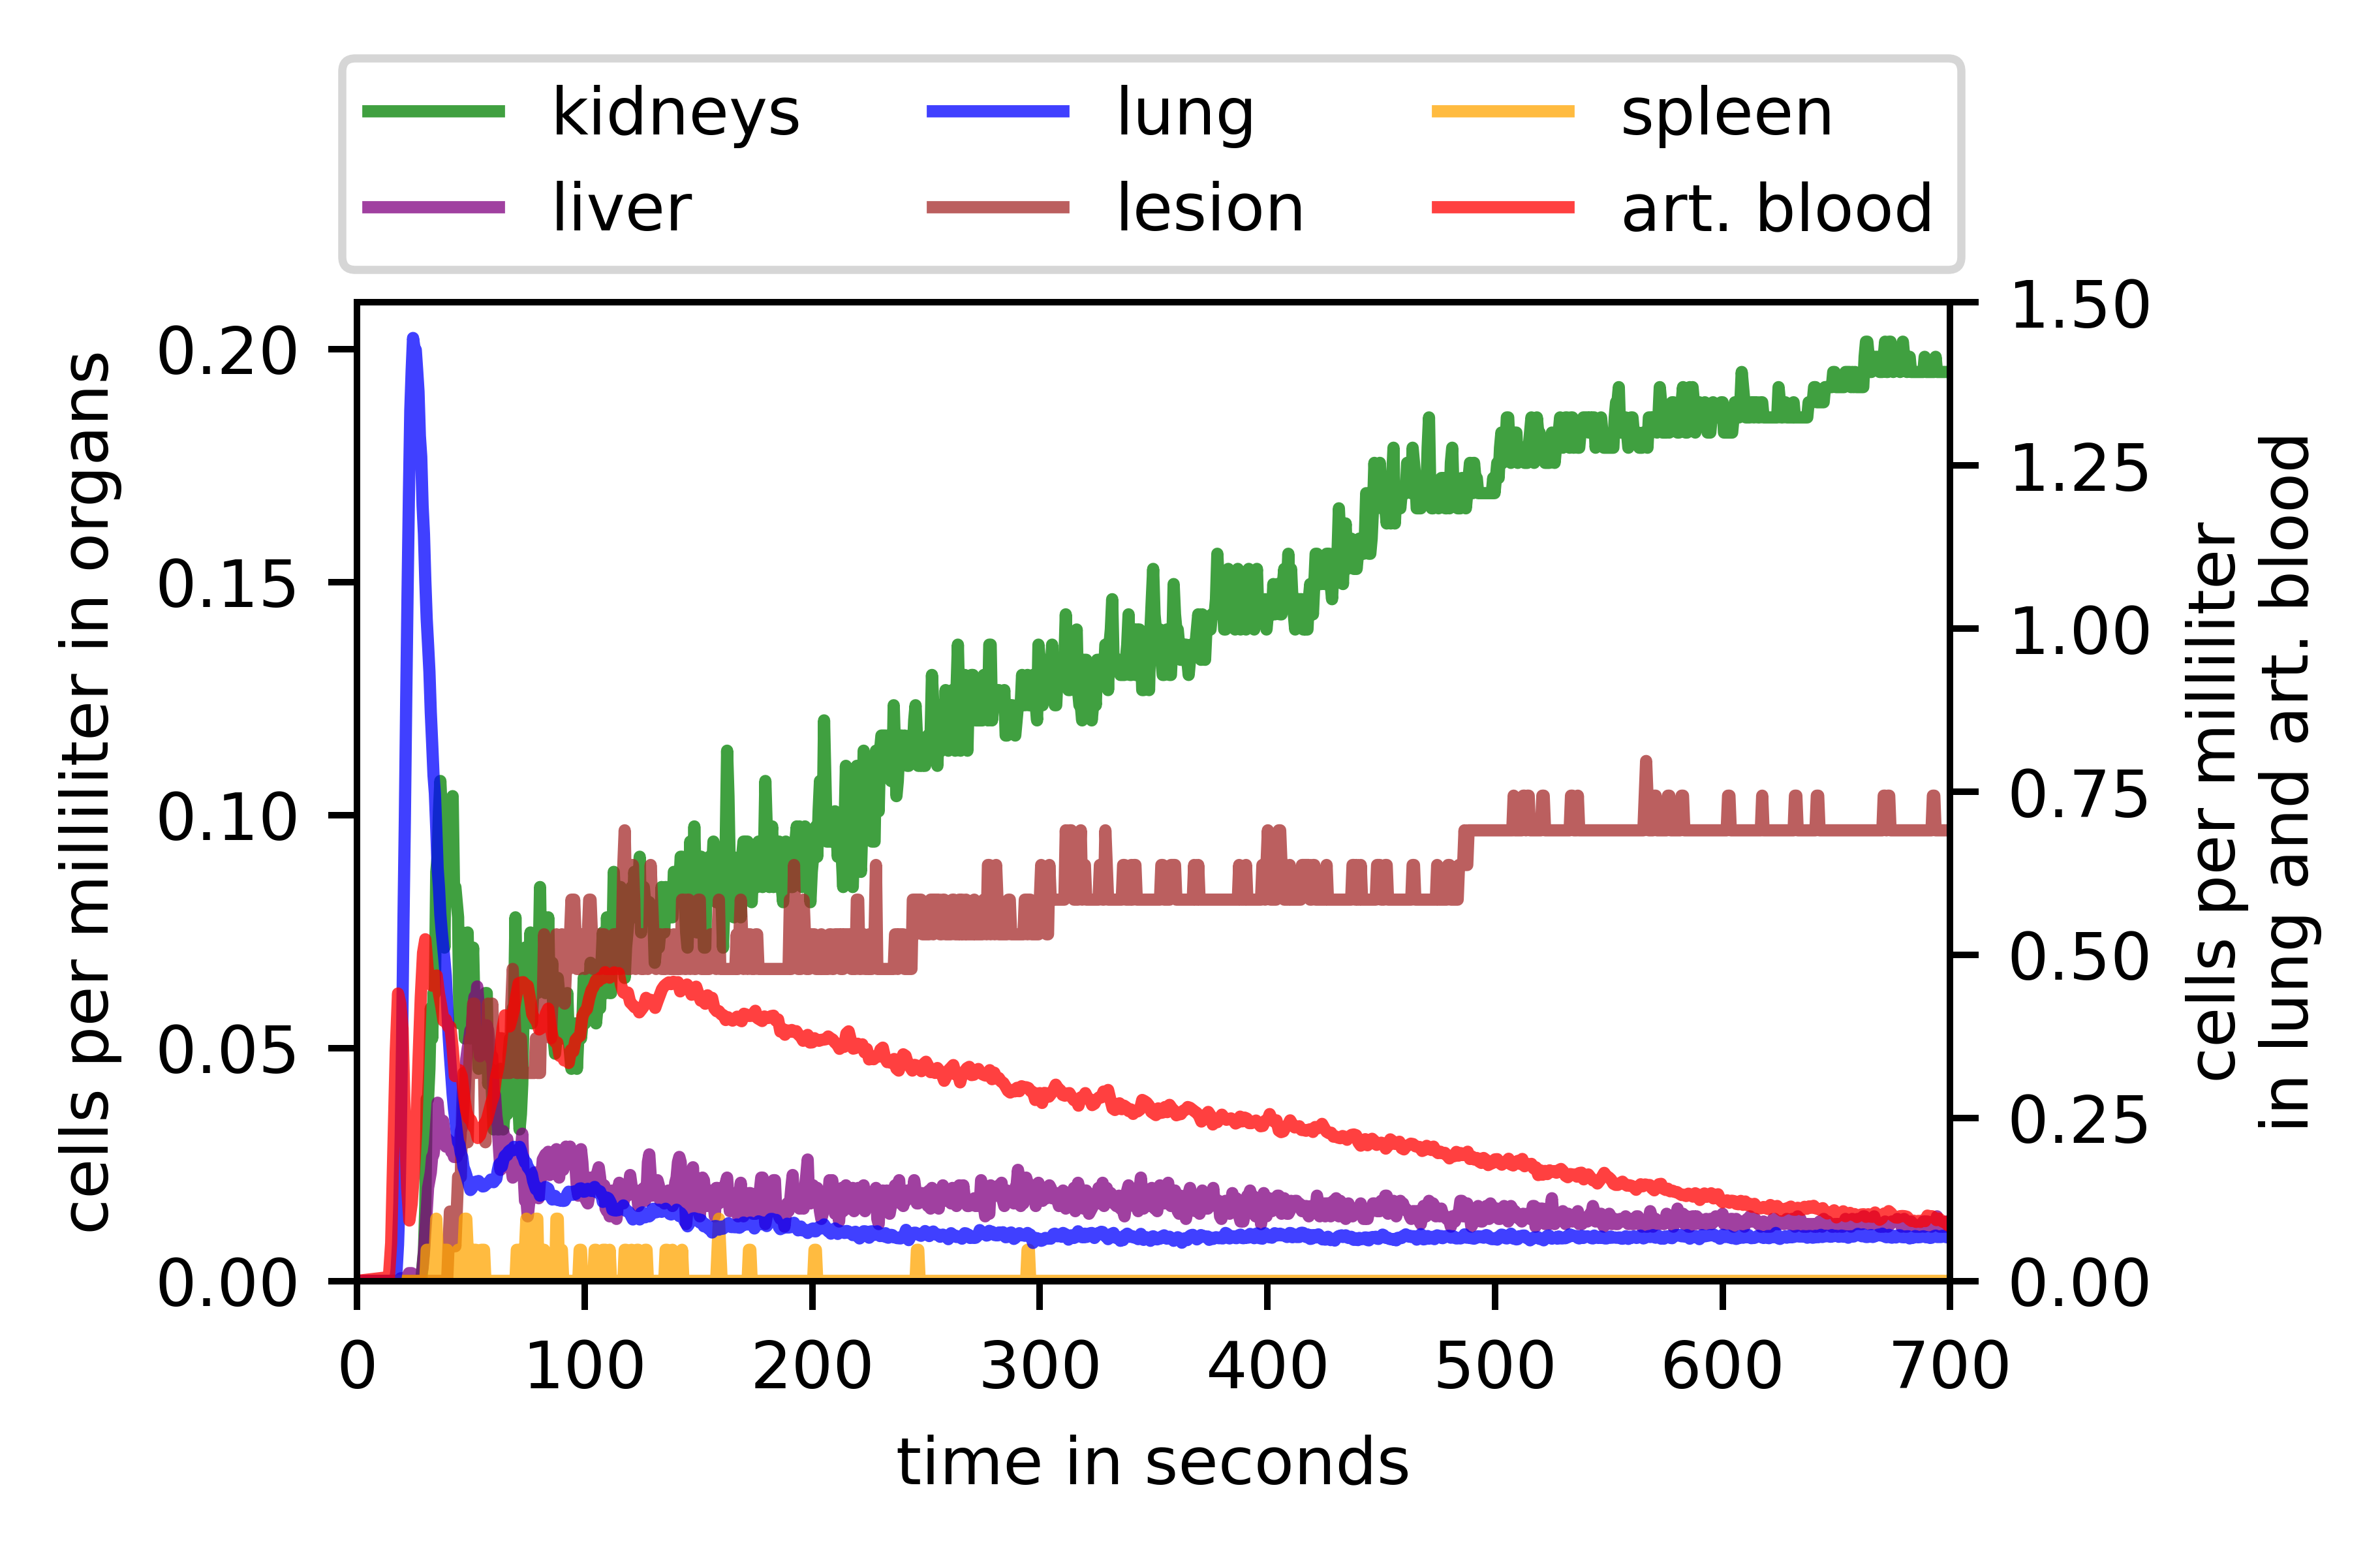
Figs. 7 and 8 illustrate the temporal distribution of cells in arterial blood, lung, kidneys, liver, spleen, and a lesion as absolute cell numbers and as cell concentrations per milliliter, respectively. The lesion in this case is the pancreas, for which the value of was set to 2.071 min-1 in order to simulate increased trapping of cells in a tissue. In the initial 15 seconds of the simulation, the organs and arterial blood show no signal, as the cells were still within the venous blood. Following this interval, the arrival of the cell bolus in the arterial blood, lungs, kidneys, and liver can be identified as peaks. These peaks subsequently decline when cells that have not transitioned from to compartment leave the organs after a brief period. No peak can be identified in the lesion, where the cell count and concentration rises steadily after the first entry of cells. In the case of the spleen, a peak can only be observed in terms of concentration, as the absolute number of cells is quite low (below 5). In the arterial blood, two initial peaks can be observed occurring shortly before and after the peak of lung entry. The initial peak is relatively brief and may be attributed to the passage of cells through the pulmonary arteries. The second peak can be identified as the point at which the cell bolus enters the arterial blood from the left ventricle. At approximately 80, 115, and 150 seconds, further peaks are visible in the arterial blood before the cell count and concentration decrease continuously. These peaks represent the cycle of the cell bolus through the entire blood system once more, before distributing homogeneously in the blood.
4 discussion
The here presented simulation framework, CeFloPS, has been demonstrated to be capable of simulating realistic cell pathways within the human body, which can be utilized for the development of image reconstruction algorithms as well as specific cell tracking strategies. CeFloPS allows to simulate not only the realistic flow of cells through the vessel branches but also the migration of cells from the vasculature into tissues either as reversible or non-reversible trapping steps. By that, different physiologically relevant scenarios can be simulated for various cell types providing realistic data for mimicking the dynamic distribution of cells within the human body. Beyond pure cell-based simulations, even tracer studies could be simulated by CeFloPS, as shown here by the FDG example. Following the CeFloPS simulations, a label can be assigned to the cells, which was chosen for PET studies as a radio-label ( emitter) but could be of any kind allowing also simulations for other imaging modalities, such as SPECT, OI, MRI, or ultrasound imaging.
The simulation of PET physics was performed by GATE using a large-body PET system where radioactivity was attributed to each individual cell, defined as a small ball. Since this post-processing step is independent of the CeFloPS simulation, any other simulation framework could also be used which is capable of processing dynamic source distributions. In this study, only one bed position of 106 cm length defined by a large-body PET was simulated leading to an incomplete coverage of the entire human body. However, this could easily be extended towards a multi-bed simulation or using a total-body PET system covering a larger FOV.
The radioactivity of 1 kBq attributed to each FDG “cell” in the example is quite high and not realistic in the context of cell tracking experiments. In any case, this served only as a proof-of-principle value allowing a relatively noise-free dynamic image reconstruction of the simulated PET data for comparison with ground-truth cell positions. For realistic cell tracking simulation, radioactivity values in the range of a few Bq would be more appropriate. However, the demonstration of cell trajectory based PET reconstructions for low-count data, as shown before by our group (see [11]), was not part of this work and will be subject of subsequent studies.
It is evident from the cell numbers (Fig. 7 and Fig. 8) that certain organs are preferentially traversed by cells over others. This is due to the fact that the probability of which blood vessel branch is chosen at bifurcations is dependent upon the proportion of blood flow, as illustrated by (5). Organs that are less likely to be traversed by cells will therefore have a lower cell count. Conversely, this explains why the lungs and arterial blood, through which all cells pass, have such a high number of cells and concentration. As stated above, the kidneys receive a disproportionately high blood flow (see Table 2), which is reflected in the organ’s highest cell concentration at the end of the simulation as seen in Fig. 8. This is due to the rudimentary modeling of the blood vessels in the kidneys by XCAT, exhibiting a lack of small diameter vessels (see Fig. 1c). Given that these represent a significant resistance, as indicated by (2), the blood flow to the kidneys is currently overestimated. Consequently, the likelihood of cell paths traversing the kidneys is greater than that of other organs. The spatial resolution of the XCAT phantom thus represents a clear limitation of CeFloPS. In order to improve towards a more realistic behavior, two potential approaches could be followed. Either, missing smaller blood vessels could be added to the XCAT phantom which would lead to a higher resistance in the vasculature and thus to a more realistic blood flow. Or, pre-defined resistances could be attributed to dedicated organs which would also lead to a more realistic flow simulation in CeFloPS. In principle, a different anthropomorphic phantom with higher level of details could also be implemented in the CeFloPS framework which could circumvent the flow imbalances.
Blood flow is currently implemented as a continuous mean flow, completely ignoring the pulsating characteristics of the blood circulation. This is no limitation for the purpose of our study, but could be of interest when focusing on local effects due to the pulse wave behavior. Also, turbulent flow and a variable blood viscosity which is known to play an important role in the area of the capillary bed, are completely ignored. Moreover, cells in our study are considered as small particles which freely flow through the blood system and freely diffuse through the tissue compartments. Cell specific behaviors, such as rolling or adhesion at the endothelium or immune related activation cannot explicitly be modeled within the CeFloPS simulation. However, a similar behavior of cells could potentially be modeled by setting (dynamic) -Parameters (Tab. 1) for compartmental exchanges.
5 conclusion
In this study, we presented the development of a cell flow PET simulation (CeFloPS) that is capable of accurately simulating the behavior of injected radio-labeled cells during human whole-body PET imaging with ground-truth knowledge of the cells’ positions. The data obtained with CeFloPS is of significant value for the development and validation of cell tracking algorithms, with the potential to contribute to a deeper understanding of immune system-related processes or to the guidance of cell-based therapies.
6 Acknowledgment
We greatly acknowledge the help of Paul Segars for providing an extended version of XCAT with precise vessel and tissue definitions.
References
- [1] M. F. Kircher, S. S. Gambhir, and J. Grimm, “Noninvasive cell-tracking methods.” Nature reviews. Clinical oncology, vol. 8, pp. 677–88, 9 2011.
- [2] V. Ponomarev, “Advancing immune and cell-based therapies through imaging,” Molecular Imaging and Biology, vol. 19, pp. 379–384, 2017.
- [3] S. R. Cherry, T. Jones, J. S. Karp, J. Qi, W. W. Moses, and R. D. Badawi, “Total-body PET: Maximizing sensitivity to create new opportunities for clinical research and patient care,” Journal of Nuclear Medicine, vol. 59, pp. 3–12, 1 2018.
- [4] I. Friberger et al., “Comparative in vivo biodistribution of cells labelled with [89zr]zr-(oxinate)4 or [89zr]zr-dfo-ncs using PET,” EJNMMI Research, vol. 13, p. 73, 8 2023.
- [5] K. O. Jung et al., “Whole-body tracking of single cells via positron emission tomography,” Nature Biomedical Engineering, vol. 4, pp. 835–844, 6 2020.
- [6] L. Melendez-Alafort, G. Ferro-Flores, L. D. Nardo, B. Ocampo-García, and C. Bolzati, “Zirconium immune-complexes for PET molecular imaging: Current status and prospects,” Coordination Chemistry Reviews, vol. 479, p. 215005, 3 2023.
- [7] D. Hampel, S. Manger, D. Parker, and T. K. Wheldon, “Superpept: A new tool for positron emission particle tracking; first results,” Nuclear Instruments and Methods in Physics Research Section A: Accelerators, Spectrometers, Detectors and Associated Equipment, vol. 1028, p. 166254, 4 2022.
- [8] Y. Ouyang, T. J. Kim, and G. Pratx, “Evaluation of a BGO-based PET system for single-cell tracking performance by simulation and phantom studies,” Molecular Imaging, vol. 15, p. 153601211664648, 1 2016.
- [9] S. Ghosh and P. Das, “Single-cell tracking with Compton-PET: An in silico feasibility study,” Nuclear Instruments and Methods in Physics Research Section A: Accelerators, Spectrometers, Detectors and Associated Equipment, vol. 1053, p. 168373, 8 2023.
- [10] H. T. M. Nguyen et al., “Ultrasensitive and multiplexed tracking of single cells using whole-body PET/CT,” Science Advances, vol. 10, 6 2024.
- [11] B. Schmitzer, K. P. Schäfers, and B. Wirth, “Dynamic cell imaging in PET with optimal transport regularization,” IEEE Transactions on Medical Imaging, vol. 39, no. 5, pp. 1626–1635, 2019.
- [12] W. P. Segars, G. Sturgeon, S. Mendonca, J. Grimes, and B. M. Tsui, “4d xcat phantom for multimodality imaging research,” Medical physics, vol. 37, no. 9, pp. 4902–4915, 2010.
- [13] International Organization for Standardization, Industrial automation systems and integration — Product data representation and exchange: Part 21: Implementation methods: Clear text encoding of the exchange structure, ISO 10303-21:2016(E) ed. Vernier, Geneva, Switzerland: International Organization for Standardization, 2016. [Online]. Available: https://www.iso.org/standard/63141.html
- [14] M. Dawson-Haggerty et al., “trimesh 4.4.1.” [Online]. Available: https://trimesh.org/
- [15] R. Lampe, N. Botkin, V. Turova, T. Blumenstein, and A. Alves-Pinto, “Mathematical modelling of cerebral blood circulation and cerebral autoregulation: Towards preventing intracranial hemorrhages in preterm newborns,” Computational and Mathematical Methods in Medicine, vol. 2014, no. 1, p. 965275, 2014.
- [16] J. H. Helthuis et al., “A patient-specific cerebral blood flow model,” Journal of Biomechanics, vol. 98, p. 109445, 2020.
- [17] A. Belhocine, “Numerical study of heat transfer in fully developed laminar flow inside a circular tube,” The International Journal of Advanced Manufacturing Technology, vol. 85, pp. 2681–2692, 2016.
- [18] E. J. Li et al., “Efficient delay correction for total-body PET kinetic modeling using pulse timing methods,” Journal of Nuclear Medicine, vol. 63, no. 8, pp. 1266–1273, 2022.
- [19] S. Agostinelli et al., “GEANT4—a simulation toolkit,” Nuclear instruments and methods in physics research section A: Accelerators, Spectrometers, Detectors and Associated Equipment, vol. 506, no. 3, pp. 250–303, 2003.
- [20] S. Jan et al., “GATE: a simulation toolkit for PET and SPECT,” Physics in Medicine & Biology, vol. 49, no. 19, p. 4543, 2004.
- [21] G. A. Prenosil et al., “Performance characteristics of the biograph vision quadra PET/CT system with a long axial field of view using the NEMA NU 2-2018 standard,” Journal of nuclear medicine, vol. 63, no. 3, pp. 476–484, 2022.