[1]\fnmFelix \surMaurer
[1]\fnmAlexis \surDarras
1]\orgdivExperimental Physics, \orgnameSaarland University, \orgaddress\streetCampus, \citySaarbrücken, \postcode66123, \stateSaarland, \countryGermany
2]\orgdivDepartment of Theoretical Medicine and Biosciences, \orgnameSaarland University, \orgaddress\cityHomburg, \postcode66421, \stateSaarland, \countryGermany
3]\orgdivPhysics and Materials Science Research Unit, \orgnameUniversity of Luxembourg, \orgaddress\cityLuxembourg, \postcodeL-4365,\countryLuxembourg
Competing aggregation and iso-density equilibrium lead to band pattern formation in density gradients
Abstract
Centrifugation of erythrocytes (aka Red Blood Cells, RBCs) in a self-forming Percoll gradient is a protocol often used as a way to sort RBCs by age. However, a pattern formation of discrete bands is systematically observed along the continuous density gradient. Although early studies mentioned that aggregation between cells might modify their spatial distribution, it is debated whether a population with continuous density distribution can form discrete bands. Here, we develop a continuity equation, considering the aggregation of cells with a continuous density distribution, which describes the macroscopic evolution of the RBC volume concentration in a density gradient. The numerical solutions demonstrate that the competition between iso-density distribution and aggregation is sufficient to create band patterns. Our model reproduces the temporal evolution observed in the conventional experimental protocol, but also predicts several types of bifurcation-like behaviors for the steady-state patterns in constant gradients, when the volume fraction and aggregation energy of the cells are varied. We threrefore discovered that the competition between RBC aggregation and iso-density distribution is a novel physical mechanism leading to pattern formation.
keywords:
pattern formation, density separation, cell aggregation, red blood cells/erythrocytesResearch into density gradient media started in the 1960s and led to huge advances in the separation protocols of biological matter [1, 2, 3, 4, 5, 6, 7, 8, 9, 10, 11, 12]. Density gradients are usually prepared through concentration gradients in suspensions of nanoparticles or macromolecular solutions, with different sedimentation dynamics than the biological objects to separate [1, 2, 3, 4, 5]. Among these media, suspensions of biocompatibly coated silica nanoparticles, known commercially as Percoll, have found extensive utility in the separation of Red Blood Cells (RBCs) [5, 6, 7, 8, 9, 10, 11, 12]. Since the mass density of RBCs increases over their lifetime of approximately 120 days, density separation is considered a convenient way to separate RBCs according to their age [9, 7, 6]. During the past 40 years, several studies reported characteristic discontinuous RBC distributions of distinct bands, referred to as heterogeneous fractionation (see Fig. 1 (b,h)) [5, 6, 7, 8, 9, 10, 11, 12]. The underlying mechanism was unknown, sometimes attributed to intrinsic cell characteristics, e.g., heterogeneous ion exchange or cytoskeleton configurations [11]. However, early observations of RBC redistribution after a second centrifugation indicated the presence of aggregation [6]. We previously identified cell aggregation as the most likely underlying mechanism in band pattern formation thanks to a series of experiments where the aggregability of RBCs was altered [13]. However, it was so far unclear how reproducible discrete band patterns could arise from a continuous distribution of RBC density through their aggregation.
Indpendently of RBC density separation methods, mechanics of pattern formation is a whole field of study on its own and is strongly related to biological systems, as it determines the morphogenesis of organisms [14, 15, 16, 17, 18, 19]. Paradigmatic models for microscopic systems include Turing patterns (from reaction-diffusion) and diffusion-aggregation mechanisms [20, 21, 22, 23, 24, 25]. Pattern formation, which is the result of a symmetry breaking, can also appear in more general dynamic instabilities, where two antagonistic processes compete for the dynamics of the system (e.g., Rayleigh-Bénard, Rayleigh-Taylor, and Benjamin-Feir instabilities) [26, 27, 28]. Recently, it has also been shown that dynamic density functional theory (DDFT) can also lead to pattern formation with repulsive interactions, or ”social distancing”, when modeling disease transmission in a population [29]. Among the possible patterns obtained in all these situations, band patterns are usually considered as the simplest ones, which can even appear in one-dimensional systems. However, their appearance and properties depend on the exact mechanisms and boundary conditions of the system in which they occur.
In this work, we present a continuum DDFT model that describes the macroscopic evolution of the distribution of RBCs in a Percoll gradient. It demonstrates that deterministic band patterns spontaneously form from the competition between iso-density equilibrium, i.e., buoyant forces, and intercellular aggregation forces. Therefore, we discovered a new physical mechanism that leads to pattern formation, which needs to be taken into account when studying cell density separation, as sometimes performed in clinical contexts [12].
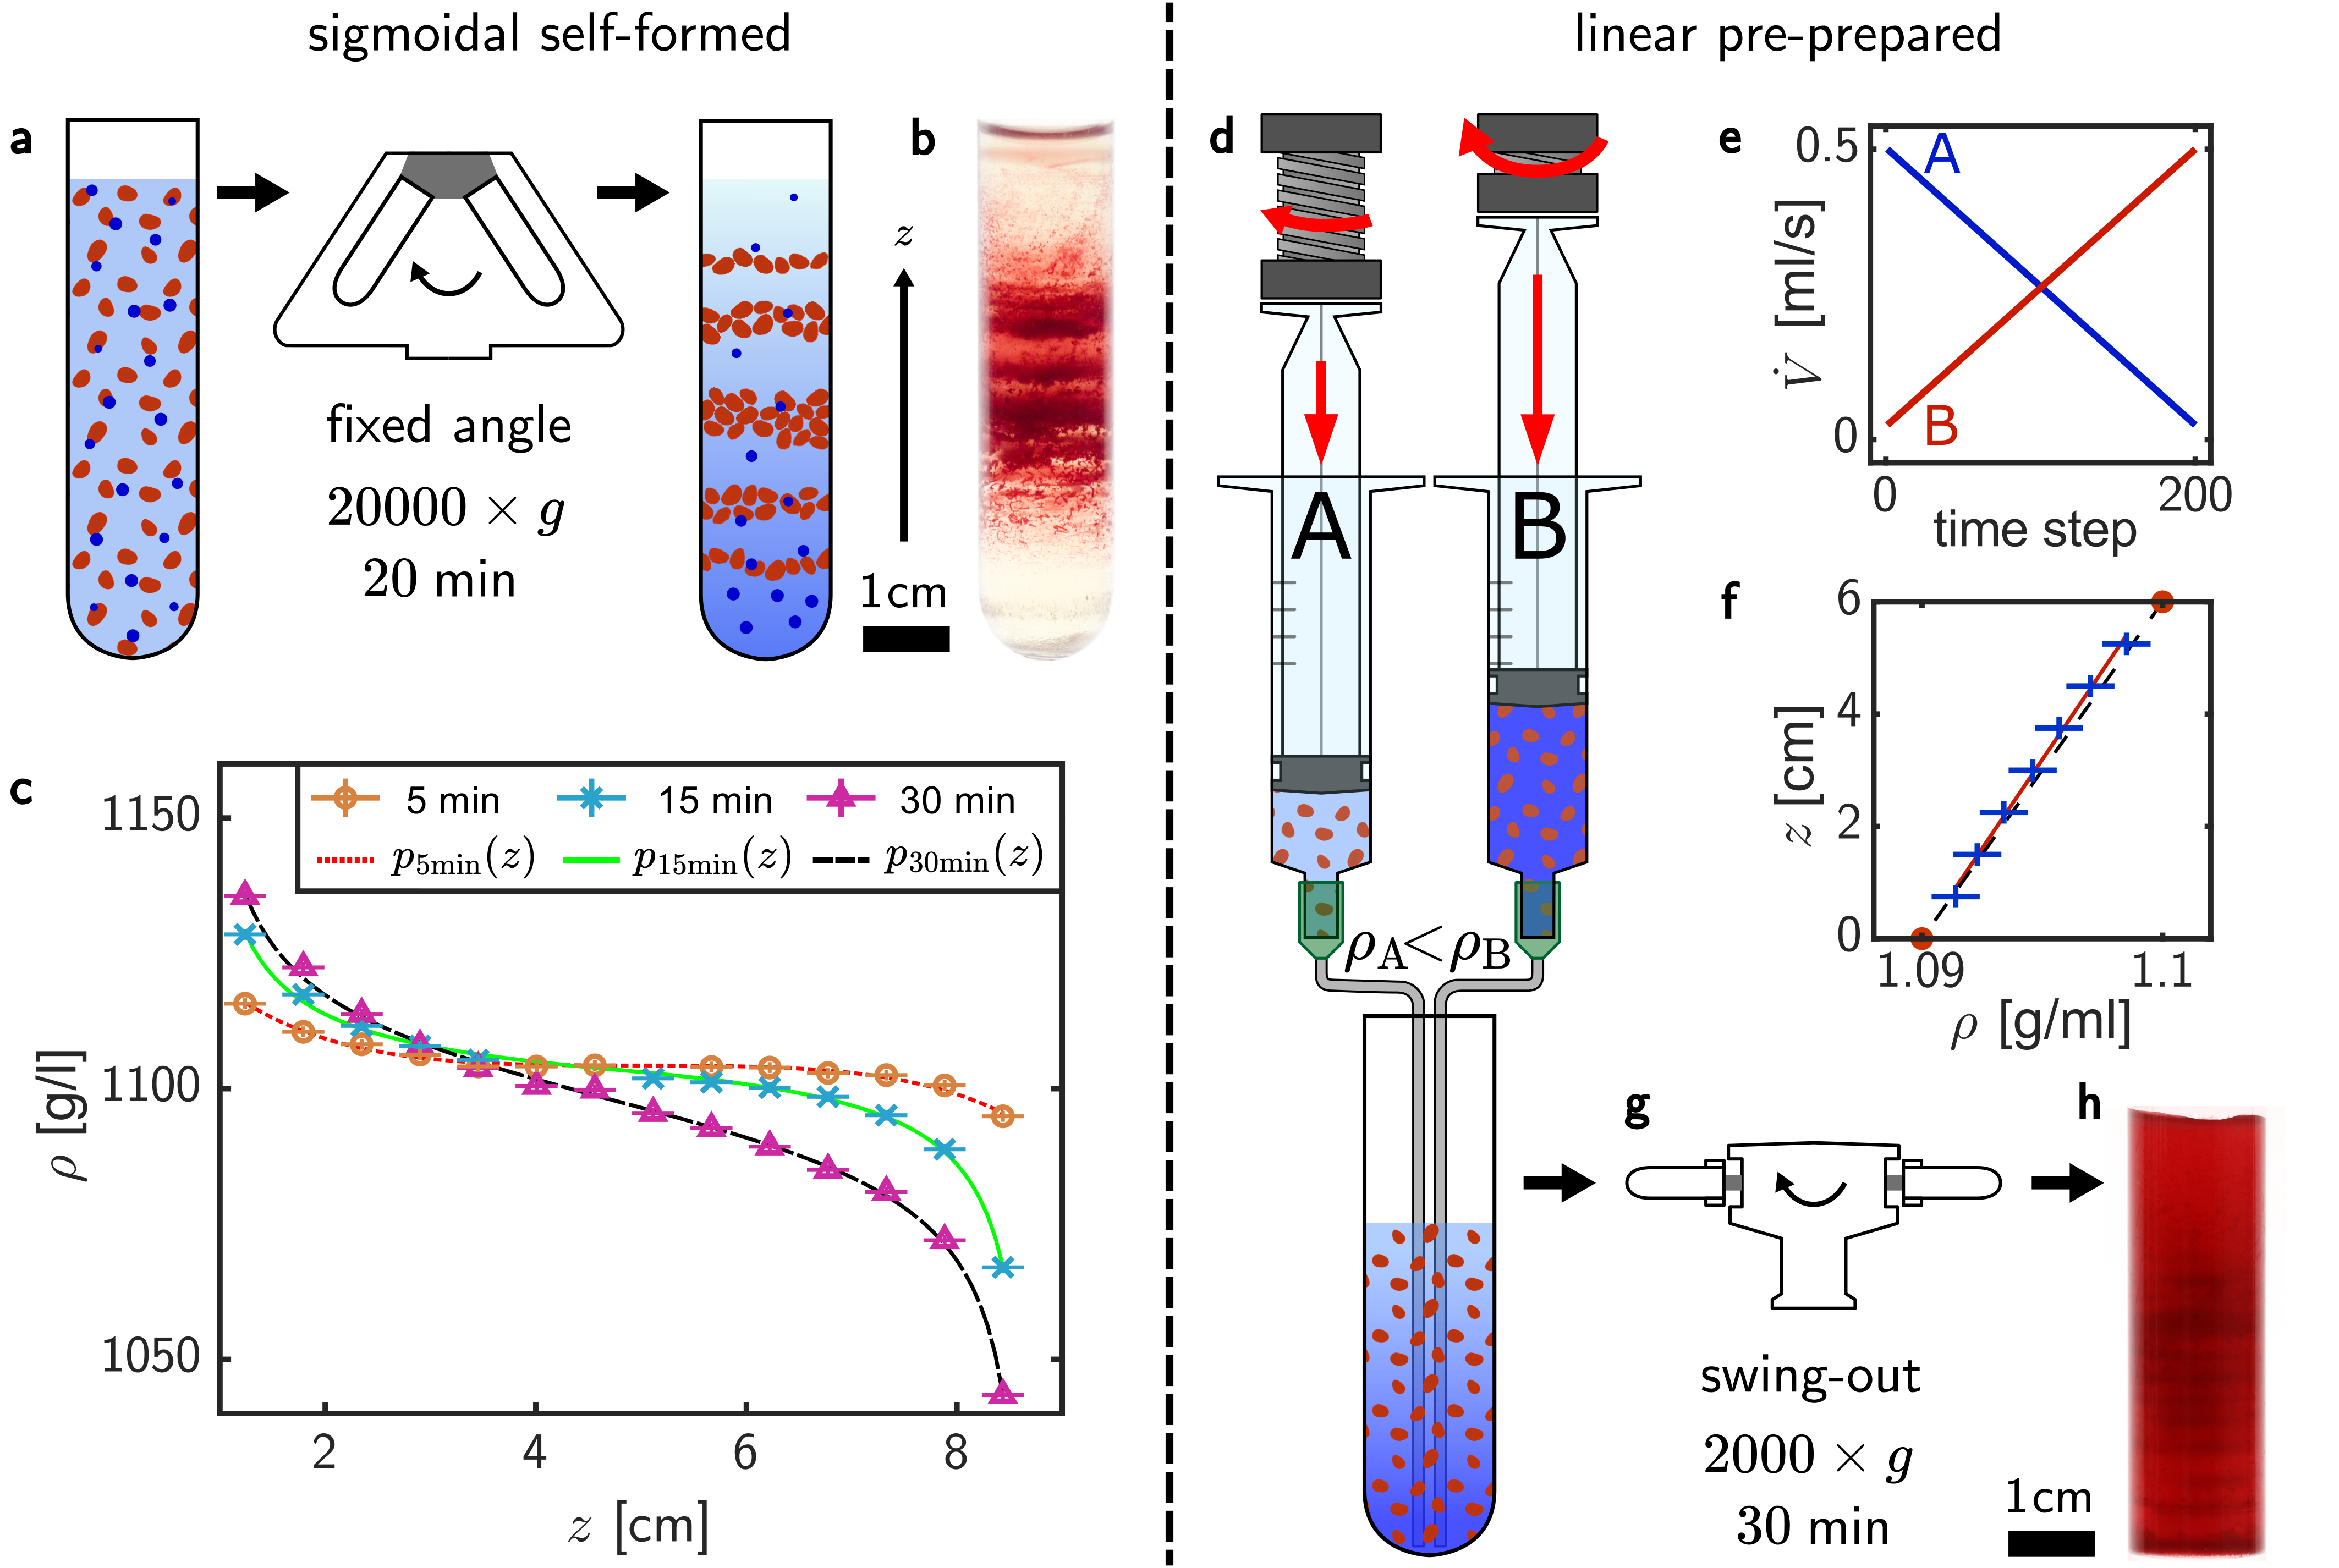
Protocols in biological or biochemical studies for the age separation make use of the spontaneous self-formation of a density gradient in Percoll, as described in Fig. 1a,b. Initially, a suspension of RBCs is either mixed with (or carefully placed on top of) a homogeneous Percoll medium in a centrifugation tube. The tube is then subjected to high accelerations for a duration of . Nano-sized Percoll particles then experience partial sedimentation and adopt a sigmoidal density distribution. Control measurements of the density profiles without cells are shown in Fig. 1c. The density of 14 layers extracted successively from the tube, each, was measured using an Anton Paar Density Meter, see Fig. 1. Measurements were repeated for different duration of centrifugation . An inverse sigmoidal function, with time-dependent slope and curvature,
| (1) |
was fitted to obtain an analytical model for the purpose of simulation [4, 3, 2]. Further discussion of this choice is available in the Supplementary Material. The average density is assumed to be in the center of the centrifugation tube of length . The density function has point symmetry with respect to the normalized coordinate , where is a characteristic length of the gradient. There is a time-dependent density spread , and steepness . All coefficients () where obtained from regressions to measured curves at various durations .
When RBCs are added to the tubes during the formation of the Percoll concentration gradient, they are believed to drift towards their iso-density position, where buoyant force and external acceleration balance. This should result in a sorting by density. However, when resolved in a Percoll gradient, RBCs spatial distribution organizes into a pattern of discrete and separate bands [5, 6, 7, 8, 9, 10, 11, 12, 30], see Fig.1b. There is, however, no explanation why the mass density distribution of RBCs should be discrete and/or multimodal. In fact, for most applications, the distribution of the physiological RBC mass density can often be approximated as a Gaussian centered around with a standard deviation of [31, 32].
Seeking a deeper explanation and mathematical description of the pattern formation process, we established a numerical model based on the assumption that the dynamics of the RBCs is only governed by the acceleration of the effective mass and aggregation. As demonstrated in the Supplementary Materials, the DDFT-equation for the specific volume fraction of RBCs of density and volume , at height and time can be written as
| (2) |
where is the Stokes drag coefficient of the RBCs with hydrodynamic radius , is the effective interaction potential between two RBCs located at and , is the inertial acceleration due to the centrifugation process and is the density of the surrounding Percoll suspension [33, 34]. By that definition, is the volume fraction of RBC at location . A common choice for the effective potential in case of short range interactions, like depletion, is the term . The effective potential combines attraction and repulsion,
| (3) |
with the cell diameter , the attractiveness , and the amplitude of the interaction. We define an effective attractive energy by , . The numerical solver is implemented in using CUDA, see supplementary section and published code on Github [35]. Equation (2) was solved for , , , i.e. in analogy to a typical Lennard-Jones potential. The initial condition was always homogeneous in space, which corresponds to mixing the sample tube, and a physiological distribution in density with , . We solved the model for the traditional sigmoidal self-forming gradient as well as a new stable linear gradient separation protocol, in order to probe the properties of the obtained pattern in a simpler case. The effective energy was fixed to and was varied.
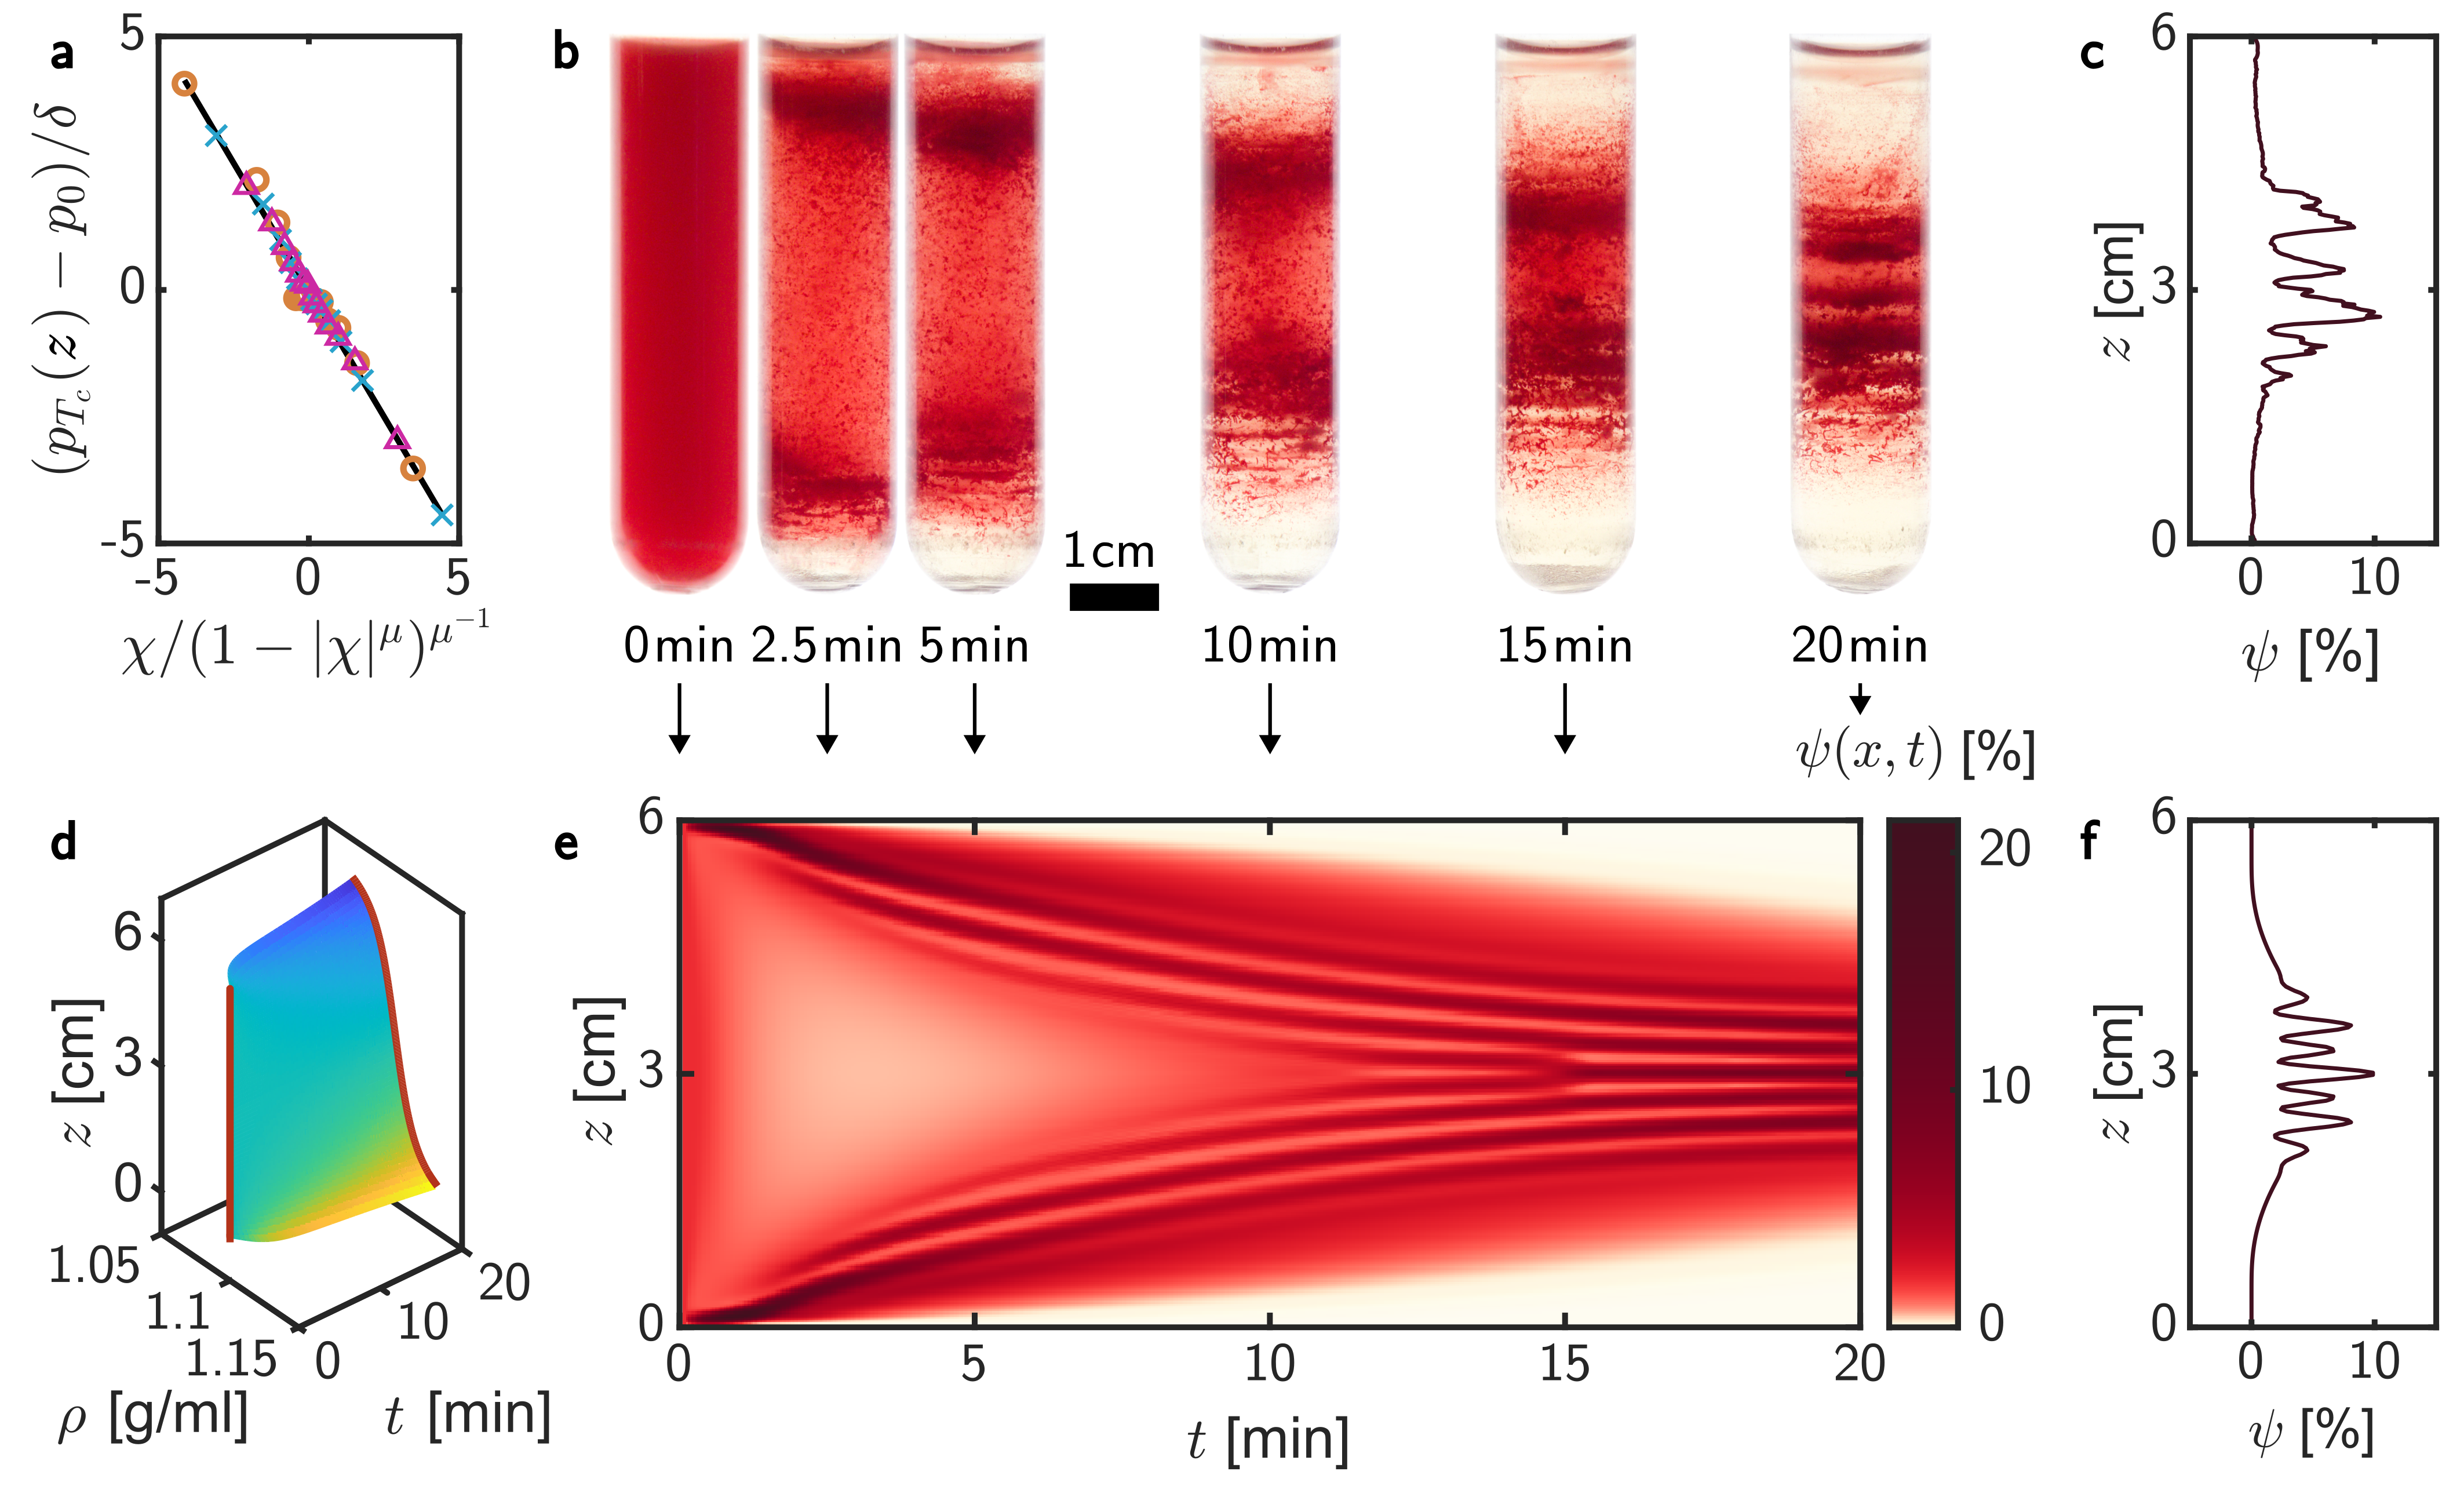
Experiments were performed with average Percoll density matching the average RBC density [31, 32]. Images after different centrifugation duration are shown in Fig. 2b. Initially, the Percoll density is constant as the medium is homogeneous, . Consequently cells with a lower density than the surrounding medium, i.e. , move to the top and remaining cells to the bottom. In case of perfect density matching and a symmetrical mass density distribution this divides the population exactly in half. After the gradient catches up, the sedimentation is accelerated by the formation of the density gradient. This causes an overall flow towards the center of the tube. During that process, band formation can be observed.
The gradient function in Eq.(1) was adapted from regressions with , , , , and . The system length is . The simulated RBC density is in good agreement with the experimentally observed distribution, Fig. 2e. This includes time scales, i.e., the initial split , and the recombination with the development of a central band , the number and amplitude of bands. Differences include the condensation of the distribution tails in the top and bottom of the tube due to heterogeneity, and uncontrollable variations in the experiment. Those variations might be induced by thermal or other convection, vibrations, and an offset in density matching.
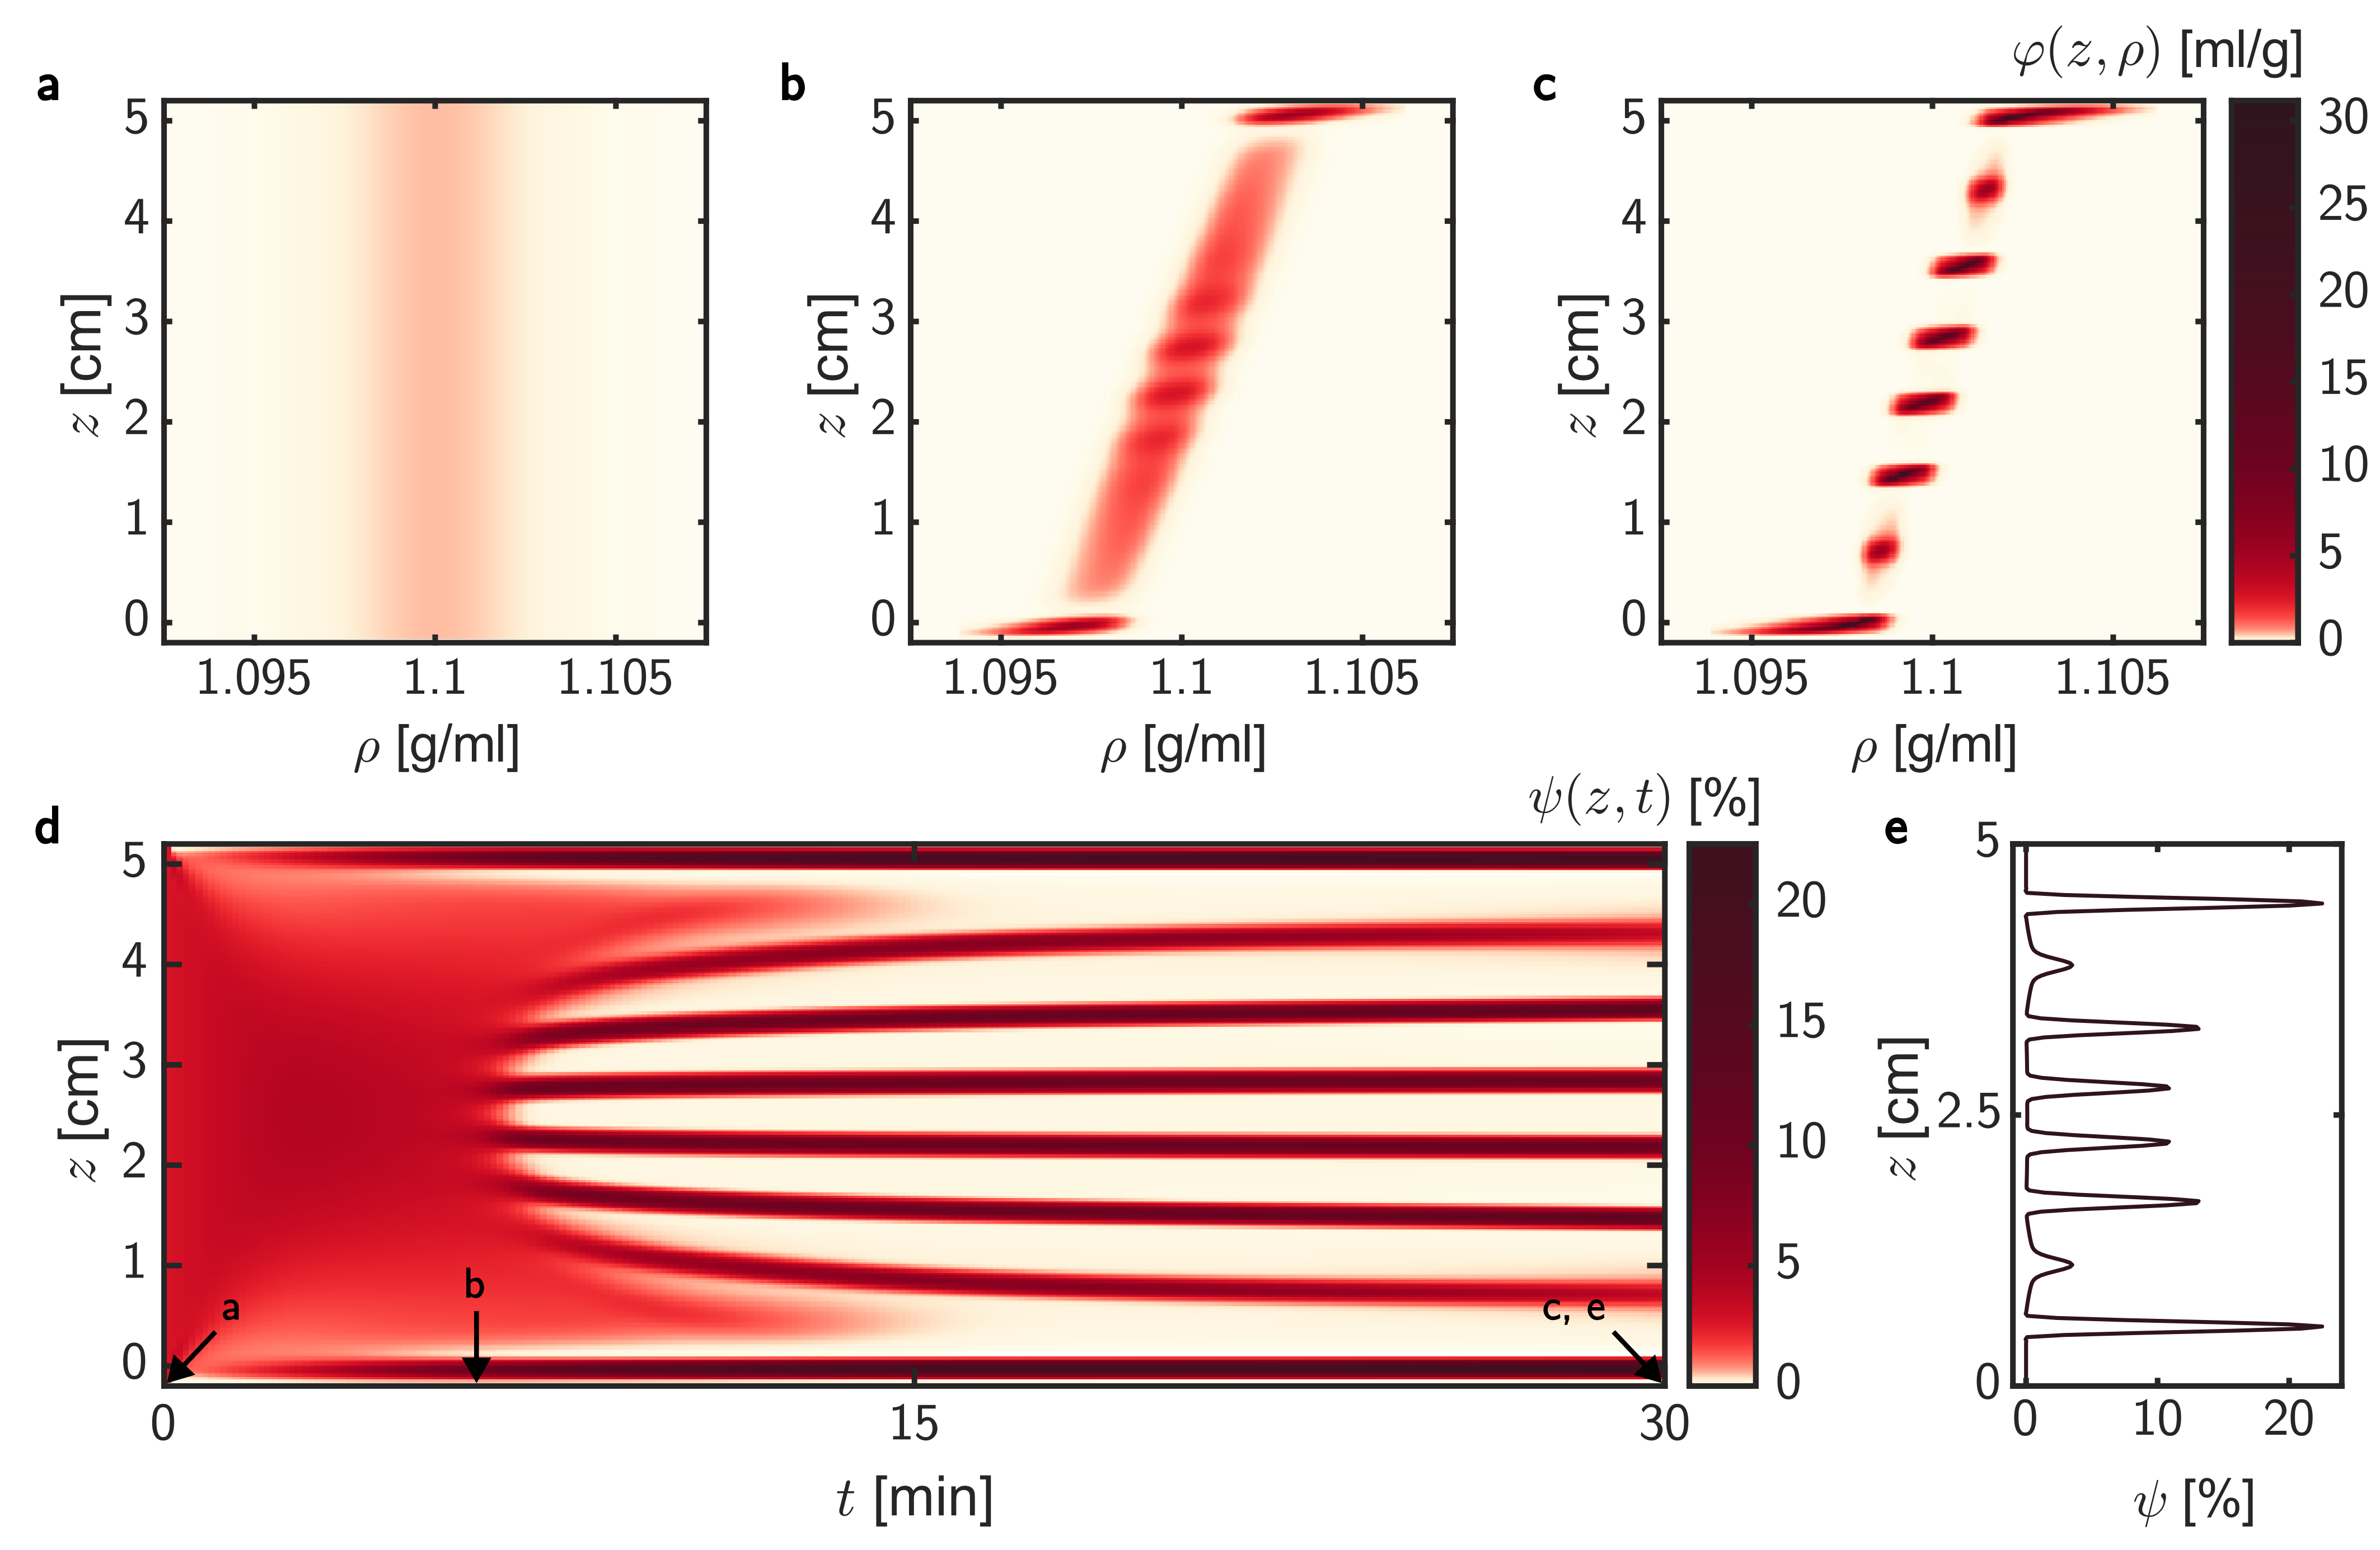
In order to perform conceptually simplified experiments, we designed controllable Percoll concentration gradients, in order to study the final band pattern in various well-defined gradients and volume fractions. We used two computer-controlled syringe pumps to prepare a linear Percoll gradient and a homogeneous RBC distribution as shown in Figure 1d-f. Syringe A holds a low density medium with the desired hematocrit , and B a high density medium, , with the same cell concentration. The needle tips are joined in the tube bottom to achieve mixing (Fig.1d). The volume flow is driven by linear actuators and varied to create a linear gradient (Fig.1e,f). Afterwards the sample is placed in a swing-out centrifuge at for (Fig.1g). An example of resulting band pattern is depicted in Fig.1h. This method uses lower accelerations, so that the distribution of Percoll does not substantially changes during the sedimentation process. Hence it can be realized with a variety of affordable rotors, including more delicate swing-out variants. It is also more straightforward to implement corresponding numerical simulations, as the density gradient can be considered stable along time with constant. Fig. 3 displays a typical time evolution obtained in the corresponding numerical simulation with a stable linear density gradient, while Fig. 4 compares experimental and numerical outcomes.
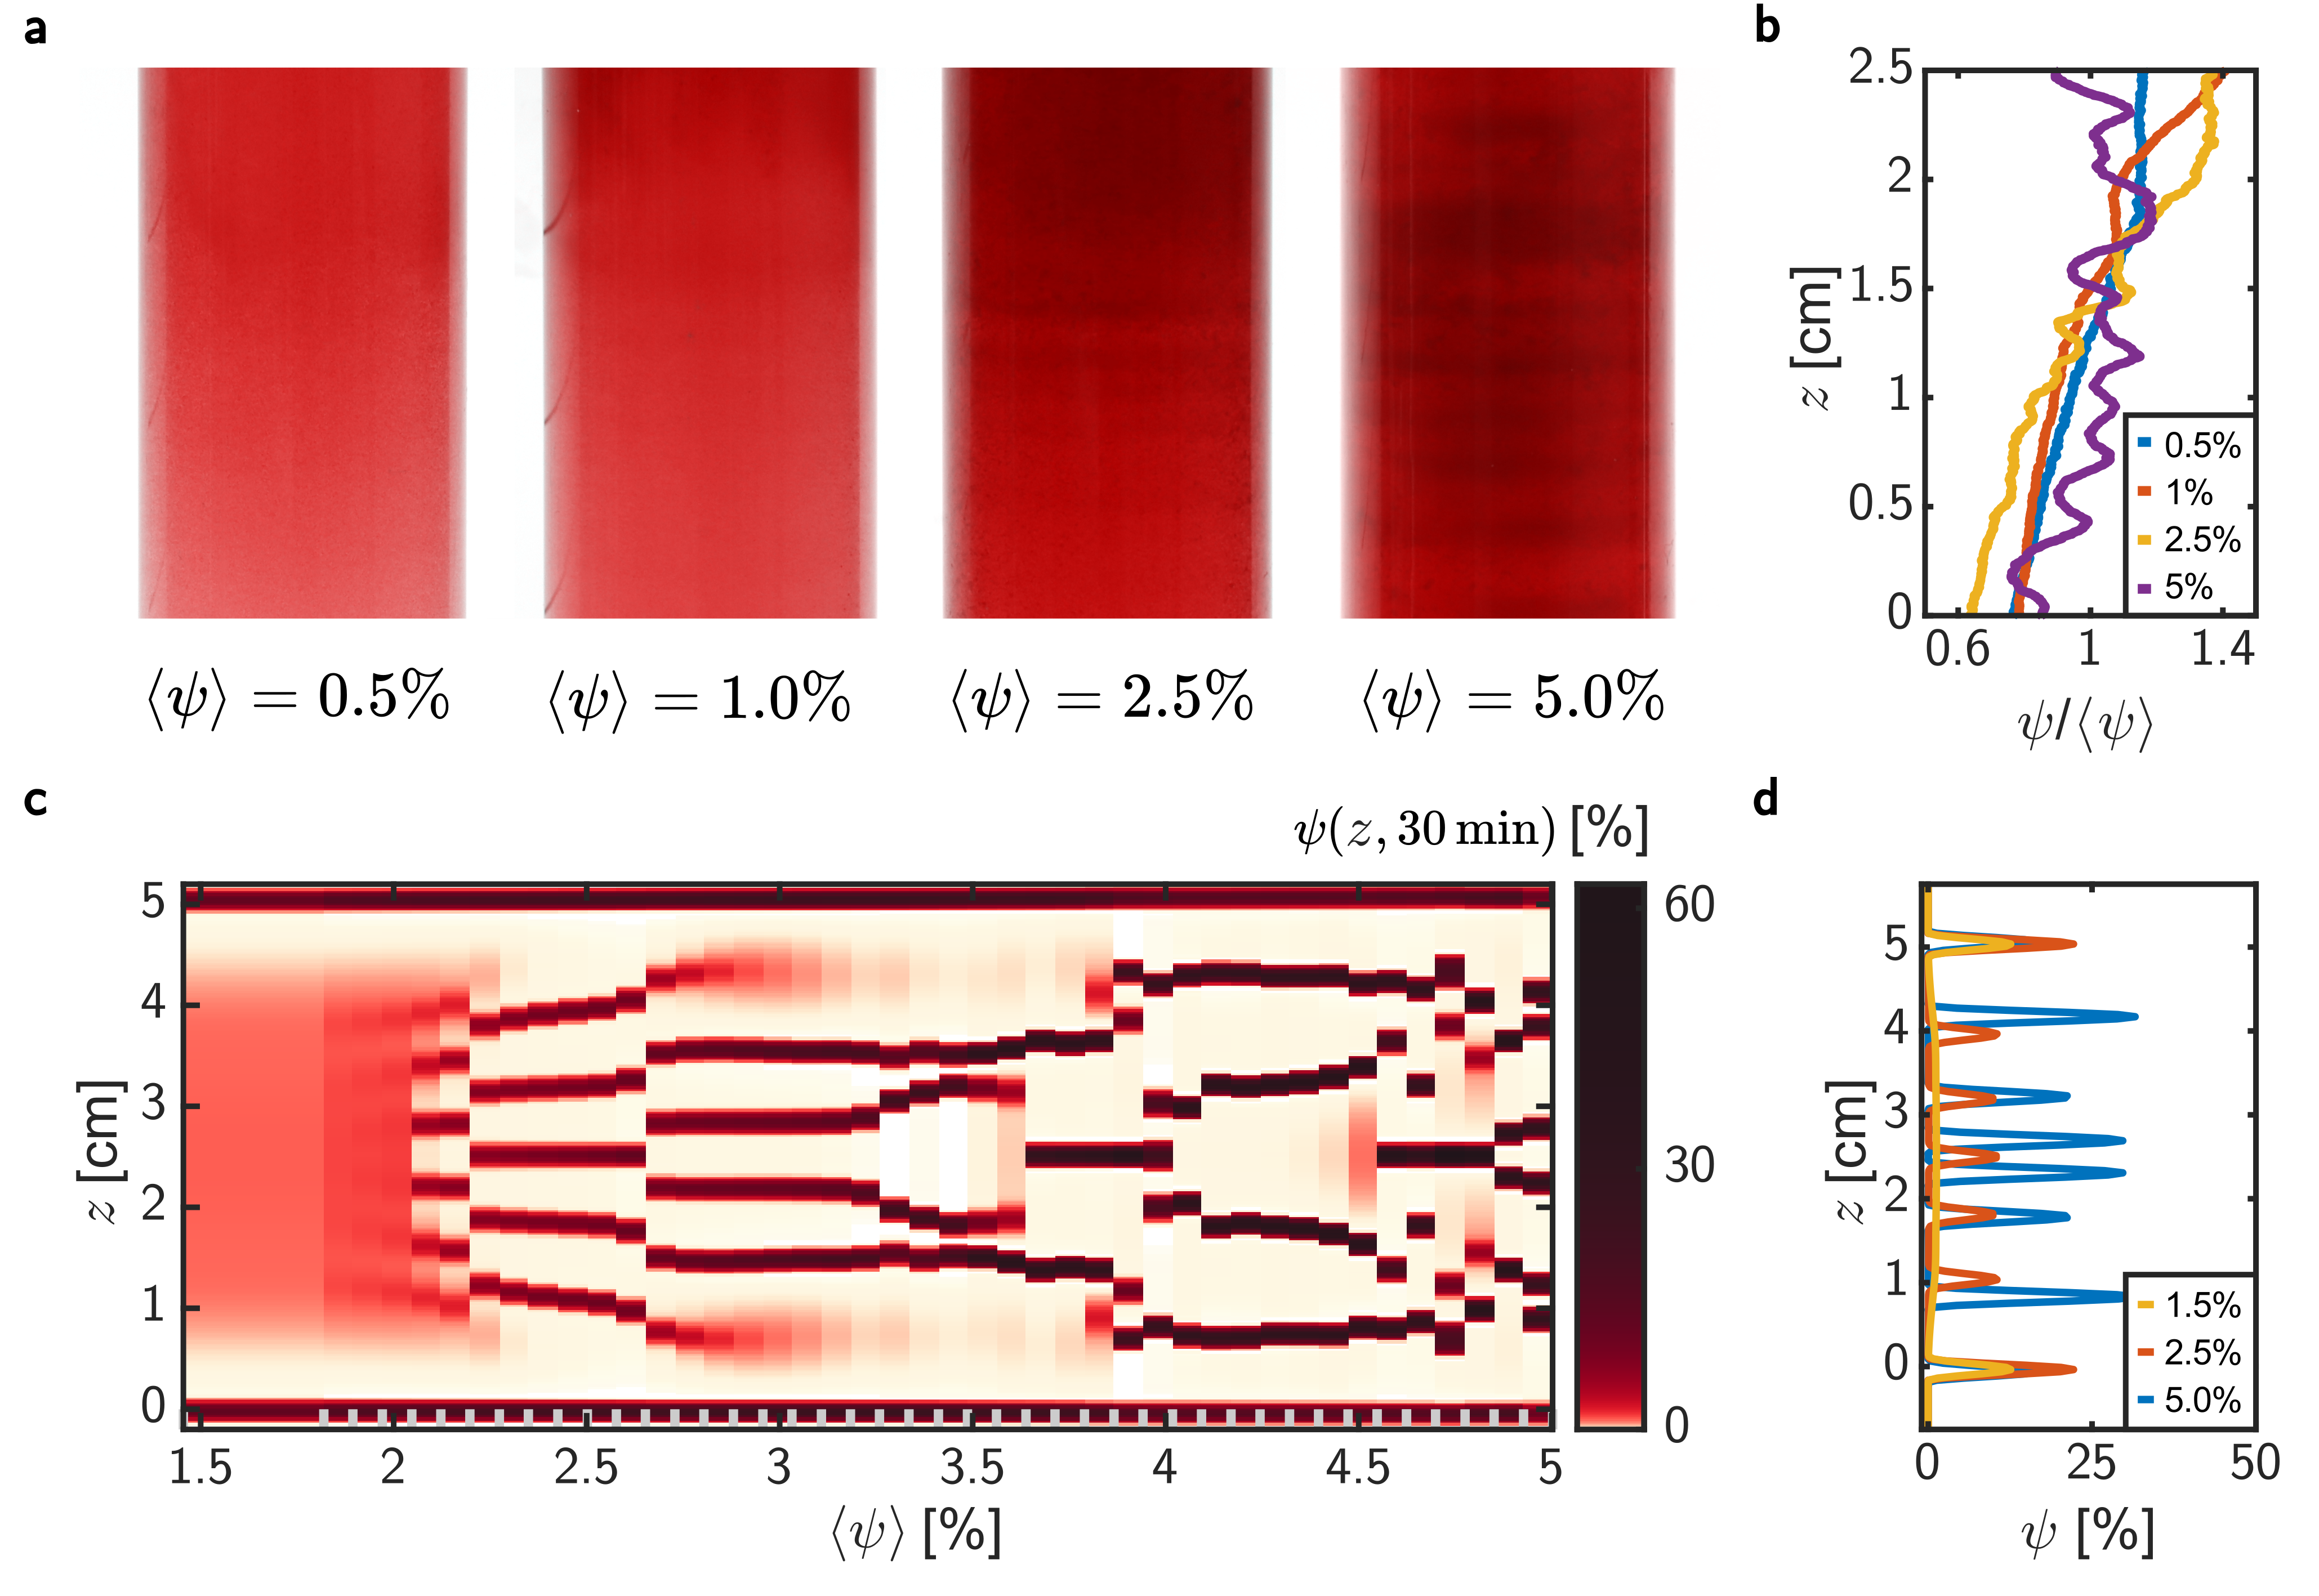
In a stable linear gradient, bands only appear above a critical concentration. Figure 4a shows the final cell distribution after centrifugation under the same conditions for different hematocrits . It reveals a complex branching behavior in which the number of bands might increase or decrease with increasing hematocrit. Figure 4c shows the simulation end state for different . The competition between buoyant forces and aggregation can therefore predict the emergence of various band patterns depending on the suspension properties and explains the high sensitivity of the band pattern on the experimental conditions.
In this study we proved that, when RBCs are placed in a density gradient, the assumption of an attractive pair interaction predicts band pattern formation in their spatial distribution, even if they have a monomodal and continuous mass density distribution. Our continuum model provides an explanation for the time evolution during centrifugation and final state of the RBC density function. This opens perspective to model and predict properties of RBCs based on the observation of their band patterns, which has the potential of contributing to and enhance diagnostic predictions [12]. Moreover, preparing determined density gradients might allow to determine conditions to obtain more sensitive and/or more reproducible protocols to obtain pattern formations, which can now be explained theoretically. In summary, this band pattern formation process is a novel physical mechanism generating pattern formation with a complex bifurcation diagram, whose comprehension presents an exciting new challenge for researchers in the field of soft matter and biophysics, with potential clinical applications.
Author Contribution Statement
FM, TJ, LK, CW and AD developed the scientific question. FM, TJ, and AD designed the research study, and developed the initial model and solver. CW and AD obtained research funds. FM and TJ designed the experimental protocols. FM developed, performed and supervised experiments. FM wrote the final version of the model and its numerical solver, debugged, maintained and performed numerical simulations. CR investigated the time dependency of the self-forming gradient. CR and NL performed experiments. FM gathered and organized all results. FM and AD wrote the first version of the manuscript. All authors interpreted the results and wrote or reviewed the manuscript. All authors have read and agreed to the published version of the manuscript.
Ackowledgements
A.D. acknowledges funding by the Young Investigator Grant of the Saarland University. We gratefully acknowledge the computing time granted on the supercomputer MOGON II at JGU as part of NHR South-West (nhrsw.de) [36].
1 Ethical statement
Human blood withdrawal from healthy volunteers was performed after explicitly obtaining their informed consent. Blood withdrawal and handling were performed according to the declaration of Helsinki and the approval by the ethics committee ”Aerztekammer des Saarlandes” (reference No 176/21).
References
- \bibcommenthead
- Mateyko and Kopac [1996] Mateyko, G.M., Kopac, M.J.: Part II: Isopyknotic Cushioning During High-Speed Centrifugation. Annals of the New York Academy of Sciences 105(4), 219–285 (1996) https://doi.org/10.1111/j.1749-6632.1963.tb42980.x
- Pertoft and Laurent [1977] Pertoft, H., Laurent, T.C.: Isopycnic Separation of Cells and Cell Organelles by Centrifugation in Modified Colloidal Silica Gradients. In: Catsimpoolas, N. (ed.) Methods of Cell Separation, pp. 25–65. Springer US, Boston, MA (1977). https://doi.org/10.1007/978-1-4684-0820-1_2
- H. Pertoft and Kagedal [1978] H. Pertoft, T.L. T. C. Laurent, Kagedal, L.: Density Gradients Prepared from Colloidal Silica Particles Coated by Polyvinylpyrrolidone (Percoll). Analytical Biochemistry 88, 271–282 (1978) https://doi.org/10.1016/0003-2697(78)90419-0
- GE Healthcare [2007] GE Healthcare: Cell Separation Media, Methodology and Applications. (2007). GE Healthcare. https://www.lobov.com.ar/downloads/Handbook%20Cell%20Separation.PDF
- Vettore et al. [1980] Vettore, L., De Matteis, M.C., Zampini, P.: A new density gradient system for the separation of human red blood cells. American Journal of Hematology 8(3), 291–297 (1980) https://doi.org/10.1002/ajh.2830080307
- Lutz et al. [1992] Lutz, H.U., Stammler, P., Fasler, S., Ingold, M., Fehr, J.: Density separation of human red blood cells on self forming percoll gradients: Correlation with cell age. Biochimica et Biophysica Acta (BBA) - General Subjects 1116(1), 1–10 (1992) https://doi.org/10.1016/0304-4165(92)90120-J
- Wesseling et al. [2016] Wesseling, M.C., Wagner-Britz, L., Huppert, H., Hanf, B., Hertz, L., Nguyen, D.B., Bernhardt, I.: Phosphatidylserine Exposure in Human Red Blood Cells Depending on Cell Age. Cellular Physiology and Biochemistry 38(4), 1376–1390 (2016) https://doi.org/10.1159/000443081
- Makhro et al. [2017] Makhro, A., Kaestner, L., Bogdanova, A.: NMDA Receptor Activity in Circulating Red Blood Cells: Methods of Detection. In: Burnashev, N., Szepetowski, P. (eds.) NMDA Receptors vol. 1677, pp. 265–282. Springer New York, New York, NY (2017). https://doi.org/10.1007/978-1-4939-7321-7_15
- Kämpf et al. [2019] Kämpf, S., Seiler, E., Bujok, J., Hofmann-Lehmann, R., Riond, B., Makhro, A., Bogdanova, A.: Aging Markers in Equine Red Blood Cells. Frontiers in Physiology 10, 893 (2019) https://doi.org/10.3389/fphys.2019.00893
- Huisjes et al. [2020] Huisjes, R., Makhro, A., Llaudet-Planas, E., Hertz, L., Petkova-Kirova, P., Verhagen, L.P., Pignatelli, S., Rab, M.A.E., Schiffelers, R.M., Seiler, E., van Solinge, W.W., Corrons, J.-L.V., Kaestner, L., Mañú-Pereira, M., Bogdanova, A., van Wijk, R.: Density, heterogeneity and deformability of red cells as markers of clinical severity in hereditary spherocytosis. Haematologica 105(2), 338–347 (2020) https://doi.org/10.3324/haematol.2018.188151
- Bogdanova et al. [2020] Bogdanova, A., Kaestner, L., Simionato, G., Wickrema, A., Makhro, A.: Heterogeneity of Red Blood Cells: Causes and Consequences. Frontiers in Physiology 11, 392 (2020) https://doi.org/10.3389/fphys.2020.00392
- Sadafi et al. [2021] Sadafi, A., Makhro, A., Livshits, L., Navab, N., Bogdanova, A., Albarqouni, S., Marr, C.: Sickle Cell Disease Severity Prediction from Percoll Gradient Images using Graph Convolutional Networks (2021) https://doi.org/10.48550/arXiv.2109.05372 arXiv:2109.05372
- Maurer et al. [2022] Maurer, F., John, T., Makhro, A., Bogdanova, A., Minetti, G., Wagner, C., Kaestner, L.: Continuous Percoll Gradient Centrifugation of Erythrocytes—Explanation of Cellular Bands and Compromised Age Separation. Cells 11(8), 1296 (2022) https://doi.org/10.3390/cells11081296
- Ben Amar et al. [2023] Ben Amar, M., Ciarletta, P., Haas, P.A.: Morphogenesis in space offers challenges and opportunities for soft matter and biophysics. Communications Physics 6(1), 150 (2023) https://doi.org/10.1038/s42005-023-01242-9
- Cross and Hohenberg [1993] Cross, M.C., Hohenberg, P.C.: Pattern formation outside of equilibrium. Reviews of modern physics 65(3), 851 (1993) https://doi.org/10.1103/RevModPhys.65.851
- Newman and Comper [1990] Newman, S.A., Comper, W.D.: ‘generic’physical mechanisms of morphogenesis and pattern formation. Development 110(1), 1–18 (1990) https://doi.org/10.1242/dev.110.1.1
- Davies and Glykofrydis [2020] Davies, J.A., Glykofrydis, F.: Engineering pattern formation and morphogenesis. Biochemical Society Transactions 48(3), 1177–1185 (2020) https://doi.org/10.1042/BST20200013
- Tsai et al. [2020] Tsai, T.Y.-C., Sikora, M., Xia, P., Colak-Champollion, T., Knaut, H., Heisenberg, C.-P., Megason, S.G.: An adhesion code ensures robust pattern formation during tissue morphogenesis. Science 370(6512), 113–116 (2020) https://doi.org/10.1126/science.aba6637
- Sudderick and Glover [2024] Sudderick, Z.R., Glover, J.D.: Periodic pattern formation during embryonic development. Biochemical Society Transactions 52(1), 75–88 (2024) https://doi.org/10.1042/BST20230197
- Gao et al. [2023] Gao, S., Chang, L., Perc, M., Wang, Z.: Turing patterns in simplicial complexes. Physical Review E 107(1), 014216 (2023) https://doi.org/10.1103/PhysRevE.107.014216
- Turing [1990] Turing, A.M.: The chemical basis of morphogenesis. Bulletin of mathematical biology 52, 153–197 (1990) https://doi.org/10.1007/BF02459572
- Katz et al. [2024] Katz, L., Silva-Dias, L., Dolnik, M.: Turing patterns in the chlorine dioxide-iodine-malonic acid reaction–diffusion batch system. Journal of Chemical Education (2024) https://doi.org/10.1021/acs.jchemed.3c01208
- Bengfort et al. [2016] Bengfort, M., Malchow, H., Hilker, F.M.: The fokker–planck law of diffusion and pattern formation in heterogeneous environments. Journal of mathematical biology 73, 683–704 (2016) https://doi.org/10.1007/s00285-016-0966-8
- Carrillo et al. [2019] Carrillo, J.A., Craig, K., Yao, Y.: Aggregation-diffusion equations: dynamics, asymptotics, and singular limits. Active Particles, Volume 2: Advances in Theory, Models, and Applications, 65–108 (2019) https://doi.org/10.48550/arXiv.1810.03634
- Fagioli and Radici [2018] Fagioli, S., Radici, E.: Solutions to aggregation–diffusion equations with nonlinear mobility constructed via a deterministic particle approximation. Mathematical Models and Methods in Applied Sciences 28(09), 1801–1829 (2018) https://doi.org/10.48550/arXiv.1801.10114
- Charru [2011] Charru, F.: Hydrodynamic instabilities. Cambridge Texts in Applied Mathematics 37 (2011) https://doi.org/10.1017/CBO9780511975172
- Ecke [2015] Ecke, R.E.: Chaos, patterns, coherent structures, and turbulence: Reflections on nonlinear science. Chaos: An Interdisciplinary Journal of Nonlinear Science 25(9) (2015) https://doi.org/10.1063/1.4915623
- De Wit [2020] De Wit, A.: Chemo-hydrodynamic patterns and instabilities. Annual Review of Fluid Mechanics 52, 531–555 (2020) https://doi.org/10.1146/annurev-fluid-010719-060349
- Te Vrugt et al. [2020] Te Vrugt, M., Bickmann, J., Wittkowski, R.: Effects of social distancing and isolation on epidemic spreading modeled via dynamical density functional theory. Nature communications 11(1), 5576 (2020) https://doi.org/10.1038/s41467-020-19024-0
- Bogdanova and Kaestner [2020] Bogdanova, A., Kaestner, L.: Early career scientists’ guide to the red blood cell–don’t panic! Frontiers in physiology 11, 588 (2020)
- Weems and Lessin [1984] Weems, H.B., Lessin, L.S.: Erythrocyte Density Distribution in Sickle Cell Anemia. Acta Haematologica 71(6), 361–370 (1984) https://doi.org/10.1159/000206620
- Lew and Bookchin [2005] Lew, V.L., Bookchin, R.M.: Ion Transport Pathology in the Mechanism of Sickle Cell Dehydration. Physiological Reviews 85(1), 179–200 (2005) https://doi.org/10.1152/physrev.00052.2003
- Royall et al. [2007] Royall, C.P., Dzubiella, J., Schmidt, M., Van Blaaderen, A.: Nonequilibrium Sedimentation of Colloids on the Particle Scale. Physical Review Letters 98(18), 188304 (2007) https://doi.org/10.1103/PhysRevLett.98.188304
- Dzubiella and Likos [2003] Dzubiella, J., Likos, C.N.: Mean-field dynamical density functional theory. Journal of Physics: Condensed Matter 15(6), 147–154 (2003) https://doi.org/10.1088/0953-8984/15/6/102
- [35] Maurer, F.: NVCC implementation of Red Blood Cell pattern formation in a density gradient during sedimentation. https://github.com/FelixMaurer/RedPatterns
- [36] Mainz, J.G.U.: NHR Süd-West. https://hpc.uni-mainz.de/category/nhr-sued-west/