11email: shuji@dtu.dk 22institutetext: DTU Space, Technical University of Denmark, Elektrovej 327, DK-2800 Kgs. Lyngby, Denmark 33institutetext: Leiden Observatory, Leiden University, P.O. Box 9513, 2300 RA Leiden, The Netherlands 44institutetext: Niels Bohr Institute, University of Copenhagen, Jagtvej 128, DK-2200 Copenhagen, Denmark 55institutetext: The University of Texas at Austin, 2515 Speedway Blvd Stop C1400, Austin, TX 78712, USA 66institutetext: Kapteyn Astronomical Institute, University of Groningen, 9700 AV Groningen, The Netherlands 77institutetext: Space Telescope Science Institute, 3700 San Martin Drive, Baltimore, MD 21218, USA 88institutetext: European Southern Observatory (ESO), Karl-Schwarzschild-Strasse 2, Garching 85748, Germany 99institutetext: Université Paris-Saclay, Université Paris Cité, CEA, CNRS, AIM, 91191 Gif-sur-Yvette, France 1010institutetext: Instituto de Física, Pontificia Universidad Católica de Valparaíso, Casilla 4059, Valparaíso, Chile 1111institutetext: Caltech/IPAC, MS 314-6, 1200 E. California Blvd. Pasadena, CA 91125, USA 1212institutetext: Laboratory for Multiwavelength Astrophysics, School of Physics and Astronomy, Rochester Institute of Technology, 84 Lomb Memorial Drive, Rochester, NY 14623, USA 1313institutetext: Max-Planck-Institut für Astronomie, Königstuhl 17, 69117 Heidelberg, Germany 1414institutetext: Hiroshima Astrophysical Science Center, Hiroshima University, 1-3-1 Kagamiyama, Higashi-Hiroshima, Hiroshima 739-8526, Japan 1515institutetext: National Astronomical Observatory of Japan, 2-21-1, Osawa, Mitaka, Tokyo, Japan 1616institutetext: Purple Mountain Observatory, Chinese Academy of Sciences, 10 Yuanhua Road, Nanjing 210023, China 1717institutetext: University of Bologna, Department of Physics and Astronomy (DIFA), Via Gobetti 93/2, I-40129, Bologna, Italy 1818institutetext: INAF - Osservatorio di Astrofisica e Scienza dello Spazio, via Gobetti 93/3 - 40129, Bologna - Italy
A photo- cautionary tale: Redshift confirmation of COSBO-7 at
Photometric redshifts are widely used in studies of dusty star-forming galaxies (DSFGs), but catastrophic photo- failure can undermine all redshift-dependent results. Here we report the spectroscopic redshift confirmation of COSBO-7, a strongly lensed DSFG in the COSMOS-PRIMER field. Recently, using 10 bands of JWST NIRCam and MIRI imaging data on COSBO-7, Ling et al. (2024) reported a photometric redshift solution of , favored by four independent spectral energy distribution (SED) fitting codes, and therefore providing an appealing candidate of the most distant massive DSFG. This photo- solution was also supported by a single line detection in ALMA Band 3 consistent with CO(7-6) at . However, our new ALMA observations robustly detect two lines in Band 6 identified as CO(7-6) and [CI](2-1) at , and thus the Band 3 line as CO(3-2). The three robust line detections decidedly place COSBO-7 at , refuting the photo- solution. We derive physical parameters by fitting NIR-to-mm photometry and lens modeling, revealing that COSBO-7 is a main-sequence galaxy. We examine possible reasons for this photo- failure and attribute it to (1) the likely underestimation of photometric uncertainty at 0.9 m, and (2) the lack of photometry at wavelengths beyond 20 m. Notably, we recover a bona-fide by including the existing MIPS m photometry, demonstrating the critical importance of mid-infrared data for photo- robustness. This work highlights a common challenge in modeling SEDs of DSFGs, cautioning against the reliability of photometric redshifts, as well as pseudo-spectroscopic redshifts based on single line detection.
Key Words.:
Galaxies: high-redshift – infrared: galaxies – galaxies: submillimeter – individual: COSBO-71 Introduction
Redshift is one of the most important parameters of galaxies, and determining the redshifts is the first and most critical step to reveal their nature. To date, the most distant galaxies have been confirmed at (Carniani et al., 2024) by spectroscopy from the James Webb Space Telescope (JWST). For dusty star-forming galaxies (DSFGs), given severe dust attenuation and extreme faintness in optical and near-infreared wavelengths (e.g., Wang et al. 2019; Smail et al. 2021), detecting molecular and neutral line features in (sub)mm wavelengths is more efficient for confirming their redshifts. Thanks to the advanced (sub)mm interferometers, for instance, Atacama Large Millimeter Array (ALMA) and Northern Extended Millimeter Array (NOEMA), distant DSFGs have been spectroscopically confirmed at and out to the epoch of reionization (EoR, , e.g., Walter et al., 2012; Vieira et al., 2010, 2013; Riechers et al., 2013, 2017; Strandet et al., 2017; Zavala et al., 2018; Marrone et al., 2018; Endsley et al., 2022; Fudamoto et al., 2021; Hygate et al., 2023; Rowland et al., 2024), proving these facilities to be a powerful “redshift machine” (Vieira et al., 2013; Neri et al., 2020; Chen et al., 2022; Cox et al., 2023).
However, spectroscopy of DSFGs remains observationally expensive, which limits the size and completeness of current spec- samples. Alternatively, photometric redshifts are widely used and dominate in literature studies of DSFGs (e.g., Wang et al. 2019; Gómez-Guijarro et al. 2019; Dudzevičiūtė et al. 2020; Smail et al. 2021), which estimate the redshifts by modeling spectral energy distributions (SEDs) with optical and near-infrared photometry (e.g., Arnouts et al. 1999; Ilbert et al. 2006; da Cunha et al. 2008; Brammer et al. 2008; Kriek et al. 2009; Carnall et al. 2018; Boquien et al. 2019). In comparison to dust-free galaxies, constraining the redshifts of DSFGs is particaularly challenging because of severe dust attenuation. Nowadays, the situation has been dramatically improved with the data from JWST. With its unprecedented sensitivity and long-wavelength coverage, photometric redshifts have been estimated out to for dust-free galaxies (e.g., Naidu et al. 2022; Finkelstein et al. 2022; Harikane et al. 2023; Atek et al. 2023; Casey et al. 2024; Chakraborty et al. 2024), and for DSFGs (e.g., Barrufet et al. 2023; Akins et al. 2023). Nevertheless, photometric redshifts can still fail catastrophically for dust-free galaxies even with multi-band JWST photometry. For example, the galaxy CEERS-93316 was reported with a photometric redshift by fitting SED with seven bands of JWST NIRCam photometry (Donnan et al., 2023), but was eventually confirmed to be a dusty galaxy by JWST NIRSpec spectroscopy (Arrabal Haro et al., 2023), showcasing that dusty starbursts can masquerade as ultra-high redshift galaxies (Zavala et al., 2023; Naidu et al., 2022). As the misidentification of photo- can undermine all results dependent on redshift, it is vital to examine whether such photo- failure can also happen for DSFGs pre-selected from (sub)millimetre surveys.
Recently, a DSFG candidate, COSBO-7, was reported by Ling et al. (2024) using exquisite imaging data from JWST. Ling et al. (2024) performed extensive imaging fitting and SED analysis using the JWST NIRCam and MIRI data, and found it is not detected in NIRCam/F090W but well detected in nine bands from NIRCam/F115W to MIRI/F1800W. Using the photometry measured on the lens-subtracted images, they calculated photometric redshifts of , with a best-fit solution agreed on by four SED algorithms: LePhare (Ilbert et al., 2006), EAZY (Brammer et al., 2008), Bagpipes (Carnall et al., 2018), and CIGALE (Boquien et al., 2019). This makes COSBO-7 an appealing candidate of the most distant DSFG. Later on, in an updated version Ling et al. (2024) reported a line detection at 95.4 GHz in ALMA archival data, that would be consistent with CO(7-6) emission at , i.e. at a redshift very close to the solution. Nevertheless, robust spectroscopic confirmation with multiple lines was still missing.
In this Letter, we report unambiguous spectroscopic redshift confirmation of COSBO-7 and discuss the implications and lessons learned for photometric redshift estimates. We adopt a flat CDM cosmology with km s-1 Mpc-1, , and a Chabrier initial mass function (Chabrier, 2003).
2 Selection and Data
2.1 Selection
COSBO-7 (RA 10:00:23.97, Dec +02:17:50.0) was originally discovered in a flux limited IRAM/MAMBO-2 1.2mm imaging survey by Bertoldi et al. (2007). It is one of the brightest submm sources in the COSMOS field, and is also detected in the AzTEC and SCUBA-2 surveys ( mJy, mJy; Aretxaga et al. 2011; Geach et al. 2017; Simpson et al. 2019). COSBO-7 is not detected in deep HST images of the COSMOS-CANDELS field, indicating an extreme dust-obscured nature. A secure counterpart of COSBO-7 was firstly identified in radio wavelengths at VLA 1.4 GHz and 3 GHz (Schinnerer et al., 2010; Smolčić et al., 2017). It was identified as a lensing system by Jin et al. (2018), in which a high-z submillimeter galaxy is lensed by a foreground elliptical galaxy at . Recently, COSBO-7 was observed with JWST/NIRCam and MIRI as part of the PRIMER survey (Dunlop et al., 2021). The MIRI image clearly reveals a lensing arc in the MIRI 7.7m band while a counterimage is found on the ALMA 870m map (Pearson et al., 2024), confirming the strong lensing nature of the system. Ling et al. (2024) performed an extensive photometric analysis of COSBO-7 by exploiting the JWST imaging data from NIRCam F090W to MIRI F1800W band after subtracting the foreground lens. They found that COSBO-7 remains undetected in F090W, but is well detected in nine bands from F115W to F1800W. With the JWST photometry, Ling et al. (2024) performed SED fitting using four SED codes that all converged to a photo- solution of .
2.2 ALMA
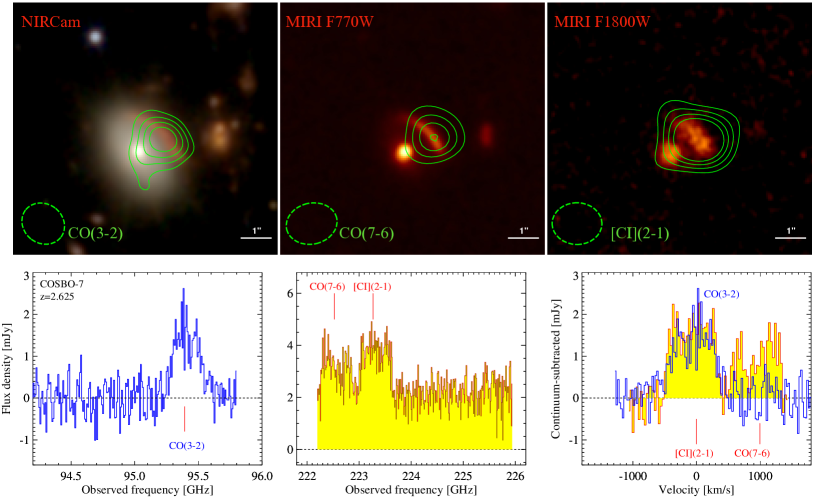
The first spectroscopic follow-up of COSBO-7 was carried out with ALMA Band 3 line scans in Cycle 9 (ID:2022.1.00863.S; PI: J. Hodge), as part of a redshift scan program for 10 radio-selected, optically dark DSFGs. A strong line was detected at 95.4 GHz (Fig. 1, bottom-left), however the single line detection was insufficient to pin down the redshift of the source. Driven by the photometric redshift in Ling et al. (2024), it was reasonable to postulate that the 95.4 GHz line originates from CO(7-6) emission at . Further, the solution was also supported by series of indirect evidence: (1) a tentative line at 95.7 GHz, consistent with [CI](2-1) emission at ; (2) F410M excess, indicative of [OIII]+H emission at ; (3) MIPS 24 excess that is consistent with 3.3m polycyclic aromatic hydrocarbon (PAH) feature at ; (4) well-fitted panchromatic SED from NIR to radio wavelengths. However, without a robust detection of a second line, the redshift of the source remained ambiguous. Consequently, we proposed 0.5 hrs of ALMA Band 6 observations through DDT time, aiming to detect [CII]158m and decidedly determine the redshift of COSBO-7.
The DDT program (ID: 2023.A.00021.S; PI: S. Jin) was approved and the observation was executed on March 21 2024 in C-1 configuration. The frequency tunning covers 222.18–225.94 GHz for lines and 235.60–239.48 GHz for continuum. The on-source integration is 15 mins, and self-calibration was performed. This gives a rms sensitivity of 0.107 mJy/beam per 500 km s-1, and a beam size of with natural weighting.
The raw data of the ALMA programs mentioned above were reduced and calibrated using the standard ALMA CASA pipeline (McMullin et al., 2007). Following our established pipeline from Jin et al. (2019, 2022), we converted the calibrated measurement sets to uvfits format for further analysis in space with the GILDAS software. The 1D spectrum was extracted using the GILDAS uvfit routine on the tables at all frequencies, where we adopted a point source model on the fixed position of the ALMA continuum peak. The continuum and line maps are cleaned using the GILDAS HOGBOM clean routine. Given that COSBO-7 is resolved in the ALMA data, we measure the continuum and integrated line fluxes on the clean images using an aperture of that maximizes the integrated S/Ns. We also measured the photometry in ALMA Band 4 (ID: 2021.1.00705.S; PI: O. Cooper), and adopted 870m photometry in A3COSMOS catalog (Liu et al., 2019) measured from Band7 data (ID: 2016.1.00463.S, PI: Y. Matsuda). We list the line fluxes in Table 1 and continuum fluxes in Table 2.
2.3 JWST
COSBO-7 was observed with JWST NIRCam and MIRI in 10 bands: F090W, F115W, F150W, F200W, F277W, F356W, F410M and F444W in near-infrared (NIR), and F770W and F1800W in mid-infrared (MIR). Ling et al. (2024) modeled the foreground lens using Galfit and measured the photometry on the lens-subtracted residual images. The lens is well modeled so that the counter image of the arc is recovered in the residual map. The photometry was carefully measured on the PSF-matched and aperture-matched residual images, hence we directly adopt the photometry from Ling et al. (2024). As Ling et al. (2024) measured upper limits of F090W using two different apertures, we adopted the flux limit measured within the larger aperture, but use the limit in this work for reasons discussed in Sect. 4.1. For visualization and lensing modeling, we use the PRIMER mosaics produced by M. Franco and S. Harish from the COSMOS-Web team (Casey et al., 2023).
2.4 Ancillary data
The FIR and radio photometry of COSBO-7 was already measured in the COSMOS Super-deblended catalog (Jin et al., 2018). However, the Herschel photometry is noisy because too many priors were fitted within the Herschel beams, i.e., it suffers high crowdedness. The ALMA data shows that COSBO-7 is the only submm emitting source within the ALMA Band 7 () and Band 3 primary beam (), indicating negligible blending and contribution from neighbouring sources. Hence, we re-run our Super-deblending pipeline with improved priors on Herschel maps as done in Sillassen et al. (2024), assuming that COSBO-7 is the only source contributing to the Herschel fluxes. As listed in Table 2, the newly measured Herschel photometry shows solid detection in the PACS 160m and the SPIRE bands (Fig. 2).
3 Results
3.1 Redshift confirmation
As shown in the bottom-middle panel of Fig. 1, the DDT program did not detect any line at the expected frequency 224.7 GHz of [CII] at . Instead, and quite surprisingly, two lines are solidly detected at 222.52 GHz and 223.27 GHz with S/N and 23, respectively (Fig. 1). The two lines perfectly match the CO(7-6) and [CI](2-1) transitions at . Moreover, the 95.4 GHz line is also fitted at the exact frequency of CO(3-2). Further, the line widths of the [CI] and CO lines are also consistent with a full width at zero intensity FWZI850 km s-1 (Fig. 1, bottom-right). Therefore, the three solid line detections unambiguously pin down the redshift of COSBO-7 at instead of .
| ID | COSBO-7 |
|---|---|
| RA | 10:00:23.97 |
| Dec | +02:17:50.0 |
| [Jy km s-1] | |
| [Jy km s-1] | |
| [Jy km s-1] | |
| [mag] | |
| [] | |
| [] | |
| [] | |
| [] | |
| [K] | |
| [] | |
| [K] | |
| [] |
Notes: These parameters are not corrected for magnification .
3.2 Physical properties and lensing model
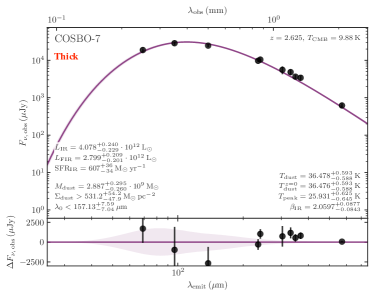
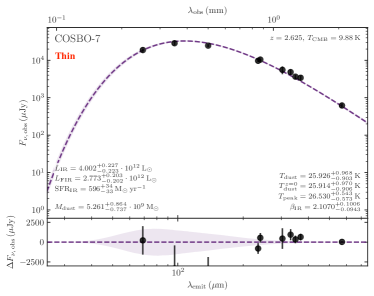
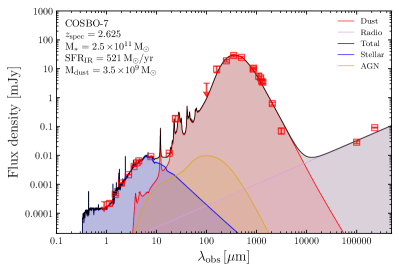
With the confirmed , we derive physical parameters of COSBO-7 by SED fitting with multi-wavelength photometry. As shown in Fig. 2, the SED is well fitted from NIR to radio wavelengths using Stardust (Kokorev et al., 2021). Specifically, the MIPS 24m excess is well fitted by strong PAH features at rest-frame m, while the mid-IR AGN contribution to the total IR luminosity is negligible (). We report the best-fit parameters in Fig. 2 and Table 1. We note that the 3mm continuum is not fitted well by Stardust, which suggests a steep slope or optically thick dust in FIR (Jin et al., 2022). We thus performed FIR SED fitting with modified blackbody models, using the Mercurius code (Witstok et al., 2022) accounting for both cases of optically thin and thick dust in FIR (Jin et al., 2022). As shown in Fig. 4, the optically thick model performs slightly better than the thin ones, yielding a dust temperature of K and a dust mass of . The dust temperature is consistent with the relation of main-sequence galaxies in Schreiber et al. (2018).
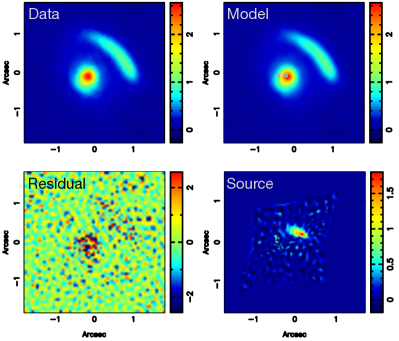
To constrain the magnification , we performed lens modeling of the F777W image by adopting the methodology in Vegetti & Koopmans (2009) and Rizzo et al. (2018). As shown in Fig. 5, the lensing arc is well modeled with a magnification factor of . This magnification is consistent with the result in Pearson et al. (2024) using F777W data, but slightly higher than that in Ling et al. (2024) based on the F444W image.
We derive the molecular gas mass using [CI](2-1) and CO(3-2) as gas tracers: (1) Adopting a (Jiao et al., 2019), assuming the excitation we obtained a gas mass of using the scaling relation in Valentino et al. (2018); (2) Assuming a CO line ratio from Riechers et al. (2020), we obtain a CO(1-0) luminosity of K km s-1 pc2, which gives a gas mass of , or . The CO-derived gas masses agree with within the uncertainty of . As both and are uncertain, we simply adopted and derived a median gas depletion time Gyr with a lower limit Myr. This indicates that COSBO-7 is a gas-rich galaxy with a typical star formation efficiency (SFE) of main-sequence galaxies (Sargent et al., 2014; Magdis et al., 2012, 2017). Accounting for the lensing magnification, the stellar mass and SFR of COSBO-7 are consistent the main-sequence at (Schreiber et al., 2017). This again suggests that COSBO-7 is a typical dusty star-forming galaxy at (e.g., da Cunha et al. 2015).
4 Discussion
4.1 Why did the photo- fail catastrophically?
The robust for COSBO-7 derived in this study indicates that the photo- is a catastrophic failure and highlights that caution should be exercised in studies of DSFGs that rely on photometric redshifts. Here we attempt to uncover the reasons behind the photo- failure and how to see through similar “cosmic conspiracies”.
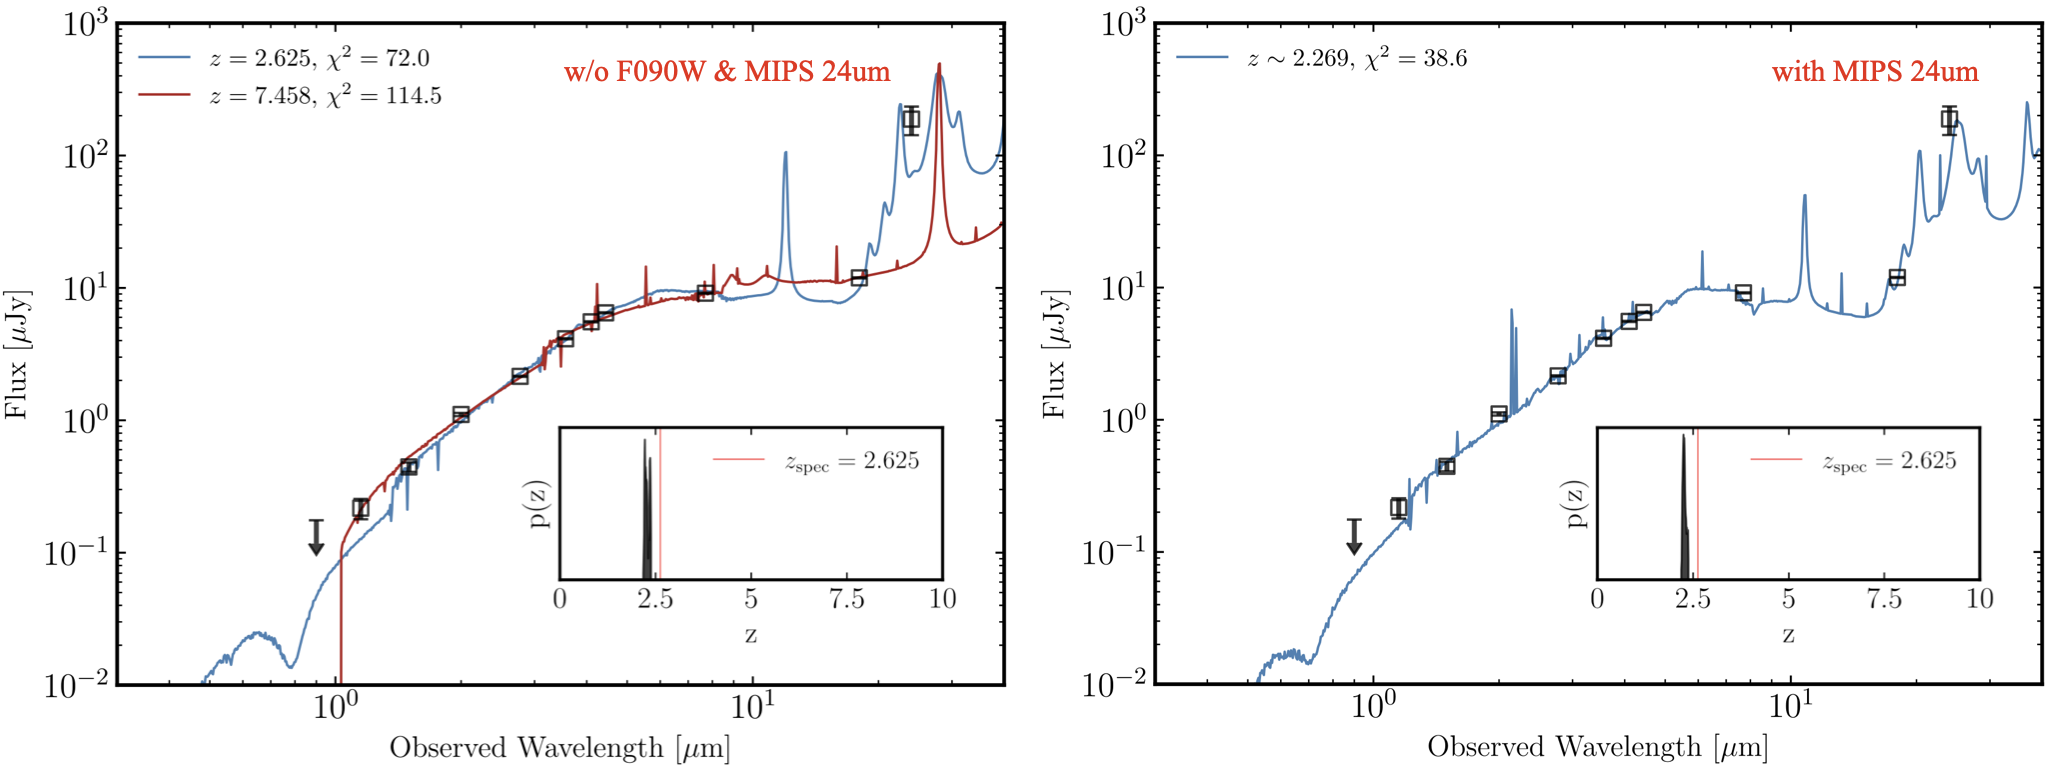
Interestingly, we found that the redshift probability distribution function PDF() in Ling et al. (2024) indeed shows an insignificant peak at from EAZY and CIGALE results. As already tested by Ling et al. (2024), the PDF() at became dominant if adopting the limit of with EAZY, CIGALE and Bagpipes. On the other hand, Ling et al. (2024) performed SED fitting with two different F090W upper limits, in which one is the average depth of the image measured in a aperture, and the other one is a limit measured within the aperture used for the arc. They found that in either case the best PDF() solution remains peaked at , i.e., adjusting the F090W upper limit with a large aperture appears not improving the photo- outputs. We also tested with EAZY by adopting the F090W upper limit, and found the best-fit output remains , consistent with Ling et al. (2024). Therefore, the failure is likely due to the unusual SED of COSBO-7. As shown in the left panel of Fig. 3, we tested fitting NIR-to-MIR SEDs at both and . We found the SED can be fitted at both redshifts, with a subtle difference in the values between the two solutions. In fact the is slightly lower at , while the F150W photometry is better modelled by the solution. This indicates that the NIR-to-MIR photometry is fully degenerate between and . It is unclear what causes this degeneracy. Given that COSBO-7 is a strongly lensed system and shows potentially optically thick dust, either differential magnification or an unconventional attenuation law could result in a peculiar SED shape that cannot be modeled by literature SED templates. Further, we test Bagpipes fitting without the F090W upper limit. Interestingly, we found that the PDF() peaks at without a secondary solution at , as in the left panel of Fig. 3. This photo- is close to the , and consistent within a typical uncertainty of . This well-recovered photo- suggests that the F090W flux limit in Ling et al. (2024) might have been underestimated. We note that the F090W limit in Fig. 3 is a upper limit, which is well above the best-fit models of either or , while Ling et al. (2024) adopted a more strict upper limit. This stringent upper limit likely forced the templates to interpret the data at m as a Lyman Break at , while excluding solutions at lower redshifts.
Given that the 24m flux density is higher than the F1800W one, we suspected that such an excess boosted by PAH emission might be useful to improve the photo- quality. Therefore, we tested fitting the SED by including the MIPS 24m photometry Jy measured by Jin et al. (2018). Strikingly, this yields again a (Fig. 3, right), and the is 2 times smaller than that of the fitting at fixed without 24m. This is evident in the left panel of Fig. 3: the 24m data point is difficult to be fitted by the narrow rest-frame 3.3m PAH at , while it is more favourable with the broad PAH features at rest-frame 6–8m. Therefore, the inclusion of m photometry can directly exclude the deceiving solution without fine-tuning any fluxes and flux uncertainties in Ling et al. (2024), which is a straightforward remedy for the photo- of COSBO-7 and possibly similar objects. This demonstrates that long-wavelength MIR photometry can significantly improve the photo- of DSFGs.
4.2 Caution on photo-
As COSBO-7 is a strongly lensed galaxy with multi-wavelength JWST photometry spanning NIR to MIR, it is alarming that the photo- failed dramatically and undermined physical parameters relying on it. Given that COSBO-7 is a typical DSFG at , such photo- failure could occur in other galaxies. As depicted by the PDF() of COSBO-7 in Ling et al. (2024), there is no visible peaks at from LePhare and from Bagpipes, however, the statistically disfavored peak around from EAZY and CIGALE is eventually proven to be closer to the real solution. This highlights that caution should be exercised when interpreting the output of photo- codes and low- solutions that appear statistically insignificant in the PDF() cannot be ruled out.
As tested in Sect. 4.1, it is also remarkable that a subtle adjustment on the F090W upper limit can tremendously impact the robustness of the photo-. Finally, it is also clear that a combination of photo- with a single line detection in the mm might not be sufficient for a robust determination of the redshift of DSFGs, especially if the emission line is consistent with multiple solutions. In fact, this combination entails the danger of providing a deceiving preference towards the most exotic, and thus less likely, solution. We recall that Ling et al. (2024) did put cautionary remarks on the solution and pointed out that low-z solutions cannot be totally ruled out, although their work only shows that high-z solutions are favored.
It is unclear whether COSBO-7 is a rare case or whether similar catastrophic photo- failures are common among DSFGs. A large sample is required to statistically quantify such cases. If the failure is statistically significant, literature studies relying purely on photo-, and pseudo-spectroscopic redshifts from single line detection, would need to be revised.
5 Conclusions
Using ALMA observations, we confirmed the DSFG candidate COSBO-7 to be at . Our conclusions are as follows:
1. We solidly detect three lines and identify them as CO(3-2), CO(7-6), and [CI](2-1) at , hence robustly confirming the redshift of COSBO-7. This is in tension with the photometric redshift of reported in Ling et al. (2024).
2. With the confirmed redshift, we derive physical parameters for COSBO-7 and find it to be a main-sequence galaxy with possible optically thick dust.
3. We examine possible explanations for the catastrophic photo- failure, and attribute it to (1) the likely underestimation of the F090W upper limit, and (2) the lack of photometry at wavelengths beyond 20m to sample the PAH features at .
4. Notably, we recovered a nearly accurate by including the MIPS 24m photometry without applying further changes with respect to the literature photometry. This provides a straightforward remedy for the photo-, and demonstrates the importance of long-wavelength MIR data to photo- robustness.
This work highlights a common challenge in modeling SEDs of DSFGs, cautioning against the reliability of photometric redshifts and redshifts relying on single line detection. Long-wavelength MIR photometry can significantly improve the photo- quality, which encourages the use of MIPS or MIRI 24m in SED fitting. However, even with this additional sampling, the photo- accuracy is still dependent on certain spectral features being sufficiently dominant. As such, detecting multiple lines remains the only way to unambiguously identify redshifts of DSFGs, and the future broadband upgrade of ALMA will turn it into an even more powerful ”redshift machine”.
Acknowledgements.
We thank Haojing Yan, Emanuele Daddi and Jorge Zavala for helpful discussions in the preparation of this manuscript. This paper makes use of the following ALMA data: ADS/JAO.ALMA 2023.A.00021, 2022.1.00863, 2021.1.00705.S, and 2016.1.00463.S. ALMA is a partnership of ESO (representing its member states), NSF (USA) and NINS (Japan), together with NRC (Canada), NSTC and ASIAA (Taiwan), and KASI (Republic of Korea), in cooperation with the Republic of Chile. The Joint ALMA Observatory is operated by ESO, AUI/NRAO and NAOJ. SJ acknowledges financial support from the European Union’s Horizon Europe research and innovation program under the Marie Skłodowska-Curie grant No. 101060888. JH acknowledges support from the ERC Consolidator Grant 101088676 (VOYAJ). GEM and SJ acknowledge the Villum Fonden research grants 37440 and 13160. The Cosmic Dawn Center (DAWN) is funded by the Danish National Research Foundation under grant DNRF140. APV acknowledges support from the Carlsberg Foundation (grant no CF20-0534).References
- Akins et al. (2023) Akins, H. B., Casey, C. M., Allen, N., et al. 2023, ApJ, 956, 61
- Aretxaga et al. (2011) Aretxaga, I., Wilson, G. W., Aguilar, E., et al. 2011, MNRAS, 415, 3831
- Arnouts et al. (1999) Arnouts, S., Cristiani, S., Moscardini, L., et al. 1999, MNRAS, 310, 540
- Arrabal Haro et al. (2023) Arrabal Haro, P., Dickinson, M., Finkelstein, S. L., et al. 2023, Nature, 622, 707
- Atek et al. (2023) Atek, H., Shuntov, M., Furtak, L. J., et al. 2023, MNRAS, 519, 1201
- Barrufet et al. (2023) Barrufet, L., Oesch, P. A., Weibel, A., et al. 2023, MNRAS, 522, 449
- Bertoldi et al. (2007) Bertoldi, F., Carilli, C., Aravena, M., et al. 2007, ApJS, 172, 132
- Boquien et al. (2019) Boquien, M., Burgarella, D., Roehlly, Y., et al. 2019, A&A, 622, A103
- Brammer et al. (2008) Brammer, G. B., van Dokkum, P. G., & Coppi, P. 2008, ApJ, 686, 1503
- Carnall et al. (2018) Carnall, A. C., McLure, R. J., Dunlop, J. S., & Davé, R. 2018, MNRAS, 480, 4379
- Carniani et al. (2024) Carniani, S., Hainline, K., D’Eugenio, F., et al. 2024, arXiv e-prints, arXiv:2405.18485
- Casey et al. (2024) Casey, C. M., Akins, H. B., Shuntov, M., et al. 2024, ApJ, 965, 98
- Casey et al. (2023) Casey, C. M., Kartaltepe, J. S., Drakos, N. E., et al. 2023, ApJ, 954, 31
- Chabrier (2003) Chabrier, G. 2003, PASP, 115, 763
- Chakraborty et al. (2024) Chakraborty, P., Sarkar, A., Wolk, S., et al. 2024, arXiv e-prints, arXiv:2406.05306
- Chen et al. (2022) Chen, C.-C., Liao, C.-L., Smail, I., et al. 2022, ApJ, 929, 159
- Cox et al. (2023) Cox, P., Neri, R., Berta, S., et al. 2023, A&A, 678, A26
- da Cunha et al. (2008) da Cunha, E., Charlot, S., & Elbaz, D. 2008, MNRAS, 388, 1595
- da Cunha et al. (2015) da Cunha, E., Walter, F., Smail, I. R., et al. 2015, ApJ, 806, 110
- Delvecchio et al. (2021) Delvecchio, I., Daddi, E., Sargent, M. T., et al. 2021, A&A, 647, A123
- Donnan et al. (2023) Donnan, C. T., McLeod, D. J., Dunlop, J. S., et al. 2023, MNRAS, 518, 6011
- Dudzevičiūtė et al. (2020) Dudzevičiūtė, U., Smail, I., Swinbank, A. M., et al. 2020, MNRAS, 494, 3828
- Dunlop et al. (2021) Dunlop, J. S., Abraham, R. G., Ashby, M. L. N., et al. 2021, PRIMER: Public Release IMaging for Extragalactic Research, JWST Proposal. Cycle 1, ID. #1837
- Endsley et al. (2022) Endsley, R., Stark, D. P., Fan, X., et al. 2022, MNRAS, 512, 4248
- Finkelstein et al. (2022) Finkelstein, S. L., Bagley, M. B., Arrabal Haro, P., et al. 2022, ApJ, 940, L55
- Fudamoto et al. (2021) Fudamoto, Y., Oesch, P. A., Schouws, S., et al. 2021, Nature, 597, 489
- Geach et al. (2017) Geach, J. E., Dunlop, J. S., Halpern, M., et al. 2017, MNRAS, 465, 1789
- Gómez-Guijarro et al. (2019) Gómez-Guijarro, C., Riechers, D. A., Pavesi, R., et al. 2019, ApJ, 872, 117
- Harikane et al. (2023) Harikane, Y., Ouchi, M., Oguri, M., et al. 2023, ApJS, 265, 5
- Hygate et al. (2023) Hygate, A. P. S., Hodge, J. A., da Cunha, E., et al. 2023, MNRAS, 524, 1775
- Ilbert et al. (2006) Ilbert, O., Arnouts, S., McCracken, H. J., et al. 2006, A&A, 457, 841
- Jiao et al. (2019) Jiao, Q., Zhao, Y., Lu, N., et al. 2019, ApJ, 880, 133
- Jin et al. (2018) Jin, S., Daddi, E., Liu, D., et al. 2018, ApJ, 864, 56
- Jin et al. (2019) Jin, S., Daddi, E., Magdis, G. E., et al. 2019, ApJ, 887, 144
- Jin et al. (2022) Jin, S., Daddi, E., Magdis, G. E., et al. 2022, A&A, 665, A3
- Kokorev et al. (2021) Kokorev, V. I., Magdis, G. E., Davidzon, I., et al. 2021, ApJ, 921, 40
- Kriek et al. (2009) Kriek, M., van Dokkum, P. G., Labbé, I., et al. 2009, ApJ, 700, 221
- Ling et al. (2024) Ling, C., Sun, B., Cheng, C., et al. 2024, arXiv e-prints, arXiv:2402.16649
- Liu et al. (2019) Liu, D., Lang, P., Magnelli, B., et al. 2019, ApJS, 244, 40
- Magdis et al. (2012) Magdis, G. E., Daddi, E., Béthermin, M., et al. 2012, ApJ, 760, 6
- Magdis et al. (2017) Magdis, G. E., Rigopoulou, D., Daddi, E., et al. 2017, A&A, 603, A93
- Marrone et al. (2018) Marrone, D. P., Spilker, J. S., Hayward, C. C., et al. 2018, Nature, 553, 51
- McMullin et al. (2007) McMullin, J. P., Waters, B., Schiebel, D., Young, W., & Golap, K. 2007, in Astronomical Society of the Pacific Conference Series, Vol. 376, Astronomical Data Analysis Software and Systems XVI, ed. R. A. Shaw, F. Hill, & D. J. Bell, 127
- Naidu et al. (2022) Naidu, R. P., Oesch, P. A., Setton, D. J., et al. 2022, arXiv e-prints, arXiv:2208.02794
- Neri et al. (2020) Neri, R., Cox, P., Omont, A., et al. 2020, A&A, 635, A7
- Pearson et al. (2024) Pearson, J., Serjeant, S., Wang, W.-H., et al. 2024, MNRAS, 527, 12044
- Riechers et al. (2020) Riechers, D. A., Boogaard, L. A., Decarli, R., et al. 2020, ApJ, 896, L21
- Riechers et al. (2013) Riechers, D. A., Bradford, C. M., Clements, D. L., et al. 2013, Nature, 496, 329
- Riechers et al. (2017) Riechers, D. A., Leung, T. K. D., Ivison, R. J., et al. 2017, ApJ, 850, 1
- Rizzo et al. (2018) Rizzo, F., Vegetti, S., Fraternali, F., & Di Teodoro, E. 2018, MNRAS, 481, 5606
- Rowland et al. (2024) Rowland, L. E., Hodge, J., Bouwens, R., et al. 2024, arXiv e-prints, arXiv:2405.06025
- Sargent et al. (2014) Sargent, M. T., Daddi, E., Béthermin, M., et al. 2014, ApJ, 793, 19
- Schinnerer et al. (2010) Schinnerer, E., Sargent, M. T., Bondi, M., et al. 2010, ApJS, 188, 384
- Schreiber et al. (2018) Schreiber, C., Elbaz, D., Pannella, M., et al. 2018, A&A, 609, A30
- Schreiber et al. (2017) Schreiber, C., Pannella, M., Leiton, R., et al. 2017, A&A, 599, A134
- Sillassen et al. (2024) Sillassen, N. B., Jin, S., Magdis, G. E., et al. 2024, arXiv e-prints, arXiv:2407.02973
- Simpson et al. (2019) Simpson, J. M., Smail, I., Swinbank, A. M., et al. 2019, ApJ, 880, 43
- Smail et al. (2021) Smail, I., Dudzevičiūtė, U., Stach, S. M., et al. 2021, MNRAS, 502, 3426
- Smolčić et al. (2017) Smolčić, V., Novak, M., Bondi, M., et al. 2017, A&A, 602, A1
- Strandet et al. (2017) Strandet, M. L., Weiss, A., De Breuck, C., et al. 2017, ApJ, 842, L15
- Valentino et al. (2018) Valentino, F., Magdis, G. E., Daddi, E., et al. 2018, ApJ, 869, 27
- Vegetti & Koopmans (2009) Vegetti, S. & Koopmans, L. V. E. 2009, MNRAS, 392, 945
- Vieira et al. (2010) Vieira, J. D., Crawford, T. M., Switzer, E. R., et al. 2010, ApJ, 719, 763
- Vieira et al. (2013) Vieira, J. D., Marrone, D. P., Chapman, S. C., et al. 2013, Nature, 495, 344
- Walter et al. (2012) Walter, F., Decarli, R., Carilli, C., et al. 2012, Nature, 486, 233
- Wang et al. (2019) Wang, T., Schreiber, C., Elbaz, D., et al. 2019, Nature, 572, 211
- Witstok et al. (2022) Witstok, J., Smit, R., Maiolino, R., et al. 2022, MNRAS, 515, 1751
- Zavala et al. (2023) Zavala, J. A., Buat, V., Casey, C. M., et al. 2023, ApJ, 943, L9
- Zavala et al. (2018) Zavala, J. A., Montaña, A., Hughes, D. H., et al. 2018, Nature Astronomy, 2, 56
Appendix A Supporting material
| Facility | Band | Flux/mJy |
|---|---|---|
| Spitzer/MIPS | 24 m | |
| Herschel/PACS | 100 m | |
| Herschel/PACS | 160 m | |
| Herschel/SPIRE | 250 m | |
| Herschel/SPIRE | 350 m | |
| Herschel/SPIRE | 500 m | |
| SCUBA-2 | 850 m | |
| ALMA∗ | 870 m | |
| AzTEC | 1.1 mm | |
| MAMBO | 1.2 mm | |
| ALMA | 237.5 GHz | |
| ALMA | 224.8 GHz | |
| ALMA | 145 GHz | |
| ALMA | 100 GHz | |
| VLA | 3 GHz | |
| VLA | 1.4 GHz |
Notes: ∗ From A3COSMOS catalog (Liu et al. 2019).