Send correspondence to H.C.G or J.T.:
H.C.G. E-mail: hannah_gulick@berkley.edu
J.T. E-mail: jtomsick@berkeley.edu
Across the soft gamma-ray regime: utilizing simultaneous detections in the Compton Spectrometer and Imager (COSI) and the Background and Transient Observer (BTO) to understand astrophysical transients
Abstract
The Compton Spectrometer and Imager (COSI) is a NASA funded Small Explorer (SMEX) mission slated to launch in 2027. COSI will house a wide-field gamma-ray telescope designed to survey the entire sky in the 0.2-5 MeV range. Using germanium detectors, the instrument will provide imaging, spectroscopy, and polarimetry of astrophysical sources with excellent energy resolution and degree-scale localization capabilities. In addition to the main instrument, COSI will fly with a student collaboration project known as the Background and Transient Observer (BTO). BTO will extend the COSI bandpass to energies lower than 200 keV, thus enabling spectral analysis across the shared band of 30 keV–2 MeV range. The BTO instrument will consist of two NaI scintillators and student-designed readout electronics. Using spectral information from both the COSI and BTO instruments, physics such as the energy peak turnover in gamma-ray bursts, the characteristics of magnetar flares, and the event frequency of a range of transient phenomena will be constrained. In this paper, we present the expected science returnables from BTO and comment on the shared returnables from the COSI and BTO missions. We include simulations of gamma-ray bursts, magnetar giant flares, and terrestrial gamma-ray flashes using BTO’s spectral response. Additionally, we estimate BTO’s gamma-ray burst detection rate and find that BTO will detect 150 gamma-ray bursts per year, with most of these events being long bursts.
keywords:
Gamma-ray Survey, Gamma-ray Transients, COSI, Time Domain, Multimessenger1 INTRODUCTION
The transient gamma-ray sky holds insights into the extreme energetics which power and map events such as black hole accretion (Abdo et al., 2010; Ajello et al., 2020), electron-positron annihilation (Bouchet et al., 2010; Knödlseder et al., 2005), compact object formation and evolution (Abbott et al., 2017a; Campana et al., 2006; Kumar & Zhang, 2015; MacFadyen & Woosley, 1999), and the progenitors of multimessenger events (Abbott et al., 2017a, b; Eichler et al., 1989). Transient gamma-ray events are important for understanding broader topics such as galaxy formation and evolution, the history of star formation in the Milky Way, and dark matter. With peak energies ranging from 1–100 keV for gamma-ray burst (GRB) and magnetar flares (Pe’er et al., 2006; Kaspi & Beloborodov, 2017), to 100s of MeV for blazars (Ajello et al., 2020; De Angelis et al., 2021), the gamma-ray bandpass is extensive. As a consequence, a single instrument is not capable of observing across the entire gamma-ray regime.
Spectral signatures from gamma-ray transients are variable across the gamma-ray bandpass, requiring multiple instruments to observe and constrain event characteristics. Events such as magnetar flares or Galactic electron-positron annihilation occupy a finite fraction of the gamma-ray bandpass, peaking at energies of 60 keV (Kaspi & Beloborodov, 2017) and 511 keV (Knödlseder et al., 2005; Bouchet et al., 2010), respectively. Other phenomenon such as the energy peak turnover in GRBs exhibit energy dependent structure (Pe’er et al., 2006; Band et al., 1993), and thus require observations across a range of energies to observe different underlying emission mechanisms. Therefore, to properly constrain the physics powering the most energetic phenomenon in the Universe, simultaneous observations are needed from complimentary instruments specialized to different energy ranges.
Historically, gamma-ray observatories have included multiple instruments on a single spacecraft platform to enable observations across a wide range of energies. For example, the INTErnational Gamma-Ray Astrophysics Laboratory (INTEGRAL) which launched in 2002 included both a gamma-ray imager (Lebrun et al., 2003, IBIS) and spectrometer (Vedrenne et al., 2003, SPI) covering energies from 20 keV to 10 MeV. These instruments were complimented by the Joint European X-ray Monitors (Lund et al., 2003, JEM-X 1& 2) which provided images in the 3–35 keV bandpass. The Astro-rivelatore Gamma a Immagini Leggero (Marisaldi et al., 2010, 2015, AGILE) included two imagers—the Gamma Ray Imaging Detector (Chen et al., 2013, GRID) sensitive in the 30 MeV–50 GeV energy ranges as well as SuperAgile (Feroci et al., 2007, SA) sensitive in the 18–60 keV energy range. Additionally, the Fermi satellite includes both the Large Area Telescope (Atwood et al., 2009, LAT) providing images in the 20 MeV to 300 GeV range as well as the Gamma-ray Burst Monitor (Meegan et al., 2009, GBM) providing spectra in the 8 keV to 40 MeV.
The future Compton Spectrometer and Imager (Tomsick et al., 2023, COSI) mission slated to launch in 2027, will also include multiple instruments covering a wide energy bandpass. These instruments include the main COSI gamma-ray telescope and a second soft gamma-ray spectrometer known as the Background and Transient Observer (BTO). While COSI will provide high resolution images, spectroscopy, and polarization measurements in the 200 keV to 5 MeV range, BTO will extend the COSI bandpass to lower energies by providing spectral information in the 30 keV to 2 MeV range. Due to their overlapping bandpasses as well as shard FOVs, COSI and BTO will enable spectroscopic analysis of gamma-ray transients over a large gamma-ray bandpass. Future observations made with COSI and BTO will help to isolate GRB photospheric and non-thermal emission components (Ryde et al., 2010; Guiriec et al., 2011; Pe’er et al., 2006) and constrain the energy peak turnover which typically occurs below 200 keV (Band et al., 1993). Additionally, BTO’s lower bandpass and wider FOV is better suited to detect magnetar flares (Kaspi & Beloborodov, 2017) and will thus improve the mission’s ability to probe the characteristic timescales, temperatures, and brightness profiles associated with these events. Finally, the combined COSI and BTO systems will yield observations of multimessenger events which will be used to localize the event progenitor and to measure the delay time between gravitational waves and their corresponding electromagnetic counterparts (Abbott et al., 2017a, b).
In this paper, we outline the full mission overview in Section 2 and include instrument specifics for COSI and BTO in Sections 2.1 and Section 2.2, respectively. Section 3 reports on transient event simulations as well as the expected GRB event rates in BTO. The scientific advantages achieved through launching the complimentary COSI and BTO systems are also highlighted through simulated spectra of transient events in 3.1. Conclusions are made in Section 4.
2 Mission Overview
The Compton Spectrometer and Imager (COSI) is a space-based gamma-ray survey mission that will provide imaging, spectroscopy, and polarimetry of astrophysical sources associated with the birth and death of stars, the formation of chemical elements in the Milky Way, and the progenitors of gravitational waves. Selected in 2021 as a NASA Small Explorer (SMEX) mission, COSI is slated to launch to a low-Earth-orbit (LEO) in 2027. As of April 2024, COSI passed its Key Decision Point review and was confirmed to proceed to Phase C. The COSI instrument is discussed further in Section 2.1 and a full instrument outline is included in (Tomsick et al., 2023).
In addition to the main instrument, the COSI SMEX proposal included a secondary proposal for a student collaboration project which was successfully funded. The student collaboration project aims to develop an additional gamma-ray detector system to fly on COSI—known as the Background and Transient Observer (BTO) (see Section 2.2). BTO will fly onboard the COSI spacecraft as a do-no-harm payload to provide observations at lower energies (30 keV to 2 MeV) and across a larger field-of-view (FoV) ( 60% of the sky) than the main COSI instrument. BTO’s main science goals will be to detect gamma-ray transients and to constrain the soft gamma-ray background rates at different locations in the COSI orbit. Therefore, BTO will be highly complimentary to the COSI mission as a whole by extending the mission’s bandpass, increasing the on-sky coverage for transient monitoring, and improving data analysis through improved background rate measurements.
Along with COSI, BTO has passed the Preliminary Design and Key Decision Point reviews. BTO has a functioning engineering model currently.
2.1 The Compton Spectrometer and Imager
COSI is a Compton telescope capable of observing from 200 keV to 5 MeV with an instantaneous FOV covering 25% of the sky. Figure 1 shows the COSI spacecraft with the photon-sensitive subsystems labeled. The main telescope (labeled 1) is composed of cryogenically-cooled germanium detectors which use a double-sided strip structure to enable measurements of an interacting photon’s x and y location as well as its depth (z). The instrument includes four stacks of four detectors (16 detectors total), each with 64 strips per side and a dimension of 8 cm 8 cm 1.5 cm. The detectors are surrounded by a guard ring electrode which performs signal vetoing. An Application Specific Integrated Circuit (ASIC) is used to read out the COSI detectors and guard ring. With the cryogenic cooler, the detectors are cooled to 80–90 K, allowing the instrument to achieve an excellent energy resolution of of 6 keV at 0.511 MeV and 9 keV at 1.157 MeV (Tomsick et al., 2023). These resolutions enable unprecedented access to the low-energy part of the gamma-ray regime—otherwise known as the ’MeV Gap’ due to the observational challenges associated with this bandpass (i.e. high background levels) and thus the lack of existing observations.
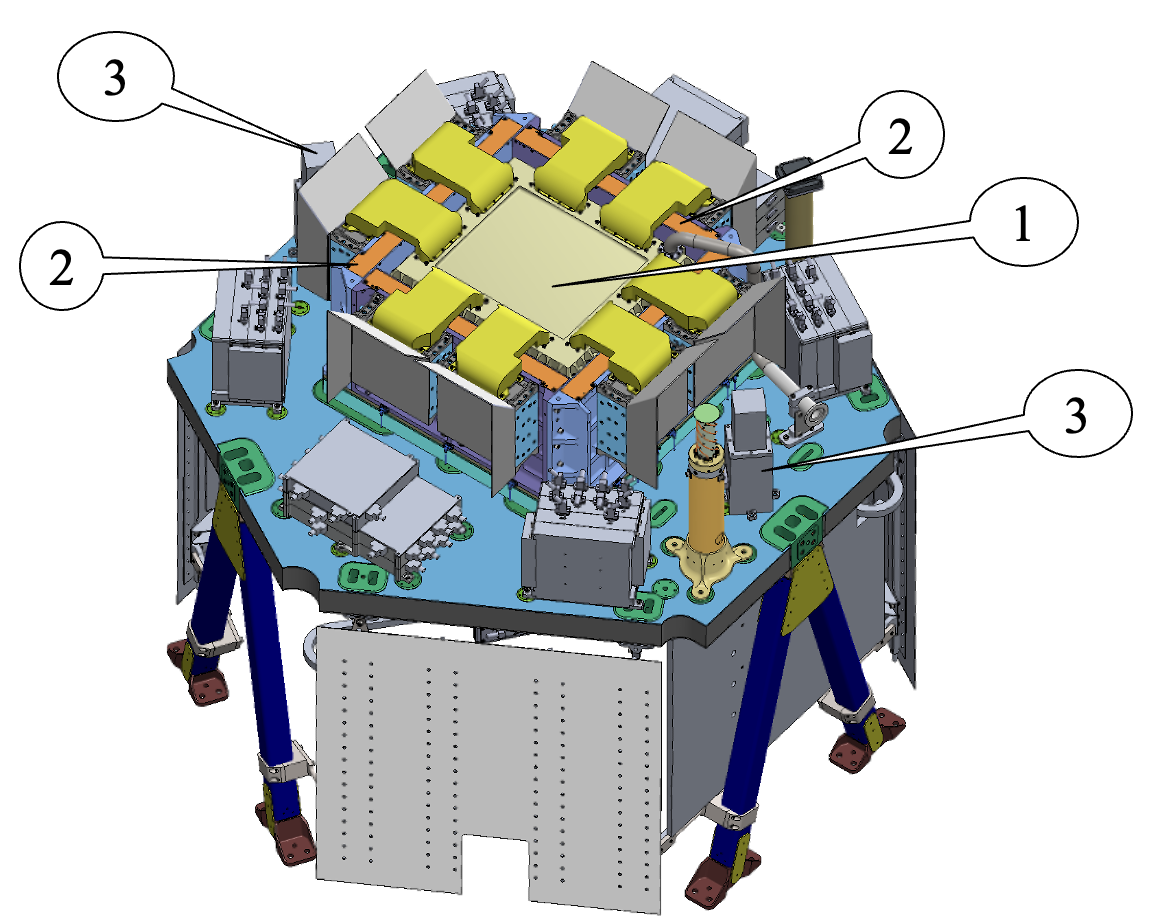 |
The germanium detectors are surrounded on four sides and underneath by active bismuth germanium oxide (BGO) scintillators. The BGO shields, shown in orange in Figure 1, are readout by silicon photomultipliers (SiPMs) and act to provide passive background attenuation as well as anti-coincidence information on background radiation and gamma-rays that escape from the germanium detectors. Light curve information from the BGO shields will be downlinked from the spacecraft and used to improve background reduction in the COSI data as well as identify transient events.
Due to COSI’s Compton telescope design, both the total energy and incident angle of the incoming photon can be identified and used to localize and reconstruct the source’s image on the sky. COSI will be capable of imaging events with an angular resolution of 4.1 and 2.1 at 0.511 MeV and 1.809 MeV, respectively. As part of the mission requirements, COSI will create full Galaxy images at 0.511 MeV as well as four nuclear line energies. Additional information on COSI line sensitivities is included in Table 1 of Tomsick et al. (2023). Additionally, since the azimuthal component of the Compton scattering angle measured in the germanium detectors depends on the polarization of the incoming gamma-ray, COSI will also provide polarization measurements. The COSI detectors will be sensitive to polarization down to a flux limit of 1.4 erg cm-2 s-1 in the 0.2-0.5 MeV range.
With the use of these three observing capabilities, COSI will address four main science goals: 1. uncovering the origin of Galactic positrons through studies of the 0.511 MeV emission from antimatter annihilation in the Galaxy (Bouchet et al., 2010; Knödlseder et al., 2005), 2. revealing Galactic element formation by mapping radioactive elements from nucleosynthesis (Eichler et al., 1989), 3. gain insight into extreme environments through polarization measurements of accreting black holes (Ajello et al., 2020), and 4. probing the physics of multimessenger events through the observation of short gamma-ray bursts (sGRB) (Abbott et al., 2017a, b).
2.2 The Background and Transient Observer
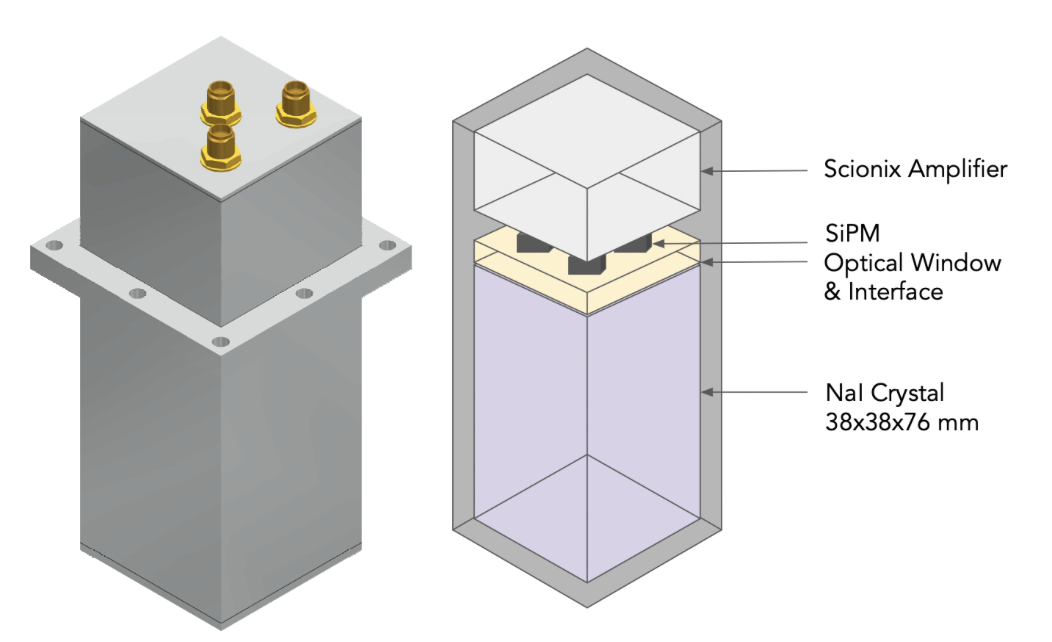
The BTO instrument will measure gamma-rays from transient events and monitor the soft gamma-ray background rates in the 30 keV to 2 MeV regime. BTO will utilize two detector modules—each composed of a rectangular NaI detector (see Figure 2), an analog board with analog-to-digital converter (ADC), and a digital board. The BTO detectors are shown in Figure 1 on the outer edges of the spacecraft instrument deck—otherwise known as the Payload Interface Plate (PIP). The BTO electronics are housed in a single, stacked electronics box which is located on the underside of the PIP and therefore not visible in Figure 1.
A trade study was conducted to optimize the scintillator material, size, and shape, including an analysis of afterglow signatures in CsI versus NaI scintillators Gulick et al. submitted. The custom BTO detectors are supplied by Scionix and utilize components with space heritage. The detectors contain a 3.8 cm 3.8 cm 7.6 cm NaI crystal hermetically sealed in a 4.5 cm 4.5 cm 12 cm aluminum housing. The detector energy resolution is 15–20% at 662 keV. Figure 2 shows a diagram of the detector. Each detector includes four ArrayJ-60035-4P-PCB SiPMs for detector readout and a proprietary built-in amplifier. The flight model detectors include a single SMA input for 12 V power and two SMA outputs—one for the ’raw’ SiPM signal and one for the amplified detector signal.
 |
The detectors are located on the outer edges of the COSI PIP (see Figure 1) to optimize the BTO FOV to 60% of the sky. With only two detectors, BTO will not be capable of providing precise source localization. Therefore, the mechanical housing which affixes the detector to the PIP was designed with a ’pedestal’ to raise the crystal by 11.5 cm. The pedestal—along with the detector placement—ensures the BTO detectors are not obscured by other components on the COSI PIP and results in the full COSI FOV being overlapped by part of each BTO detector’s FOV. Thus any BTO detected event which occurs in the shared FOV will be localized to 4.1 by the COSI germanium detectors. Furthermore, the placement of the BTO detectors on opposite sides of the COSI PIP allows shadowing from the germanium detectors, BGO shields, and other components on the COSI PIP to be used to roughly constrain the location of events outside of the COSI FOV to be of the Sun, Earth, or astrophysical origins.
Each detector will have its own set of readout electronics, consisting of an analog, ADC, and digital board. The analog board will process the amplified signal from the NaI detector and convert it to a digital signal with an analog-to-digital converter (ADC). Following the ADC, the digital board will be equipped with two modes of operation. Due to data downlinking limits, BTO will nominally operate in a ’binned mode’ during which all counts over a 1 ms timescale will be saved to a binned histogram and downlinked. To preserve timing information for true gamma-ray events, however, the digital board will switch to an ’event-by-event mode’ once triggered. In event-by-event mode, the timing and energy information for every event will be individually saved and downlinked. The event-by-event mode is especially important for the analysis of short gamma-ray events such as terrestrial gamma-ray flashes (TGFs).
Following the readout and processing system will be a power board and interface board. The power board will be responsible for converting and filtering the spacecraft’s 28 V input to 12 V for the detector and analog/ADC boards and to 5 V for the digital boards. The interface board will be responsible for relaying commands and data to and from the BTO system to the spacecraft control panel. As a do-no-harm payload, the power and interface boards will act as the only electrical points of contact with the COSI spacecraft.
By observing at lower energies than COSI, BTO will probe interesting science associated with gamma-ray bursts (GRB) and magnetar flares. The BTO bandpass is ideal for constraining the energy peak turnover in lGRB and sGRB (Band et al., 1993) and for isolating photospheric components in GRB spectra (Pe’er et al., 2006; Ryde et al., 2010; Guiriec et al., 2011). BTO will also be capable of measuring the time delay between gravitational wave events and their sGRB electromagnetic counterparts (Abbott et al., 2017a, b). Additionally, good timing resolution (0.5 ms) is necessary to detect TGF events from lightening on Earth with timescales 1 ms) (Smith et al., 2005; Grefenstette et al., 2009). BTO’s event-by-event mode achieves this resolution. Furthermore, due to the anti-coincidence requirement between the Compton telescope and active BGO shields on COSI, BTO will be the only instrument on the spacecraft which saves and downlinks TGF event information.
3 Observing Astrophysical Transients with BTO & COSI
In this section we provide an in-depth discussion of the estimated science returnables from the BTO instrument for several transient phenomena. We use the Medium Energy Gamma-ray Library (Zoglauer et al., 2006, MEGAlib) to simulate a BTO detector response curve and corresponding event rates and spectra for GRBs, magnetar GFs, and TGFs.
We also comment on the scientific advantages enabled through the compatibility of the COSI and BTO instruments. Due to their overlapping bandpasses and FOVs, the combined COSI and BTO instruments will provide spectral information from 30 keV to 2 MeV for gamma-ray transients which occur in their shared FOVs. The COSI response values and simulated light curves utilized in the sections below were created as part of a larger project which will be published in an upcoming manuscript by Neights et al. in prep.
3.1 Gamma-ray Bursts
We estimate the number of GRBs detectable by BTO using the MEGAlib package GRBSampler. This package uses a catalog of real GRB observed by the Burst and Transient Source Experiment (BATSE) Goldstein et al. (2013) over 3323 days (effective exposure time of 2390 days). The catalog contains 2,145 GRB, with 22% of the events being sGRB. To create a population of simulated GRB, the GRBSampler package randomly samples probability weighted histograms of the following parameters: GRB duration (s), GRB flux (photons/cm2/s), the Band function lower photon index, the Band function upper photon index, the Band function break energy, and the GRB’s polar () and azimuthal () angle on the sky.
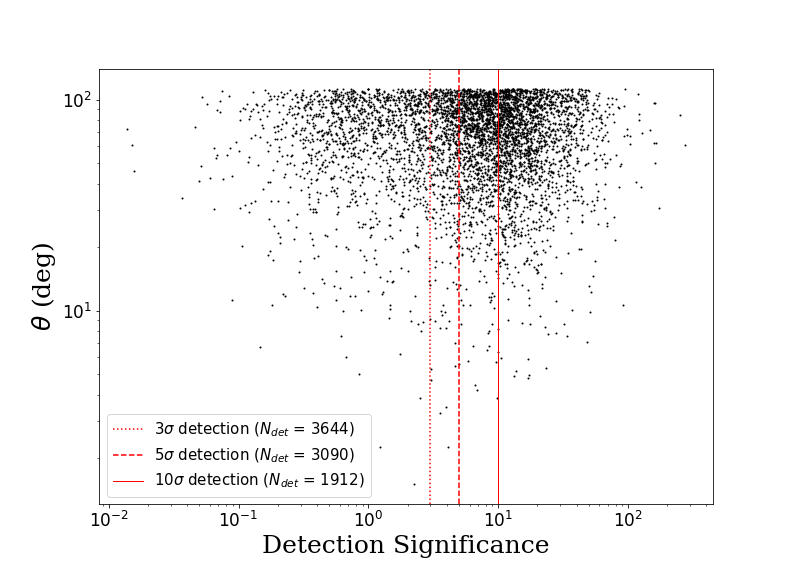
We simulated 5000 GRB to create a robust sample. To account for the Earth occultating the BTO FOV, only GRB with a 112.5∘ were included in the study. For each remaining GRB, we calculate the signal-to-noise ratio (SNR) via:
where is the GRB’s flux (photon/s), is the background flux (photon/s), and is the exposure time (s). The background flux is calculated for the BTO geometry using MEGAlib as outlined in Gulick et al. submitted. The average expected background rate for a single BTO detector is 57 counts/s for an orbit with an 550 km altitude and 0 inclination.
Figure 3 shows the detection significance versus polar angle for the 5000 GRB simulated with the NaI detector. The 3, 5, and 10 levels are denoted by red dotted, dashed, and solid lines respectively. In the legend, refers to the number of GRB detected above each SNR interval.
 |
To determine the number of GRB visible in BTO over the nominal mission duration of 2 years, we scale the simulated population with the BATSE detection rate. The BATSE catalog effective exposure time is 2390 days with 2,145 total detections. Extrapolating outwards to determine the effective exposure time required to detect the simulated data population, we expect BATSE to make 5000 detections in 4600 days or 12.6 years. Therefore, we scale the total simulated/observable population by 0.16 to estimate the number of detections over two years. Furthermore, the simulations were performed for a single BTO detector with an all-sky FOV so the data are further scaled by 0.6 to represent the BTO detector’s FOV.
This corresponds to 295 GRB detections with both BTO detectors over the full 2-year mission (148 GRB per year) or a detection rate of 0.4 GRB per day. Comparatively, the Gamma-ray Burst Monitor on the Fermi Observatory triggers on 250 GRB per year (Meegan et al., 2009). GBM, while using the same NaI scintillation material, has a larger effective area (120 cm2 for a single detector (Tsvetkova et al., 2022; Meegan et al., 2009)) than BTO (peak 50 cm2 for both detectors) and observes from 8 keV to 40 MeV. Therefore, from the ratio of effective areas, it is expected that GBM has 2.4 the detection rate of BTO. Therefore, the current GRB rate estimates for BTO might be slightly overestimated (i.e. closer to 100 GRB per year). This value will be refined in future work as the BTO detector response matrix is completed across the full sky.
Figure 4 shows the distribution of GRB event durations for all GRB events over the two year mission duration in grey and the short and long GRB events with a 5 detection level in pink and orange, respectively. The distribution is fit with a bimodal function with the first peak representing the sGRB population, and the second peak representing the lGRB distribution.
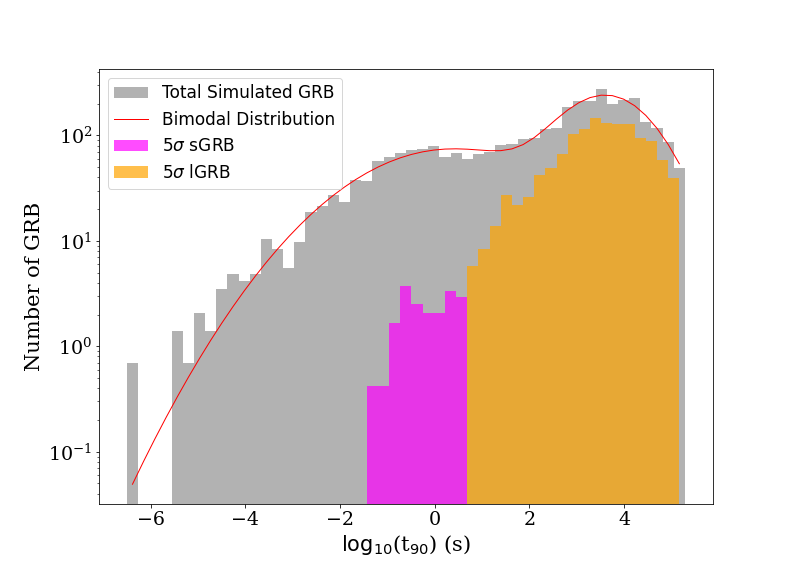 |
At a 5 confidence level, approximately 292 of the GRB detections over two years will be lGRB and 3 will be sGRB. For a 3 confidence level, we expect to have 8 sGRB and 340 lGRB over the two year mission. Typically, 20% of GRB detections are sGRB, as shown by Konus-Wind and GBM (Tsvetkova et al., 2022). The Swift-Burst Alert Telescope (Swift-BAT) had a slightly lower rate with 9% of detections contributed by sGRB. However, only 1% of BTO’s simulated detections are sGRB. Similar to the results found in Lien et al. (2016) for the Swift-BAT telescope, we find that shorter gamma-ray events are difficult for the BTO geometry to detect if they are 1. highly off-axis or 2. both low flux and short duration. As is expected, the BTO sensitivity increases with exposure time thus BTO is capable of detecting high-flux sGRB, or low-flux sGRB with longer durations. Therefore, the BTO detectors will be biased toward the longest or brightest sGRB events.
Figure 5 shows the lightcurve (top) and the corresponding BTO and COSI spectra (bottom) for a simulated lGRB event directly above the COSI/BTO instruments (i.e. on-axis). The parameters for the GRB are included in Table 1. The COSI spectrum is converted from units of photons/cm-2/s/keV to units of photons/s/keV using the instrument’s effective area over the 100 keV to 5 MeV bandpass (Neights et al. in prep). With an effective area peaking at 30 cm2 from 200–500 keV (Tomsick et al., 2023), COSI has a better response than the BTO detectors and achieves good statistics to higher energies. In the case of a typical lGRB, COSI provides well constrained data out to 5 MeV. BTO, on the other hand, has a sufficient response down to 30 keV and extends the observed bandpass to lower energies to capture the energy peak turnover at 100 keV. BTO is limited at higher energies, providing good statistics only up to 1 MeV. Unlike COSI, BTO will return event-by-event data for triggered events in the 30 keV to 10 MeV range. Therefore, the BTO spectrum can utilize finer bins, while event count rates allow.
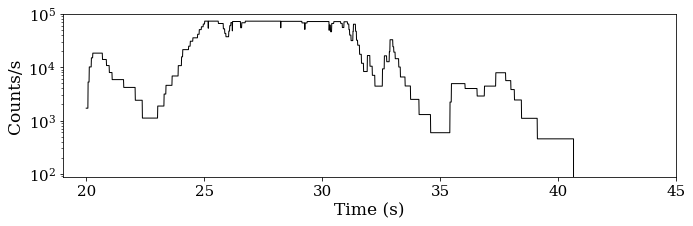
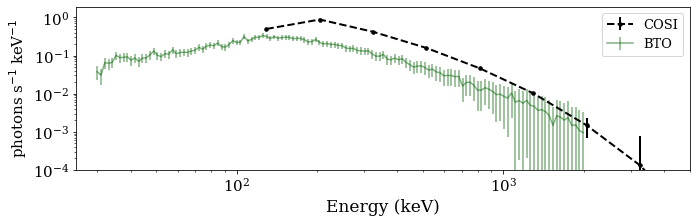
Figure 6 shows the lightcurve (top) and the corresponding BTO and COSI spectra (bottom) for a simulated sGRB at 70 off-axis from the COSI/BTO instrument zenith. The parameters for the GRB are included in Table 1. The COSI and BTO spectra includes 10 and 25 energy bins, respectively. Similar to the lGRB, BTO is capable of providing well constrained data at energies lower than 100 keV but becomes dominated by errors closer to 600–700 keV. This is due to the sGRB having less total counts than the lGRB. COSI provides good statistics past 1 MeV.
| Property | Long GRB | Short GRB |
|---|---|---|
| Spectrum Type | Band | Comptonized |
| Parameters | Ebreak = 841.8 | Epeak = 1482.6 |
| = -1.02 | = -0.71 | |
| = -2.83 | — | |
| Duration (s) | 40.6 | 0.41 |
| Average Flux [ph/cm2/s] | 10.72 | 35.38 |
3.2 Magnetar Flares
There are two types of gamma-ray signals originating from magnetars: soft gamma-ray repeaters (SGRs) and giant flares (GFs). SGRs occur in young, slowly rotating magnetars and appear as dozens of rapid, repeating soft gamma-ray signals (Thompson & Duncan, 1996). SGRs have a known initial hard transient phase of 0.2s (Duncan & Thompson, 1992; Thompson & Duncan, 1995). About once every 50 years (Palmer et al., 2005), an SGR’s host magnetar will emit a GF with an energy 103 times the energy of the typical SGR burst in less than one second (Mazets et al., 1979; Fenimore et al., 1996; Hurley et al., 1999; Mereghetti et al., 2024). This prompt emission often peaks at 10–100s of keV (Mereghetti et al., 2024; Kaspi & Beloborodov, 2017; Boggs et al., 2007) and is well constrained in the 20 keV to 1 MeV band. The prompt GF emission is followed by a softer emission tail spanning several minutes and characterized by a periodic modulation intrinsic to the neutron star’s rotation (Mereghetti et al., 2024). There are nearly 30 SGR catalogued in the Milky Way Galaxy, however very few have exhibited GFs. The few confirmed GFs include SGR 0526-66 (Mazets et al., 1979; Cline et al., 1980; Mazets et al., 1982), SGR 1900+14 (Hurley et al., 1999; Feroci et al., 1999; Mazets et al., 1999), and SGR 1806-20 (Hurley et al., 2005; Boggs et al., 2007; Palmer et al., 2005; Frederiks et al., 2007). GFs outside of the galaxy are difficult to distinguish from sGRB, though it is possible to identify extragalactic GF through the event’s spectral and timing properties as well as a lack of gravitational waves (Mereghetti et al., 2024; Minaev et al., 2024).
BTO’s bandpass and large FOV make it a great instrument for detecting rare, extragalactic events which peak in the soft gamma-ray regime—such as magnetar GFs. Additionally BTO’s smaller effective area (when compared to COSI or GBM) is advantageous when it comes to magnetar GFs within the Galaxy. This is due to a GF’s brief but incredibly energetic prompt emission being strong enough to overwhelm gamma-ray instruments, thus temporarily blinding them. With a smaller effective area, BTO will be blinded for less time and therefore capable of monitoring the prompt emission decay and subsequent modulating emission tail. Simulations of Galactic GF with BTO and COSI are ongoing.
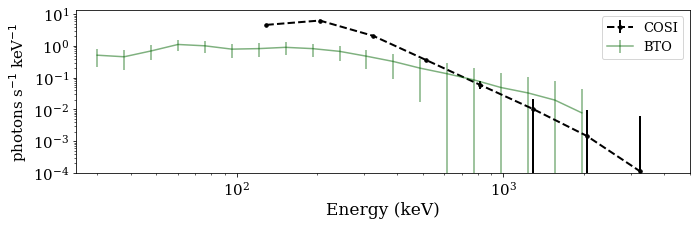
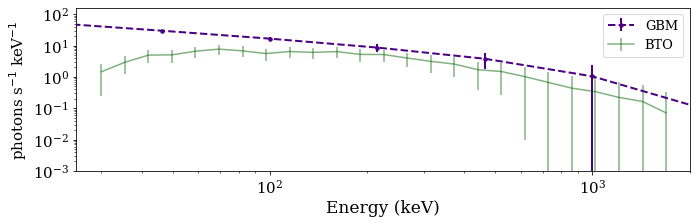
While unable to observe the prompt emission from Galactic magnetar GFs, both COSI and BTO will be capable of observing prompt emission from extragalactic giant flares. Using the spectral information from Mereghetti et al. (2024) and Minaev et al. (2024) for GRB231115A—a high probability extragalactic magnetar GF—we simulate BTO’s spectral response for a similar GF at the instrument’s zenith. Figure 7 shows the event’s observed spectrum from GBM (Minaev et al., 2024) and the simulated BTO spectrum. The observed GBM spectrum was fit over the time interval -0.02 s to 0.05 s with a comptonized model. The best fit parameters for this model are: normalization coefficient = 6.27 photons/cm2/s/keV, a photon index of = -0.340.2, and a peak energy = 637 keV. The GBM spectrum was converted from photons/cm2/s/keV to photons/s/keV using the GBM effective area curve fit in Smith (2019). The BTO spectrum was simulated with MEGAlib using the best fit parameters from GBM in the comptonized model and a fluence of 7.25e-7 erg/cm2 in the 10–1000 keV range (Minaev et al., 2024). The simulations for COSI magnetar detections are ongoing.
 |
3.3 Terrestrial Gamma-ray Flashes
TGFs are rapid and intense bursts of gamma-rays originating in the Earth’s atmosphere. Thunderstorms—and specifically lightning activity—are thought to be the progenitors of these events. However, the acceleration mechanism behind TGFs is not well understood (Briggs et al., 2010; Dwyer et al., 2012). While largely studied from the ground (Belz et al., 2017), TGFs are also detected by space-based gamma-ray telescopes such as the Reuven Ramaty High Energy Solar Spectroscopic Imager (Smith et al., 2005; Grefenstette et al., 2009, RHESSI), GBM (Briggs et al., 2010), AGILE (Marisaldi et al., 2010, 2015), and were even discovered by BATSE in 1994 (Fishman et al., 1994).
TGF signals are very brief, with a single TGF pulse lasting less than a millisecond. A TGF event typically consists of a single pulse with energies extending up to 25 MeV, though events have been reported up to 38 MeV (Briggs et al., 2010). TGF emission is well modeled by bremsstrahlung radiation emitted by electrons accelerated in the relativistic runaway electron avalanche (RREA) process (Gurevich et al., 1992). Due to COSI/BTO’s 0111The current requirement for the COSI spacecraft is an orbit with 2 inclination inclination orbit, the instruments will follow the Earth’s equator and spend periods of time over tropical regions where storms frequently occur thus increasing detection probabilities. However, great timing resolution (0.5 ms) is needed to detect these events. BTO’s event-by-event mode satisfies this requirement.
We simulate the BTO instrument response to a TGF event using MEGAlib. We build a TGF spectrum using the model from Lindanger et al. (2021):
where is the incoming photon energy in MeV. The spectrum is calculated from 30 keV to 40 MeV. The TGF photons are then beamed upward with a Gaussian beaming profile with a half angle of 30 and Gaussian 1 value of 18 as determined from Appendix B of Lindanger et al. (2021). To simulate TGF events occurring on Earth, the TGF spectrum is passed through an atmospheric model created with the Python package pyatmo222Website: https://github.com/jabesq-org/pyatmo. The resulting spectrum contains information on atmospheric interactions and is saved as the “post-atmosphere” TGF spectrum. The BTO detector response is then simulated by “observing” the post-atmosphere TGF spectrum with the BTO detector geometry.
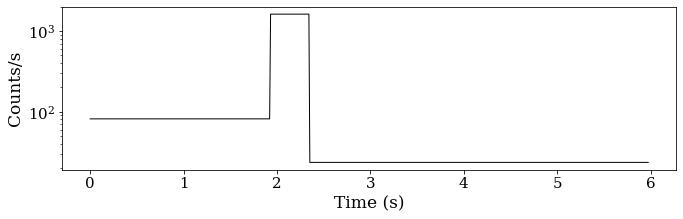
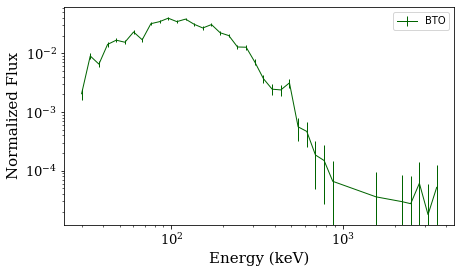
Figure 8 shows the normalized TGF spectrum as observed by a single BTO detector for a TGF event with a starting altitude of 10 km and a 0.001 s duration (Lindanger et al., 2021). The spectrum is calculated from 30 keV to 2 MeV range and separated into 25 energy bins. The TGF source flux is normalized by the number of injected photons. With 20 energy bins, BTO is able to constrain the 511 keV peak produced by the TGF’s gamma-rays inducing electron–positron annihilation in the Earth’s atmosphere (Kochkin et al., 2018; Wada et al., 2019). The BTO spectrum provides good statistics up to 1 MeV for this TGF event.
 |
Nominally, the main COSI detectors will not observe TGF events due to the anti-coincidence requirement between the COSI detectors and active shields. Since TGFs come from Earth (i.e. below the instrument), photons from these events will always pass through the active BGO shields before reaching the COSI detectors, and will therefore, be removed from the final, downlinked data products. An exception may occur when COSI points toward the Crab Nebula for calibrations, during which the telescope will be angled in such a way that a TGF event could enter the main COSI FOV without passing through a shield first. While the shields will save lightcurve information, the timing resolution in the shields (50 ms) is not suitable for detecting TGF events.
4 Conclusions
In this paper, we discuss initial calculations for the expected science returnables from the Background and Transient Observer (BTO) and the compatibility of the BTO and Compton Spectrometer and Imager (COSI) instruments. COSI is a wide-field gamma-ray telescope that will launch as a SMEX in 2027 and provide imaging, spectroscopy, and polarization measurements in the 0.2 to 5 MeV range. In addition to the main instrument, COSI will house the BTO detector system which will provide spectral information in the 0.03 MeV to 2 MeV bandpass. With overlapping bandpasses and FOVs, BTO and COSI enable spectral analysis across a broad gamma-ray bandpass. The combination of spectral information from these two instruments will enable:
-
•
Localization of transient gamma-ray sources within the shared COSI and BTO FOVs to 4 (via COSI)
-
•
Measurements of the energy peak turnover and photospheric or non-thermal emission components in GRB
-
•
Cataloging of magnetar events including their characteristic timescales, temperatures, and brightness profiles
-
•
Identification of thunderstorms which produce TGF events
Simulations of lGRB, sGRB, magnetar GFs, and TGFs are performed to showcase BTO’s response to these transient events. In the case of GRBs, the expected detection rates are also calculated using the BATSE GRB catalogue. Using the BTO geometry over a 2 year nominal mission, we expect to detect 295 GRB events with 5 confidence, though this number might be slightly overestimated (by 50 GRB/year) when comparing with the GBM detection rate. A large fraction of these events (99%) will be long GRB, revealing that BTO is non-optimal for detecting sGRB events. Even with BTO’s low sGRB detection rate, we expect to detect 7 sGRB with 3 confidence which is a sufficient sample to measure time lags between sGRB events and their corresponding gravitational wave signals.
For magnetar GFs and TGFs, we simulate spectra from BTO using models from the literature. In both cases, BTO has good statistics up to 1 MeV where the data becomes error dominated. The magnetar data are compared to an observed GBM spectrum for an extragalactic GF in M82. Further analysis on the event rates of magnetar GFs as well as magnetar SGRs and TGFs is in progress.
Acknowledgements.
The authors would like to acknowledge Alex Lowell (SSL), Brent Mochizuki (SSL), Josh Forgione (SSL), and Greg Dalton (SSL) for their support and guidance in developing the BTO instrument. COSI and BTO are a NASA Small Explorer mission and Student collaboration project supported under NASA contract 80GSFC21C0059. This material is based upon work supported by the National Science Foundation Graduate Research Fellowship under Grant No. DGE 2146752.References
- Abbott et al. (2017a) Abbott, B. P., Abbott, R., Abbott, T. D., et al. 2017a, The Astrophysical Journal Letters, 848, L13
- Abbott et al. (2017b) Abbott, B. P., Abbott, R., Abbott, T. D., et al. 2017b, Physical Review Letters, 119, 161101
- Abdo et al. (2010) Abdo, A. A., Ackermann, M., Agudo, I., et al. 2010, The Astrophysical Journal, 716, 30
- Ajello et al. (2020) Ajello, M., Angioni, R., Axelsson, M., et al. 2020, The Astrophysical Journal, 892, 105
- Atwood et al. (2009) Atwood, W. B., Abdo, A. A., Ackermann, M., et al. 2009, The Astrophysical Journal, 697, 1071
- Band et al. (1993) Band, D., Matteson, J., Ford, L., et al. 1993, The Astrophysical Journal, 413, 281
- Belz et al. (2017) Belz, J., Abbasi, R., Krehbiel, P. R., et al. 2017, in AGU Fall Meeting Abstracts, Vol. 2017, AE31A
- Boggs et al. (2007) Boggs, S. E., Zoglauer, A., Bellm, E., et al. 2007, The Astrophysical Journal, 661, 458
- Bouchet et al. (2010) Bouchet, L., Roques, J. P., & Jourdain, E. 2010, The Astrophysical Journal, 720, 1772
- Briggs et al. (2010) Briggs, M. S., Fishman, G. J., Connaughton, V., et al. 2010, Journal of Geophysical Research (Space Physics), 115, A07323
- Campana et al. (2006) Campana, S., Mangano, V., Blustin, A. J., et al. 2006, Nature, 442, 1008
- Chen et al. (2013) Chen, A. W., Argan, A., Bulgarelli, A., et al. 2013, Astronomy & Astrophysics, 558, A37
- Cline et al. (1980) Cline, T. L., Desai, U. D., Pizzichini, G., et al. 1980, The Astrophysical Journal Letters, 237, L1
- De Angelis et al. (2021) De Angelis, A., Tatischeff, V., Argan, A., et al. 2021, Experimental Astronomy, 51, 1225
- Duncan & Thompson (1992) Duncan, R. C., & Thompson, C. 1992, The Astrophysical Journal Letters, 392, L9
- Dwyer et al. (2012) Dwyer, J. R., Smith, D. M., & Cummer, S. A. 2012, Space Science Reviews, 173, 133
- Eichler et al. (1989) Eichler, D., Livio, M., Piran, T., & Schramm, D. N. 1989, Nature, 340, 126
- Fenimore et al. (1996) Fenimore, E. E., Klebesadel, R. W., & Laros, J. G. 1996, The Astrophysical Journal, 460, 964
- Feroci et al. (2007) Feroci, M., Costa, E., Soffitta, P., et al. 2007, Nuclear Instruments and Methods in Physics Research A, 581, 728
- Feroci et al. (1999) Feroci, M., Frontera, F., Costa, E., et al. 1999, The Astrophysical Journal Letters, 515, L9
- Fishman et al. (1994) Fishman, G. J., Bhat, P. N., Mallozzi, R., et al. 1994, Science, 264, 1313
- Frederiks et al. (2007) Frederiks, D. D., Golenetskii, S. V., Palshin, V. D., et al. 2007, Astronomy Letters, 33, 1
- Goldstein et al. (2013) Goldstein, A., Preece, R. D., Mallozzi, R. S., et al. 2013, The Astrophysical Journal Supplement Series, 208, 21
- Grefenstette et al. (2009) Grefenstette, B. W., Smith, D. M., Hazelton, B. J., & Lopez, L. I. 2009, Journal of Geophysical Research (Space Physics), 114, A02314
- Guiriec et al. (2011) Guiriec, S., Connaughton, V., Briggs, M. S., et al. 2011, The Astrophysical Journal Letters, 727, L33
- Gurevich et al. (1992) Gurevich, A. V., Milikh, G. M., & Roussel-Dupre, R. 1992, Physics Letters A, 165, 463
- Hurley et al. (2005) Hurley, K., Boggs, S. E., Smith, D. M., et al. 2005, Nature, 434, 1098
- Hurley et al. (1999) Hurley, K., Cline, T., Mazets, E., et al. 1999, Nature, 397, 41
- Kaspi & Beloborodov (2017) Kaspi, V. M., & Beloborodov, A. M. 2017, Annual Review of Astronomy and Astrophysics, 55, 261
- Knödlseder et al. (2005) Knödlseder, J., Jean, P., Lonjou, V., et al. 2005, Astronomy & Astrophysics, 441, 513
- Kochkin et al. (2018) Kochkin, P., Sarria, D., Skeie, C., et al. 2018, Journal of Geophysical Research (Atmospheres), 123, 8074
- Kumar & Zhang (2015) Kumar, P., & Zhang, B. 2015, Physics Reports, 561, 1
- Lebrun et al. (2003) Lebrun, F., Leray, J. P., Lavocat, P., et al. 2003, Astronomy & Astrophysics, 411, L141
- Lien et al. (2016) Lien, A., Sakamoto, T., Barthelmy, S. D., et al. 2016, The Astrophysical Journal, 829, 7
- Lindanger et al. (2021) Lindanger, A., Marisaldi, M., Sarria, D., et al. 2021, Journal of Geophysical Research (Atmospheres), 126, e2021JD035347
- Lund et al. (2003) Lund, N., Budtz-Jørgensen, C., Westergaard, N. J., et al. 2003, Astronomy & Astrophysics, 411, L231
- MacFadyen & Woosley (1999) MacFadyen, A. I., & Woosley, S. E. 1999, The Astrophysical Journal, 524, 262
- Marisaldi et al. (2015) Marisaldi, M., Argan, A., Ursi, A., et al. 2015, Geophysical Research Letters, 42, 9481
- Marisaldi et al. (2010) Marisaldi, M., Fuschino, F., Labanti, C., et al. 2010, Journal of Geophysical Research (Space Physics), 115, A00E13
- Mazets et al. (1999) Mazets, E. P., Cline, T. L., Aptekar’, R. L., et al. 1999, Astronomy Letters, 25, 635
- Mazets et al. (1982) Mazets, E. P., Golenetskii, S. V., Gurian, I. A., & Ilinskii, V. N. 1982, Astrophysics and Space Science, 84, 173
- Mazets et al. (1979) Mazets, E. P., Golentskii, S. V., Ilinskii, V. N., Aptekar, R. L., & Guryan, I. A. 1979, Nature, 282, 587
- Meegan et al. (2009) Meegan, C., Lichti, G., Bhat, P. N., et al. 2009, The Astrophysical Journal, 702, 791
- Mereghetti et al. (2024) Mereghetti, S., Rigoselli, M., Salvaterra, R., et al. 2024, Nature, 629, 58
- Minaev et al. (2024) Minaev, P. Y., Pozanenko, A. S., Grebenev, S. A., et al. 2024, Astronomy Letters, 50, 1
- Palmer et al. (2005) Palmer, D. M., Barthelmy, S., Gehrels, N., et al. 2005, Nature, 434, 1107
- Pe’er et al. (2006) Pe’er, A., Mészáros, P., & Rees, M. J. 2006, The Astrophysical Journal, 642, 995
- Ryde et al. (2010) Ryde, F., Axelsson, M., Zhang, B. B., et al. 2010, The Astrophysical Journal Letters, 709, L172
- Smith et al. (2005) Smith, D. M., Lopez, L. I., Lin, R. P., & Barrington-Leigh, C. P. 2005, Science, 307, 1085
- Smith (2019) Smith, J., 2019, in 36th International Cosmic Ray Conference (ICRC2019), Vol. 36, International Cosmic Ray Conference, 604
- Thompson & Duncan (1995) Thompson, C., & Duncan, R. C. 1995, Monthly Notices of the Royal Astronomical Society, 275, 255
- Thompson & Duncan (1996) Thompson, C., & Duncan, R. C. 1996, The Astrophysical Journal, 473, 322
- Tomsick et al. (2023) Tomsick, J. A., Boggs, S. E., Zoglauer, A., et al. 2023, arXiv e-prints, arXiv:2308.12362
- Tsvetkova et al. (2022) Tsvetkova, A., Svinkin, D., Karpov, S., & Frederiks, D. 2022, Universe, 8, 373
- Vedrenne et al. (2003) Vedrenne, G., Roques, J. P., Schönfelder, V., et al. 2003, Astronomy & Astrophysics, 411, L63
- Wada et al. (2019) Wada, Y., Enoto, T., Nakamura, Y., et al. 2019, Communications Physics, 2, 67
- Zoglauer et al. (2006) Zoglauer, A., Andritschke, R., & Schopper, F. 2006, New Astronomy Reviews, 50, 629