CorMulT: A Semi-supervised Modality Correlation-aware Multimodal Transformer for Sentiment Analysis
Abstract.
Multimodal sentiment analysis is an active research area that combines multiple data modalities, e.g., text, image and audio, to analyze human emotions and benefits a variety of applications. Existing multimodal sentiment analysis methods can be classified as modality interaction-based methods, modality transformation-based methods and modality similarity-based methods. However, most of these methods highly rely on the strong correlations between modalities, and cannot fully uncover and utilize the correlations between modalities to enhance sentiment analysis. Therefore, these methods usually achieve bad performance for identifying the sentiment of multimodal data with weak correlations. To address this issue, we proposed a two-stage semi-supervised model termed Correlation-aware Multimodal Transformer (CorMulT) which consists pre-training stage and prediction stage. At the pre-training stage, a modality correlation contrastive learning module is designed to efficiently learn modality correlation coefficients between different modalities. At the prediction stage, the learned correlation coefficients are fused with modality representations to make the sentiment prediction. According to the experiments on the popular multimodal dataset CMU-MOSEI, CorMulT obviously surpasses state-of-the-art multimodal sentiment analysis methods.
1. Introduction
Multimodal sentiment analysis combines multiple perceptual modalities such as text, image, audio and video to analyze and understand human emotions. Currently, multimodal sentiment analysis has been widely applied in various domains, including predicting movie box office performance (Asur and Huberman, 2010), predicting stock market performance (Bol, 2011), and predicting political election results (Tumasjan et al., 2011).
The general paradigm of multimodal sentiment analysis is to extract emotional information from multiple modalities and fuse them together to achieve a more comprehensive and accurate understanding of emotions. Existing methods for multimodal sentiment analysis can be roughly classified into three categories, i.e., modality interaction-based methods, modality transformation-based methods, and modality similarity-based methods. Modality interaction-based methods emphasize on learning the interactions and dependencies between different modalities to combine them together. The representative methods are MultiModal InfoMax (Han et al., 2021) and MMLatch (Paraskevopoulos et al., 2022). Modality transformation-based methods select one modality as the primary modality, and extract information from other modalities to obtain cross-modal representation. The representative methods include BAFN (Tang et al., 2023) and RAVEN (Wang et al., 2019). Modality similarity-based methods compare the features between different modalities for deep understanding of sentiment, and the representative methods include Misa (Hazarika et al., 2020) and MUET (Liu et al., 2022).
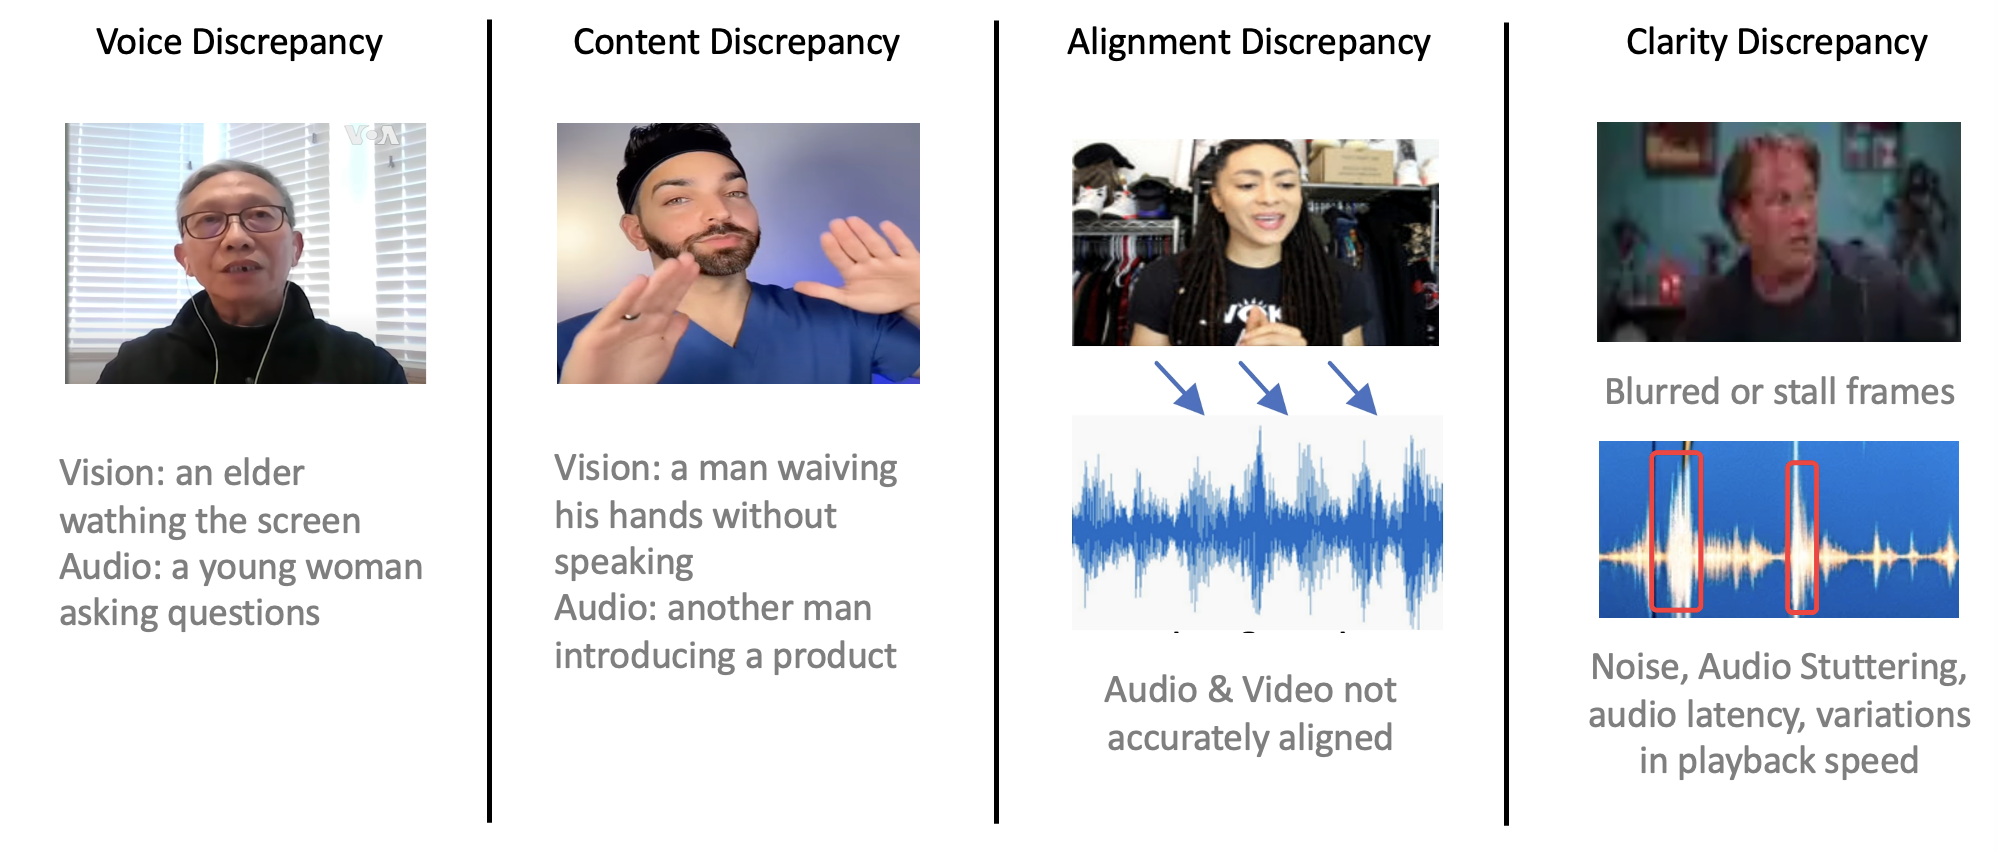
However, most existing methods for multimoal sentiment analysis heavily rely on the assumption of strong correlations between modalities, and have not yet fully explored and examined the correlations between modalites. In this case, they may achieve bad performance for identifying the sentiment for multimodal data with weak correlations. In general, strong modality correlations are characterized by a well-aligned, consistent, and strongly related representation of objects across visual, textual, and audio aspects, with minimal noise interference such as irrelevant visual elements and background sounds. Conversely, weak modality correlations are often plagued with different discrepancies as illustrated in Fig. 1. Voice discrepancy arises when non-primary sounds overshadow the main audio subjects. Content discrepancy occurs when there is an inconsistency between the objects described in text and those depicted in images. Alignment discrepancy is the inability to achieve a complete synchronization across modalities. Clarity discrepancy refers to the presence of excessive noises that muddle the primary signals. In practice, it is difficult for existing multimodal sentiment analysis methods to accurately decide the sentiment of data samples with such discrepancies.
To address the above issue, this work proposed a two-stage semi-supervised model termed Correlation-aware Multimodal Transformer (CorMulT). CorMulT develops a novel modality correlation constractive learning module to learn modality correlation coefficients between different modalities at the pre-training stage. Then, the learned correlation coefficients are fused with the modality representations to produce the sentiment classification results.
In sum, the contributions of this work are threefold as highlighted below.
-
•
We identified the issue of weak modality correlations in existing multimodal sentiment analysis methods, and proposed the CorMulT model to address this issue by accurately learning the correlations between modalities and fusing the learned correlations with modality representation to enhance sentiment analysis.
-
•
We proposed the modality correlation evaluator, a pre-trained model based on contrastive learning, to learn the correlations between modalities by transforming multimodal features into a shared correlation space in which the distance between different modalities could be effectively quantified.
-
•
We conducted extensive experiments to evaluate the effectiveness of the proposed method, and the results show that our method largely outperforms state-of-the-art multimodal sentiment analysis methods.
2. Related Work
In this section, we provide more details about the three categories of multimodal sentiment analysis methods, i.e., modality interaction-based methods, modality transformation-based methods, and modality similarity-based methods.
2.1. Modality Interaction-based Methods
These methods focus on capturing the dynamic interactions and dependencies between different modalities during the process of combining information from multiple modalities. Wei et al. (Han et al., 2021) proposed MultiModal InfoMax (MMIM) to maximize the mutual information between unimodal input pairs, and that between the fusion results and low-level unimodal input representations to preserve task-relevant information during multimodal fusion. Paraskevopoulos et al. (Paraskevopoulos et al., 2022) utilized a forward feedback mechanism to capture the top-down cross-modal interactions and achieved multi-modal fusion during network training by masking sensory inputs with higher-level representations extracted from each modality. Kumar et al. (Kumar and Vepa, 2020) utilized self-attention to capture the long-term context and employed a gating mechanism to selectively learn weak contributing features. Sun et al. (Sun et al., 2023) proposed a general debiasing framework based on Inverse Probability Weighting (IPW), which adaptively assigns small weights to the samples with larger bias to avoid fitting the spurious correlations between multimodal features and sentiment labels. Xue et al. (Xue et al., 2023) proposed a multi-level attention map network (MAMN) to filter noise before multimodal fusion and capture the consistent and heterogeneous correlations among multi-granularity features. Quan et al. (Quan et al., 2022) proposed a multimodal comparative learning interaction module to better focus on the characteristics of different modalities. He et al. (He et al., 2023c) proposed a multimodal mutual attention-based sentiment analysis (MMSA) framework that uses three levels of subtasks to preserve the unimodal unique semantics and enhance the common semantics of multimodal data. Wang et al. (Wang et al., 2023a) introduced supervised contrastive learning to learn effective and comprehensive multimodal data representation. Liu et al. (Liu et al., 2023) proposed the Scanning, Attention and Reasoning (SAR) model for multimodal sentiment analysis, where a perceptual scanning model is designed to perceive the image and text content, as well as the intrinsic correlations between them. Wang et al. (Wang et al., 2023b) proposed a model to assist in learning modality representations with multitask learning and contrastive learning. Tsai et al. (Tsai et al., 2019) repeatedly reinforce the features of the target modality using low-level features of the source modality, thus ensuring cross-modal interactions and addressing the alignment issue between different modalities. Yu et al. (Yu et al., 2023) proposed a cyclic memory enhancement network for capturing the long-term dependencies in multimodal data. Ping et al. (He et al., 2023a) proposed a novel temporal position prediction task for speech-text alignment to deal with the cross-modal alignment issue. Cheng et al. (Cheng et al., 2023) and Ye et al. (He et al., 2022) proposed Attentional Temporal Convolutional Network (ATCN) and Multimodal Temporal Attention (MMTA) to extract unimodal temporal features for adaptive inter-modal balance. Lin et al. (Lin and Hu, 2023) and He et al. (He et al., 2023b) narrowed the gap among different modalities by transferring the sentiment-related knowledge.
2.2. Modality Transformation-based Methods
In this category of methods, one modality serves as the primary modality while the others serve as supplementary modalities. For example, Khan et al. (Khan and Fu, 2021) developed a two-stream model that converts image modality to textual representations as auxiliary text, thereby providing more information for the text modality. Wang et al. (Wang et al., 2019) obtained the text drift vectors using non-textual data, e.g., audio and image modalities, thus achieving drifted word embedding. Majumder et al. (Majumder et al., 2017) mapped the personality traits from textual documents to audio and visual modalities to improve the effectiveness of sentiment analysis. Tang et al. (Tang et al., 2023) introduced a more discriminating text modality to guide the dynamic learning of emotional context within modalities, thus reducing the redundant information in auxiliary modalities during the modality transformation process. He et al. (He and Hu, 2022) fused nonverbal embedding with language embedding before inputting them into Bert to obtain multimodal representations. However, according to Gan et al. (Gan et al., 2015), pure modality transformation methods often underperform the methods that consider the interaction between modalities, which could be because modality transformation methods overlook the inherent correlations between modalities and result in the loss of information.
2.3. Modality Similarity-based Methods
These methods compare the features across different modalities to facilitate the analysis of their sentiment. For instance, Yu et al. (Yu et al., 2021) jointly trained multimodal and unimodal tasks to learn the consistency and differences in modality representations. Hazarika et al. (Hazarika et al., 2020) projected each modality into two subspaces, i.e., modality-invariant subspace and modality-specific subspace, where modality-invariant subspace facilitates cross-modal representation learning to reduce modality discrepancies, and modality-specific subspace captures the distinctive features of each modality. Mai et al. (Mai et al., 2022) proposed curriculum learning for weakly supervised modality correlations, which leverage limited or noisy labeled data to align and correlate features across different modalities, to learn a more discriminative embedding space for multimodal data. However, they often struggle with the ambiguity and sparsity of weak labels, which can lead to suboptimal learning of true modality correlations. In summary, although these methods are capable of learning certain correlations between modalities, they often fall short in further refining and integrating the learned correlations for sentiment analysis, and are thus unable to achieve outstanding performance.
2.4. Discussion
As described above, most existing multimodal sentiment analysis models rely on the assumption of strong correlations between modalities. However, a large amount of multimodal data may not exhibit strong correlations. As a result, the correlations between modalities have not been fully explored and utilized in most models. Besides, it is labor-intensive and impractical to manually filter all the data samples with low modality correlations, and existing methods like cross-modal alignment also cannot solve the problem. Therefore, this work proposed the two-stage model CorMulT. At the pre-training stage, CorMulT learns the modality correlation coefficients via a modality correlation contrastive learning module. At the prediction stage, the learned modality correlation coefficients are fused with the modality representations to enhance the sentiment prediction.
3. Methodology
3.1. Overview
Fig. 2 illustrates the architecture of Modality Correlation-aware Multimodal Transformer (CorMulT) which consists of modality correlation contrastive learning module and correlation-aware multimodal transformer module. Different modalities are first fed into the modality correlation contrastive learning module to obtain modality correlation coefficients which are then fused with the modality representations in the correlation-aware multimodal transformer module for predicting the sentiment.
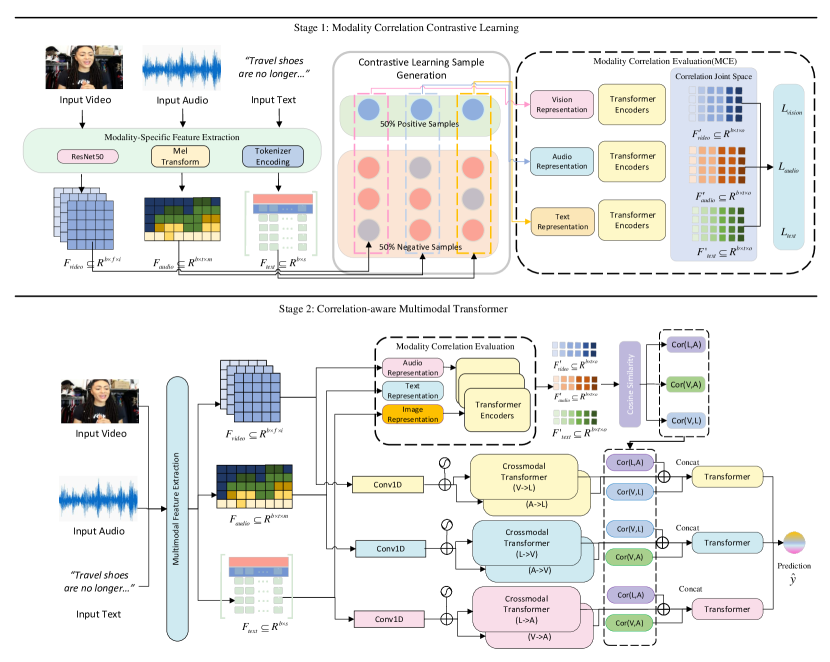
3.2. Modality Correlation Contrastive Learning
Modality correlation contrastive learning module utilizes the contrastive learning framework to learn the correlation coefficients between different modalities. This module consists of two submodules, i.e., modality-specific feature extraction and modality correlation evaluation. The modality-specific feature extraction module is responsible for extracting unimodal features from the three modalities, i.e., audio, image and text. The modality correlation evaluation module analyzes the correlations between different modalities.
3.2.1. Modality-Specific Feature Extraction
To encode different modalities into unimodal representations, different feature extraction methods are employed according to the characteristics of the modalities.
For audio encoding, we employ the Mel spectrogram (Yang et al., 2023), a widely used visual representation in audio processing that transforms the audio signals into an image-like format. Initially, we capture the spectral characteristics of the audio signals using the Short-Time Fourier Transform (STFT) which decomposes the audio signals into frequency components over short time intervals and produces a time-frequency representation, i.e.,
| (1) |
where represents the coefficient value of the STFT matrix for the frequency at the frame, denotes the value of input audio signal at time , denotes the value of window function at time , denotes the sampling point on the frequency axis, and represents the number of points in the Fast Fourier Transform (FFT).
Next, we convert the STFT representations into the Mel spectrogram which offers a more perceptually relevant representation of the audio. This conversion involves a set of Mel filters that mimic the human auditory system’s response to different frequencies. These filters capture the energy within specific frequency ranges, i.e.,
| (2) |
where represents the frequency value of the sampling point on the frequency axis, represents the center frequency of the Mel frequency band, and denotes the output of the Mel filter bank for the frequency. The Mel filter bank applies a set of triangular filters to map the STFT coefficients to the Mel scale. The dimension of is , where denotes the number of Mel frequency bands, and denotes the number of STFT coefficients.
To further enhance the audio signal representation, we calculate the logarithm of the Mel spectrogram. This process transforms the power spectrum obtained from the STFT into a logarithmic scale, which more closely mirrors human auditory perception. The logarithmic Mel spectrogram is represented as follows:
| (3) |
where denotes the log-transformed Mel spectrogram value for the Mel frequency band at the time frame. The Mel spectrogram matrix is defined in the context of , where represents the batch size, represents the number of time frames, and represents the number of Mel frequency bins. This logarithmic scaling of the Mel spectrogram not only enhances the representation of the audio signals by emphasizing the perceptually important aspects of the sound, but also stabilizes the numerical range, thus facilitating more effective model training.
By employing the Mel spectrogram and its logarithm, we obtain a compact and informative visual representation of the audio signal, enabling our model to well learn the patterns in the frequency content of the audio.
For text encoding, the input text is first tokenized using the BertTokenizer to generate a sequence of tokens . Next, a vocabulary is created using the CMU_MOSEI dataset, which contains a collection of words and their corresponding numerical representations. The tokens are then encoded using the vocabulary to obtain the encoded sequence . To ensure uniformity in the input size, the encoded sequence is padded or truncated to a pre-defined sequence length. The final representation of the text input is , where is the batch size and is the sequence length.
For image encoding, we first decode the video data into image frames using the OpenCV library. To extract high-level features from image frames, we utilize ResNet50 to learn the feature representation of each image frame . To reduce the dimension of the extracted features, we employ pooling operation to aggregate information within local regions, thus capturing the most salient features while reducing the overall dimension. The final video representation is obtained in an space, where represents the batch size, corresponds to the number of image frames, and is the feature dimension.
3.2.2. Sample Generation for Contrastive Learning
Most existing methods for multimodal sentiment analysis heavily rely on the manually annotated datasets. However, few datasets have explicit annotation for modality correlations. Therefore, we introduce contrastive learning to unify the unimodal data representations. To this end, the critical task is to generate effective positive and negative data samples.
Since most video data in our daily life exhibits inter-modality correlations, we thus employ multiple enhancement techniques, including temporal shift, cross-sample mixing, and data perturbation, to generate negative samples. Temporal shift slightly shift the time alignment of different modalities within a sample to create negative samples. For example, for the audio and image modalities of a video, they can be shifted slightly out of sync to create negative samples. Cross-sample mixing mix modalities across different samples to create negative samples. For example, the audio from one video can be mixed with the visual component of another video to create negative samples. Data perturbation introduces perturbations, e.g., noise and image transformations, to produce negative samples. For example, adding noise to an image can create a negative sample that is similar to the original image.
3.2.3. Modality Correlation Evaluation
The unimodal representations are then fed into modality correlation evaluation (MCE) module to evaluate the correlations between different modalities. Fig. 3 shows the structure of MCE module. which consists of modality transformation layer, cross-attention layer, feedforward layers, similarity analysis layer, and loss calculation layer. The modality transformation layer aims to transform the input data into higher-level representations with dimensions equal to the hidden layer dimension. The cross-attention layer computes the attention scores across modalities to reveal the interrelations among text, audio, and images. The feedforward layers linearly transform the attention results, i.e., mapping them to the pre-defined output dimension. The goal of MCE is to minimize the triplet loss function which calculates the disparity between the predicted outputs and labels.
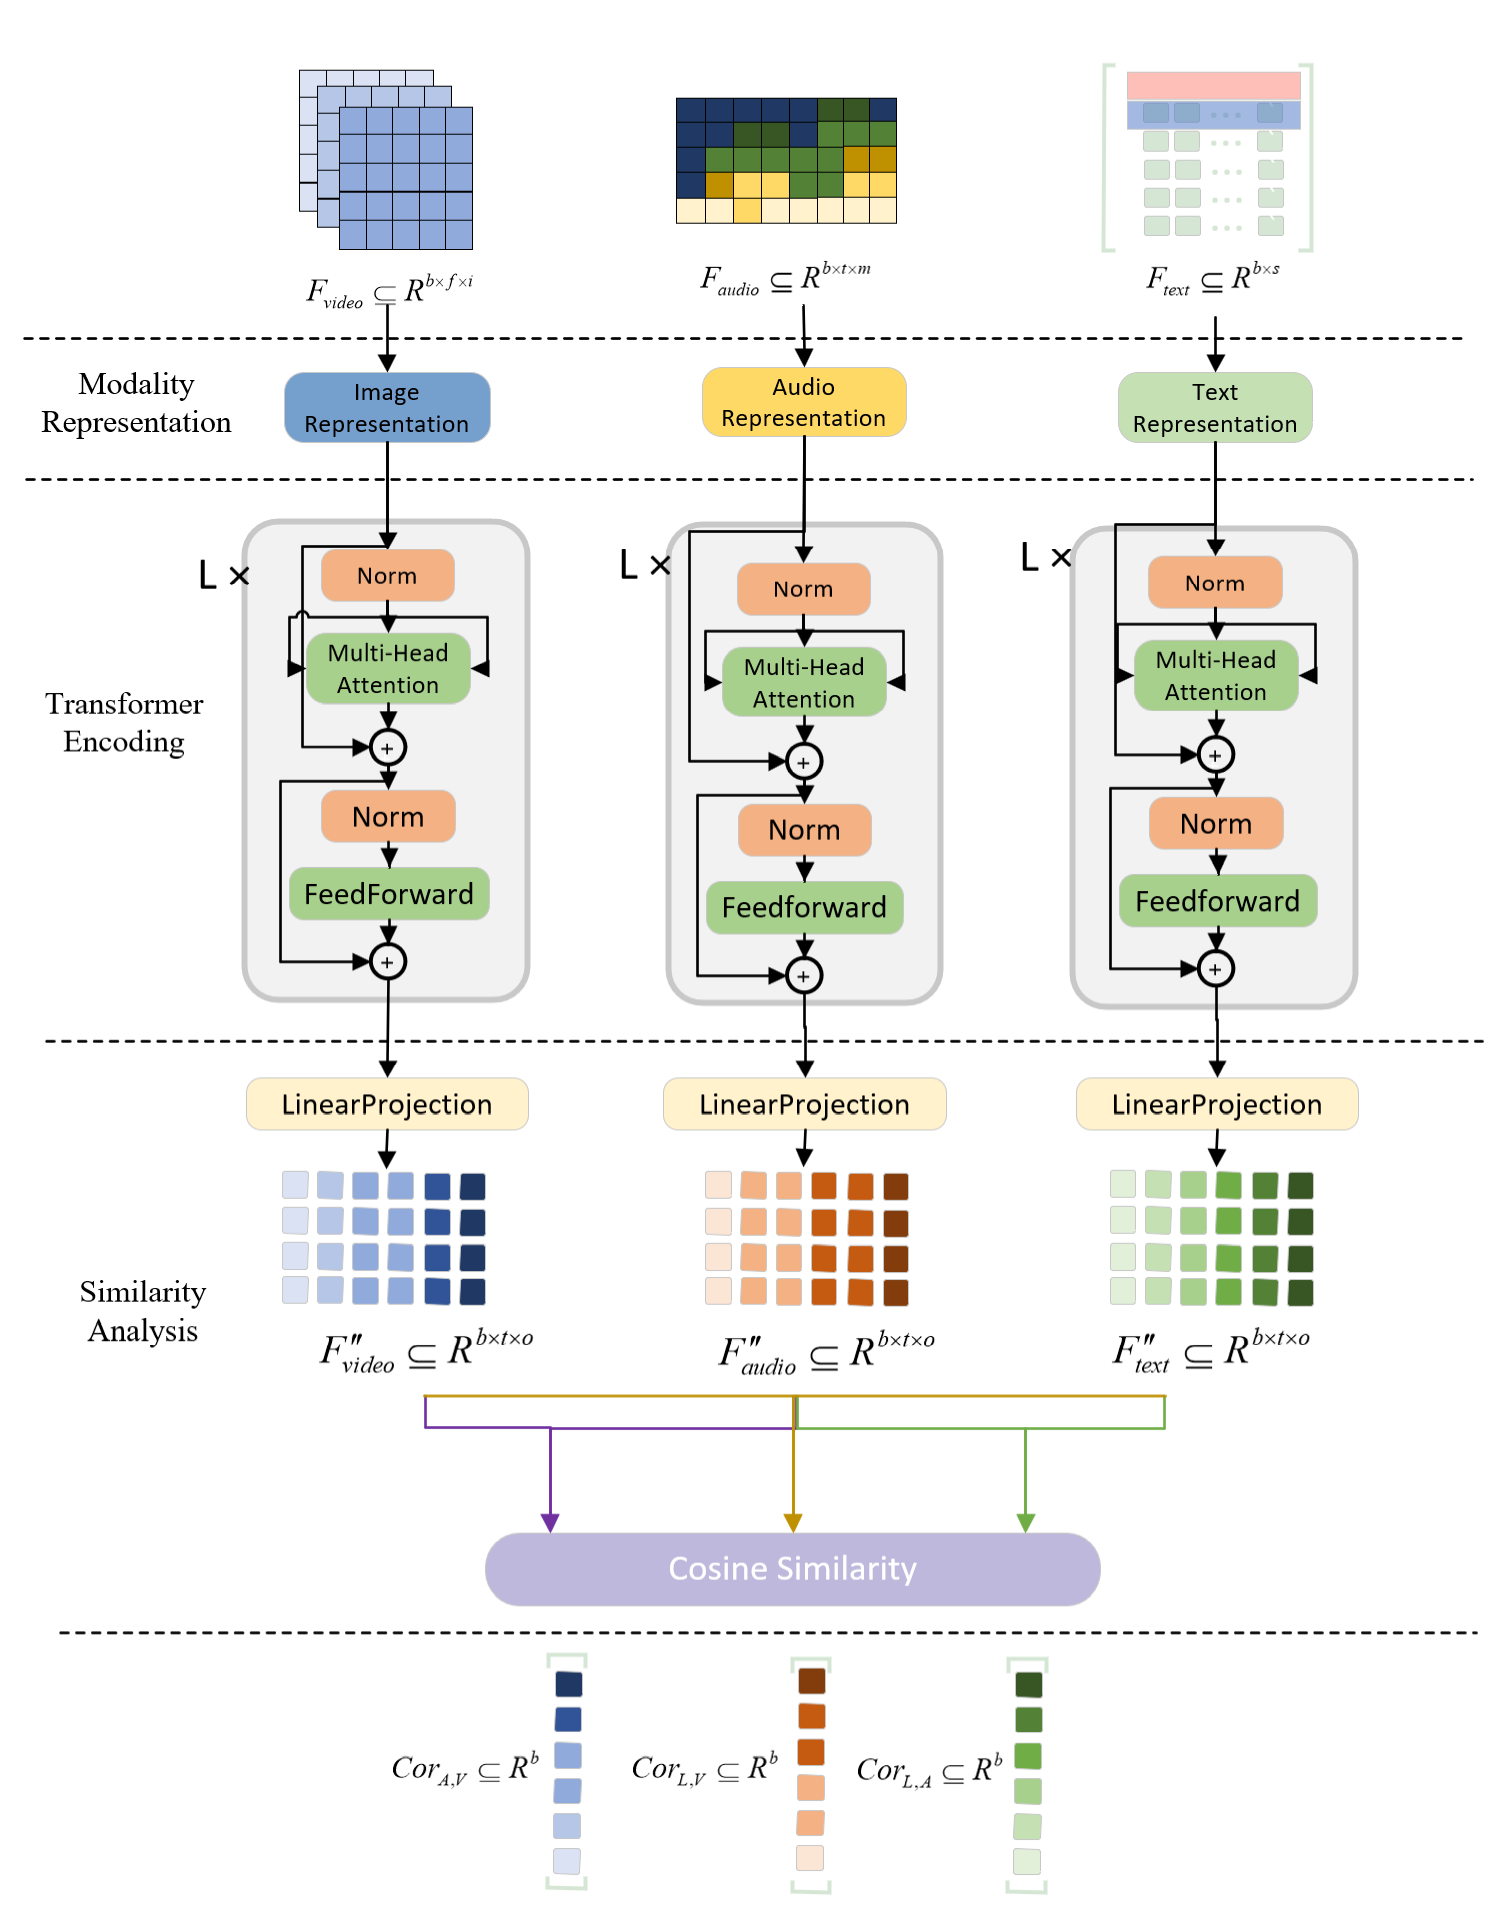
Modality representation. For audio modality, its unimodal representation is converted to a representation of dimension after positional encoding, where is the hidden layer dimension. For text modality, after the positional encoding and textual embedding, the unimodal representation is converted to , where denotes the text sequence length. For image modality, after positional encoding and visual embedding, its unimodal representation is transformed to .
Transformer Encoding.The encoder consists for three layers, and takes as inputs the and to generate compact and consistent representation for each modality. The implementation details of the encoder are discussed as follows.
First, the input is normalized to obtain using the LayerNorm function, i.e.,
| (4) |
where denotes the unimodal representation of certain modality. Next, is passed through the Multihead Attention to produce , i.e.,
| (5) |
where is used as query , key , and value .
To well preserve the original information, a residual connection is established between and , and the results are normalized using LayerNorm, i.e.,
| (6) |
The normalized is then fed into the FeedForward layer, and the results are combined with to produce the final output of tranformer encoding, i.e.,
| (7) |
Transformer encoding effectively encodes the inputs and for different modalities to learn their compact representations for further processing.
Similarity Analysis. After the features are encoded, linear transformation is implemented to project for each modality to a shared correlation space for similarity comparison. Thus, we obtain and for audio, vision, and text modalities, respectively. In this space, the features from different modalities help determine the inter-modal correlations. For audio, vision and text, the mapped feature matrices in the space of , where is the temporal output mapping parameter and is the feature dimension output mapping parameter. adjusts the temporal dimension mapping of features, while defines the dimensionality of features in the output space. Together, these parameters enable the mapping of outputs from different modalities into a unified feature space, facilitating operations such as similarity comparison.
Then, we use cosine similarity to measure the correlations between different modalities, and obtain the pair-wised cross-modal correlation coefficients, i.e., , and .
3.2.4. Loss calculation.
We designed a triple-loss function (TL) to minimize the disparity between each modality’s feature matrix in space and those of the other modalities, thus enhancing the interaction among modalities to improve joint representation learning.
Concretely, the TL function measures and optimizes the relationship between the feature matrix of each modality () against positive () and negative () feature matrices of another modality, where ”positive” refers to the highly correlated modalities, and ”negative” indicates the uncorrelated ones, aiming to foster closer feature vectors among related modalities while enlarging the distance between unrelated ones.
For three modalities, the corresponding losses (, , ) are derived from their similarity with the features of the other two modalities, i.e.,
| (8) |
The final loss for modality correlation evaluation is which could enhance the interactions among different modalities and promote an equitable contribution from each modality towards the overall learning objective.
3.3. Correlation-aware Multimodal Transformer
Correlation-aware multimodal transformer receives as inputs the features extracted from the audio, image, and text modalities by the feature extraction module, and merges them with the modality correlations learned by the MCE module for sentiment analysis.
3.3.1. Multimodal Feature Learning
For each modality , where , , and denote the text, audio, and visual data, respectively, we project the extracted feature via a 1D convolution layer to a common feature dimension to obtain , i.e.,
After projection, we apply two successive crossmodal transformer layers to align unmodal representations. Each layer takes the projected features of one modality as the query, and the features of another modality as the key and value to achieve crossmodal interactions, i.e.,
where represents the output of the crossmodal transformer layer, and modality is enriched with the information from modality .
3.3.2. Modality Correlation-enhanced Multimodal Fusion
Both inter and intra-modality information are incorporated with the results of modality correlation analysis. First, we perform correlation analysis using the pre-trained MCE model, i.e.,
where , and represent the pair-wised modality correlation coefficients.
Then, we obtain the feature representation for each pair of modality using the cross-modal attention and self-attention layers. These features are then integrated with modality correlation coefficients to produce comprehensive representations that encompass both intra-modal and inter-modal information, i.e.,
where are the modality-specific feature representations enhanced by their corresponding modality correlation coefficients, signifying the weighted importance of one modality’s features in the context of another.
Subsequently, we utilize the self-attention to further refine the fused features for culminating in a holistic representation, i.e.,
where are the final feature representations for text, audio, and visual modalities, respectively. Then, the learned representations for three modalities are concatenated together to obtain the comprehensive representation about the multimodal data sample, i.e.,
Finally, the sentiment prediction is attained through a linear projection layer and a Softmax layer. The most probable sentiment class is determined by the index of the maximum value in the Softmax output, i.e.,
where is the probability distribution over sentiment classes, and the predicted sentiment class is given by:
where is the index of the highest probability in the vector , corresponding to the most likely sentiment class.
4. Experiments
4.1. Dataset and Settings
4.1.1. Dataset
We conduct experiments over the CMU_MOSEI dataset which is a widely used benchmark for multimodal sentiment analysis. This dataset contains 23,453 distinct video clips that cover diverse domains, including reviews, debates and consults. Each video clip has three modalities, i.e., video, audio and text, and is labelled with seven classes of fundamental emotions with an intensity scale from -3 to 3. Table 1 provides the statistical details of CMU_MOSEI dataset. For our experiments, we allocate 70% of the dataset(16,417 clips) to the training set, 15% to the validation set(3,518 clips), and 15% to the test set(3,518 clips).
| Feature | Description |
| Source | YouTube |
| Physical Size | 106GB |
| Total Samples | 23,453 |
| Video Clips | 3,228 |
| Frame Rate | 30Hz |
| Unique Speakers | 1,000 |
| Distinct Topics | 251 |
| Avg. Sentence Number | 7.3 |
| Avg. Sentence Length | 7.28 seconds |
| Modalities | Text (l), Visual (v), Audio (a) |
| Labels | Emotion [-3,3] |
| Total Duration | 65 hrs 53 mins 36 secs |
| Primary Domains | Reviews 16.2%, Debates 2.9%, Consults 1.8% |
4.1.2. Experiment Settings
All experiments were conducted on a server equipped with an Intel SkyLake-E 12-core processor and a GeForce GTX 1180 graphics card. We run each experiment five times, and report the average results. Multiple evaluation metrics as listed below are introduced to evaluate the performance of CorMult model and the baseline multimodal sentiment analysis methods.
-
•
Acc@7: the accuracy of predicting all seven emotion class labels.
-
•
Acc@2: the accuracy of predicting the top two emotion class labels.
-
•
F1: the harmonic mean of prediction precision and recall.
-
•
MAE: the mean absolute error that measures the average deviation between the predicted results and true emotion values.
-
•
Corr: the correlation coefficient between the prediction results and true emotion values.
4.2. Effects of Perturbation Strategy
The following four negative sample generation strategies are considered for contrastive learning.
Strategy A: For each data sample, we randomly choose one modality and replace it with the corresponding modality from another randomly selected data sample in the same batch.
Strategy B: For audio and video modalities, we introduce a time offset, e.g., one second, between them. For text, an offset of one word is introduced.
Strategy C: For audio and video modalities, a Gaussian noise is added. For text, words or characters are randomly replaced.
Strategy D: A combination of strategies A, B, and C, i.e., randomly selecting one of the three strategies above.
Each strategy is applied across the entire training dataset. Training parameters and model architectures are consistent across strategies to ensure a fair comparison. Table 2 presents the sentiment analysis results while using different data perturbation strategies. Among the four strategies, Strategy D achieves the highest values in terms of the four performance evaluation metrics, indicating the advantage of combining multiple data perturbation strategies.
| Strategy | |||||
| A | 52.1 | 85.9 | 85.7 | 0.553 | 0.747 |
| B | 51.2 | 83.1 | 83.7 | 0.554 | 0.759 |
| C | 52.1 | 83.3 | 83.9 | 0.582 | 0.754 |
| D | 52.8 | 86.5 | 86.7 | 0.552 | 0.779 |
| Average | 51.1 | 83.3 | 83.5 | 0.551 | 0.758 |
4.3. Effects of Distance Measurement
The MCE module in CorMult model maps the learned audio, image, and text to a unified shared space termed the Correlation Joint Space. In this space, the semantic correlations between different data modalities can be more easily evaluated. We seek to identify the most appropriate distance metric to measure modality correlations by evaluating different similarity measures. Concretely, given two vectors and , the metrics under consideration include Euclidean distance, Manhattan distance, Chebyshev distance, cosine similarity, and Mahalanobis distance, i.e.,
(1) Euclidean Distance:
(2) Manhattan Distance:
(3) Chebyshev Distance:
(4) Cosine Similarity:
(5) Mahalanobis Distance with covariance matrix :
where and represent the components of vectors and , respectively.
Table 3 presents the results of CorMulT while using different distance measurement methods. According to the results, cosine similarity and Euclidean distance are the top performers. Given the overall assessment, cosine similarity emerges as the optimal distance metric for MCE, and could efficiently capture the inter-modal correlations.
| Distance | Acc@7 | Acc@2 | F1 | MAE | Corr |
| Euclidean Distance | 52.6 | 86.3 | 86.4 | 54.8 | 77.4 |
| Manhattan Distance | 52.5 | 86.0 | 85.6 | 55.1 | 77.4 |
| Chebyshev Distance | 52.6 | 85.7 | 86.3 | 55.2 | 76.9 |
| Cosine Similarity | 52.8 | 86.5 | 86.7 | 55.2 | 77.9 |
| Mahalanobis Distance | 52.4 | 85.8 | 86.0 | 54.7 | 77.6 |
4.4. Parameters Tuning
In this experiment, we investigate two mapping parameters: temporal mapping dimension and feature mapping dimension .
Initially, preset values for were set as and for as . This resulted in 165 potential combinations. For each combination, a unique MCE model was trained with identical feature extractors and Transformer Encoder architecture but different and for shared space mapping. Every model was trained and validated on the CMU_MOSEI dataset, ensuring consistent splits. To mitigate randomness, each was executed five times, averaging the performance. Considering the vast data size, only the initial 10% of the CMU_MOSEI dataset was used for training comparison.
Beyond the tri-modal triplet loss (LOSS) for evaluating MCE’s modal correlation learning capability, the epoch time was introduced as a measure of pre-training efficiency. Note, the epoch time here pertains only to the first 10% of the CMU_MOSEI dataset, equating to 2300 audio samples.
From the graphs, when is between 2-48, higher losses were observed, but post-48, the loss maintained between 0.16-0.18. Best results appeared within , slightly increasing after 64. For , results were generally better post-200, with a slight decline in performance within the 300-1000 range. The optimal range for was determined to be 200-300.
Considering both training loss and epoch time, the results suggest that while both and had incremental effects on epoch time, had a more pronounced impact. Hence, based on a combined assessment of loss and efficiency, the chosen dimensions for shared space are .
4.5. Model Comparison
In this experiment, our CorMulT model is compared with leading existing multimodal sentiment analysis models. We also performed ablation studies within CorMulT to evaluate different modalities.
| Model | Modality | Acc@7 | Acc@2 | F1 | MAE | Corr |
| EF-LSTM | V+A+T | 43.8 | 75.2 | 75.3 | 0.659 | 0.609 |
| LMF | V+A+T | 48.1 | 82.1 | 82 | 0.623 | 0.677 |
| TFN | V+A+T | 50.2 | 82.5 | 82.1 | 0.593 | 0.701 |
| MFM | V+A+T | 50.3 | 82.4 | 82.3 | 0.568 | 0.717 |
| CM-Bert | V+T | 50.5 | 83.6 | 83.5 | 0.646 | 0.747 |
| MISA | V+A+T | 50.7 | 83.9 | 83.8 | 0.557 | 0.748 |
| BBFN | V+A+T | 50.8 | 82.2 | 82.2 | 0.526 | 0.761 |
| MULT | V+A+T | 51.1 | 83.3 | 83.5 | 0.551 | 0.758 |
| ICCN | V+A+T | 51.2 | 82.2 | 82.4 | 0.565 | 0.713 |
| MMLatch | V+A+T | 52.1 | 83.3 | 83.9 | 0.582 | 0.754 |
| CorMulT | V+A+T | 52.8 | 86.5 | 86.7 | 0.552 | 0.779 |
Table 4 compares CorMulT with traditional benchmarks like EF-LSTM, LMF(Liu et al., 2018), and TFN(Zadeh et al., 2017), along with recent high-performing models such as CM-Bert and MISA(Hazarika et al., 2020), BBFN(Han et al., 2021), ICCN(ICCN). Across all models, our CorMulT exhibited superior performance.
Specifically, considering the F1 score and accuracy metrics (Acc@2, Acc@7), CorMulT distinctly outperformed other models. On Acc@7, CorMulT achieved 52.8%, surpassing the next best, MMLatch, at 52.1%. Similarly, for Acc@2, CorMulT scored 86.5%, notably better than MISA’s 83.9%, underlining its predictive accuracy.
Regarding the F1 score, CorMulT’s 86.7% markedly eclipsed others, showcasing its robustness, given F1’s representation as the harmonic mean of precision and recall. The MAE for CorMulT at 0.552 wasn’t distinctly superior but remained competitive, especially considering its pronounced advantages in other metrics.
Lastly, examining Corr (correlation), CorMulT excelled with a score of 0.779, substantially ahead of BBFN’s 0.761, underscoring its adeptness in comprehending multimodal data intricacies.
In conclusion, our CorMulT model manifests significant superiority in multimodal sentiment analysis, whether in accuracy, F1 scores, or correlation, further attesting to its efficacy and prominence in this domain.
4.6. Ablation Studies
To clearly verify the effectiveness of our MCE modality-correlated pre-training model and the internal details of MCE, we conducted two sets of ablation studies. The studies respectively validate the influence of MCE multimodal feature extraction modules and the number of pre-trained modalities incorporated into the CorMulT model.
In our Modality-Specific Feature Extraction module, we provided specialized treatment for the uniqueness of the three types of data. To validate its impact, we specifically analyze the Mel spectrum matrix transformation for audio data and the ResNet50 image feature mapping.
| Strategy | L_A | L_T | L_V | L_ave | Epoch_time |
| None | 0.251 | 0.219 | 0.474 | 0.315 | 178.24 |
| Mel(Audio) | 0.191 | 0.169 | 0.449 | 0.270 | 175.43 |
| Res(Vision) | 0.149 | 0.143 | 0.232 | 0.174 | 43.14 |
| Full | 0.136 | 0.142 | 0.225 | 0.168 | 41.02 |
From the results, the specialized treatment strategies in the Modality-Specific Feature Extraction module showed significant effectiveness. By using both strategies, LOSS_ave was reduced from 0.315 to 0.168, and the training time decreased from 178.24 to 41.02.
We also tested our CorMulT model under various pre-trained modality combinations, including pre: comb, pre: A+T, pre: V+T, and pre: V+A+T.
| Modality | Acc@7 | Acc@2 | F1 | MAE | Corr |
| V+A+T(pre: comb) | 50.9 | 82.9 | 83.4 | 0.553 | 0.752 |
| V+A+T(pre: A+T) | 51.2 | 83.2 | 83.8 | 0.554 | 0.762 |
| V+A+T(pre: V+T) | 52.3 | 86.2 | 86.1 | 0.552 | 0.778 |
| V+A+T(pre: V+A+T) | 52.8 | 86.5 | 86.7 | 0.552 | 0.779 |
In summary, the performance of the CorMulT model improves as more modalities are considered during pre-training, indicating that inter-modality information is a significant factor in enhancing sentiment analysis performance. Compared to other models, CorMulT displays superior stability and performance due to its effective use of modality correlations.
5. Conclusion
The main contributions and innovations of this paper can be summarized in three aspects. Firstly, a novel multimodal correlation pre-training model called MCE is proposed, which effectively extracts features from three modalities: audio, image, and text, and maps them into a shared joint space to learn the correlations between the modalities. Secondly, a semi-supervised contrastive learning training architecture is designed, which generates correlation data using different strategies without the need for manually annotated datasets, thereby improving the efficiency and feasibility of the model pre-training. Lastly, by combining MCE with the state-of-the-art multimodal fusion method MULT, the best performance of multimodal correlation pre-training is achieved, surpassing other existing research methods.
The experimental results demonstrate that CorMulT achieves an F1 score of 86.7% on the CMU_MOSEI dataset, which is an improvement of over 3.2% compared to the baseline model and outperforms the existing MMLatch model, making it the best-performing model among all multimodal sentiment analysis models. The ablation experiments further confirm the importance of the multi-modal correlation model in sentiment analysis models. Overall, the experimental results strongly support the significance of mutual information between modalities in improving the performance of sentiment analysis models. With its excellent stability and powerful performance, the CorMulT model demonstrates the effective utilization of intermodal correlation and provides a new solution for the field of multimodal sentiment analysis.
Acknowledgements.
This work was supported in part by Open Research Projects of Zhejiang Lab (No. 2021KH0AB04).References
- (1)
- Bol (2011) 2011. Twitter mood predicts the stock market. Journal of Computational Science 2, 1 (2011), 1–8.
- Asur and Huberman (2010) Sitaram Asur and Bernardo A. Huberman. 2010. Predicting the Future with Social Media. In 2010 IEEE/WIC/ACM International Conference on Web Intelligence and Intelligent Agent Technology, Vol. 1. 492–499. https://doi.org/10.1109/WI-IAT.2010.63
- Cheng et al. (2023) Hongju Cheng, Zizhen Yang, Xiaoqi Zhang, and Yang Yang. 2023. Multimodal Sentiment Analysis Based on Attentional Temporal Convolutional Network and Multi-Layer Feature Fusion. IEEE Transactions on Affective Computing 14, 4 (2023), 3149–3163. https://doi.org/10.1109/TAFFC.2023.3265653
- Gan et al. (2015) Chuang Gan, Naiyan Wang, Yi Yang, Dit-Yan Yeung, and Alexander G. Hauptmann. 2015. DevNet: A Deep Event Network for multimedia event detection and evidence recounting. In 2015 IEEE Conference on Computer Vision and Pattern Recognition (CVPR). 2568–2577. https://doi.org/10.1109/CVPR.2015.7298872
- Han et al. (2021) Wei Han, Hui Chen, and Soujanya Poria. 2021. Improving Multimodal Fusion with Hierarchical Mutual Information Maximization for Multimodal Sentiment Analysis. In Proceedings of the 2021 Conference on Empirical Methods in Natural Language Processing. Association for Computational Linguistics, Online and Punta Cana, Dominican Republic, 9180–9192.
- Hazarika et al. (2020) Devamanyu Hazarika, Roger Zimmermann, and Soujanya Poria. 2020. MISA: Modality-Invariant and -Specific Representations for Multimodal Sentiment Analysis. In MM ’20: The 28th ACM International Conference on Multimedia, Virtual Event / Seattle, WA, USA, October 12-16, 2020, Chang Wen Chen, Rita Cucchiara, Xian-Sheng Hua, Guo-Jun Qi, Elisa Ricci, Zhengyou Zhang, and Roger Zimmermann (Eds.). ACM, 1122–1131. https://doi.org/10.1145/3394171.3413678
- He and Hu (2022) Jiaxuan He and Haifeng Hu. 2022. MF-BERT: Multimodal Fusion in Pre-Trained BERT for Sentiment Analysis. IEEE Signal Processing Letters 29 (2022), 454–458. https://doi.org/10.1109/LSP.2021.3139856
- He et al. (2023b) Jing He, Binghui Su, Zhenwen Sheng, Changfan Zhang, and Haonan Yang. 2023b. Adversarial invariant-specific representations fusion network for multimodal sentiment analysis. In International Conference on Image, Signal Processing, and Pattern Recognition (ISPP 2023), Paulo Batista and Ram Bilas Pachori (Eds.), Vol. 12707. International Society for Optics and Photonics, SPIE, 127073R. https://doi.org/10.1117/12.2680996
- He et al. (2023c) Lijun He, Ziqing Wang, Liejun Wang, and Fan Li. 2023c. Multimodal Mutual Attention-Based Sentiment Analysis Framework Adapted to Complicated Contexts. IEEE Transactions on Circuits and Systems for Video Technology 33, 12 (2023), 7131–7143. https://doi.org/10.1109/TCSVT.2023.3276075
- He et al. (2023a) Ping He, Huaying Qi, and Shiyi Wang. 2023a. Cross-Modal Sentiment Analysis of Text and Video Based on Bi-GRU Cyclic Network and Correlation Enhancement. Applied Sciences 13, 13 (2023), 7489–7489. https://doi.org/10.3390/app13137489
- He et al. (2022) Yu He, Licai Sun, Zheng Lian, Bin Liu, Jianhua Tao, Meng Wang, and Yuan Cheng. 2022. Multimodal Temporal Attention in Sentiment Analysis (MuSe’ 22). Association for Computing Machinery, New York, NY, USA, 61–66. https://doi.org/10.1145/3551876.3554811
- Khan and Fu (2021) Zaid Khan and Yun Fu. 2021. Exploiting BERT for Multimodal Target Sentiment Classification through Input Space Translation. In Proceedings of the 29th ACM International Conference on Multimedia. ACM. https://doi.org/10.1145/3474085.3475692
- Kumar and Vepa (2020) Ayush Kumar and Jithendra Vepa. 2020. Gated Mechanism for Attention Based Multi Modal Sentiment Analysis. In ICASSP 2020 - 2020 IEEE International Conference on Acoustics, Speech and Signal Processing (ICASSP). 4477–4481.
- Lin and Hu (2023) Ronghao Lin and Haifeng Hu. 2023. Multi-Task Momentum Distillation for Multimodal Sentiment Analysis. IEEE Transactions on Affective Computing (2023), 1–18. https://doi.org/10.1109/TAFFC.2023.3282410
- Liu et al. (2022) Ye Liu, Siyuan Li, Yang Wu, Chang Wen Chen, Ying Shan, and Xiaohu Qie. 2022. UMT: Unified Multi-modal Transformers for Joint Video Moment Retrieval and Highlight Detection. In IEEE/CVF Conference on Computer Vision and Pattern Recognition, CVPR 2022, New Orleans, LA, USA, June 18-24, 2022. IEEE, 3032–3041. https://doi.org/10.1109/CVPR52688.2022.00305
- Liu et al. (2023) Yun Liu, Zhoujun Li, Ke Zhou, Leilei Zhang, Lang Li, Peng Tian, and Shixun Shen. 2023. Scanning, attention, and reasoning multimodal content for sentiment analysis. Knowledge-Based Systems 268 (2023), 110467. https://doi.org/10.1016/j.knosys.2023.110467
- Liu et al. (2018) Zhun Liu, Ying Shen, Varun Bharadhwaj Lakshminarasimhan, Paul Pu Liang, Amir Zadeh, and Louis-Philippe Morency. 2018. Efficient Low-rank Multimodal Fusion With Modality-Specific Factors. In Proceedings of the 56th Annual Meeting of the Association for Computational Linguistics, ACL 2018, Melbourne, Australia, July 15-20, 2018, Volume 1: Long Papers, Iryna Gurevych and Yusuke Miyao (Eds.). Association for Computational Linguistics, 2247–2256. https://doi.org/10.18653/V1/P18-1209
- Mai et al. (2022) Sijie Mai, Ya Sun, and Haifeng Hu. 2022. Curriculum Learning Meets Weakly Supervised Modality Correlation Learning. CoRR abs/2212.07619 (2022). https://doi.org/10.48550/ARXIV.2212.07619 arXiv:2212.07619
- Majumder et al. (2017) Navonil Majumder, Soujanya Poria, Alexander Gelbukh, and Erik Cambria. 2017. Deep Learning-Based Document Modeling for Personality Detection from Text. IEEE Intelligent Systems 32, 2 (2017), 74–79. https://doi.org/10.1109/MIS.2017.23
- Paraskevopoulos et al. (2022) Georgios Paraskevopoulos, Efthymios Georgiou, and Alexandras Potamianos. 2022. Mmlatch: Bottom-Up Top-Down Fusion For Multimodal Sentiment Analysis. In ICASSP 2022 - 2022 IEEE International Conference on Acoustics, Speech and Signal Processing (ICASSP). 4573–4577.
- Quan et al. (2022) Zhibang Quan, Tao Sun, Mengli Su, Jishu Wei, Xiang Zhang, and Shenjie Zhong. 2022. Multimodal Sentiment Analysis Based on Nonverbal Representation Optimization Network and Contrastive Interaction Learning. In 2022 IEEE International Conference on Systems, Man, and Cybernetics (SMC). 3086–3091. https://doi.org/10.1109/SMC53654.2022.9945514
- Sun et al. (2023) Teng Sun, Juntong Ni, Wenjie Wang, Liqiang Jing, Yinwei Wei, and Liqiang Nie. 2023. General Debiasing for Multimodal Sentiment Analysis. In Proceedings of the 31st ACM International Conference on Multimedia, MM 2023, Ottawa, ON, Canada, 29 October 2023- 3 November 2023, Abdulmotaleb El-Saddik, Tao Mei, Rita Cucchiara, Marco Bertini, Diana Patricia Tobon Vallejo, Pradeep K. Atrey, and M. Shamim Hossain (Eds.). ACM, 5861–5869. https://doi.org/10.1145/3581783.3612051
- Tang et al. (2023) Jiajia Tang, Dongjun Liu, Xuanyu Jin, Yong Peng, Qibin Zhao, Yu Ding, and Wanzeng Kong. 2023. BAFN: Bi-Direction Attention Based Fusion Network for Multimodal Sentiment Analysis. IEEE Transactions on Circuits and Systems for Video Technology 33, 4 (2023), 1966–1978. https://doi.org/10.1109/TCSVT.2022.3218018
- Tsai et al. (2019) Yao-Hung Hubert Tsai, Shaojie Bai, Paul Pu Liang, J. Zico Kolter, Louis-Philippe Morency, and Ruslan Salakhutdinov. 2019. Multimodal Transformer for Unaligned Multimodal Language Sequences. In Proceedings of the 57th Annual Meeting of the Association for Computational Linguistics. Association for Computational Linguistics, Florence, Italy, 6558–6569. https://doi.org/10.18653/v1/P19-1656
- Tumasjan et al. (2011) Andranik Tumasjan, Timm O. Sprenger, Philipp G. Sandner, and Isabell M. Welpe. 2011. Election Forecasts With Twitter: How 140 Characters Reflect the Political Landscape. Social Science Computer Review 29, 4 (2011), 402–418.
- Wang et al. (2023a) Huiru Wang, Xiuhong Li, Zenyu Ren, Min Wang, and Chunming Ma. 2023a. Multimodal Sentiment Analysis Representations Learning via Contrastive Learning with Condense Attention Fusion. Sensors 23, 5 (2023). https://doi.org/10.3390/s23052679
- Wang et al. (2023b) Xingqi Wang, Mengrui Zhang, Bin Chen, Dan Wei, and Yanli Shao. 2023b. Dynamic Weighted Multitask Learning and Contrastive Learning for Multimodal Sentiment Analysis. Electronics 12, 13 (2023). https://doi.org/10.3390/electronics12132986
- Wang et al. (2019) Yansen Wang, Ying Shen, Zhun Liu, Paul Pu Liang, Amir Zadeh, and Louis-Philippe Morency. 2019. Words Can Shift: Dynamically Adjusting Word Representations Using Nonverbal Behaviors. In The Thirty-Third AAAI Conference on Artificial Intelligence, AAAI 2019, The Thirty-First Innovative Applications of Artificial Intelligence Conference, IAAI 2019, The Ninth AAAI Symposium on Educational Advances in Artificial Intelligence, EAAI 2019, Honolulu, Hawaii, USA, January 27 - February 1, 2019. AAAI Press, 7216–7223. https://doi.org/10.1609/AAAI.V33I01.33017216
- Xue et al. (2023) Xiaojun Xue, Chunxia Zhang, Zhendong Niu, and Xindong Wu. 2023. Multi-Level Attention Map Network for Multimodal Sentiment Analysis. IEEE Transactions on Knowledge and Data Engineering 35, 5 (2023), 5105–5118. https://doi.org/10.1109/TKDE.2022.3155290
- Yang et al. (2023) Jichen Yang, Yi Zhou, and Hao Huang. 2023. Mel-S3R: Combining Mel-spectrogram and self-supervised speech representation with VQ-VAE for any-to-any voice conversion. Speech Communication 151 (2023), 52–63. https://doi.org/10.1016/j.specom.2023.05.004
- Yu et al. (2023) Tianshu Yu, Haoyu Gao, Ting-En Lin, Min Yang, Yuchuan Wu, Wentao Ma, Chao Wang, Fei Huang, and Yongbin Li. 2023. Speech-Text Pre-training for Spoken Dialog Understanding with Explicit Cross-Modal Alignment. In Proceedings of the 61st Annual Meeting of the Association for Computational Linguistics (Volume 1: Long Papers). Association for Computational Linguistics, Toronto, Canada, 7900–7913. https://doi.org/10.18653/v1/2023.acl-long.438
- Yu et al. (2021) Wenmeng Yu, Hua Xu, Ziqi Yuan, and Jiele Wu. 2021. Learning Modality-Specific Representations with Self-Supervised Multi-Task Learning for Multimodal Sentiment Analysis. In Thirty-Fifth AAAI Conference on Artificial Intelligence, AAAI 2021, Thirty-Third Conference on Innovative Applications of Artificial Intelligence, IAAI 2021, The Eleventh Symposium on Educational Advances in Artificial Intelligence, EAAI 2021, Virtual Event, February 2-9, 2021. AAAI Press, 10790–10797. https://doi.org/10.1609/AAAI.V35I12.17289
- Zadeh et al. (2017) Amir Zadeh, Minghai Chen, Soujanya Poria, Erik Cambria, and Louis-Philippe Morency. 2017. Tensor Fusion Network for Multimodal Sentiment Analysis. In Proceedings of the 2017 Conference on Empirical Methods in Natural Language Processing, EMNLP 2017, Copenhagen, Denmark, September 9-11, 2017, Martha Palmer, Rebecca Hwa, and Sebastian Riedel (Eds.). Association for Computational Linguistics, 1103–1114. https://doi.org/10.18653/V1/D17-1115