Enhanced pedestal transport driven by edge collisionality on Alcator C-Mod and its role in regulating H-mode pedestal gradients
Abstract
Experimental measurements of plasma and neutral profiles across the pedestal are used in conjunction with 2D edge modeling to examine pedestal stiffness in Alcator C-Mod H-mode plasmas. Experiments on Alcator C-Mod observed pedestal degradation and loss in confinement below a critical value of net power crossing the separatrix, MW. New analysis of ionization and particle flux profiles reveal saturation of the pedestal electron density, despite continuous increases in ionization throughout the pedestal, inversely related to . A limit to the pedestal emerges as the particle flux, continues to grow, implying increases in the effective particle diffusivity, . This is well-correlated with the separatrix collisionality, and a turbulence control parameter, , implying a possible transition in type of turbulence. The transition is well correlated with the experimentally observed value of . SOLPS-ITER modeling is performed for select discharges from the power scan, constrained with experimental electron and neutral densities, measured at the outer midplane. The modeling confirms general growth in , consistent with experimental findings, and additionally suggests even larger growth in at the same .
1 Introduction
The physics that determine plasma profiles in the edge of tokamak plasmas remains among the most elusive in tokamak physics. It is known that at sufficient input power, a transition to a high-confinement mode (H-mode) occurs, resulting in a substantial reduction in edge transport, increasing pressure gradients and forming the so-called “pedestal” [1]. It is well-known that achievable core pressures are very sensitive to the conditions at the boundary [2, 3, 4, 5, 6]. Next-generation devices [7, 8] seeking to maximize fusion gain rely on a robust edge pedestal. If the H-mode pedestal is to be exploited for high fusion gain, confidence in understanding the mechanisms determining its structure and the ability to form a desired type of pedestal must increase, especially in view of integrating this edge with a viable heat exhaust SOL and divertor solution.
Some models have had reasonable success in predicting the pressure pedestal structure of H-modes exhibiting Type-I edge localized modes (ELMs) in conventional aspect ratio machines [9, 10, 11, 12]. Regardless, prediction of pedestal structure in turbulence-limited H-modes without ELMs is less certain [13]. Density pedestals in particular are especially poorly understood, largely as a result of a lack of edge ionization source measurements. It is unclear to what extent neutral fueling, as opposed to particle transport, is responsible for the build up of edge pedestal density gradients [14, 15]. Certain models suggest that the density pedestal width may be strongly linked to the neutral penetration depth [16, 17]. While this may hold in some H-mode regimes, it cannot explain the width of all density pedestals [14, 18]. In ohmic L-modes, turbulent transport has been identified as important for regulating edge gradients [19, 20], and it is unknown to what degree turbulence is responsible at holding H-mode gradients at or near marginal stability. Since the very small length scales in the pedestal makes direct gyrokinetic simulation of these instabilities challenging, reduced-order models can serve as alternatives. Knowledge of the distribution of sources in the edge, in particular the ionization source, is an asset to testing reduced-order fueling and transport models.
It is also thought that understanding and predicting the density and temperature pedestals individually is crucial for differentiating between the different flavors of H-mode [21, 22]. The density at the edge in particular is a very important parameter for determining how particles and heat cross onto open field lines and affect the survivability of the divertor [23, 24].
Alcator C-Mod operated until 2016, and it routinely achieved the highest plasma densities of current tokamaks, fairly close to and often exceeding densities proposed for reactors [25, 26, 15]. As edge plasma density rises, opaqueness to neutrals increases, and fueling through gas puffing may become a challenge. As opaqueness increases, the ionization profile may move radially outward onto the unconfined plasma. If this is the case for future reactors, their ability to sustain large density gradients in the edge may be significantly reduced. A proposed metric for plasma opaqueness, , where is the plasma minor radius and is the electron density, puts Alcator C-Mod’s opaqueness close to that expected on SPARC and ITER [15, 27]. Higher and are thought to increase the difficulty with which an edge neutral can reach the core, increasing the plasma’s opaqueness. Ionization profiles on Alcator C-Mod may thus provide insight into what ionization may look like in future devices. Furthermore, pedestal resiliency to fueling and evidence of critical edge gradients [18, 19] on C-Mod may be a feature of high-density devices with which future reactors need to contend.
To this end, this work attempts to study the structure of the density pedestal on Alcator C-Mod using edge ionization and plasma density measurements. From inferences of particle transport and high-resolution Thomson scattering measurements of pedestal structure, this paper finds particle transport, as well as heat transport, in the pedestal to be largely influential in determining critical edge gradients and the achievable pedestal densities in a number of H-modes on Alcator C-Mod.
This paper begins by outlining the set of diagnostics used to create a database of edge ionization and pedestal profiles. It then compares experimental ionization measurements with density measurements from a particular set of experiments at fixed field, current, and plasma shape to make comments about observed pedestal stiffness, and the accompanying increase in particle transport. Section 4 then considers the pedestal operational space, and makes claims about how the C-Mod plasma moves around this operational space. It identifies collisionality, particularly at the edge, as a key driver for determining both the density and temperature pedestal. To supplement these experimental observations, the next section focuses on results from a set of simulations, containing high-fidelity and experimentally-validated 2D calculations of the ionization source. The paper then ends with discussion on implications of these results for next-generation devices, and future steps that will be taken to develop a predictive model for next-generation density pedestals.
2 Experimental ionization and particle flux profiles in a set of magnetic balance experiments
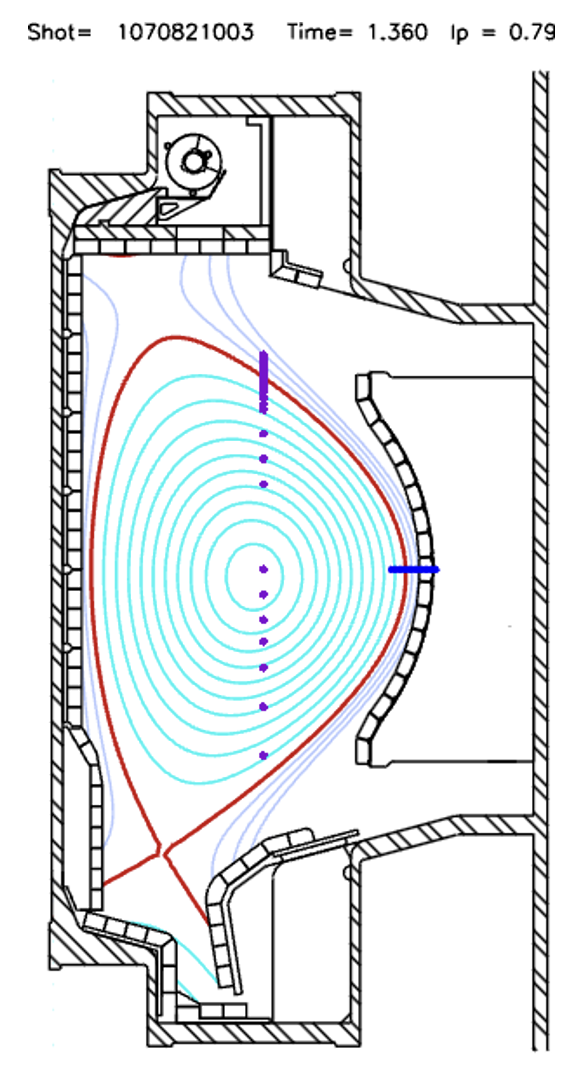
In 2007, a series of experiments were performed on Alcator C-Mod to explore techniques for decoupling particle transport from energy transport in H-mode pedestals. One particular experiment sought to modify magnetic balance to study its effect on the enhanced Dα (EDA) H-mode regime. The EDA H-mode is a type of H-mode not limited by peeling-ballooning MHD modes, as the more typical type-I ELMing H-modes are [28, 21]. To study the effect of the magnetic drift on EDA H-mode pedestal quality, for a fixed toroidal magnetic field, = 5.4 T, plasma current, = 0.8 MA, and -drift direction, the active null was moved from the lower chamber to the upper chamber, effectively modifying the outer midplane distance between the separatrices passing through the two X-points, , from around -5 mm to +5 mm. The current work, however, focuses solely on plasmas solidly in single null, with mm. These were all obtained at relatively fixed shape, with elongation, , and triangularity, . They had a major radius, m and a minor radius, m. Figure 1 shows a typical magnetic equilibrium for these plasmas, showing also views of the diagnostics described in to be described in Sections 2.2 and 2.3.
This paper presents an integrated analysis of particle and neutral pedestal transport from these experiments. It does so by combining radially-resolved edge electron density and temperature (, ) measurements from Thomson Scattering (TS) with neutral inferences of neutral density (), ionization source (), and radial particle flux () from a Lyman- (Lyα) camera.
2.1 Pedestal degradation with net power
It was observed that these plasmas, particularly their pedestals, were highly sensitive to variation in the net power flowing through the scrape-off layer, , calculated using , where the loss power and is the power radiated in the core. Auxiliary power in this case is just the total injected ion cyclotron range of frequencies (ICRF) power, . is the ohmic power, and is the time derivative of the stored energy, .
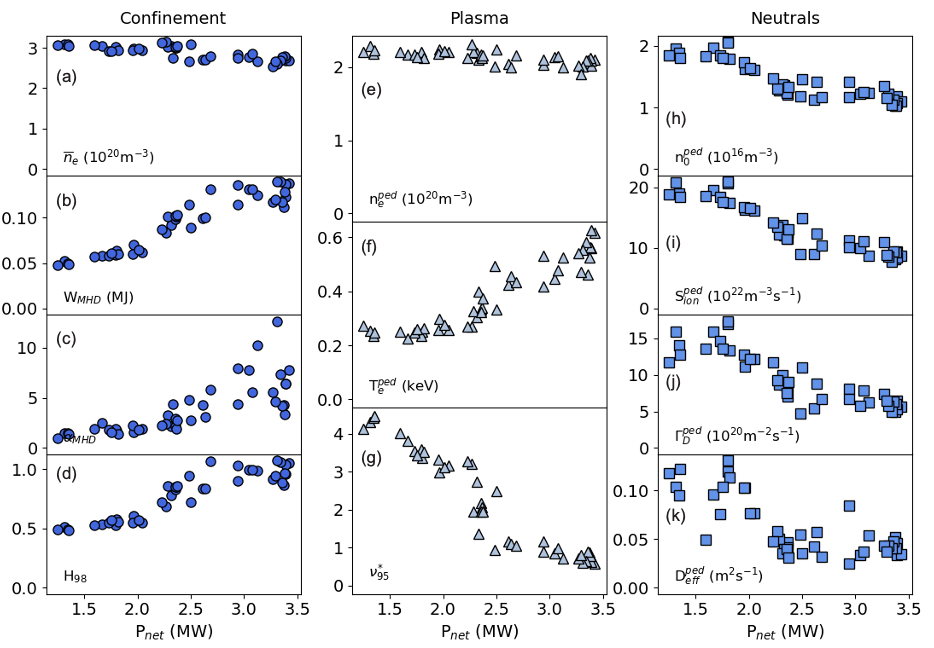
Figure 2 shows the large changes that occur in these discharges as MW. Figures 2a - d show that the line-integrated density, , drops, concurrent with large increases in , the maximum normalized pressure gradient, , and the normalized confinement factor, . Figures 2e - g show changes in pedestal parameters as measured by the edge Thomson Scattering (ETS) diagnostic, outlined in Section 2.3. There is a large drop in the pedestal collisionality, , resulting from a very slight drop in , but a large rise in . Revisiting this particular experiment through inspection of edge ionization profiles reveals the role of plasma transport in regulating the pedestal and thus, the H-mode quality. Figures 2h - k allude to this, showing large drops in the inferred neutral density, , ionization source, , particle flux, , and particle diffusivity, , all at the top of the pedestal. The discharges used in this dataset are listed below 111Shot numbers in dataset: 1070821003, 1070821004, 1070821005, 1070821008, 1070821009, 1070821012, 1070821013, 1070821020, 1070821021, 1070821022, 1070821023, 1070821025, and 1070821029.
2.2 Neutral emissivity from Lyα camera
Radial profiles of , , and are constructed from a midplane Lyα camera called LYMID. It was installed in 2007 as the successor to an earlier Lyα system [29, 30]. It was located just below the midplane ( m) and viewed toroidally. Its 20 chords were tangent to flux surfaces covering a region in the radial direction of just over 5 cm at the plasma edge. The LYMID diagnostic collected Lyα light from the 121.6 nm visible ultra-violet light transition from the edge population of neutral deuterium atoms. This LYMID diagnostic recorded line-integrated brightness measurements from each of its viewing chords as a function of their tangency radius. We use the same tomographic inversion algorithm developed for LLAMA, a similar system on DIII-D [31, 32] to invert the brightness profile. This yields the Lyα emissivity, , as a function simply of radius, and no longer of toroidal angle, under the assumption of axisymmetric emission.
2.3 Edge Thomson scattering for plasma profile analysis
In addition to neutral emissivity measurements, we use the edge Thomson scattering (ETS) diagnostic, which was routinely used to diagnose the edge plasma and in particular, the pedestal on C-Mod. ETS measured both electron density, and electron temperature, about a region spanning 3 cm of the plasma edge. Measurements were located in the upper chamber near the crown of lower single null (LSN) plasmas, and could diagnose and profiles with order millimeter resolution when mapped to the midplane [33]. In order to estimate gradients as well as to facilitate interpolation onto the radial coordinate basis of the neutral emissivity profile, a fit to both and is applied. It was determined that a hyperbolic tangent as in [34], but supplemented with polynomial terms to allow for flexibility in adjusting the gradient inside the pedestal and in the SOL. This provided reasonably good fits to the plasma data. Equation 1 shows the functional form of the modified hyperbolic tangent (mtanh).
| (1) |
and are the core and SOL polynomials respectively, and is the pedestal coordinate as a function of , an arbitrary midplane coordinate. is the pedestal center, is the pedestal width, , , and are the linear, quadratic, and cubic coefficients of the core polynomial, and and are the linear and quadratic coefficients of the SOL polynomial. Setting recovers the form of the fit function used in [34].
Since the mtanh has a closed form, the and gradients ( and ) can be computed analytically using the fit coefficients. A bootstrapping technique is then used to compute uncertainties in the fitted profiles. This is done by perturbing the experimental ETS data points, refitting, and computing statistics on the fits. The perturbation to the experimental points is sampled from a Gaussian distribution with a half-width equal to the experimental uncertainty of the ETS data point. The fitting process is repeated multiple times and the uncertainty is set to the standard deviation of the ensemble of perturbed fits. This technique enables uncertainty estimation not only in the absolute and profiles, but also in their gradients. It is described in detail in [35].
2.4 Inference of neutral density, ionization source, and particle flux
With , , and all mapped to the same radial grid at the midplane, we make use of a collisional-radiative model to infer , , and . A similar procedure has been employed previously, on C-Mod with Dα measurements [14], and on both C-Mod and DIII-D with Lyα [19, 23, 36, 37, 38]. Equations 2-4 summarize the procedure for calculating these quantities.
| (2) |
| (3) |
| (4) |
| (5) |
is the photon emissivity coefficient, is the ratio between , the effective ionization coefficient and , the photon emissivity coefficient. Neutral and ionized molecular contributions are neglibible for Lyα emission. These expressions highlight the implicit dependence of (and hence ) on and .
| Parameter | pedestal top | Separatrix |
| (1020 m-3) | 1.9 – 2.3 | 0.7 – 1.9 |
| (eV) | 210 – 670 | 80 - 150 |
| (1016 m-3) | 0.7 - 2.3 | 1.5 - 3.8 |
| (1022 m-3s-1) | 4.5 – 16 | 5.0 – 17 |
| (1020 m-2s-1) | 1.4 – 14 | 3.3 – 17 |
| (10-2 m2s-1) | 2.4 – 13 | 1.6 – 11 |
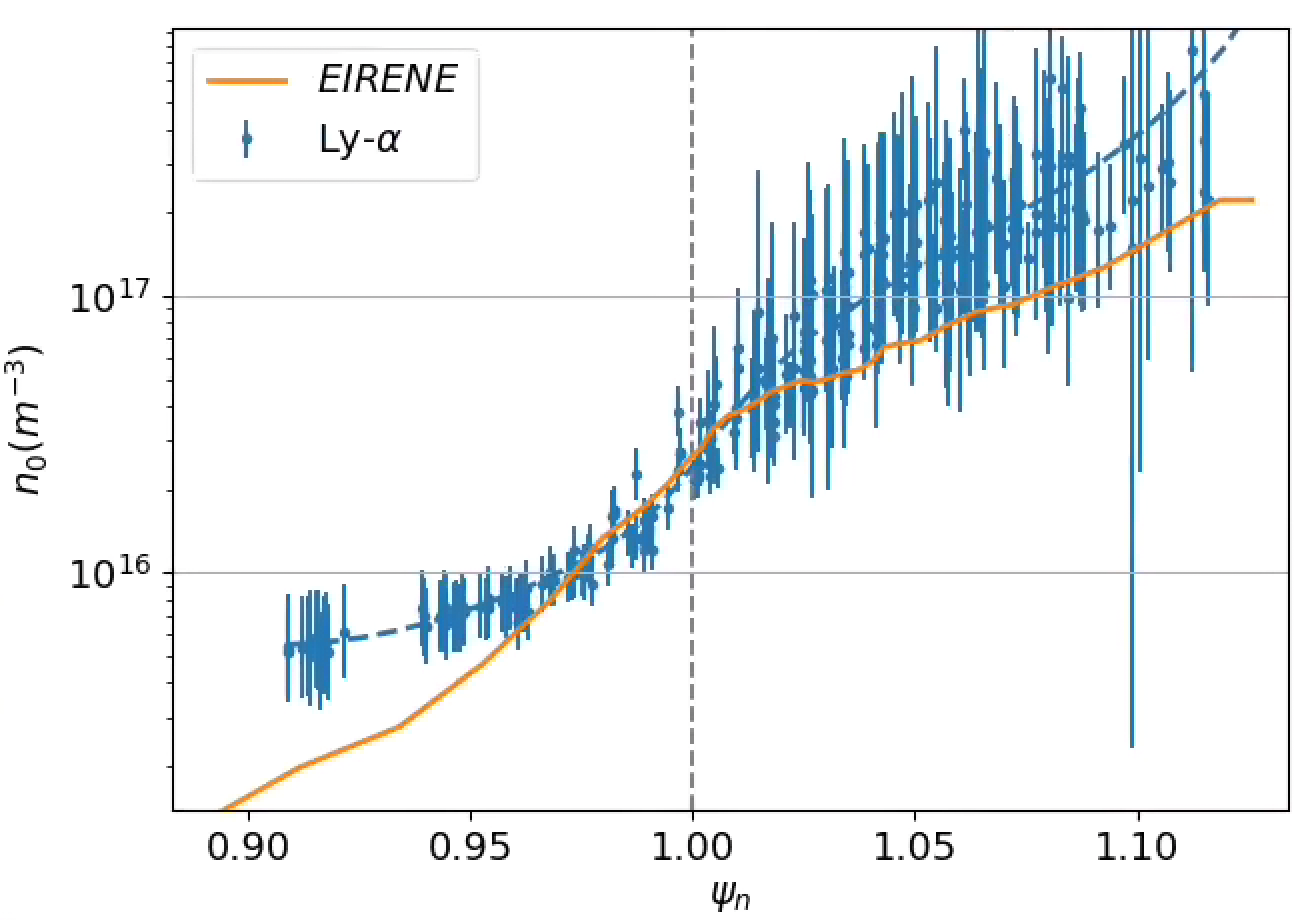
Equations 2 and 3 use a number of simplifying assumptions about the relevant atomic processes, which are outlined in [37]. For Equation 4, we ensure a stationary plasma density time window and assume no poloidal asymmetries in , allowing computation of the cross-field particle flux, by integrating Equation 3 in a slab geometry. For the remainder of the paper, we drop the subscript and express the cross-field particle flux as . The assumption that there is negligible poloidal asymmetry in is likely the strongest simplifying assumption. Using two distinct Lyα views, an in-out poloidal asymmetry has been observed in the ionization source on DIII-D [37, 39]. LYMID does not distinctly view the inboard and outboard side, and an in-out source asymmetry may well be present on C-Mod as well. Regardless, past work has shown that C-Mod is dominated by main-chamber fueling [40, 23]. This lends confidence to using neutral inferences at the midplane to make conclusions about fueling and transport in the C-Mod pedestal. We test this assertion with EIRENE, a 3D neutral simulation code, in Section 5 and observe good agreement with previous conclusions about main chamber fueling.
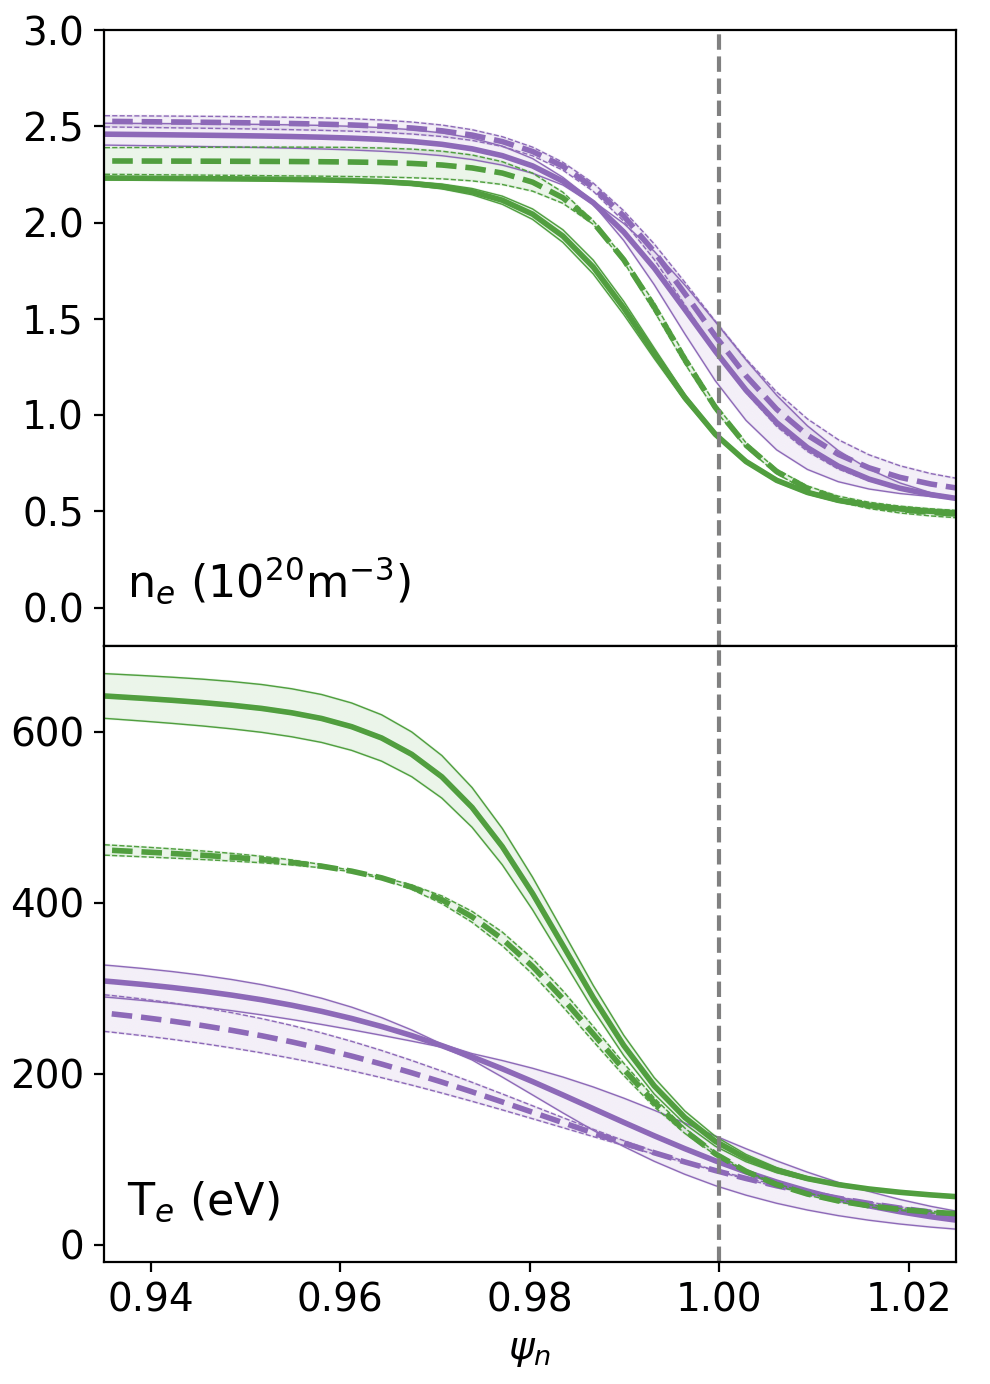
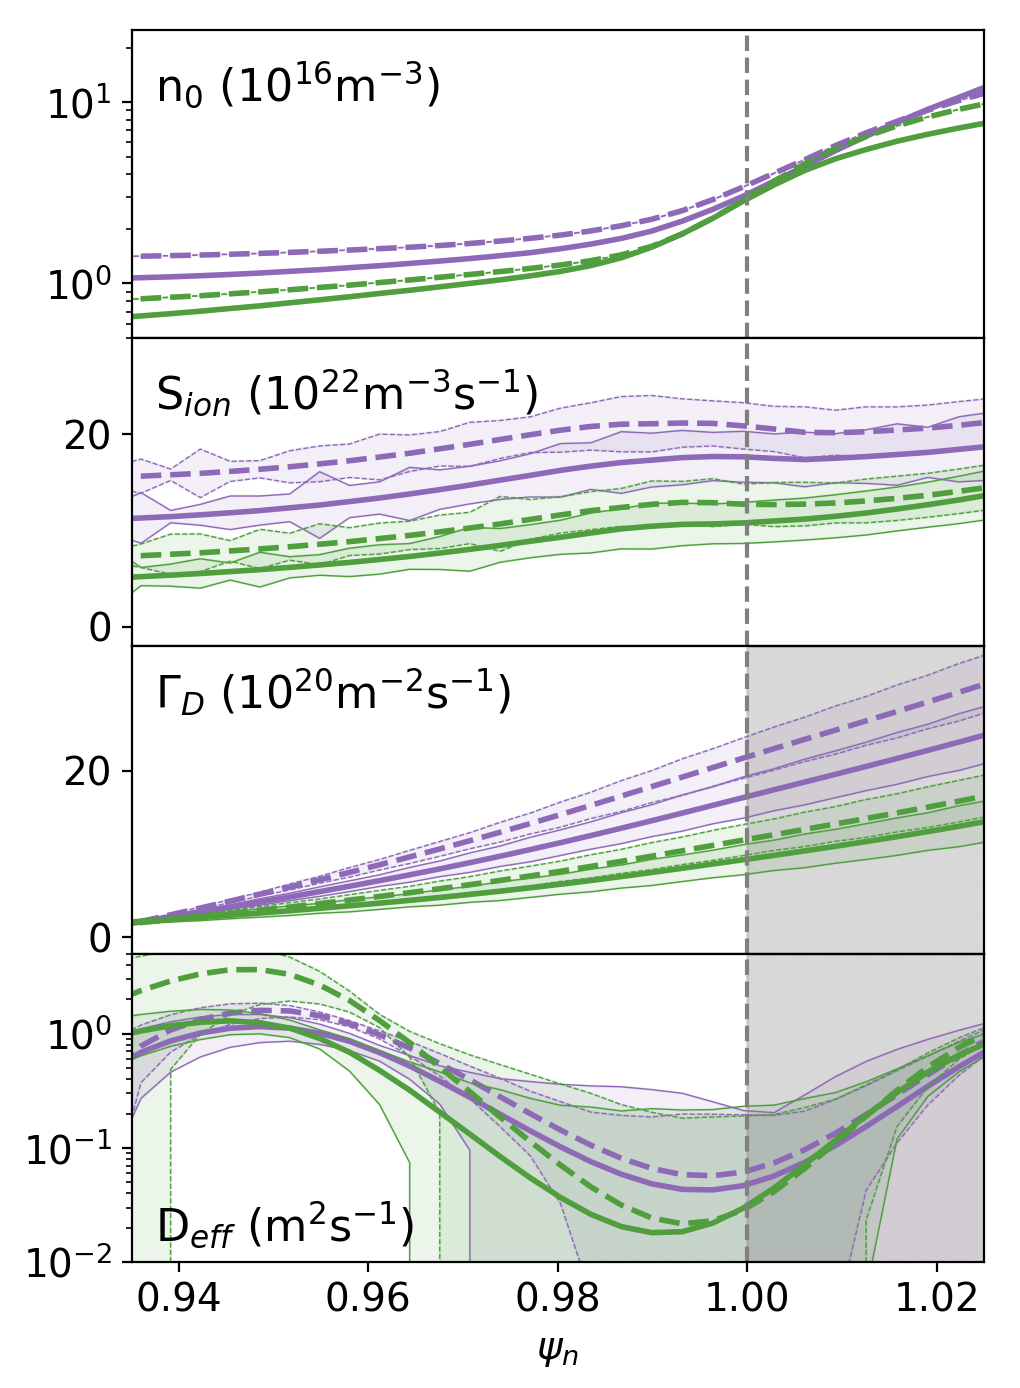
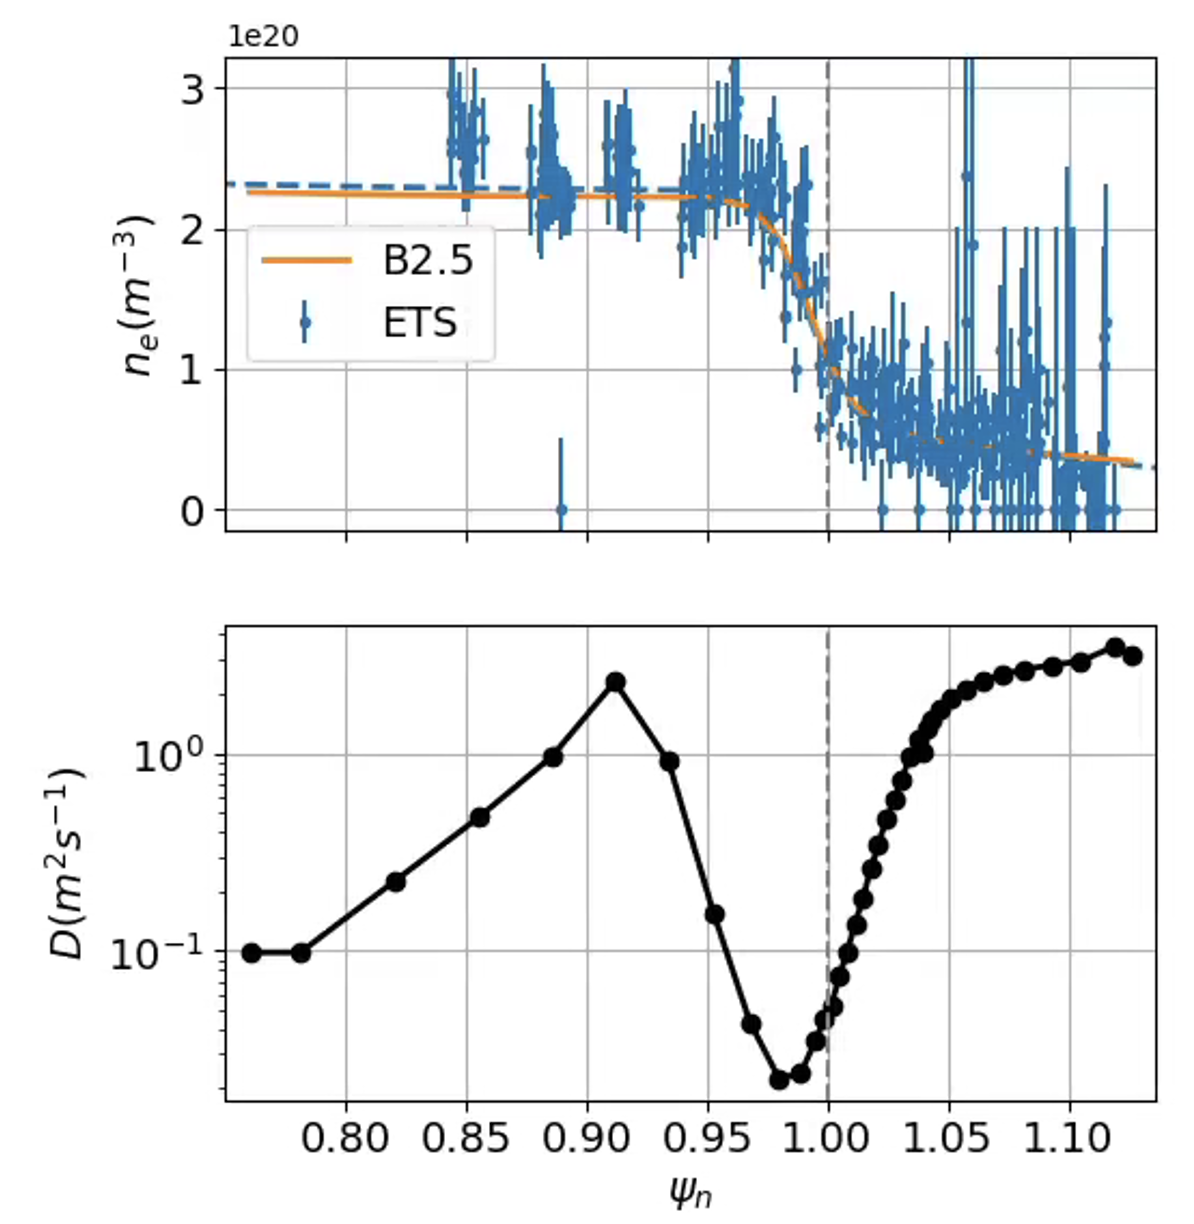
Figures 3 and 4 show typical profiles produced with this workflow. Figure 3 shows and computed from ETS. Figure 4 shows , , , and , all computed from a combination of data from LYMID and ETS. Note that given the non-negligible contribution to ionization from in the SOL, we only calculate and for 1. Table 1 summarizes the range in values for these profiles both at the pedestal top, defined as the point /2 to the left of the center of the mtanh profile, where is the width of the mtanh (as well as the pedestal). Tabulated as well are their values at the separatrix.
Uncertainties in the profiles in Figure 4 have been computed using standard error propagation, assuming uncorrelated uncertainties from , , and . To that error, we add, in quadrature, an error associated with uncertainty in the poloidal alignment of the two diagnostics. For from LYMID, we assume an error in the magnetic reconstruction, = 5 mm, and multiply this by the radial derivative of the emissivity profile, , computed numerically, i.e. .
For ETS, we use the two-point model [41] to align and relative to the separatrix, . This model states that the power carried by the electrons in the SOL leaves the core entirely at the outer midplane and is transported to the divertor target via conduction only. It uses the Spitzer-Härm conductivity, which is proportional to the parallel temperature gradient in the SOL. Hence, the equality,
| (6) |
can be integrated to find at the outer midplane (OMP) [41]. In this equation, is the Spitzer-Härm conductivity, is the plasma major radius, is the width of the heat flux channel, is the poloidal magnetic field. In the absence of measurements of the parallel heat flux width, we use the Brunner scaling for [42]. We further assume negligible temperature at the divertor (i.e. ) and estimate the connection length required for the integral as , where is the safety factor at the 95% flux surface. With in hand, we find the radial shift required to align the fit to the profile at and apply the same shift to the before using these shifted kinetic profiles to calculate the rate coefficients used for the neutral inferences.
3 Density pedestal stiffness
3.1 The role of ionization in setting the pedestal height
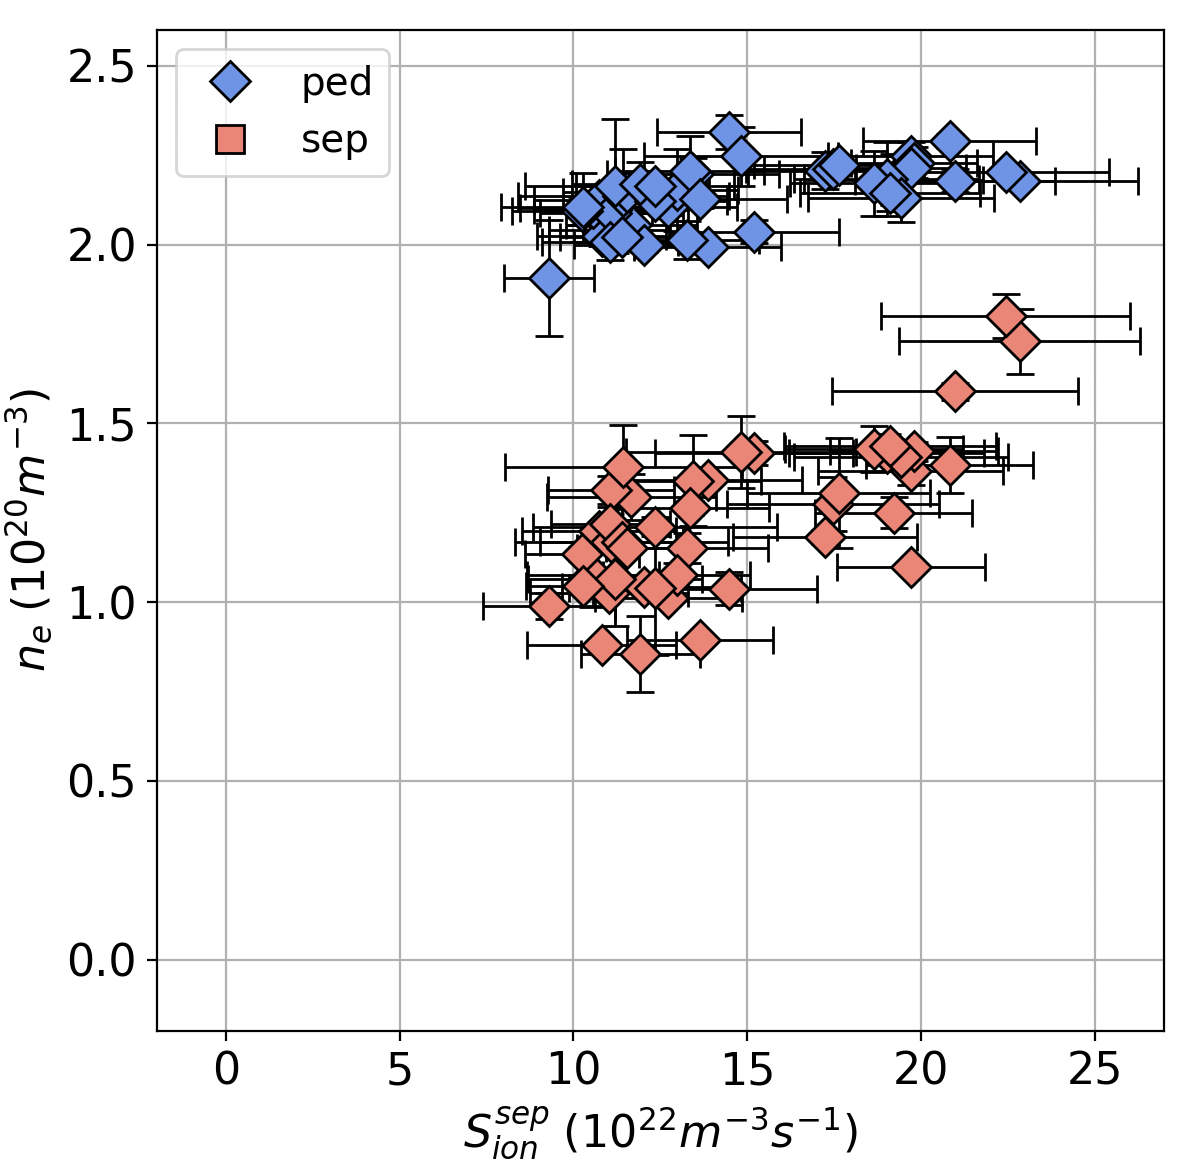
We use this methodology to interrogate the role of pedestal ionization in influencing the electron density pedestal height. Figure 5 shows plotted against at the separatrix, . At low values of separatrix ionization, m-3s-1, varies weakly with ionization at the pedestal top and perhaps more strongly at the separatrix. As continues to grow, however, the trends diverge significantly. At the separatrix, increases strongly with , while at the pedestal top there is clear insensitivity of the pedestal height to the ionization source. These EDA H-Modes settle at a natural density of m-3. Pedestal stiffness on Alcator C-Mod has been observed previously and may be a feature of high density EDAs [18]. In that work, it was shown that varying the neutral source through external gas puffing had little effect on gradient scale lengths in the pedestal as well as the pedestal height. Though similar phenomenology is observed here, a key difference is that the H-modes currently analyzed received no external gas puffing after the L-H transition. Once the H-mode was achieved, pedestal fueling occurred solely through recycled neutrals. Pedestal stiffness in opaque plasmas may thus occur naturally, even in the absence of active gas fueling.
3.2 Flux-gradient relationship in stiff profiles
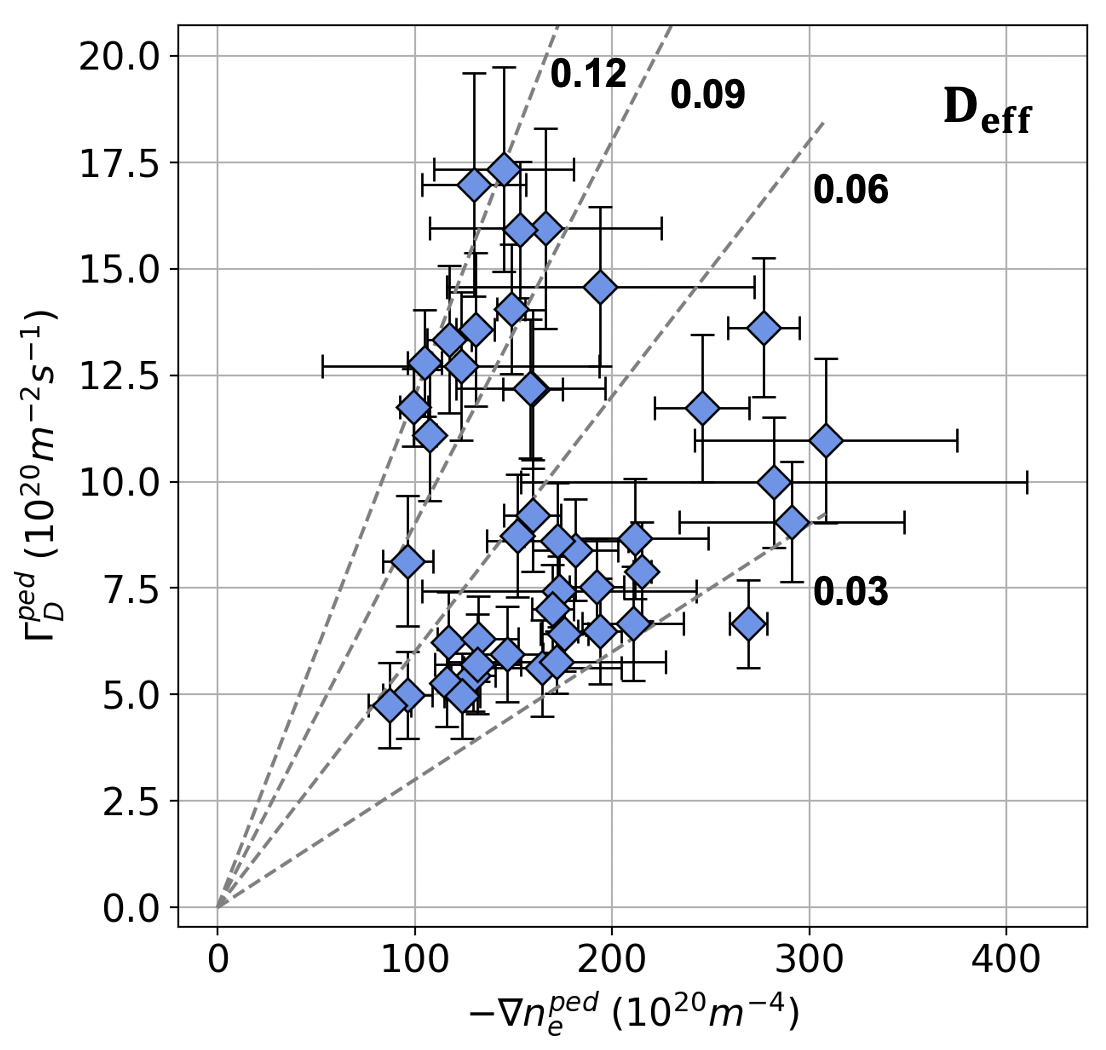
It has often been assumed that determines the [17, 16]. With this framework, we might expect , the integral of , to be proportional to the gradient in the density. In other words, and would be linearly dependent, just as in a classical Fickian diffusive system. Figure 6, however, shows that the experimentally inferred from the Lyα camera, calculated at the top of the pedestal does not grow linearly with at the same location. For m-4, can vary significantly, anywhere from m-2s-1 to m-2s-1. This is not surprising, given the saturation of for vastly different shown in Figure 5.
Figure 6 indicates that there may be a particular gradient beyond which further ionization becomes ineffective in modifying the density profile, yielding a stiff pedestal. The peak occurs in the mid-range of values, at 10 m-2s-1. This is consistent with the rapid growth of at fixed shown in Figure 5. Discharges at low correspond to those at low and low . Those at mid and largest correspond to discharges at 1022 m-3s-1 and intermediate . Finally, the discharges at high but reduced (relative to those at mid ) correspond to those at highest . These are the discharges with increasing but nearly fixed .
It is evident that these pedestals cannot be fully described with a simple linear diffusive transport model. Since , and thus , varies significantly at relatively constant , it is unlikely that just adding a convective term, proportional to , to the transport model might explain the large changes to in these pedestals. Instead, it could be that a threshold based model, like that describing heat transport near critical gradients in the core [43], may be necessary for understanding pedestal particle transport. Such a phenomenon in the particle channel has been previously suggested on Alcator C-Mod in the near-SOL for ohmic L-modes [19] and in the pedestal of EDA H-modes undergoing strong puffing [18].
In the absence of such a model, we opt for using the quotient of the inferred particle flux and the density gradient to obtain an effective particle diffusivity, , calculated using Equation 5. While not fully descriptive of the physics of the edge, provides a point of comparison for analyzing differences in transport between discharges and as a function of different edge conditions. Experimental inferences of have been previously made on C-Mod using inferred from the workflow in Section 2.4 [14, 23], although never with in the pedestal with both LYMID and ETS simultaneously. On DIII-D, recent experiments have sought to calculate a diffusive coefficient, and a convective velocity coefficient, simultaneously using LLAMA [37]. To do this requires perturbing the edge slightly so as to recover without substantially changing the intrinsic transport properties.
For these stationary discharges, we opt for , and add lines of constant to Figure 6 to demonstrate the large variation in this proxy for transport in these plasmas. As shown in the rightmost panel of Figure 2 and now apparent from Figures 5 and 6, the rapid growth in and at low , as well as the saturation of , is concurrent with a rapid growth of below this critical value of MW.
4 Pedestal operational space and transport drive
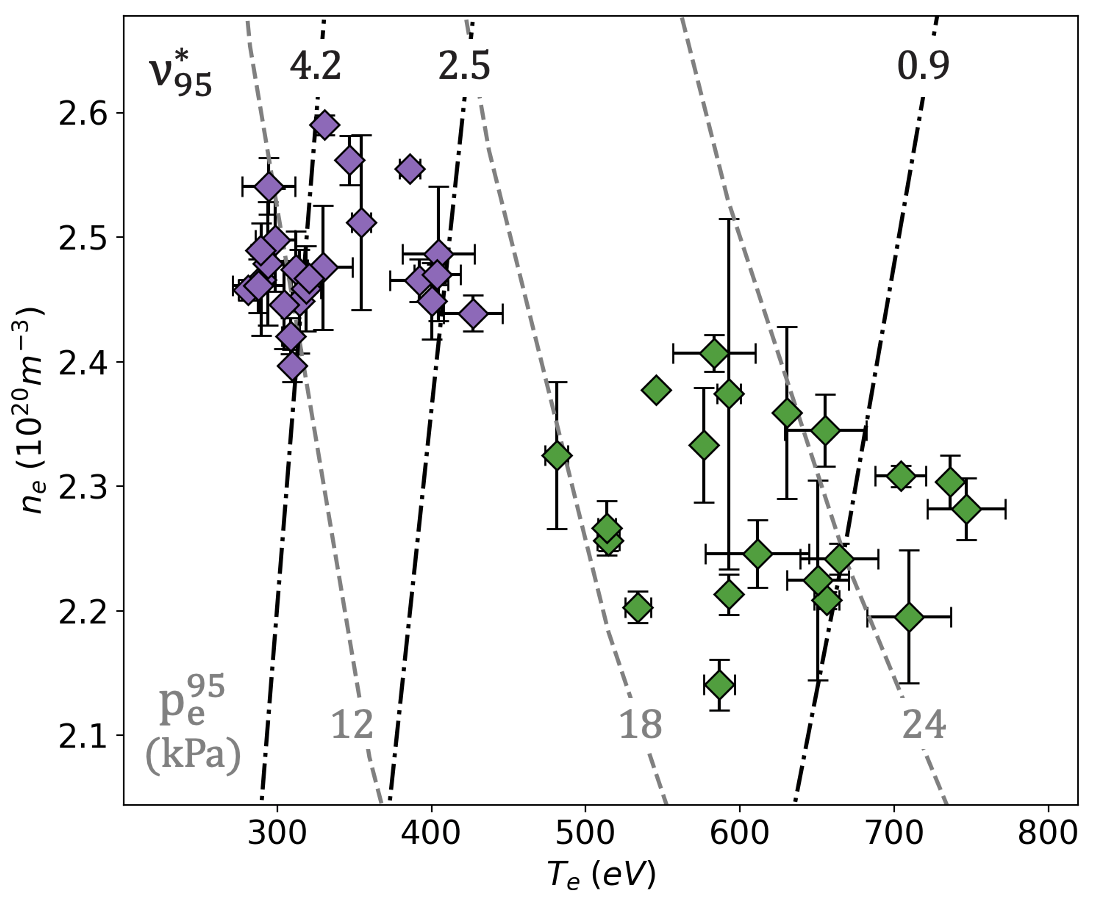
Particle transport and fueling depend on and affect as well as . Neutral transport resulting from atomic processes has strong dependence on , and intrinsic changes to plasma transport modify and are modified by kinetic profiles, including [14, 15]. Figure 3 shows characteristic and pedestal profiles at low and high , shown in green and purple respectively. There is a clear drop in pedestal temperature, at low . Figure 7 shows the phase space of these plasmas in terms of and , at , (, ). This location is slightly inside the pedestal top where gradients are considerably smaller than in the pedestal itself, so that generally, (). We use this location instead of the top of the pedestal defined by the mtanh to facilitate the use of collisionality as explained below in Section 4.1. Indeed varies dramatically in this set of experiments. In fact, within error bars, these pedestals cluster at opposite corners of the operational space - at high and low , and low and high . For the remainder of the paper, we distinguish the former using purple and the latter using green. Purple markers are also those at low and high , while green ones at higher also maintain lower . We make a more quantitative distinction between these in the next section.
4.1 Pressure and collisionality
Figure 7 includes both isobars and constant collisionality contours (CCC), shown in gray, dashed and black, dash-dotted curves respectively. The curves are both calculated at . The isobars are calculated using and the CCCs are calculated using , where is the safety factor at , is the plasma major radius, is the electron-ion collision frequency, is the inverse aspect ratio, and is the electron thermal velocity. depends on , the effective charge of the plasma, which is a difficult quantity to measure on C-Mod. Since these plasmas did not have extrinsic impurity seeding, is chosen to be 1.4, a common assumption for relatively pure plasmas on C-Mod. Since all of these plasmas are at similar and , there is little variation in , so we calculate the CCCs from its average, . From Figure 7, it is apparent that these pedestals range substantially both in and . Pedestals with low can reach up pressures up to kPa, more than twice that of pedestals with high . Conversely, transport-ridden pedestals at low can reach collisionalities up to . Despite rather continuous changes in heat and particle sources (as seen in Figure 2, there appears to be a quite clear separation in . Green points are those at and the purple points are those at .
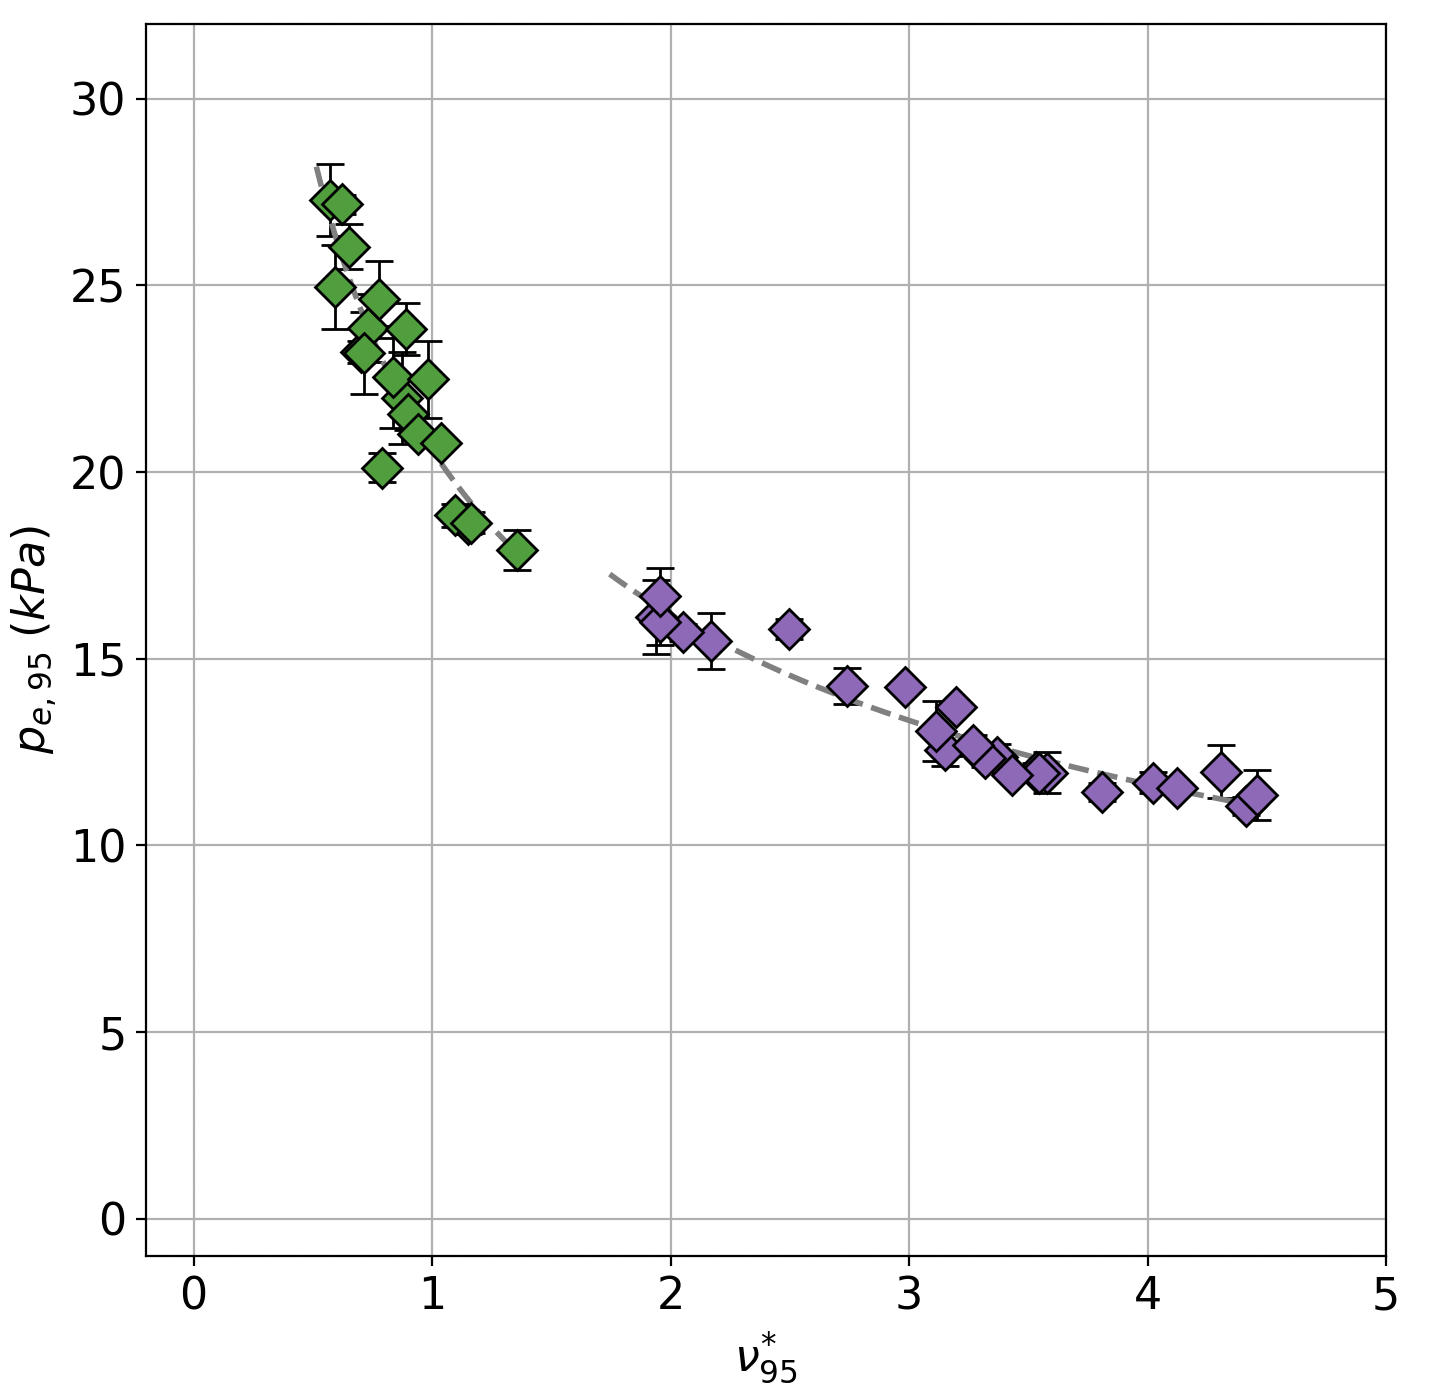
Plotting against as in the left panel of Figure 8 yields a relatively scatter-free correlation. Clearly, collisionality imposes rather strict regulation on the pedestal pressure, with . In fact, it seems that collisionality not only affects the attainable , but also the pressure pedestal gradient, . Previous pedestal analysis on C-Mod has observed that the dimensionless pressure gradient is linked to the pedestal collisionality [18]. The right panel of Figure 8 supports this, showing the normalized pressure gradient, , plotted against , where , using the maximum in the edge, not strictly co-located with the center of the pedestal. Note that most parameters in are relatively constant across these discharges, with the exception of . In other words, changes in are primarily changes in in this dataset. As with , is very tightly regulated by collisionality, decreasing even more strongly with . At low , . At high , the dependence is slightly weaker, with . It may be that as increases further, reaches some minimum value required to sustain an H-mode.
Weakening of can be a symptom of differences in the position of the pedestal relative to the pedestal. Since consists of both and , its value is strongly related to the position of each gradient. Misalignment in the positions of maximum gradient strongly impact . The relative shift of the two profiles has been previously observed and is thought to be a fueling effect, where the peak of the ionization moves radially outward, increasing density and locally cooling the plasma [18, 44, 45]. Of course, can also decrease if either of its constituent gradients decreases. In this dataset, discharges at low collisionality (green) have a relative density and temperature shift, = 1.4 mm, whereas those at high collisionality (purple) have a relative shift = 2.0 mm. On the other hand, low collisionality discharges have on average, a maximum = 123 keVm-1, whereas high collisionality discharges only have a maximum = 32 keVm-1 on average. Indeed, it appears that as increases, it is primarily the lower weakening that is responsible for the weakening of and the threatening of fusion performance, a product of a robust .
4.2 Transport variation with pedestal parameters
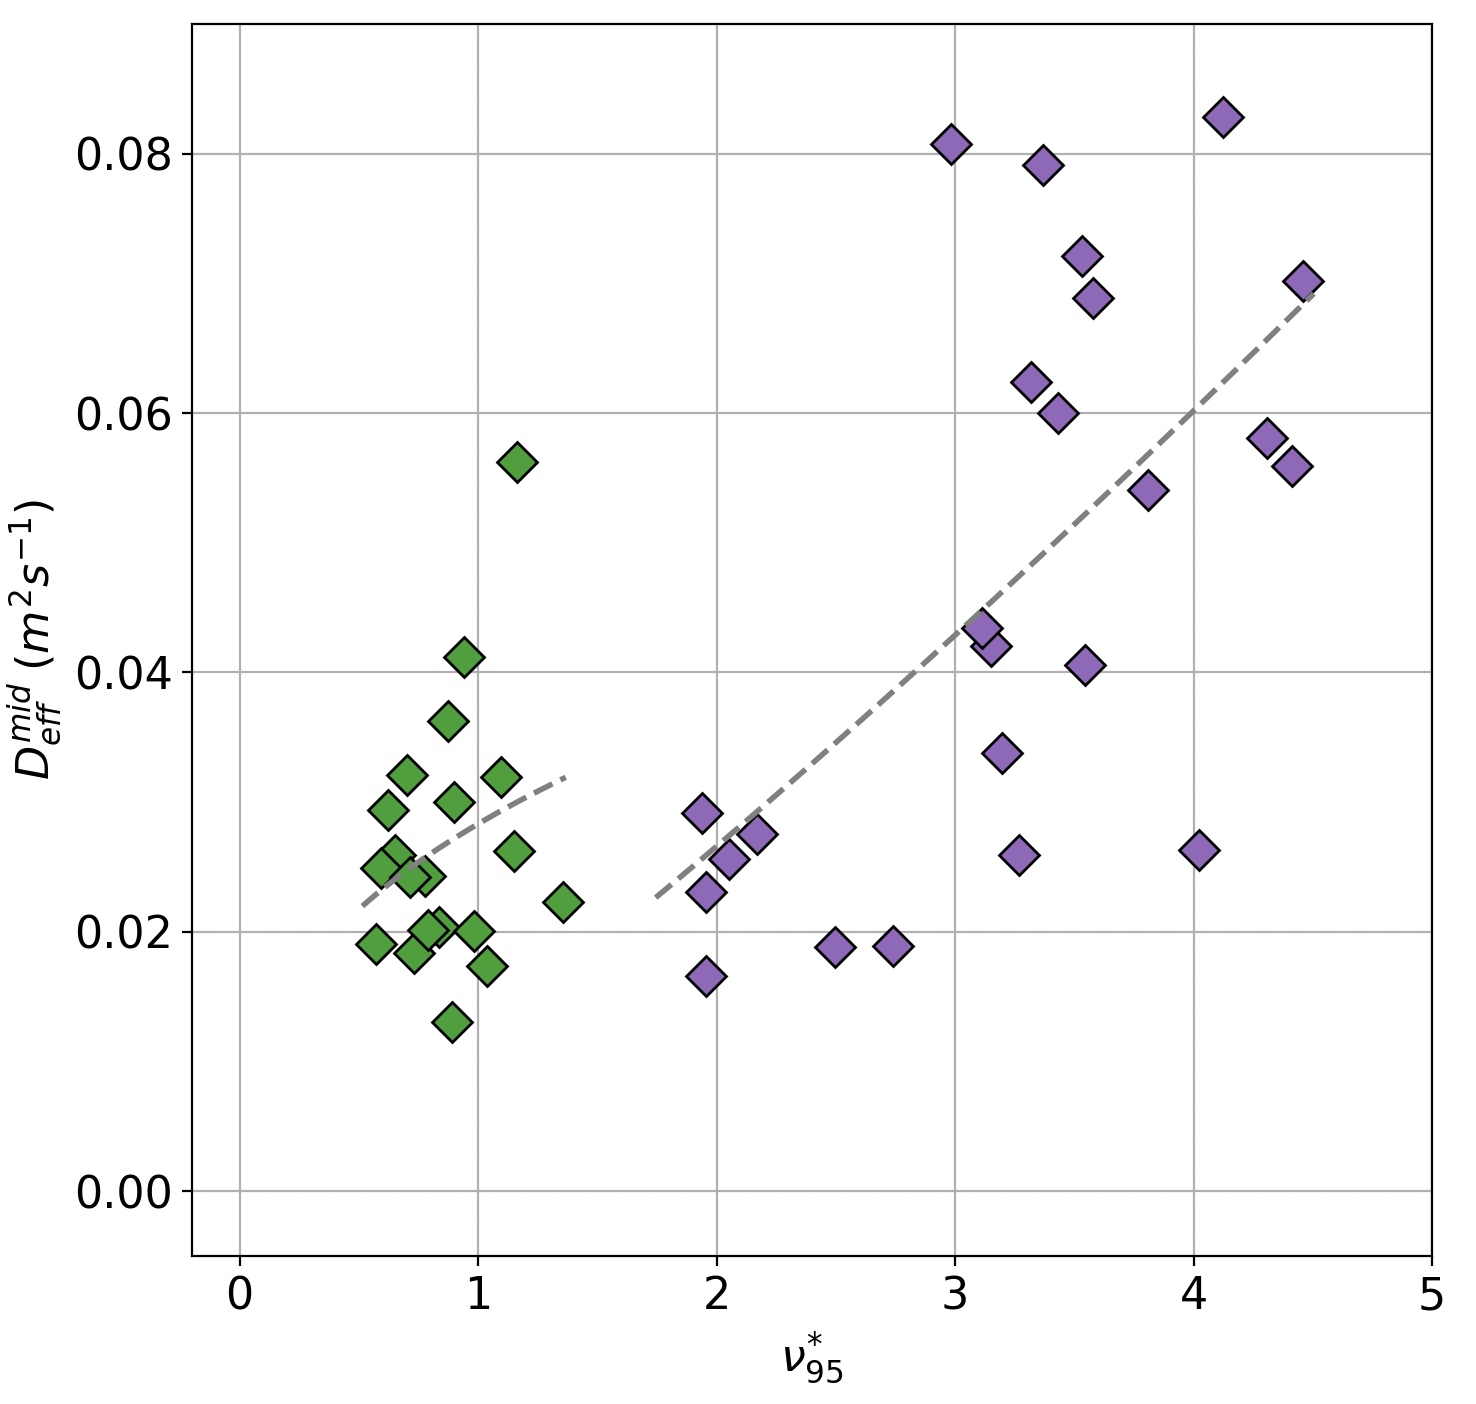
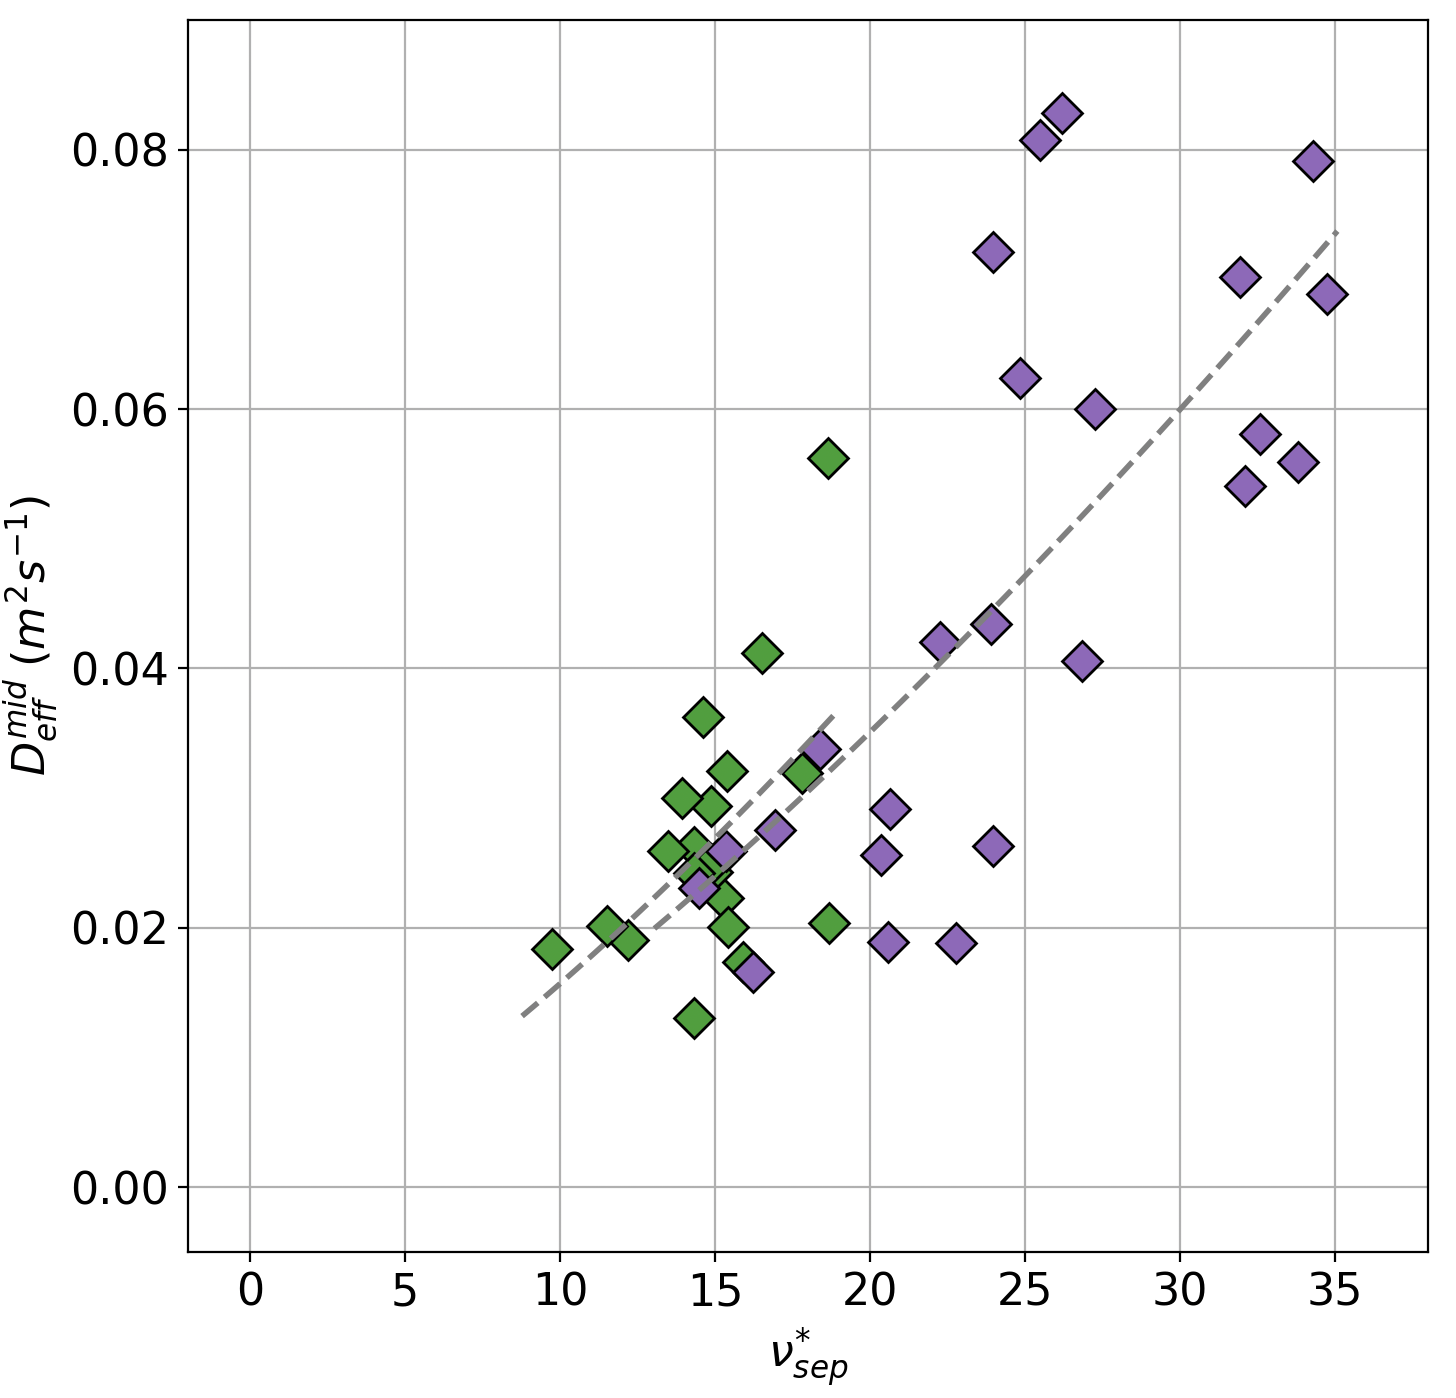
It is not immediately obvious how to identify causality in these pedestals. Concurrent changes in (and ) as well as make it challenging to discern cause and effect. Regardless, it is clear from Section 3, that there are large changes to , which appear to affect pedestal character substantially, most notably by limiting . Observing that the discharges colored in purple are also more collisional, it is natural to question whether pedestal collisionality may be responsible for driving this increased transport. To test this hypothesis, the left panel of Figure 9 shows how at mid-pedestal, , varies with . Not surprisingly, there is an increase in as increases. Regardless, the increase in with is evident only for . The right panel of Figure 9 shows the same variable on the ordinate, but now as a function of calculated at the separatrix. Plotting transport against yields a smoother correlation between transport and collisionality, implying that the separatrix conditions may strongly influence pedestal gradients in these EDA H-modes. At the separatrix, can be almost an order of magnitude higher than at the pedestal top. Given the large gradients in the H-mode pedestal this variation is not surprising - in fact, reactors will likely require a collisional separatrix with view of divertor handling [46], even if the pedestal is collisionless. Based on projections for and found in [47, 48], on SPARC may range anywhere from below 1 and up to 10. Operation at even higher might bring this value closer to values observed here.
4.3 Influence of separatrix condition on pedestal gradients
That the separatrix encodes information about gradients and confinement inside the separatrix is not a novel concept. It has been previously observed on ohmic discharges on C-Mod that conditions around the separatrix strongly influence pressure gradients and the subsequent accumulation of plasma pressure inside of the separatrix [20]. Using a similar framework of electromagnetic fluid drift turbulence, it has been shown on ASDEX Upgrade (AUG) that the (, ) operational space at the separatrix may strongly influence the overall plasma confinement regime [49]. That work applies interchange-drift-Alfvén turbulence (interchange-DALF) theory, identifying , defined in Equation 7, as an important turbulence control parameter.
| (7) |
Here, is the geometric major radius, taken to be equal to the device major radius, , and is the cylindrical safety factor, calculated according to , where is the geometric minor radius, taken equal to the device minor radius, and is the effective elongation, defined in [49].
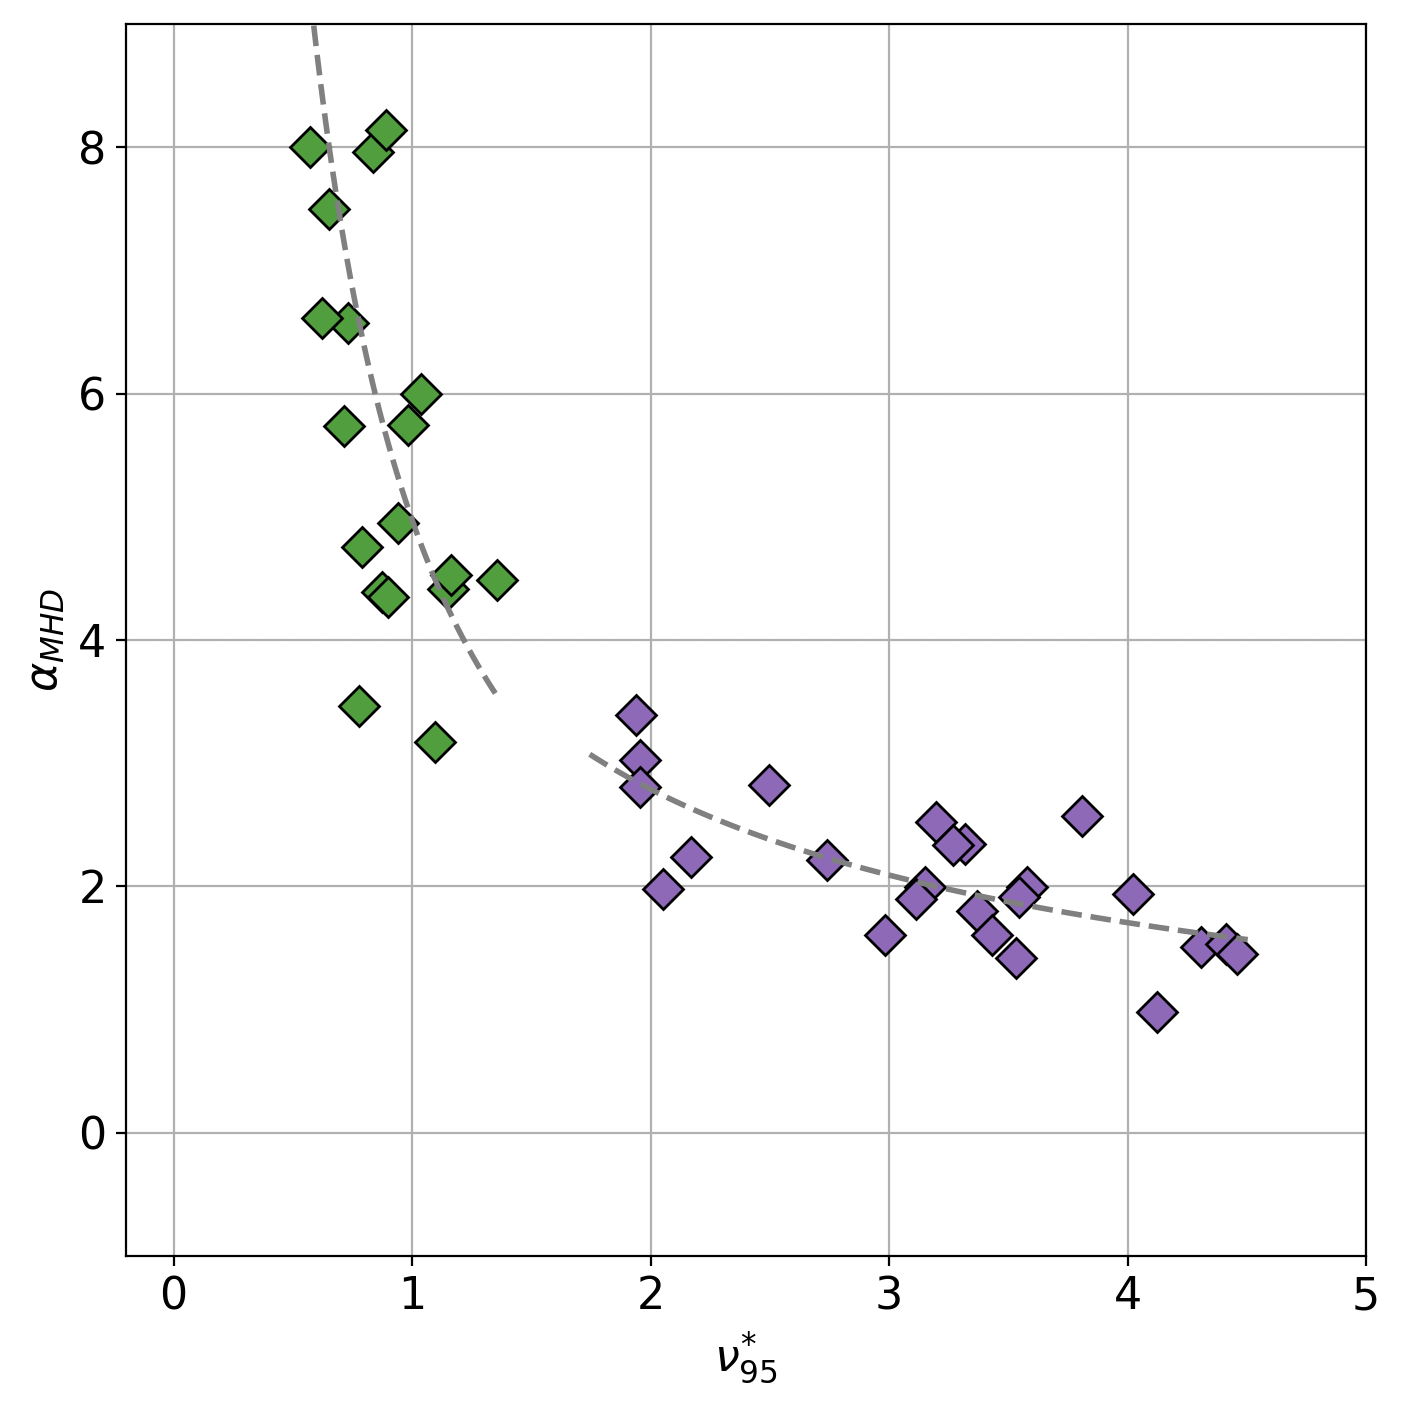
It is observed that large values of can widen the pressure gradient scale length () at the separatrix [50]. Note that this parameter has the same form as the previously plotted , but includes a quadratic rather than linear dependence on the safety factor, . The importance of this additional factor on was noticed earlier as well in the work on C-Mod [20]. There, it was shown that organized better across different values of when including this additional factor of . In the current work, the plasmas are at similar , so little re-organization of data occurs when plotting against instead of . Doing so, however, points to a possible physical explanation. Figure 10 indicates that the transition between the high pressure and low pressure pedestals corresponds almost exactly to when the value of , the proposed marker for transition between drift-wave (DW) and resistive ballooning mode (RBM) turbulence in [49]. As the separatrix gets denser and colder and approaches unity, RBMs may begin to drive particle transport, substantially increasing .
5 Neutral modeling and interpretive transport solutions with SOLPS-ITER
The technique outlined in Section 2 is powerful in that it can be employed across an entire database of shots with high quality Lyα and ETS data. They depend on 1D measurements, however, and any conclusions about transport hinge on assumptions about the poloidal distribution of neutrals. If estimated at the outer midplane (OMP) () is significantly different from the flux-surface averaged () the experimentally inferred may not be wholly indicative of transport in the pedestal across its poloidal extent. Estimates of assume that variation in the poloidal fueling profiles between shots is small and that generally, this peaks at or near the poloidal location observed by the Lyα camera (here, the OMP). Furthermore, without some interpretive power balance analysis using a transport code, we can only investigate the particle transport and know little about changes to the electron or ion thermal transport. To gain insight into thermal transport, validate our inferences of particle transport, and learn about poloidal distribution of neutrals, we choose certain discharges from these experiments to simulate with SOLPS-ITER, a code suite used extensively for edge modeling of plasma and neutrals. SOLPS-ITER couples a 2D multi-fluid plasma transport code, B2.5, with a 3D kinetic Monte Carlo neutral transport solver, EIRENE [51]. In the current study, we focus primarily on the OMP and constrain the plasma and neutral models there. The simulations are performed for only deuterium, D, ion species.
5.1 Plasma constraints
5.1.1 Boundary conditions
For the plasma solution, we attempt to reproduce and from the top of the pedestal to the near-SOL using profile fits to the ETS measurements. This requires choosing appropriate boundary conditions (BC) and cross-field transport coefficients. At the core boundary, we prescribe input power and particle fluxes. For the thermal channel, we use our estimate for and assume energy equipartition, providing to each the electron and the ion populations. In reality, is an estimate of the net power crossing the separatrix, which in these simulations, is radially outside the core boundary. Applying it at the innermost flux-surface of the B2.5 plasma grid assumes negligible radiated power in the plasma annulus about 1 cm thick between this flux-surface and the separatrix. This could yield an underestimation of the actual power crossing that boundary. For the particle channel, we set the particle flux, . Alcator C-Mod had no core particle source, neither via neutral beam injection (NBI), nor pellet-fueling. Any non-zero at the innermost boundary of the B2.5 grid comes entirely from neutrals recycled at its walls, assumed to be negligible. This is checked a posteriori to be a valid assumption, as shown below in Section 5.2.
Although these discharges all have the lower X-point active, they are all close to double-null (DN), with mm. Accurately capturing the physics of the far-SOL required using a disconnected DN (DDN) grid, yielding four targets in the simulation domain. At each of these, sheath BCs are used, set via the usual modified Bohm criterion. The final boundaries left to define BCs for are the SOL and PFR boundaries. The BCs in both are set to the “leakage” type, instead of the more conventional “decay length” type. The choice for these BCs is important for reproducing the details of the neutral profiles, and are thus outlined in Section 5.2. Finally, flux limiters for the thermal parallel transport are included in the simulations, using a value of 0.15 for both ions and electrons.
5.1.2 Transport coefficients
For the plasma transport, we use a purely diffusive model across the three transport channels. For particles, we only assume diffusion, specifying a particle density diffusion coefficient, . For energy, we use thermal diffusivity coefficients, for the electrons, and for the ions. To reproduce the steep gradients in these H-mode edges, it is necessary to apply a transport well by using a radially-varying profile across the three channels. We ignore poloidal variation of transport coefficients in the core and specify transport profiles that reproduce and measurements from ETS at the OMP. This is likely a source of error, as previous work on C-Mod has shown that ballooning-like transport drives larger plasma fluxes to the outboard rather than inboard side of the core [36]. We further assume negligible poloidal variation in radial transport along open field lines in the SOL, another potentially large simplification. In other words, the same radial SOL transport coefficient profile at the midplane is used at the divertor targets. Finally, we use flat transport coefficients in the private-flux region (PFR): = 5 10-2 m-2s-1 and = 7 10-1 m-2s-1.
| Shot | (MW) | (eV) | (1020 m-3) | (1016 m-3) | |
| 1070821003 | 1.4 | 240 | 2.4 | 3.7 | 40 |
| 1070821004 | 2.0 | 280 | 2.5 | 3.0 | 28 |
| 1070821009 | 2.9 | 480 | 2.2 | 2.6 | 23 |
| 1070821008 | 3.4 | 700 | 2.3 | 2.5 | 21 |
To determine transport profiles for the plasma in the MC, we employ an iterative approach. This technique is based on a diffusive transport ansatz, and has been used to reproduce TS profiles on NSTX and DIII-D [52, 53]. First, the code is run to convergence using arbitrary profiles. We evaluate the particle flux, electron heat flux, and ion heat flux from the converged solution. We then use experimentally measured gradients from ETS to calculate a new set of transport coefficients. These new transport coefficients modify simulated gradients, a function of the simulated fluxes, in order to match experiment. This calculation is done at every radial cell, yielding three radially-varying profiles, i.e . These new coefficients calculated at iteration are given in Equations 8 and 9 and depend on the fluxes at the previous iteration .
| (8) |
| (9) |
In Equations 8 and 9, is the heat flux either for the electrons or ions. Equation 9 is actually two equations, one for electrons and one for ions. Since ion temperature, , measurements are unavailable for these cases we assume , and use in lieu of in the calculation of . Earlier work comparing to showed that the temperature ratio, , was not far from one at the pedestal, but could be as high as six at the separatrix and in the SOL [54]. was found to be most clearly dependent on divertor collisionality - the more collisional the divertor, the more equilibrated and . Given that the EDA plasmas in the current study were very collisional, , while likely an under-estimation, may not be wholly inaccurate, at least through the pedestal. Recent simulations of DIII-D have tested various approaches to setting the temperature. They show sensitivity of outputs, namely increased neutral pressure in the PFR at higher values of upstream. This motivates more detailed study of the sensitivity of upstream , specifically in the pedestal, to choice of [53].
Figure 11 shows an example of experimental ETS data and the corresponding mtanh fit. Plotted also is the simulated profile as well as the corresponding profile used to match the experimental from the mtanh fit. Using this iterative transport solving scheme, between % of input power is lost radially across the outer grid boundary. The iterative scheme is a computationally expensive process, so we run the code without including fluid drifts or currents.
5.2 Neutrals constraints
A consequence of Equation 8 is that without a constraint for , any number of values of can reproduce the requisite . In other words, on its own is insufficient to constrain and thus, to find the correct . As shown in Section 2, knowing or equivalently fixes , which can constrain the EIRENE calculation. Therefore, only if we can simultaneously match , , and at the OMP can we confidently make a conclusion about , as well as [27].
Recent work on Alcator C-Mod has helped validate the calculation in EIRENE using the same LYMID camera [27]. A match to experimental was achieved through minimal tuning and across confinement modes, using leakage BCs in the SOL and PFR, as mentioned in Section 5.1.1. Rather than specifying a decay length given by and at the outermost grid cell, leakage BCs insist that the particle flux returning from the vessel walls be proportional to the local sound speed () and , i.e. . The current work finds that the proportionality constant for the particle channel, the particle leakage coefficient (), sets the magnitude of (and by consequence, ). This BC is thus used to vertically shift , attempting primarily to match the magnitude of in the pedestal. While changes the magnitude of it keeps the neutral gradient scale length () in the pedestal () relatively fixed. Previous studies of neutral penetration shows that depends strongly on [15]. Since we are seeking a particular , it is not a free parameter, and we instead mobilize the thermal leakage coefficients for electrons () and ions () to tune . These essentially modify , which indirectly affects , essentially modifying the slope of . The coefficients {, , } thus become the toolkit needed to match both the magnitude and slope of across the pedestal, given a particular B2.5 solution. Updating the EIRENE solution also affects B2.5 by modifying the sources for the plasma transport equations. This essentially adds an outer loop to the iterative process described in Section 5.1. Figure 12 shows an example of the profile, calculated by EIRENE and interpolated onto the B2.5 grid, which results from this tuning process and which corresponds to the case shown in Figure 11.
For these discharges, the simulation domain is treated as an isolated system, with no injection or removal of particles. Since Alcator C-Mod had molybdenum walls which did not readily absorb deuterium, we set the albedo (R) to unity at all vessel walls, including targets. As mentioned in Section 5.1 we impose at the core boundary. Recalling that these H-modes were not actively puffed (see Section 2), we also do not inject gas into the simulation domain via gas puffing. Particle balance is therefore achieved in these simulations simply by manipulating the initial particle inventory.
5.3 Transition in particle and thermal transport
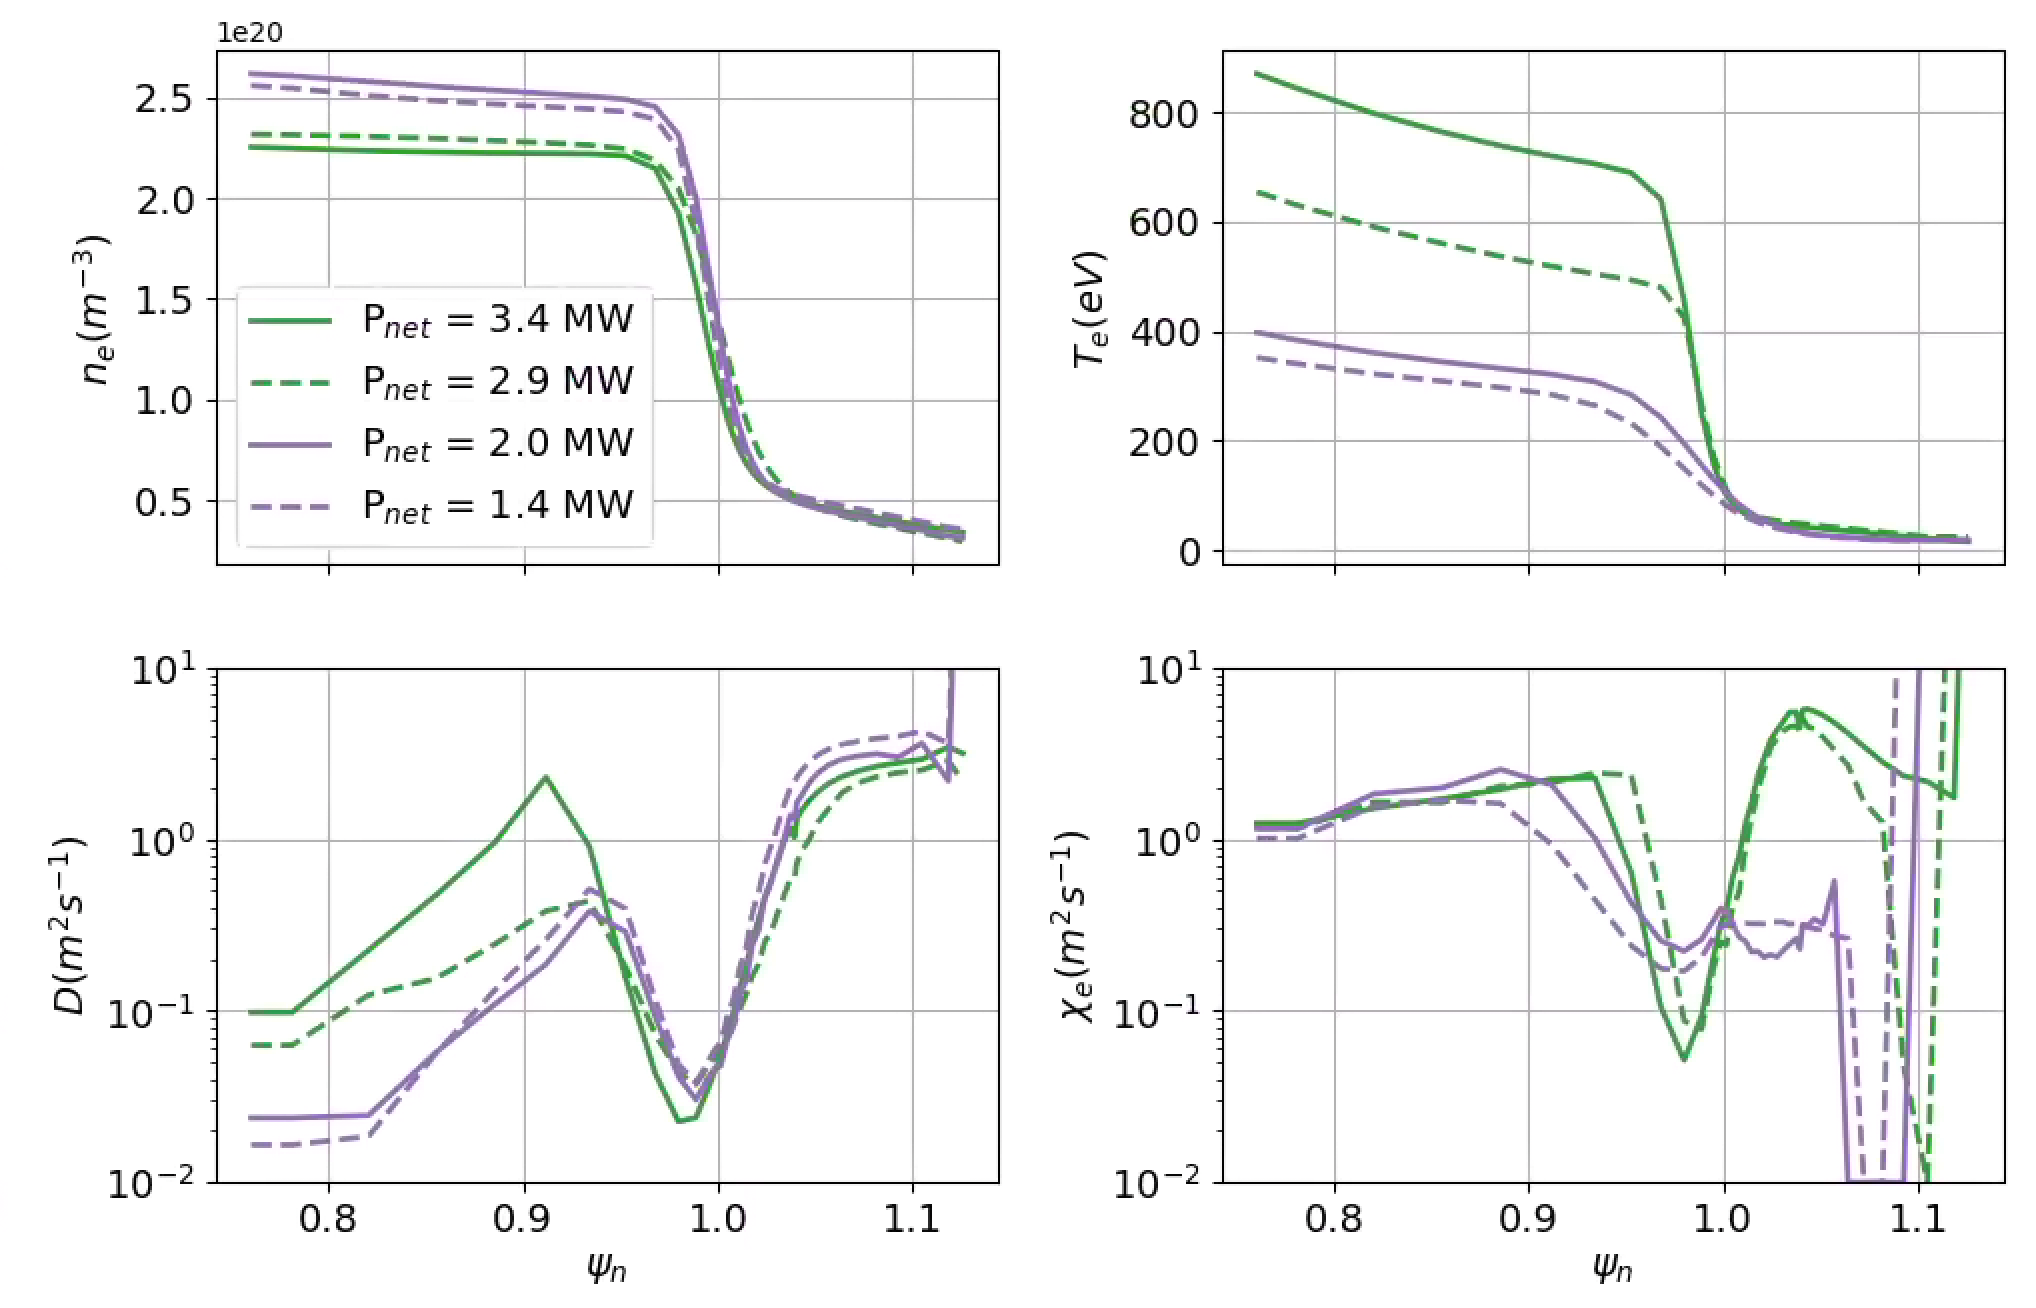
Given the computational cost of these simulations, we select four discharges from the power scan to model, covering a range in and . Table 2 shows the four discharges to be simulated. Two of these are below the critical and two are above. Key parameters of the simulated discharges are listed in Table 2. Figure 13 shows simulated and profiles across the pedestal and into the SOL for the four simulated discharges. The and profiles shown here all closely match the fitted experimental profiles, within fit error bars. As expected, the high discharges have prominent pedestals and slightly lower pedestals. As drops, plummets and grows to the saturated level seen earlier, in Figure 5. At this scale, it is hard to discern variation in separatrix conditions. At the pedestal top, however, it is evident that the green curves are at considerable higher than the purple curves, especially given the dependence in .
The bottom panels of Figure 13 show the transport profiles found to reproduce and . In the pedestal, shifts down and slightly radially inwards as increases. In other words, dropping power shifts the characteristic H-mode transport well out, closer to open field lines, and to larger values of . There do not, however, appear to be drastic changes to the structure of the profile within the pedestal. This is not surprising given the apparent self-similarity of the profiles and the small variation in profile gradients. , on the other hand, clearly changes both in magnitude and in profile structure across the scan. The rise in transport observed in the particle channel is even larger in the electron thermal channel. The purple curves have much higher across the pedestal than the green curves. They also appear to shift slightly radially inward, in the opposite direction of at low . It follows then that the relative shift between and shown in Section 4 can be explained by the spatial decoupling of the particle and electron thermal transport shear layers in low plasmas. More notably, however, is the significant widening of as drops. The pedestals at low , shown in the top right panel, are considerably wider than those at high . At the separatrix, m2s-1 and m2s-1 for all values of .
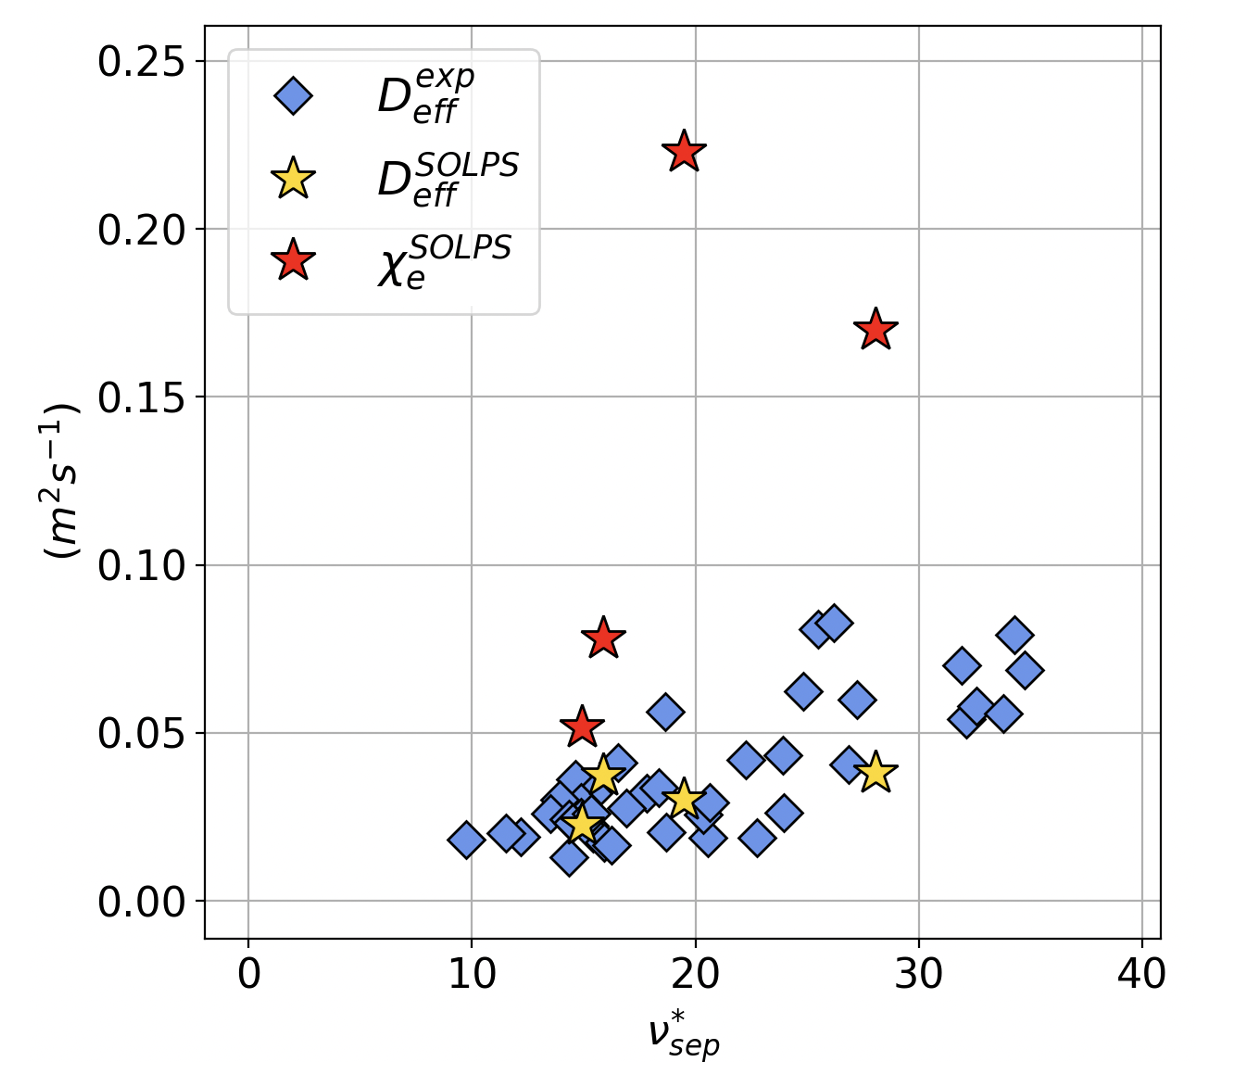
In Figure 14, we plot the simulation results onto the experimentally inferred , as a function of . Indeed the simulated from SOLPS fall within the scatter of the experimental data, trending upwards with collisionality. This lends confidence to our ability to experimentally infer from a 1D neutral measurement localized at the OMP on C-Mod. Of course, as different machines may have different poloidal neutral distributions, this is not in general the case across machines. Figure 14 shows that it is actually that undergoes the most dramatic transition at a critical collisionality, . Interestingly enough, at , . At , however, . Recent computational work using pedestal gyrokinetics has indicated that the ratio of diffusivities in the pedestal in different transport channels may be indicative of different transport drives [55]. Indeed this may be consistent with the earlier assertion of transition in the character of turbulence from Figure 10.
6 Discussion
As mentioned in Section 3, pedestal stiffness and critical gradient-like behavior in the edge of Alcator C-Mod is not a new finding. Given C-Mod’s proximity in parameter space to next-generation devices [56, 57, 58], it is imperative to develop improved understanding for the conditions under which this phenomenon occurs. This paper proposes collisional-driven transport as the mechanism by which a pedestal at its natural density responds to increased neutral flux and regulates its density gradient. As increases, so does . Higher corresponds to an increase in as well, which presumably increases plasma thermal sinks, dropping . The concomitant drop in ultimately drives pedestals that are dense with neutrals to higher collisionalities. As the collisionality at the separatrix transitions past a critical value, so does , and the transport changes in nature. At a critical gradient, increased fueling increases transport. It is this additional resistive transport mechanism that locks the gradient and drives the system non-diffusively. Given that these plasmas are all in the EDA regime, it is natural to question whether pedestal regulation via separatrix collisionality is inherently a feature of this regime. It has been shown on Alcator C-Mod that in EDA H-modes, the density fluctuations characteristic of the quasi-coherent mode (QCM) may be responsible for increased particle transport [59]. Analysis to evaluate possible links between the QCM and the type of transport described here are ongoing.
It is important to note that this work says little about how a pedestal might reach a critical gradient to begin with and what types of devices might be susceptible to reaching one. Two characteristics of Alcator C-Mod, both hinted at above, appear important. The first of these is a neutral effect, which affects particle transport via indirect modification of collisionality. Having operated at the highest of plasma densities, C-Mod is proposed to be the device closest to the opaqueness predicted on both SPARC and ITER [15]. Inability to fuel in the pedestal will push the ionization front radially outward, increasing collisionality at the separatrix or in the near SOL, thereby exacerbating the gradient regulation via resistive transport. This may very well occur at high densities in future machines.
The second effect is related to the poloidal distribution of neutrals on C-Mod. It existed in the so-called main chamber (MC) recycling regime [23], consistent with large radial particle fluxes observed at the OMP. Measurements from a gas puff imaging (GPI) system as well as from a stochastic model imply that this is linked to large filaments called “blobs” propagating radially outward, depositing a large number of particles and heat to the main chamber walls [60]. Little is known about the formation of these blobs, but it is likely that this is strongly linked to conditions at the pedestal. In either case, large particle fluxes to the MC walls means high main chamber neutral density, setting up a plasma environment conducive to the rise of RBMs at or near the separatrix. While it is unclear if the cause of high MC fueling on C-Mod is its high density or rather the close-fitting wall, these features will also be present on next-generation devices, and MC recycling may continue to dominate fueling.
That these C-Mod pedestals exhibit what appears to be critical gradient behavior has a number of implications for new fusion devices. To realize sufficient fusion gain, reactors will require high core densities. These must also be compatible with robust pedestals for good confinement. This work shows that good confinement can be lost when drops below a critical value, , even while remaining in H-mode. For the set of discharges analyzed, this critical value corresponds almost exactly to , calculated from the Martin scaling [61]. Since next-generation devices like SPARC and ITER, and later reactors, require high density and large plasma volumes, it is possible that they too will operate at marginal to their corresponding [62, 63, 64]. It remains to be seen whether the observed transition to a collisional transport regime is inherently linked to the power threshold in a quantitative way in general, or just by coincidence on C-Mod in this parameter range. Once again, we note that this paper includes analysis only of H-modes that are not actively gas puffed. While intrinsic wall-recycling may sound attractive, it means density control is substantially more challenging, or at least that there is a strong (although perhaps indirect) link between and plasma fueling.
7 Conclusions and future work
This work presents new analysis of archival data from Alcator C-Mod. It deploys the routinely used ETS together with the less-frequently analyzed LYMID data to study the role of fueling and transport on pedestals in a high density, opaque edge plasma. Using inferences of ionization rates, it is observed that is a strong function of , continuing to increase even at high . , on the other hand, stagnates, implying a saturated and even shrinking . Comparing this gradient with shows a non-linear relationship, only explainable with varying , despite relatively fixed shape and . Inspection of profiles inside the pedestal top shows that the phase space at this radial location is best categorized by and . Highly collisional pedestals are also found to have lower values of , consistent with worsening H-mode quality and thus, . It is found that is most influential in determining the large rise in across the pedestal and the subsequent flattening of the edge profile. Initial analysis links this to changes in , which mediates the transition betwen DW and RBM turbulence.
We supplement these experimental findings of changes to through modeling of selected discharges with the widely used edge code, SOLPS-ITER. High fidelity calculation of particle and heat sources, in addition to experimental 1D constraints, lends confidence to conclusions about how particle and heat transport must change to build up pedestal-gradients. It highlights the importance of self-consistent modeling of both sources and transport in the development of models for the pedestal. In particular, it allows for inference of (and to the degree that we trust the assumption). Large growth in bolsters the claim that changes to the fundamental transport properties in these pedestals may be at play. Though not highlighted here, work has begun to understand how the poloidal distribution of neutrals may validate or limit the 1D inferences of from experiment. This, as well as understanding the contributions from different atomic processes to the neutral density in the pedestal will be important steps in developing a model for the interplay between fueling and transport in the pedestal.
It has become evident that reactors will not be able to tolerate Type-I ELMs [64, 65, 66]. The non-ELMing behavior of the EDA H-mode, and other similarly non-ELMing modes, highlights the importance in understanding pedestal structure, and the mechanisms that determine it. While it is unclear if the EDA regime is achievable on reactors given that they will operate at high and thus, low , some ELM-free solution is required. The analysis presented here works to improve understanding of how a pedestal may reach a transport limit before it is limited by less benign MHD events. It furthermore suggests that transport throughout the pedestal is more closely linked to the collisionality at the separatrix rather than at the pedestal top. Even if were to remain low, as long as remains high enough, transport regulation of pedestal gradients may persist, ensuring ELM-free operation. Given that reactors may operate at high for divertor survivability, the requisite may not altogether be out of reach. High edge collisionality may also help with turbulence spreading, potentially widening near-SOL widths and working towards an integrated core-edge exhaust solution.
References
References
- [1] ASDEX Team. The H-Mode of ASDEX. Nuclear Fusion, 29(11):1959–2040, November 1989.
- [2] M. Kotschenreuther, W. Dorland, M. A. Beer, and G. W. Hammett. Quantitative predictions of tokamak energy confinement from first-principles simulations with kinetic effects. Physics of Plasmas, 2(6):2381–2389, June 1995.
- [3] M Greenwald, R.L Boivin, F Bombarda, P.T Bonoli, C.L Fiore, D Garnier, J.A Goetz, S.N Golovato, M.A Graf, R.S Granetz, S Horne, A Hubbard, I.H Hutchinson, J.H Irby, B LaBombard, B Lipschultz, E.S Marmar, M.J May, G.M McCracken, P O’Shea, J.E Rice, J Schachter, J.A Snipes, P.C Stek, Y Takase, J.L Terry, Y Wang, R Watterson, B Welch, and S.M Wolfe. H mode confinement in Alcator C-Mod. Nuclear Fusion, 37(6):793–807, June 1997.
- [4] J.E. Kinsey, G.M. Staebler, J. Candy, R.E. Waltz, and R.V. Budny. ITER predictions using the GYRO verified and experimentally validated trapped gyro-Landau fluid transport model. Nuclear Fusion, 51(8):083001, August 2011.
- [5] L. Frassinetti, M.N.A. Beurskens, S. Saarelma, J.E. Boom, E. Delabie, J. Flanagan, M. Kempenaars, C. Giroud, P. Lomas, L. Meneses, C.S. Maggi, S. Menmuir, I. Nunes, F. Rimini, E. Stefanikova, H. Urano, and G. Verdoolaege. Global and pedestal confinement and pedestal structure in dimensionless collisionality scans of low-triangularity H-mode plasmas in JET-ILW. Nuclear Fusion, 57(1):016012, January 2017.
- [6] P. Rodriguez-Fernandez, N. T. Howard, M. J. Greenwald, A. J. Creely, J. W. Hughes, J. C. Wright, C. Holland, Y. Lin, F. Sciortino, and the SPARC team. Predictions of core plasma performance for the SPARC tokamak. Journal of Plasma Physics, 86(5):865860503, October 2020.
- [7] E.J. Doyle (Chair Transport Physics), W.A. Houlberg (Chair Confinement Da Modelling), Y. Kamada (Chair Pedestal Edge), , V. Mukhovatov (co-Chair Transport Physics), T.H. Osborne (co-Chair Pedestal Edge), , A. Polevoi (co-Chair Confinement Da Modelling), G Bateman, J.W Connor, J.G. Cordey (Retired), T Fujita, X Garbet, T.S Hahm, L.D Horton, A.E Hubbard, F Imbeaux, F Jenko, J.E Kinsey, Y Kishimoto, J Li, T.C Luce, Y Martin, M Ossipenko, V Parail, A Peeters, T.L Rhodes, J.E Rice, C.M Roach, V Rozhansky, F Ryter, G Saibene, R Sartori, A.C.C Sips, J.A Snipes, M Sugihara, E.J Synakowski, H Takenaga, T Takizuka, K Thomsen, M.R Wade, H.R Wilson, Itpa Transport Physics Topical Group, Itpa Confinement Database And Model Group, and Itpa Pedestal And Edge Topical Group. Chapter 2: Plasma confinement and transport. Nuclear Fusion, 47(6):S18–S127, June 2007.
- [8] P. Rodriguez-Fernandez, A.J. Creely, M.J. Greenwald, D. Brunner, S.B. Ballinger, C.P. Chrobak, D.T. Garnier, R. Granetz, Z.S. Hartwig, N.T. Howard, J.W. Hughes, J.H. Irby, V.A. Izzo, A.Q. Kuang, Y. Lin, E.S. Marmar, R.T. Mumgaard, C. Rea, M.L. Reinke, V. Riccardo, J.E. Rice, S.D. Scott, B.N. Sorbom, J.A. Stillerman, R. Sweeney, R.A. Tinguely, D.G. Whyte, J.C. Wright, and D.V. Yuryev. Overview of the SPARC physics basis towards the exploration of burning-plasma regimes in high-field, compact tokamaks. Nuclear Fusion, 62(4):042003, September 2022.
- [9] P.B. Snyder, N. Aiba, M. Beurskens, R.J. Groebner, L.D. Horton, A.E. Hubbard, J.W. Hughes, G.T.A. Huysmans, Y. Kamada, A. Kirk, C. Konz, A.W. Leonard, J. Lönnroth, C.F. Maggi, R. Maingi, T.H. Osborne, N. Oyama, A. Pankin, S. Saarelma, G. Saibene, J.L. Terry, H. Urano, and H.R. Wilson. Pedestal stability comparison and ITER pedestal prediction. Nuclear Fusion, 49(8):085035, August 2009.
- [10] R.J. Groebner, P.B. Snyder, T.H. Osborne, A.W. Leonard, T.L. Rhodes, L. Zeng, E.A. Unterberg, Z. Yan, G.R. McKee, C.J. Lasnier, J.A. Boedo, and J.G. Watkins. Limits to the H-mode pedestal pressure gradient in DIII-D. Nuclear Fusion, 50(6):064002, June 2010.
- [11] J.R. Walk, P.B. Snyder, J.W. Hughes, J.L. Terry, A.E. Hubbard, and P.E. Phillips. Characterization of the pedestal in Alcator C-Mod ELMing H-modes and comparison with the EPED model. Nuclear Fusion, 52(6):063011, June 2012.
- [12] P.B. Snyder, J.W. Hughes, T.H. Osborne, C. Paz-Soldan, W.M. Solomon, M. Knolker, D. Eldon, T. Evans, T. Golfinopoulos, B.A. Grierson, R.J. Groebner, A.E. Hubbard, E. Kolemen, B. LaBombard, F.M. Laggner, O. Meneghini, S. Mordijck, T. Petrie, S. Scott, H.Q. Wang, H.R. Wilson, and Y.B. Zhu. High fusion performance in Super H-mode experiments on Alcator C-Mod and DIII-D. Nuclear Fusion, 59(8):086017, August 2019.
- [13] E. Viezzer, M.E. Austin, M. Bernert, K.H. Burrell, P. Cano-Megias, X. Chen, D.J. Cruz-Zabala, S. Coda, M. Faitsch, O. Février, L. Gil, C. Giroud, T. Happel, G.F. Harrer, A.E. Hubbard, J.W. Hughes, A. Kallenbach, B. Labit, A. Merle, H. Meyer, C. Paz-Soldan, P. Oyola, O. Sauter, M. Siccinio, D. Silvagni, and E.R. Solano. Prospects of core–edge integrated no-ELM and small-ELM scenarios for future fusion devices. Nuclear Materials and Energy, 34:101308, March 2023.
- [14] J. W. Hughes, B. LaBombard, D. A. Mossessian, A. E. Hubbard, J. Terry, T. Biewer, and The Alcator C-Mod Team. Advances in measurement and modeling of the high-confinement-mode pedestal on the Alcator C-Mod tokamak. Physics of Plasmas, 13(5):056103, May 2006.
- [15] S. Mordijck. Overview of density pedestal structure: role of fueling versus transport. Nuclear Fusion, 60(8):082006, August 2020.
- [16] M. A. Mahdavi, R. Maingi, R. J. Groebner, A. W. Leonard, T. H. Osborne, and G. Porter. Physics of pedestal density profile formation and its impact on H-mode density limit in burning plasmas. Physics of Plasmas, 10(10):3984–3991, October 2003.
- [17] R. J. Groebner, M. A. Mahdavi, A. W. Leonard, T. H. Osborne, G. D. Porter, R. J. Colchin, and L. W. Owen. The role of neutrals in high-mode (H-mode) pedestal formation. Physics of Plasmas, 9(5):2134–2140, May 2002.
- [18] J.W Hughes, B LaBombard, J Terry, A Hubbard, and B Lipschultz. Edge profile stiffness and insensitivity of the density pedestal to neutral fuelling in Alcator C-Mod edge transport barriers. Nuclear Fusion, 47(8):1057–1063, August 2007.
- [19] B. LaBombard, J. W. Hughes, N. Smick, A. Graf, K. Marr, R. McDermott, M. Reinke, M. Greenwald, B. Lipschultz, J. L. Terry, D. G. Whyte, S. J. Zweben, and Alcator C-Mod Team. Critical gradients and plasma flows in the edge plasma of Alcator C-Mod. Physics of Plasmas, 15(5):056106, May 2008.
- [20] B LaBombard, J.W Hughes, D Mossessian, M Greenwald, B Lipschultz, J.L Terry, and The Alcator C-Mod Team. Evidence for electromagnetic fluid drift turbulence controlling the edge plasma state in the Alcator C-Mod tokamak. Nuclear Fusion, 45(12):1658–1675, December 2005.
- [21] J.W. Hughes, P.B. Snyder, J.R. Walk, E.M. Davis, A. Diallo, B. LaBombard, S.G. Baek, R.M. Churchill, M. Greenwald, R.J. Groebner, A.E. Hubbard, B. Lipschultz, E.S. Marmar, T. Osborne, M.L. Reinke, J.E. Rice, C. Theiler, J. Terry, A.E. White, D.G. Whyte, S. Wolfe, and X.Q. Xu. Pedestal structure and stability in H-mode and I-mode: a comparative study on Alcator C-Mod. Nuclear Fusion, 53(4):043016, April 2013.
- [22] M. Faitsch, T. Eich, G.F. Harrer, E. Wolfrum, D. Brida, P. David, M. Dunne, L. Gil, B. Labit, and U. Stroth. Analysis and expansion of the quasi-continuous exhaust (QCE) regime in ASDEX Upgrade. Nuclear Fusion, 63(7):076013, July 2023.
- [23] B LaBombard, M.V Umansky, R.L Boivin, J.A Goetz, J Hughes, B Lipschultz, D Mossessian, C.S Pitcher, J.L Terry, and Alcator Group. Cross-field plasma transport and main-chamber recycling in diverted plasmas on Alcator C-Mod. Nuclear Fusion, 40(12):2041–2060, December 2000.
- [24] K. Lackner and R. Schneider. The role of edge physics and confinement issues in the fusion reactor. Fusion Engineering and Design, 22(10):107–116, March 1993.
- [25] M. Greenwald, A. Bader, S. Baek, M. Bakhtiari, H. Barnard, W. Beck, W. Bergerson, I. Bespamyatnov, P. Bonoli, D. Brower, D. Brunner, W. Burke, J. Candy, M. Churchill, I. Cziegler, A. Diallo, A. Dominguez, B. Duval, E. Edlund, P. Ennever, D. Ernst, I. Faust, C. Fiore, T. Fredian, O. Garcia, C. Gao, J. Goetz, T. Golfinopoulos, R. Granetz, O. Grulke, Z. Hartwig, S. Horne, N. Howard, A. Hubbard, J. Hughes, I. Hutchinson, J. Irby, V. Izzo, C. Kessel, B. LaBombard, C. Lau, C. Li, Y. Lin, B. Lipschultz, A. Loarte, E. Marmar, A. Mazurenko, G. McCracken, R. McDermott, O. Meneghini, D. Mikkelsen, D. Mossessian, R. Mumgaard, J. Myra, E. Nelson-Melby, R. Ochoukov, G. Olynyk, R. Parker, S. Pitcher, Y. Podpaly, M. Porkolab, M. Reinke, J. Rice, W. Rowan, A. Schmidt, S. Scott, S. Shiraiwa, J. Sierchio, N. Smick, J. A. Snipes, P. Snyder, B. Sorbom, J. Stillerman, C. Sung, Y. Takase, V. Tang, J. Terry, D. Terry, C. Theiler, A. Tronchin-James, N. Tsujii, R. Vieira, J. Walk, G. Wallace, A. White, D. Whyte, J. Wilson, S. Wolfe, G. Wright, J. Wright, S. Wukitch, and S. Zweben. 20 years of research on the Alcator C-Mod tokamak. Physics of Plasmas, 21(11):110501, November 2014.
- [26] J.W. Hughes, P.B. Snyder, M.L. Reinke, B. LaBombard, S. Mordijck, S. Scott, E. Tolman, S.G. Baek, T. Golfinopoulos, R.S. Granetz, M. Greenwald, A.E. Hubbard, E. Marmar, J.E. Rice, A.E. White, D.G. Whyte, T. Wilks, and S. Wolfe. Access to pedestal pressure relevant to burning plasmas on the high magnetic field tokamak Alcator C-Mod. Nuclear Fusion, 58(11):112003, November 2018.
- [27] R. Reksoatmodjo, S. Mordijck, J.W. Hughes, J.D. Lore, and X. Bonnin. The role of edge fueling in determining the pedestal density in high neutral opacity Alcator C-Mod experiments. Nuclear Materials and Energy, 27:100971, June 2021.
- [28] A. E. Hubbard, R. L. Boivin, R. S. Granetz, M. Greenwald, J. W. Hughes, I. H. Hutchinson, J. Irby, B. LaBombard, Y. Lin, E. S. Marmar, A. Mazurenko, D. Mossessian, E. Nelson-Melby, M. Porkolab, J. A. Snipes, J. Terry, S. Wolfe, S. Wukitch, B. A. Carreras, V. Klein, and T. Sunn Pedersen. Pedestal profiles and fluctuations in C-Mod enhanced D-alpha H-modes. Physics of Plasmas, 8(5):2033–2040, May 2001.
- [29] R. L. Boivin, J. A. Goetz, A. E. Hubbard, J. W. Hughes, I. H. Hutchinson, J. H. Irby, B. LaBombard, E. S. Marmar, D. Mossessian, C. S. Pitcher, J. L. Terry, B. A. Carreras, and L. W. Owen. Effects of neutral particles on edge dynamics in Alcator C-Mod plasmas. Physics of Plasmas, 7(5):1919–1926, May 2000.
- [30] R.L. Boivin, J. Goetz, A. Hubbard, J.W. Hughes, J. Irby, B. LaBombard, E. Marmar, D. Mossessian, and J.L. Terry. High resolution measurements of neutral density and ionization rate in the main chamber of the Alcator C-Mod tokamak. Journal of Nuclear Materials, 290-293:542–545, March 2001.
- [31] A. M. Rosenthal, J. W. Hughes, A. Bortolon, F. M. Laggner, T. M. Wilks, R. Vieira, R. Leccacorvi, E. Marmar, A. Nagy, C. Freeman, and D. Mauzey. A 1D Lyman-alpha profile camera for plasma edge neutral studies on the DIII-D tokamak. Review of Scientific Instruments, 92(3):033523, March 2021.
- [32] T. Odstrčil, T. Pütterich, M. Odstrčil, A. Gude, V. Igochine, U. Stroth, and ASDEX Upgrade Team. Optimized tomography methods for plasma emissivity reconstruction at the ASDEX Upgrade tokamak. Review of Scientific Instruments, 87(12):123505, December 2016.
- [33] J. W. Hughes, D. A. Mossessian, A. E. Hubbard, E. S. Marmar, D. Johnson, and D. Simon. High-resolution edge Thomson scattering measurements on the Alcator C-Mod tokamak. Review of Scientific Instruments, 72(1):1107–1110, January 2001.
- [34] R.J Groebner, D.R Baker, K.H Burrell, T.N Carlstrom, J.R Ferron, P Gohil, L.L Lao, T.H Osborne, D.M Thomas, W.P West, J.A Boedo, R.A Moyer, G.R McKee, R.D Deranian, E.J Doyle, C.L Rettig, T.L Rhodes, and J.C Rost. Progress in quantifying the edge physics of the H mode regime in DIII-D. Nuclear Fusion, 41(12):1789–1802, December 2001.
- [35] Aaron Michael Rosenthal. Experimental Studies of Neutral Particle Effects on Edge Transport Barriers in Tokamaks Using the Lyman-alpha Measurement Apparatus.
- [36] B. LaBombard, R. L. Boivin, M. Greenwald, J. Hughes, B. Lipschultz, D. Mossessian, C. S. Pitcher, J. L. Terry, S. J. Zweben, and Alcator Group. Particle transport in the scrape-off layer and its relationship to discharge density limit in Alcator C-Mod. Physics of Plasmas, 8(5):2107–2117, May 2001.
- [37] A.M. Rosenthal, J.W. Hughes, F.M. Laggner, T. Odstrčil, A. Bortolon, T.M. Wilks, and F. Sciortino. Inference of main ion particle transport coefficients with experimentally constrained neutral ionization during edge localized mode recovery on DIII-D. Nuclear Fusion, 63(4):042002, April 2023.
- [38] A.M. Rosenthal, J.W. Hughes, F.M. Laggner, T. Odstrčil, A. Bortolon, T.M. Wilks, S. Mordijck, M.A. Miller, and F. Sciortino. Pedestal main ion particle transport inference through gas puff modulation with experimental source measurements. Nuclear Fusion, 64(3):036006, March 2024.
- [39] F. M. Laggner, A. Bortolon, A. M. Rosenthal, T. M. Wilks, J. W. Hughes, C. Freeman, T. Golfinopoulos, A. Nagy, D. Mauzey, M. W. Shafer, and the DIII-D Team. Absolute calibration of the Lyman- measurement apparatus at DIII-D. Review of Scientific Instruments, 92(3):033522, March 2021.
- [40] M. V. Umansky, S. I. Krasheninnikov, B. LaBombard, and J. L. Terry. Comments on particle and energy balance in the edge plasma of Alcator C-Mod. Physics of Plasmas, 5(9):3373–3376, September 1998.
- [41] P.C. Stangeby. The Plasma Boundary of Magnetic Fusion Devices. Plasma Physics Series. Institute of Physics Publishing Ltd, 2000.
- [42] D. Brunner, B. LaBombard, A.Q. Kuang, and J.L. Terry. High-resolution heat flux width measurements at reactor-level magnetic fields and observation of a unified width scaling across confinement regimes in the Alcator C-Mod tokamak. Nuclear Fusion, 58(9):094002, September 2018.
- [43] J. C. Hillesheim, J. C. DeBoo, W. A. Peebles, T. A. Carter, G. Wang, T. L. Rhodes, L. Schmitz, G. R. McKee, Z. Yan, G. M. Staebler, K. H. Burrell, E. J. Doyle, C. Holland, C. C. Petty, S. P. Smith, A. E. White, and L. Zeng. Observation of a Critical Gradient Threshold for Electron Temperature Fluctuations in the DIII-D Tokamak. Physical Review Letters, 110(4):045003, January 2013.
- [44] M G Dunne, S Potzel, F Reimold, M Wischmeier, E Wolfrum, L Frassinetti, M Beurskens, P Bilkova, M Cavedon, R Fischer, B Kurzan, F M Laggner, R M McDermott, G Tardini, E Trier, E Viezzer, M Willensdorfer, The EUROfusion MST1 Team, and The ASDEX-Upgrade Team. The role of the density profile in the ASDEX-Upgrade pedestal structure. Plasma Physics and Controlled Fusion, 59(1):014017, January 2017.
- [45] H.Q. Wang, H.Y. Guo, A.W. Leonard, A.L. Moser, T.H. Osborne, P.B. Snyder, E. Belli, R.J. Groebner, D.M. Thomas, J.G. Watkins, Z. Yan, and the DIII-D group. Effects of divertor geometry on H-mode pedestal structure in attached and detached plasmas in the DIII-D tokamak. Nuclear Fusion, 58(9):096014, September 2018.
- [46] D Moulton, P C Stangeby, X Bonnin, and R A Pitts. Comparison between SOLPS-4.3 and the Lengyel Model for ITER baseline neon-seeded plasmas. Nucl. Fusion, 2021.
- [47] S.B. Ballinger, A.Q. Kuang, M.V. Umansky, D. Brunner, J.M. Canik, M. Greenwald, J.D Lore, B. LaBombard, J.L. Terry, M. Wigram, and The Sparc Team. Simulation of the SPARC plasma boundary with the UEDGE code. Nuclear Fusion, 61(8):086014, August 2021.
- [48] P. Rodriguez-Fernandez, N. T. Howard, A. Saltzman, L. Shoji, T. Body, D. J. Battaglia, J. W. Hughes, J. Candy, G. M. Staebler, and A. J. Creely. Core performance predictions in projected SPARC first-campaign plasmas with nonlinear CGYRO, March 2024. arXiv:2403.15633 [physics].
- [49] T Eich and P Manz. The separatrix operational space of ASDEX Upgrade due to interchange-drift-Alfve´n turbulence. Nucl. Fusion, 2021.
- [50] T Eich, P Manz, R J Goldston, P Hennequin, P David, M Faitsch, B Kurzan, B Sieglin, and E Wolfrum. Turbulence driven widening of the near-SOL power width in ASDEX Upgrade H-Mode discharges. Nucl. Fusion, 2020.
- [51] S. Wiesen, D. Reiter, V. Kotov, M. Baelmans, W. Dekeyser, A.S. Kukushkin, S.W. Lisgo, R.A. Pitts, V. Rozhansky, G. Saibene, I. Veselova, and S. Voskoboynikov. The new SOLPS-ITER code package. Journal of Nuclear Materials, 463:480–484, August 2015.
- [52] J.M. Canik, R. Maingi, V.A. Soukhanovskii, R.E. Bell, H.W. Kugel, B.P. LeBlanc, and T.H. Osborne. Measurements and 2-D modeling of recycling and edge transport in discharges with lithium-coated PFCs in NSTX. Journal of Nuclear Materials, 415(1):S409–S412, August 2011.
- [53] R S Wilcox, M W Shafer, and J D Lore. INTERPRETIVE MODELING USING SOLPS-ITER FOR PUMPING EXPERIMENTS WITH A CLOSED DIVERTOR IN DIII-D.
- [54] D. Brunner, B LaBombard, R M Churchill, J Hughes, B Lipschultz, R Ochoukov, T D Rognlien, C Theiler, J Walk, M V Umansky, and D Whyte. An assessment of ion temperature measurements in the boundary of the Alcator C-Mod tokamak and implications for ion fluid heat flux limiters. Plasma Physics and Controlled Fusion, 55(9):095010, September 2013.
- [55] M. Kotschenreuther, X. Liu, D.R. Hatch, S. Mahajan, L. Zheng, A. Diallo, R. Groebner, the DIII-D TEAM, J.C. Hillesheim, C.F. Maggi, C. Giroud, F. Koechl, V. Parail, S. Saarelma, E.R. Solano, A. Chankin, and JET Contributors. Gyrokinetic analysis and simulation of pedestals to identify the culprits for energy losses using ‘fingerprints’. Nuclear Fusion, 59(9):096001, September 2019.
- [56] A. J. Creely, M. J. Greenwald, S. B. Ballinger, D. Brunner, J. Canik, J. Doody, T. Fülöp, D. T. Garnier, R. Granetz, T. K. Gray, C. Holland, N. T. Howard, J. W. Hughes, J. H. Irby, V. A. Izzo, G. J. Kramer, A. Q. Kuang, B. LaBombard, Y. Lin, B. Lipschultz, N. C. Logan, J. D. Lore, E. S. Marmar, K. Montes, R. T. Mumgaard, C. Paz-Soldan, C. Rea, M. L. Reinke, P. Rodriguez-Fernandez, K. Särkimäki, F. Sciortino, S. D. Scott, A. Snicker, P. B. Snyder, B. N. Sorbom, R. Sweeney, R. A. Tinguely, E. A. Tolman, M. Umansky, O. Vallhagen, J. Varje, D. G. Whyte, J. C. Wright, S. J. Wukitch, J. Zhu, and the SPARC Team. Overview of the SPARC tokamak. Journal of Plasma Physics, 86(5):865860502, October 2020.
- [57] P. Vondracek, R. Panek, M. Hron, J. Havlicek, V. Weinzettl, T. Todd, D. Tskhakaya, G. Cunningham, P. Hacek, J. Hromadka, P. Junek, J. Krbec, N. Patel, D. Sestak, J. Varju, J. Adamek, M. Balazsova, V. Balner, P. Barton, J. Bielecki, P. Bilkova, J. Błocki, D. Bocian, K. Bogar, O. Bogar, P. Boocz, I. Borodkina, A. Brooks, P. Bohm, J. Burant, A. Casolari, J. Cavalier, P. Chappuis, R. Dejarnac, M. Dimitrova, M. Dudak, I. Duran, R. Ellis, S. Entler, J. Fang, M. Farnik, O. Ficker, D. Fridrich, S. Fukova, J. Gerardin, I. Hanak, A. Havranek, A. Herrmann, J. Horacek, O. Hronova, M. Imrisek, N. Isernia, F. Jaulmes, M. Jerab, V. Kindl, M. Komm, K. Kovarik, M. Kral, L. Kripner, E. Macusova, T. Majer, T. Markovic, E. Matveeva, K. Mikszuta-Michalik, M. Mohelnik, I. Mysiura, D. Naydenkova, I. Nemec, R. Ortwein, K. Patocka, M. Peterka, A. Podolnik, F. Prochazka, J. Prevratil, J. Reboun, V. Scalera, M. Scholz, J. Svoboda, J. Swierblewski, M. Sos, M. Tadros, P. Titus, M. Tomes, A. Torres, G. Tracz, P. Turjanica, M. Varavin, V. Veselovsky, F. Villone, P. Wachal, V. Yanovskiy, G. Zadvitskiy, J. Zajac, A. Zak, D. Zaloga, J. Zelda, and H. Zhang. Preliminary design of the COMPASS upgrade tokamak. Fusion Engineering and Design, 169:112490, August 2021.
- [58] B.N. Sorbom, J. Ball, T.R. Palmer, F.J. Mangiarotti, J.M. Sierchio, P. Bonoli, C. Kasten, D.A. Sutherland, H.S. Barnard, C.B. Haakonsen, J. Goh, C. Sung, and D.G. Whyte. ARC: A compact, high-field, fusion nuclear science facility and demonstration power plant with demountable magnets. Fusion Engineering and Design, 100:378–405, November 2015.
- [59] J.L Terry, N.P Basse, I Cziegler, M Greenwald, O Grulke, B LaBombard, S.J Zweben, E.M Edlund, J.W Hughes, L Lin, Y Lin, M Porkolab, M Sampsell, B Veto, and S.J Wukitch. Transport phenomena in the edge of Alcator C-Mod plasmas. Nuclear Fusion, 45(11):1321–1327, November 2005.
- [60] O. E. Garcia, S. M. Fritzner, R. Kube, I. Cziegler, B. LaBombard, and J. L. Terry. Intermittent fluctuations in the Alcator C-Mod scrape-off layer. Physics of Plasmas, 20(5):055901, May 2013.
- [61] Y R Martin, T Takizuka, and The Itpa Cdbm H-mode Threshold Data Group. Power requirement for accessing the H-mode in ITER. Journal of Physics: Conference Series, 123:012033, July 2008.
- [62] J.W. Hughes, A. Loarte, M.L. Reinke, J.L. Terry, D. Brunner, M. Greenwald, A.E. Hubbard, B. LaBombard, B. Lipschultz, Y. Ma, S. Wolfe, and S.J. Wukitch. Power requirements for superior H-mode confinement on Alcator C-Mod: experiments in support of ITER. Nuclear Fusion, 51(8):083007, August 2011.
- [63] Y. Ma, J.W. Hughes, A.E. Hubbard, B. LaBombard, R.M. Churchill, T. Golfinopolous, N. Tsujii, and E.S. Marmar. Scaling of H-mode threshold power and L–H edge conditions with favourable ion grad-B drift in Alcator C-Mod tokamak. Nuclear Fusion, 52(2):023010, February 2012.
- [64] J. W. Hughes, N. T. Howard, P. Rodriguez-Fernandez, A. J. Creely, A. Q. Kuang, P. B. Snyder, T. M. Wilks, R. Sweeney, and M. Greenwald. Projections of H-mode access and edge pedestal in the SPARC tokamak. Journal of Plasma Physics, 86(5):865860504, October 2020.
- [65] A. Q. Kuang, S. Ballinger, D. Brunner, J. Canik, A. J. Creely, T. Gray, M. Greenwald, J. W. Hughes, J. Irby, B. LaBombard, B. Lipschultz, J. D. Lore, M. L. Reinke, J. L. Terry, M. Umansky, D. G. Whyte, S. Wukitch, and the SPARC Team. Divertor heat flux challenge and mitigation in SPARC. Journal of Plasma Physics, 86(5):865860505, October 2020.
- [66] A.W. Leonard, A. Herrmann, K. Itami, J. Lingertat, A. Loarte, T.H. Osborne, W. Suttrop, The Iter Divertor Modeling Database Expert Group, , and The Iter Divertor Physics Expert Group. The impact of ELMs on the ITER divertor. Journal of Nuclear Materials, 266-269:109–117, March 1999.