[ auid=000, bioid=001, degree=PhD, orcid=0000-0001-5193-6560] \cortext[c]Corresponding author \creditConceptualization, Methodology, Software, Validation, Formal analysis, Investigation, Project administration, Data Curation, Writing - Original Draft, Writing - Review & Editing, Visualization, Supervision
[orcid=0000-0002-1249-4760] \creditProject administration, Investigation, Data Curation
[orcid=0000-0001-5629-6275] \creditMethodology, Investigation, Software, Data Curation, Validation, Formal analysis, Visualization, Writing - Original Draft, Writing - Review & Editing
Software, Data Curation
Software, Data Curation
[orcid=0000-0002-3878-5048] \creditSoftware, Writing - Review & Editing
Project administration, Investigation, Data Curation, Resources
[degree=PhD] \creditConceptualization, Writing - Review & Editing, Supervision, Resources, Funding acquisition
[orcid=0000-0002-0109-5975, degree=Ph.D.] \creditMethodology, Writing - Review & Editing, Supervision
[orcid=0000-0001-8995-5636, degree=Ph.D.] \creditMethodology, Writing - Review & Editing, Supervision
[degree=PhD,orcid=0000-0003-3774-6714] \creditFormal analysis, Writing - Review & Editing
[degree=PhD,orcid=0000-0003-2492-653X] \creditFormal analysis, Writing - Review & Editing, Funding acquisition
[degree=PhD,orcid=0000-0002-7143-1823] \creditConceptualization, Writing - Review & Editing, Supervision, Resources, Funding acquisition
eee]organization=School of Electrical and Electronic Engineering, Nanyang Technological University,addressline=50 Nanyang Avenue, city=Singapore 639798, country=Singapore
gt] organization=Center for Music Technology, Georgia Institute of Technology, addressline=J. Allen Couch Building, 840 McMillan St NW, city=Atlanta, postcode=30332, state=GA, country=USA
hdb]organization=Building & Research Institute, Housing & Development Board, city=Singapore 738973, country=Singapore
cnu] organization=Department of Architectural Engineering, Chungnam National University, addressline=34134, city=Daejeon, country=Republic of Korea
ucl] organization=UCL Institute for Environmental Design and Engineering, The Bartlett, University College London, Central House,, addressline=14 Upper Woburn Place, city=London WC1H 0NN, country=United Kingdom
nbs]organization=Nanyang Business School, Nanyang Technological University,addressline=50 Nanyang Avenue, city=Singapore 639798, country=Singapore
hku]organization=Laboratory of Neuropsychology and Human Neuroscience, Department of Psychology, The University of Hong Kong,addressline=Pokfulam Road, country=Hong Kong
[1] \tnotetext[1]The research protocols used in this research were approved by the institutional review board of Nanyang Technological University (NTU), Singapore [IRB-2023-399].
Automating Urban Soundscape Enhancements with AI: In-situ Assessment of Quality and Restorativeness in Traffic-Exposed Residential Areas
Abstract
Formalized in ISO 12913, the “soundscape” approach is a paradigmatic shift towards perception-based urban sound management, aiming to alleviate the substantial socioeconomic costs of noise pollution to advance the United Nations Sustainable Development Goals. Focusing on traffic-exposed outdoor residential sites, we implemented an automatic masker selection system (AMSS) utilizing natural sounds to mask (or augment) traffic soundscapes. We employed a pre-trained AI model to automatically select the optimal masker and adjust its playback level, adapting to changes over time in the ambient environment to maximize “Pleasantness”, a perceptual dimension of soundscape quality in ISO 12913. Our validation study involving () residents revealed a significant enhancement in “Pleasantness” after intervention, correlating with increased restorativeness and positive affect. Perceptual enhancements at the traffic-exposed site matched those at a quieter control site with lower and road traffic noise dominance, affirming the efficacy of AMSS as a soundscape intervention, while streamlining the labour-intensive assessment of “Pleasantness” with probabilistic AI prediction.
keywords:
urban soundscape \sepnatural sounds \sepauditory masking \sepprobabilistic approach \sepsoundscape augmentation \separtificial intelligence1 Introduction
1.1 Background and motivation
In urban environments, road traffic noise poses significant annual economic burdens, rivaling those of road accidents, as evidenced by estimates in England (£7 billion) and across Europe (€38 billion) [1, 2, 3]. Beyond economic concerns, the documented adverse physical and mental health effects of urban noise warrant urgent mitigation [1, 4, 5, 6]. For instance, even a modest reduction of in noise levels has been projected to yield substantial annual economic benefits from adverse health effects in the United States, totaling $3.9 billion [3].
Crucially, mere reductions in sound pressure levels (SPLs) may not uniformly translate into perceptual improvements. Considerable variations in annoyance and comfort levels have been found among individuals exposed to identical SPLs, highlighting the complexity of the urban “soundscape” perception [7, 8, 9, 10].
The soundscape approach, formalized in the ISO 12913 series [11, 12, 13], offers a holistic strategy for urban sound management, aligning with the United Nations Sustainable Development Goals (SDGs), particularly SDG 3 (well-being) and SDG 11 (sustainable cities), by accounting for how humans perceive and experience their aural environments, in context. The significance of this approach is echoed by the United Nations Environment Program Frontiers 2022 report, which emphasized the need to mitigate unwanted noise while harnessing the health-promoting benefits of natural sounds [14, 15, 16].
1.2 Soundscape augmentation for road traffic noise
Soundscape augmentation emerges as a viable intervention technique under the ISO 12913 paradigm. Additional sounds, known as “maskers”, are augmented to existing soundscapes through loudspeakers or electroacoustic systems. In prior art, maskers used in traffic-exposed urban areas typically comprise natural sounds, such as wind sounds [17], sounds from animals (such as birds [18, 19] and insects [20]), water sounds (such as man-made water features [21], natural waterfalls [22], waves [23], and streams [24, 25]), and corresponding mixtures [26].
Specifically, Calarco and Galbrun [27] modeled the propagation of water feature sounds in a park exposed to traffic noise, defining optimal listening zones where water sounds were not less than below the traffic noise levels [22]. They found that the optimal zone decreases with increasing traffic noise levels, in addition to variations in preference among various water feature varieties. Conversely, a laboratory study by Nilsson et al. [28] found a significant reduction in traffic noise perception only when the fountain sound exceeded road noise by at least . A improvement in overall sound quality post-augmentation was reported, favoring compositions with songbirds at varying volumes. Furthermore, [29] found that participants were more likely to be highly annoyed when traffic noise was perceived to be the dominant sound source under augmentation with birdsongs and stream sounds. On the contrary, a separate virtual reality (VR)-study found no evidence that any particular birdsong composition augmented to soundscapes of a Swedish park reduced stress levels [30]. Van Renterghem et al. [31] explored real-world soundscape augmentation in a traffic-exposed park by inviting participants to customize natural sound samples emitted from a hidden speaker to their preference. Hence, it would be naive to assume that every bird masker (or every masker from the same class in general) would improve the quality of a given soundscape, thereby necessitating some form of selection process to effect a desired perceptual change.
Moreover, few studies have extended their findings into soundscape augmentation systems for road traffic noise in real-life urban environments. Installing and uninstalling speakers in a soundscape augmentation system can also be more cost-effective and conducive to the surrounding environment as compared to alternative methods of noise mitigation such as noise barriers, which require physical space and may be more difficult to retrofit to existing urban areas [32].
1.3 Masker selection methods for soundscape augmentation
One real-life soundscape augmentation system was explored by Van Renterghem et al. [31] in a park in Ghent, Belgium, where road traffic noise was dominant. Participants composed their own maskers by adjusting the playback levels of eight natural sound samples emanating from a hidden loudspeaker, then evaluated both the original and augmented soundscapes. The study observed a mean improvement of 0.36 unit () in overall sound quality on a 5-point scale, with most participants preferring the sounds of house sparrows and mixed songbirds.
Similar effects may also be observed even if the loudspeaker or speaker systems are visible to the participants. Hong et al. [33] conducted a study with participants standing at pedestrian walkways near roads, adjusting the soundscape-to-masker (SMR) ratio of birdsong and fountain recordings reproduced by down-firing speakers of a mixed-reality device. The recordings were accompanied either by a hologram matching their source (a bird for the birdsong and a jet-and-basin fountain for the fountain) or by a visible speaker. Participants adjusted the SMR to a level they found most preferable for masking traffic noise. The study found no significant differences in the chosen SMRs or the resultant ratings of overall soundscape quality and perceived loudness of traffic noise between the hologram and speaker conditions. In addition, Regazzi et al. [34] used the frequency spectrum of transformer noise in a residential area to create a natural sound masker, aiming to equalize tonal frequencies when reproduced over speakers. This demonstrates the effectiveness of speakers in soundscape augmentation, despite the potential lack of realism compared to real-life sources.
However, these methods require participant involvement or expert input to generate optimal maskers and playback gains, which may not be practical for long-term deployments. Changing soundscape characteristics over time can render previously optimal maskers suboptimal.
Alternatively, model-based approaches offer the potential for generalizability across scenarios. For instance, Lenne et al. [35] optimized masker playback locations indoors based on room acoustics simulations, while others have incorporated physical models for real-time augmentation of footstep sounds in virtual-reality soundscapes [36, 37, 38]. Suhanek et al. [39] optimized the “total distraction coefficient” to select appropriate songs as maskers for park and expressway soundscapes, but only theoretically validated their masker choices. Despite the promise, model-based approaches remain sparse in the literature, particularly in the context of road traffic noise, and none have been developed using the ISO 12913 framework.
Automated masker selection methods could enhance efficiency by reducing the time and labor involved in human evaluation, while also adapting to changing soundscapes. The success of automated masker selection relies on the availability of reliable models to predict affective responses, such as “Pleasantness” (ISOPL) [13] or restorativeness [40, 41], which are crucial for enhancing acoustic comfort. To date, few prediction models for multidimensional indicators such as ISOPL have been developed [42, 43, 44, 45, 46], and interventions based on enhancing ISOPL are lacking [47].
1.4 Research questions
Addressing these gaps, we utilize our probabilistic ISOPL prediction model, trained on our large-scale dataset of perceptual responses to soundscapes [48], to deploy and validate a proof-of-concept model-based automatic masker selection system (AMSS) at a traffic-exposed residential site. Operating autonomously, the AMSS augments the soundscape to maximize ISOPL. Through in-situ validation, we aim to assess the impact of AMSS on soundscape quality, its influence on related perceptual dimensions, and its correlation with objective acoustic metrics. Specifically, we seek to answer the following research questions:
-
RQ1.
To what extent can the soundscape quality of a traffic-exposed site be modified by the AMSS?
-
RQ2.
What impact does optimizing a soundscape intervention to improve ISOPL have on other soundscape-related perceptual dimensions, such as restorativeness, perceived loudness, and ISOEV?
-
RQ3.
How do perceptual changes induced by the AMSS correlate to objective (psycho)acoustic metrics?
2 Method
The in-situ validation study was conducted between 1 August 2023 and 30 November 2023, and prior to participant recruitment and experimentation, formal ethical approval was obtained from the Institutional Review Board at Nanyang Technological University (Reference number IRB 2023-399). The study administrators strictly adhered to the approved methodology, and informed consent was obtained from all participants prior to the start of the experiment.
2.1 Study sites
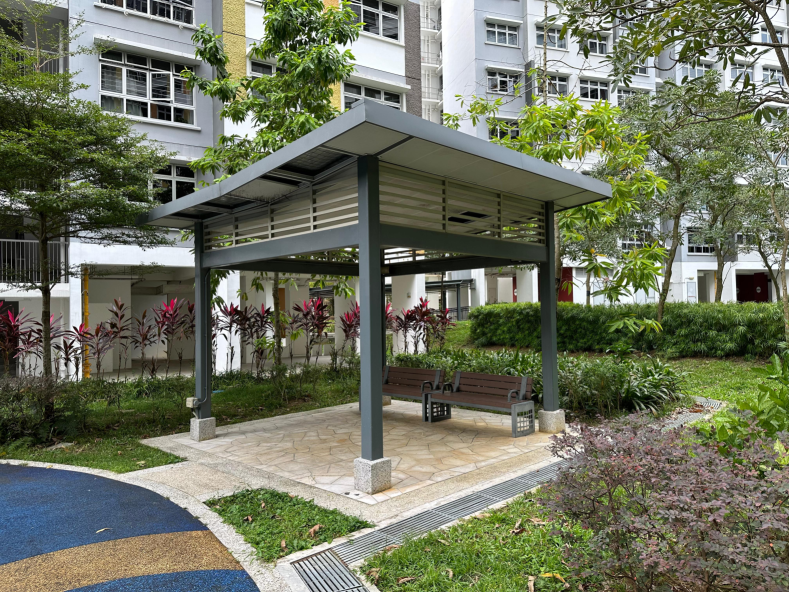
The study sites were two distinct pavilions within a public residential estate in Singapore, as shown in Figure 1. Both pavilions were identical in design, but were situated at different locations in the estate.
The first study site was a ground-floor (“GND”) pavilion positioned at street level adjacent to a children’s playground and fitness area. The GND was situated amidst six residential apartment blocks, which were in turn surrounded by and served as a physical barrier to a minor 2-lane road ( away from the pavilion) with light traffic. As a control site, no AMSS was deployed at the GND.
The second study site was a rooftop (“ROOF”) garden pavilion positioned near the periphery of rooftop garden atop an 8-storey multi-storey car park (MSCP), which bordered a major 8-lane expressway with heavy traffic. The ROOF was positioned above street level and was flanked by a 2-lane slip road ( away) leading out from a major 6-lane expressway ( away). The AMSS was physically deployed at the ROOF, with four loudspeakers (Moukey M20-2, DONNER LLC, FL, USA) affixed to the pavilion roof (at a height of above the ground of the pavilion) in a square of length for the playback of maskers, which were automatically selected and reproduced according to the method described in Section 2.3. A customized Internet-of-Things (IoT)-based infrastructure was used for the deployed AMSS, as detailed by [49]. The placement of the hardware of AMSS did not physically or visually block any ingress or egress routes to the ROOF.

2.2 Design of in-situ validation experiment
To investigate the influence of the AMSS on soundscape perception, we employed a within-between design. Participants were allocated randomly into two independent groups (between factor): the “AMSS” (AMSS) and the “Ambient” (AMB) group. In both groups, participants evaluated the soundscapes at both the GND and ROOF (within factor) in a randomized order. However, the AMSS was turned on (i.e., soundscape augmentation was performed according to the method described in Section 2.3) for the AMSS group at the RTGP and turned off (i.e., no soundscape augmentation was performed) for the AMB group at the ROOF. As explained in Section 2.1, the AMSS was not deployed at the GND, so the evaluations at the GND for participants in both the AMSS and AMB groups corresponded to that of the ambient environment at the GND. Given the communal nature of the public space, each session accommodated up to four participants, aligning with the maximum seating capacity of the pavilions. On average, there were 1.53 0.80 participants per session, and an overview of the experimental procedure for each session is illustrated in Figure 2.
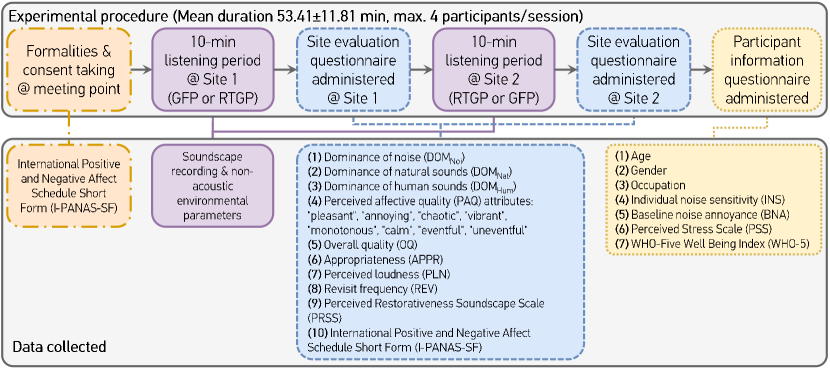
At the onset of each session, participants convened at the meeting point (MP) for the requisite consent process, a briefing on the study protocol, and hands-on training with the electronic form used for the evaluations. The International Positive and Negative Affect Schedule Short Form (I-PANAS-SF) [50] was also administered at the meeting point. To prevent undue bias in evaluation, participants were not informed whether they had been placed into the AMSS or AMB group, and were also not informed about the presence of the AMSS system at the ROOF. Within each study site, participants were initially directed to listen to the pavilion’s soundscape for without engaging in any other activities and without interacting with each other. Subsequently, they used their personal mobile devices to complete an electronic evaluation form. To ensure clarity, study administrators reiterated the following instructions verbatim to participants before the listening period:
We will be assessing the sound environment within the pavilion. Over the next 10 minutes, immerse yourself in the surrounding sounds. Choose to sit or stand, but minimize movements to avoid disturbing others. Refrain from using your phone or engaging in other activities. Focus on the types of sounds and your emotional responses, considering the pavilion’s context for rest and relaxation.
During the listening period, the acoustic environment experienced by the participants was captured using a binaural microphone (TYPE 4101-B, Hottinger Brüel & Kjær A/S, Virum, Denmark) equipped with a windscreen. This microphone was coupled with a data recorder (SQobold, HEAD acoustics GmbH, Herzogenrath, Germany). Ensuring data precision and uniformity, the binaural recording equipment underwent calibration using an IEC 60942 class 1 calibrator (42AG, G.R.A.S. Sound & Vibration A/S, Holte, Denmark). The responsibility of wearing and operating this equipment rested with a single experiment administrator during each session, with a total of four unique administrators overseeing the entire 4-month study duration.
In alignment with ISO 12913-2 [12], environmental data was systematically collected during the listening period. Temperature and humidity readings were obtained from a combined digital humidity and temperature sensor (BME280, Bosch Sensortec GmbH, Reutlingen, Germany), while luminance data was captured by an optical sensor (LTR-559ALS-01, LITE-ON Technology Corp., Taiwan) integrated into the AMSS system at the ROOF, all at intervals. Additionally, wind speed, 24- pollutant standards index (PSI), and PM2.5 readings were sourced from the nearest weather station via the Singapore Meteorological Service, also recorded at intervals. Detailed specifications regarding the metrics, range, accuracy, and resolution of the measurement instruments are delineated in Table 1.
| Instrument | Metric | Range | Accuracy | Resolution/Sensitivity |
| TYPE 4101-B Binaural Microphone | Sound pressure () | – | re | 20 mV/Pa |
| 5 – | soft boost at incidence | |||
| BME280 Digital humidity, pressure and temperature sensor | Temperature () | 0 – 65 | 0.5 | 0.01 |
| Relative humidity (%RH) |
0 – 100
(0 – 60) |
3 | 0.008 | |
| LTR-559ALS-01 Optical Sensor | Luminance () | 1 | 64000 | 0.977 |
After the listening period, the participants were instructed to complete the I-PANAS-SF questionnaire. Thereafter, participants received the following instruction:
This evaluation is about the surrounding sound environment you just experienced in the past 10 minutes. Answer the following questions by recalling the sounds you experienced in the 10 minutes.
The questions formed the site evaluation questionnaire, which prompted participants to rate (1) the dominance of noise (DOMNoi), (2) the dominance of natural sounds (Nature), (3) the dominance of human sounds (DOMHum), (4) the 8 attributes corresponding to perceived affective quality (PAQ) in the Method A questionnaire of ISO 12913-2, (5) the overall soundscape quality (OSQ), (6) appropriateness (APPR), and (7) perceived loudness (PLN) on 5-point scales, on top of the items in the 18-item Perceived Restorativeness Soundscape Scale by [41], which were on 7-point scales. The PRSS consists of four main dimensions: Fascination (PRSSFas), Being-Away (PRSSBA), Compatibility (PRSSCom), and Extent, which consists of two sub-dimensions: Extent-Coherence (PRSSEC) and Extent-Scope (PRSSES). The precise wording of each item in the site evaluation questionnaire is provided in Appendix A, Section Appendix A.
Considering the fatigue and relevance of terms within the local context, the 18-item PRSS scale utilized in this study underwent modification by omitting or consolidating 7 of the 23 items from the PRSS scale with specific framing outlined by Payne and Guastavino [41]. These adjustments are detailed in Table A.3.
At the end of the soundscape evaluation at the second site, participants completed an additional participant information questionnaire covering basic demographics (gender, age, occupation) and self-reported assessments on the (1) individual noise sensitivity (INS) [51], (2) baseline noise annoyance (BNA) [52], (3) Perceived Stress Scale (PSS-10) [53], and (4) WHO-Five Well-being Index (WHO-5) [54]. exact wording of every item in the participant information questionnaire can be found in Section Appendix A. The experimental procedure averaged 53.41 to complete.
2.3 Stimuli and automatic masker selection
As explained in Section 2.2, only the AMSS group experienced augmented soundscapes with maskers presented over four loudspeakers in the ROOF. The maskers were selected from the bank of maskers in the ARAUS dataset [48], comprising 280 different processed recordings of birds, water, wind, traffic, and construction as mono tracks.
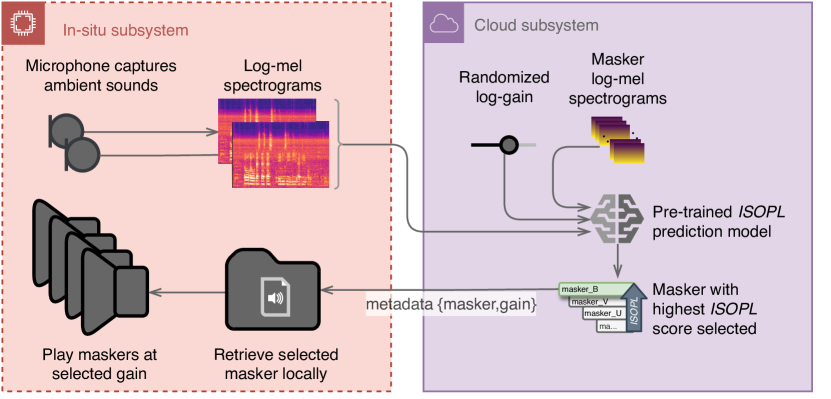
Specifically, a pre-trained artificial intelligence (AI) model decoupling the spectrograms of the existing soundscape, masker, and playback gain [44] was used in the AMSS to pick maskers and corresponding gain values, in intervals of . The model was trained on the subjective responses to augmented urban soundscapes in the ARAUS dataset to predict distributions of ISO Pleasantness (ISOPL), as defined in ISO 12913-3 [13], which the AMSS then used to select a masker-gain combination at each interval to maximise the ISOPL of the existing soundscape at the ROOF. An overview of the AMSS system is depicted in Figure 1c.
At each interval, the AMSS randomly picked 5 gain values from a log-normal distribution for each masker candidate in the masker bank, with the log-gains being normally distributed with mean and standard deviation . These values match the distribution of log-gains in the ARAUS dataset maskers when calibrated to an SPL of and correspond to five possible SMRs when applied to the maskers upon playback. For each of these masker-gain combinations, the AI model gave as initial output the predicted ISOPL distributions as though they were used to augment the existing soundscape. Then, the masker-gain combinations were ranked in terms of the predicted improvement in ISOPL via the estimation scheme described by [45]. Lastly, the top-ranked masker-gain configuration was reproduced across the four loudspeakers in the deployed AMSS with each loudspeaker playing back the same masker at the same SPL corresponding to the gain value.
The sound level output of each loudspeaker was previously calibrated for each masker from 46 to in intervals using a custom automated procedure in a soundproof box [55], at a distance of from a measurement microphone (146AE, G.R.A.S. Sound & Vibration A/S, Holte, Denmark). The desired output sound level of the masker corresponding to the gain value determined by the AMSS was achieved by energetic interpolation and compensation for distance (inverse square law) and number of speakers (4 speakers).
A total of 481 instances of maskers selected by the AMSS and reproduced over the loudspeakers at the ROOF were logged across 18 of the 20 sessions during the AMSS condition. Maskers bird_00069 () and bird_00075 () were selected the most often, which were sometimes interjected by bird_00071 (), bird_00025 () and bird_00012 (), as delineated in Table 2. The frequency of masker presentation in Table 2 depicts an average participant’s exposure during the listening period preceding the evaluation at the ROOF for the AMSS group.
| Maskers | Frequency (%) | Description |
| bird_00012 | 0.2% | Bahama Mockingbirda |
| bird_00025 | 1.0% | Baltimore Orioleb |
| bird_00069 | 26% | Northern Cardinalc |
| bird_00071 | 5.8% | Veeryd |
| bird_00075 | 67% | Common Redshanke |
aPaul Driver, XC140239. Accessible at www.xeno-canto.org/140239.
bEric DeFonso, XC370500. Accessible at www.xeno-canto.org/370500.
cChristopher McPherson, XC601752. Accessible at www.xeno-canto.org/601752.
dChristopher McPherson, XC602571. Accessible at www.xeno-canto.org/602571.
eJoao Tomas, XC604437. Accessible at www.xeno-canto.org/604437.
2.4 Non-acoustic environmental conditions for in-situ validation study
As measured by the instruments shown in Table 1, the in-situ experimental conditions exhibited notable stability across all parameters for both the AMSS and AMB groups, as presented in Table 3. The prevailing temperature and humidity levels align with the characteristic hot and humid tropical climate of Singapore, complemented by wind speeds indicative of light air. A noteworthy consideration is the absolute luminance levels, which were damped by the tinting on the protective cover over the sensor.
Importantly, the air quality remained within healthy limits throughout the entire study duration. Employing Wilcoxon rank-sum tests at a significance level revealed no significant distinctions between the AMSS and AMB groups across key environmental parameters of temperature, relative humidity, luminance, wind speed, 24-hour PSI, and PM2.5 readings. Given the inherent in-situ nature of this study, where environmental parameters are beyond direct experimental control, the discovery of non-significant differences between groups is fortuitous but noteworthy. This outcome allays concerns associated with potential confounding factors stemming from divergent environmental conditions between the AMSS and AMB groups.
| Environmental Parameter | AMSS1 | Ambient1 | p-value2 |
| Temperature () | 31.64 (1.37) | 33.39 (2.13) | 0.083 |
| Relative Humidity (%RH) | 59.09 (4.20) | 56.02 (6.96) | 0.494 |
| Luminance () | 314.65 (132.44) | 334.45 (162.26) | 0.750 |
| Wind Speed () | 3.63 (0.76) | 3.17 (1.25) | 0.259 |
| 24- PSI | 50.17 (6.08) | 45.50 (6.50) | 0.203 |
| PM2.5 () | 16.00 (4.15) | 11.92 (4.54) | 0.098 |
1Reported as “Mean (Standard deviation)”
2Wilcoxon rank sum exact test; Wilcoxon rank sum test
2.5 Participants
A cohort of participants participated in this study. Recruitment was executed through mobile messaging channels and the distribution of advertisements via grassroots organisations. The study inclusion criteria mandated that participants reside within the designated postal sector of the study site (i.e., postal sector 82) and fall within the age range of 21 to 70 years. Participants received remuneration in the form of supermarket vouchers with a value of $30 (Singapore dollars).
Due to the onset of a thunderstorm midway through one of the study sessions, data from the two participants for that session were deemed unreliable and subsequently excluded from the analysis. The final dataset comprised responses from 68 participants, consisting of females () and males (), with a mean age of 41.75 and standard deviation of age of 12.83, as detailed in Table 4. Participants were generally working-class adults, but the employment status varied among individual participants, with a majority being employed (), followed by retirees (), students (), unemployed individuals (), and a segment that either did not disclose or fell into the “other” category (). The AMSS group comprised 36 participants, while the AMB group consisted of 32 participants. Variations in proportions of gender between the AMSS and AMB groups were determined to be non-significant via four-sample test for equality of proportions without continuity correction (). On the other hand, the age was similarly distributed between AMSS and AMB(). The central tendencies and dispersion of the self-assessed PSS-10, INS, WHO-5, and baseline annoyance across all noise categories were similar across both AMSS and AMB groups, as detailed in Table 4.
Tests of distribution equality were performed across age, PSS-10, INS, WHO-5, and all baseline annoyance categories, acknowledging the potential influence of non-acoustical factors on soundscape perception [56, 57]. Analysis using the exact two-sample Kolmogorov-Smirnov test revealed no significant differences between the AMSS and AMB groups, as listed in the -value column in Table 4.
| Overall, N = 681 | Ambient, N = 321 | AMSS, N = 361 | p-value2 | |
| Gender | 0.09 | |||
| Female | 40 (59%) | 21 (66%) | 19 (53%) | |
| Male | 28 (41%) | 11 (34%) | 17 (47%) | |
| Age | 41.75 (12.83) | 42.00 (13.22) | 41.53 (12.65) | 0.91 |
| Occupation | ||||
| Employed | 48 (71%) | 26 (72%) | 22 (69%) | |
| Other | 1 (1.5%) | 1 (2.8%) | 0 (0%) | |
| Rather not say | 4 (5.9%) | 2 (5.6%) | 2 (6.3%) | |
| Retired | 6 (8.8%) | 2 (5.6%) | 4 (13%) | |
| Student | 6 (8.8%) | 3 (8.3%) | 3 (9.4%) | |
| Unemployed | 3 (4.4%) | 2 (5.6%) | 1 (3.1%) | |
| PSS-10 | 0.51 (0.13) | 0.51 (0.13) | 0.51 (0.14) | 0.94 |
| INS | 0.67 (0.06) | 0.67 (0.05) | 0.67 (0.06) | 0.72 |
| WHO-5 | 0.62 (0.17) | 0.59 (0.17) | 0.65 (0.16) | 0.54 |
| BAaircraft | 3.93 (1.39) | 3.88 (1.41) | 3.97 (1.38) | 0.82 |
| BAmrt | 2.35 (1.22) | 2.59 (1.29) | 2.14 (1.13) | 0.46 |
| BAconsite | 3.53 (1.30) | 3.59 (1.29) | 3.47 (1.32) | 0.80 |
| BAreno | 3.46 (1.34) | 3.59 (1.39) | 3.33 (1.31) | 0.59 |
| BAtraffic | 3.46 (1.20) | 3.53 (1.14) | 3.39 (1.27) | 0.90 |
| BAanimals | 2.12 (1.10) | 1.94 (1.05) | 2.28 (1.14) | 0.28 |
| BAchildren | 2.51 (1.17) | 2.66 (1.21) | 2.39 (1.13) | 0.51 |
| BApeople | 2.34 (1.02) | 2.47 (1.05) | 2.22 (0.99) | 0.28 |
| BAothers | 2.35 (1.18) | 2.38 (1.10) | 2.33 (1.26) | 0.83 |
1Gender and occupation reported as “Count (%)”; all others reported as “Mean (Standard deviation)”; 2Four-sample test for equality of proportions without continuity correction for gender, and Exact two-sample Kolmogorov-Smirnov test otherwise
2.6 Data analysis
From the binaural recordings collected in Section 2.2, objective acoustic and psychoacoustic indices were computed with a commercial software package (ArtemiS suite, HEAD acoustics GmbH, Herzogenrath, Germany) on the representative channel with the highest value [13]. These included both the A- and C-weighted equivalent sound pressure level over each listening period (; ), and the exceedance level of psychoacoustic loudness () as computed with ISO 532-1 [58]. Whereas the and metrics are commonly used in noise policies, the was previously found to correlate strongly with the perceived loudness of traffic sounds [25].
For consistency and comparability, the scales for all items in the site evaluation questionnaire were normalized such that all values ranged from to 1 before further analysis was performed. The PAQ items were also transformed into the normalized quantities “ISO Pleasantness (ISOPL)” and “ISO Eventfulness (ISOEV)” based on the definition given in ISO 12913-3. Specifically, we computed ISOPL and ISOEV as
| ISOPL | (1) | |||
| ISOEV | (2) |
where are the extent to which the soundscape was respectively perceived to be pleasant, eventful, chaotic, vibrant, uneventful, calm, annoying, and monotonous, on a scale of 1 to 5. Separate positive affect (PA) and negative affect (New A) scores were also computed from the responses to the I-PANAS-SF, as recommended by [59].
In the scope of a between-within experimental design, quantitative attributes were assessed using a two-way linear mixed effects with a repeated measures approach. The factor within subjects, termed site, featured two levels: GND and ROOF. Simultaneously, the between-subject factor, termed condition, featured two levels: AMB and AMSS.
For the examination of the attributes in DOMNoi, Nature, DOMHum, New A, OSQ, APPR, PLN}, a non-parametric two-way linear mixed effects repeated measures type III rank-transformed analysis of variance (2ME-RT-RMANOVA) was applied. This method involves replacing the original data with their ranks, a technique well suited for multiple comparisons [60]. The model included a random intercept to account for potential variability in baseline responses across participants.
We utilized a similar analytical approach to investigate the derived attributes in {PA, ISOPL, ISOEV, PRSSFas, PRSSBA, PRSSCom, PRSSEC, PRSSES}, namely a non-parametric two-way linear mixed effects repeated measures type III analysis of variance (2ME-RMANOVA). Notably, we refrained from rank transformation in this case, because the residuals exhibited normality as confirmed through Shapiro-Wilk’s test ().
In addition, to assess the potential impact of order effects and group sizes, multiple comparisons were made across all the attributes of soundscape evaluation in {DOMNoi, Nature, DOMHum, New A, PA, OSQ, APPR, PLN, PRSSFas, PRSSBA, PRSSCom, PRSSEC, PRSSES, ISOPL, ISOEV} for each condition, employing the non-parametric two-sample Kolmogorov-Smirnov (KS) test. For the analysis of order effects, the responses were grouped into a sample from all participants who evaluated the GND first followed by the ROOF, and another sample from all participants who evaluated the ROOF first followed by the GND. For the analysis of group sizes, the responses were grouped into a sample from all participants who evaluated the sites by themselves, and another sample from all participants who evaluated the sites with at least one other participant in the same session. To mitigate false discovery rates due to multiple comparisons, -values were adjusted using the Benjamini-Hochberg (BH) method separately for each condition.
All data analyses were conducted with the R programming language (Version 4.3.1; R Core Team [61]) on a 64-bit ARM environment. Specifically, the analyses were performed with the following packages: KS test, BH correction, Shapiro-Wilk Normality Test with stats (Version 4.3.1; R Core Team [61]); 2ME-RMANOVA and 2ME-RT-RMANOVA with lmerTest (Version 3.1.3; Kuznetsova et al. [62]) and car (Version 3.1.2; Fox and Weisberg [63]); Omega effect size with effectsize (Version 0.8.3; Ben-Shachar et al. [64]); and contrast tests with emmeans (Version 1.8.7; Lenth [65]).
3 Results: Site evaluation questionnaire
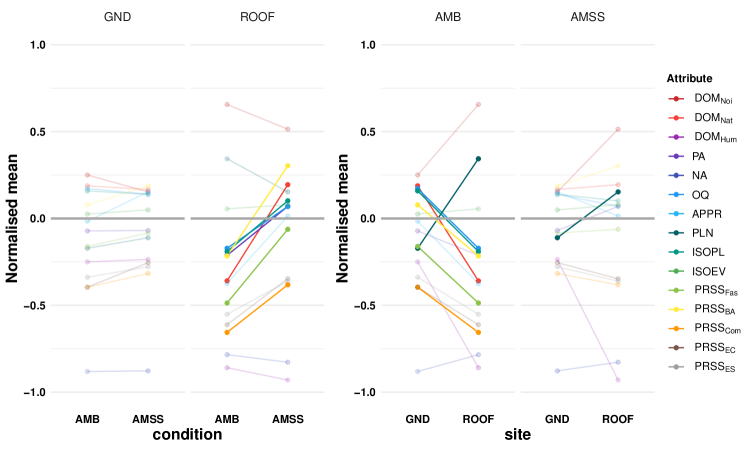
A summary of the mean and standard deviation of quantities derived from the site evaluation questionnaire is shown in Table 5. As mentioned in Section 2.6, all quantities are normalized to the same range for the presentation of results in this section. Furthermore, only significant results of the 2ME-RT-RMANOVA and 2ME-RMANOVA are presented here, but full details of the tests are given in Appendix B, Section Appendix B. For clarity, the scale changes are illustrated in Figure 3, similarly organised by site and condition, where the significant posthoc contrast pairs are accentuated.
| site | condition | |||||||||||
| GND | ROOF | AMB | AMSS | |||||||||
| AMB | AMSS | (%) | AMB | AMSS | (%) | GND | ROOF | (%) | GND | ROOF | (%) | |
| DOMNoi | 0.25 (0.44) | 0.15 (0.50) | -4.86 | 0.66 (0.39) | 0.51 (0.42) | -7.12 | 0.25 (0.44) | 0.66 (0.39) | 20.31 | 0.15 (0.50) | 0.51 (0.42) | 18.06 |
| Nature | 0.19 (0.40) | 0.17 (0.49) | -1.04 | -0.36 (0.50) | 0.19 (0.44) | 27.69 | 0.19 (0.40) | -0.36 (0.50) | -27.34 | 0.17 (0.49) | 0.19 (0.44) | 1.39 |
| DOMHum | -0.25 (0.38) | -0.24 (0.60) | 0.69 | -0.86 (0.34) | -0.93 (0.34) | -3.56 | -0.25 (0.38) | -0.86 (0.34) | -30.47 | -0.24 (0.60) | -0.93 (0.34) | -34.72 |
| PA | -0.07 (0.43) | -0.07 (0.50) | 0.12 | -0.21 (0.38) | 0.07 (0.59) | 14.10 | -0.07 (0.43) | -0.21 (0.38) | -7.03 | -0.07 (0.50) | 0.07 (0.59) | 6.94 |
| New A | -0.88 (0.18) | -0.88 (0.23) | 0.17 | -0.78 (0.30) | -0.83 (0.43) | -2.17 | -0.88 (0.18) | -0.78 (0.30) | 4.84 | -0.88 (0.23) | -0.83 (0.43) | 2.50 |
| OSQ | 0.17 (0.47) | 0.14 (0.39) | -1.65 | -0.17 (0.50) | 0.07 (0.55) | 12.07 | 0.17 (0.47) | -0.17 (0.50) | -17.19 | 0.14 (0.39) | 0.07 (0.55) | -3.47 |
| APPR | -0.02 (0.39) | 0.15 (0.44) | 8.42 | -0.38 (0.49) | 0.01 (0.57) | 19.44 | -0.02 (0.39) | -0.38 (0.49) | -17.97 | 0.15 (0.44) | 0.01 (0.57) | -6.94 |
| PLN | -0.17 (0.35) | -0.11 (0.49) | 3.04 | 0.34 (0.43) | 0.15 (0.55) | -9.55 | -0.17 (0.35) | 0.34 (0.43) | 25.78 | -0.11 (0.49) | 0.15 (0.55) | 13.19 |
| ISOPL | 0.16 (0.32) | 0.14 (0.30) | -1.00 | -0.19 (0.38) | 0.10 (0.45) | 14.62 | 0.16 (0.32) | -0.19 (0.38) | -17.47 | 0.14 (0.30) | 0.10 (0.45) | -1.86 |
| ISOEV | 0.03 (0.23) | 0.05 (0.23) | 1.19 | 0.06 (0.24) | 0.08 (0.26) | 1.18 | 0.03 (0.23) | 0.06 (0.24) | 1.50 | 0.05 (0.23) | 0.08 (0.26) | 1.49 |
| PRSSFas | -0.16 (0.44) | -0.08 (0.39) | 3.91 | -0.49 (0.43) | -0.06 (0.50) | 21.22 | -0.16 (0.44) | -0.49 (0.43) | -16.28 | -0.08 (0.39) | -0.06 (0.50) | 1.04 |
| PRSSBA | 0.08 (0.59) | 0.19 (0.48) | 5.47 | -0.22 (0.50) | 0.30 (0.68) | 25.97 | 0.08 (0.59) | -0.22 (0.50) | -14.71 | 0.19 (0.48) | 0.30 (0.68) | 5.79 |
| PRSSCom | -0.40 (0.35) | -0.32 (0.30) | 3.94 | -0.66 (0.35) | -0.38 (0.41) | 13.72 | -0.40 (0.35) | -0.66 (0.35) | -13.02 | -0.32 (0.30) | -0.38 (0.41) | -3.24 |
| PRSSEC | -0.40 (0.33) | -0.25 (0.29) | 7.06 | -0.61 (0.34) | -0.35 (0.39) | 13.24 | -0.40 (0.33) | -0.61 (0.34) | -10.81 | -0.25 (0.29) | -0.35 (0.39) | -4.63 |
| PRSSES | -0.34 (0.33) | -0.28 (0.32) | 3.04 | -0.55 (0.29) | -0.36 (0.31) | 9.55 | -0.34 (0.33) | -0.55 (0.29) | -10.68 | -0.28 (0.32) | -0.36 (0.31) | -4.17 |
3.1 Contrast by condition between groups at each site
At GND, no significant interaction effects were noted across the perceptual metrics between AMSS and AMB groups (Figure 3, leftmost), aligning with expectations given the absence of AMSS at GND. Consistency in perception among AMSS and AMB groups suggests stability in the GND soundscape and uniform participant perceptions, facilitating comparison at ROOF.
At ROOF, the AMSS induced significant improvements in ISOPL, Nature, OSQ, PA, PRSSFas, PRSSBA, and PRSSCom of the traffic-exposed soundscape (Figure 3, second from left). Notably, a increase in ISOPL marks a key “positive transition” from a “bad” () to a “good” () soundscape, validating the efficacy of AMSS in improving PAQ. The ISOEV, a PAQ measure of a soundscape’s “Eventfulness” [13], was unaffected by the AMSS intervention, as desired.
Though traffic noise dominance decreased insignificantly by , a more-than-proportionate positive transition in natural sound dominance from AMB () to AMSS () was observed at the ROOF. Significant positive transition from AMB () to AMSS () was also observed in OSQ, but increased appropriateness of the soundscape (APPR; ) and decreased perceived loudness (PLN; ) were not significant with the AMSS intervention at ROOF. AMSS significantly increase positive affect (PA; ), but did not significantly decrease negative affect (New A; ).
The restorative potential of the AMSS was evidenced by significant improvements with AMSS at the ROOF in PRSS dimensions of Fascination (), Being-Away () and Compatibility (). Particularly, a positive transition was observed in PRSSBA from AMB () to AMSS (), which is an indicator of respite provided by the soundscape from daily stressors [40, 41]. However, improvements in Extent sub-dimensions of PRSSEC () and PRSSES () were not significant.
3.2 Contrast by sites within group under each condition
Under the AMB condition, which is indicative of the difference between the sites before intervention, significant changes were noted in ISOPL, Nature, OSQ, PLN, PRSSFas, PRSSBA, and PRSSCom (Figure 3, second from right). The PAQ in terms of ISOPL was rated a significant lower at the ROOF () than at the GND (), whereas ISOEV was equally neutral between the GND () and pre-intervention ROOF () sites.
As expected but not significant, traffic noise dominance was higher at the traffic-exposed ROOF () than at the GND (). Additionally, human sounds were more dominant at GND () than at the almost non-existent levels at the ROOF (). On the other hand, natural sounds were scarce () and a significant lower at ROOF than GND ().
Before intervention, the OSQ was poor at the ROOF () and a significant lower than the OSQ of the GND (). Similarly but not significantly, ROOF was rated less appropriate than the GND. Interestingly, no significant changes in positive (PA) or negative affect (New A) scores were observed between GND and ROOF before intervention.
Regarding restorative indicators, significant differences were noted in dimensions such as PRSSFas, PRSSBA, and PRSSCom, indicating poorer restorativeness at the ROOF compared to GND. Notably, the restorativeness of GND was only slightly conducive in terms of PRSSBA ().
Under the AMSS condition, no significant changes were found between GND and ROOF sites, except for PLN (Figure 3, rightmost). This suggests that the AMSS effectively improved the ISOPL, Nature, OSQ, PRSSFas, PRSSBA, and PRSSCom scores of the ROOF similar to those at the traffic-shielded GND. Although perceived loudness increased (), it was to a lesser extent than without AMSS intervention ().
3.3 Correlation between subjective metrics
Based on the Holm-adjusted Kendall correlation, listed in Table 6, ISOPL was found to be significantly positively correlated with Nature (), OSQ (), APPR (), and with the restorative metrics of PRSSFas (), PRSSBA (), PRSSCom (), and PRSSEC (). In contrast, ISOPL was negatively correlated with DOMNoi (), New A (), and PLN (), but was not significantly associated with DOMHum, PA, ISOEV, and PRSSES.
| DOMNoi | DOMHum | Nature | PA | New A | OSQ | APPR | PLN | ISOPL | ISOEV | PRSSFas | PRSSBA | PRSSCom | PRSSEC | PRSSES | |
| DOMNoi | -.22 | -.03 | -.06 | .06 | **-.35 | *-.30 | ***.44 | *-.30 | .08 | -.12 | -.23 | -.24 | -.22 | -.07 | |
| DOMHum | *-.22 | .27 | .04 | -.03 | .08 | .12 | -.14 | .09 | .01 | .12 | .07 | .07 | .10 | .17 | |
| Nature | -.03 | **.27 | .18 | -.11 | *.29 | .23 | -.13 | *.29 | .02 | ..28 | .24 | .25 | *.30 | *.29 | |
| PA | -.06 | .04 | *.18 | -.11 | *.29 | .23 | -.02 | .23 | .01 | **.35 | ***.39 | **.34 | ***.37 | **.35 | |
| New A | .06 | -.03 | -.11 | -.11 | -.22 | -.20 | .16 | *-.29 | .04 | -.07 | -.10 | -.21 | -.14 | -.00 | |
| OSQ | ***-.35 | .08 | ***.29 | ***.29 | **-.22 | ***.56 | ***-.47 | ***.62 | -.13 | **.34 | ***.49 | ***.54 | ***.52 | ..27 | |
| APPR | ***-.30 | .12 | **.23 | **.23 | *-.20 | ***.56 | ***-.41 | ***.50 | -.03 | **.35 | ***.43 | ***.48 | ***.47 | ..28 | |
| PLN | ***.44 | .-.14 | -.13 | -.02 | ..16 | ***-.47 | ***-.41 | ***-.39 | .10 | -.16 | -.25 | **-.35 | *-.31 | -.17 | |
| ISOPL | ***-.30 | .09 | ***.29 | **.23 | ***-.29 | ***.62 | ***.50 | ***-.39 | -.03 | **.34 | ***.50 | ***.52 | ***.46 | .25 | |
| ISOEV | .08 | .01 | .02 | .01 | .04 | -.13 | -.03 | .10 | -.03 | -.02 | -.08 | -.08 | -.06 | .03 | |
| PRSSFas | -.12 | .12 | ***.28 | ***.35 | -.07 | ***.34 | ***.35 | .-.16 | ***.34 | -.02 | ***.61 | ***.57 | ***.55 | ***.65 | |
| PRSSBA | **-.23 | .07 | **.24 | ***.39 | -.10 | ***.49 | ***.43 | **-.25 | ***.50 | -.08 | ***.61 | ***.69 | ***.64 | ***.51 | |
| PRSSCom | **-.24 | .07 | **.25 | ***.34 | *-.21 | ***.54 | ***.48 | ***-.35 | ***.52 | -.08 | ***.57 | ***.69 | ***.65 | ***.50 | |
| PRSSEC | **-.22 | .10 | ***.30 | ***.37 | -.14 | ***.52 | ***.47 | ***-.31 | ***.46 | -.06 | ***.55 | ***.64 | ***.65 | ***.52 | |
| PRSSES | -.07 | ..17 | ***.29 | ***.35 | -.00 | **.27 | **.28 | *-.17 | **.25 | .03 | ***.65 | ***.51 | ***.50 | ***.52 |
3.4 Effect of order, group size and initial conditions
The KS tests with BH adjustments across each condition (AMSS and AMB) demonstrated that none of the attributes from the site evaluation questionnaire were influenced by the order in which the participants assessed the sites (GNDROOF or ROOFGND), as well as the number of participants in each session ( or ). In other words, the results of this study were not subject to potentially confounding order effects and the possibility of participants affecting each others’ responses to the soundscapes experienced. Full details of the results can be found in Appendix B, Table B.2.
Posthoc contrast tests on PA between AMSS and AMB groups at the meeting point and the absence of interaction effects on New A revealed no significant differences between the AMSS and AMB groups in terms of positive and negative affect states before the commencement of the experiment.
4 Results: Objective binaural measurements
At the ROOF, the mean 10- was for the AMSS group and for the AMB group, as shown in Table 7. Since AMSS was active for the AMSS group, it caused a slight but imperceptible increase (about ) in mean SPL over the study duration at the ROOF. This suggests that on average, AMSS selected masker gains that were well below the ambient SPLs. For instance, if AMSS reproduced maskers at the same SPL as the ambient acoustics, it would result in a increase. This difference is further reduced to less than when one of the AMSS sessions affected by aircraft noise was omitted from the computed mean.
At the GND, in contrast, the mean 10- was for the AMSS group and for the AMB group. The relatively higher mean SPL and standard deviation of SPL at the GFP for the AMSS group was due to aircraft flybys occurring in three of sessions at the GND and one at ROOF, which when omitted from the computation of the mean, would have given an of at the GND and at the ROOF instead. Hence, the difference in between the GND and ROOF was about in both AMB and AMSS groups. A similar trend was observed in the C-weighted equivalent sound pressure level, and in , where the differences between the sites were about 3 to and about 5 to 6 soneGF, respectively.
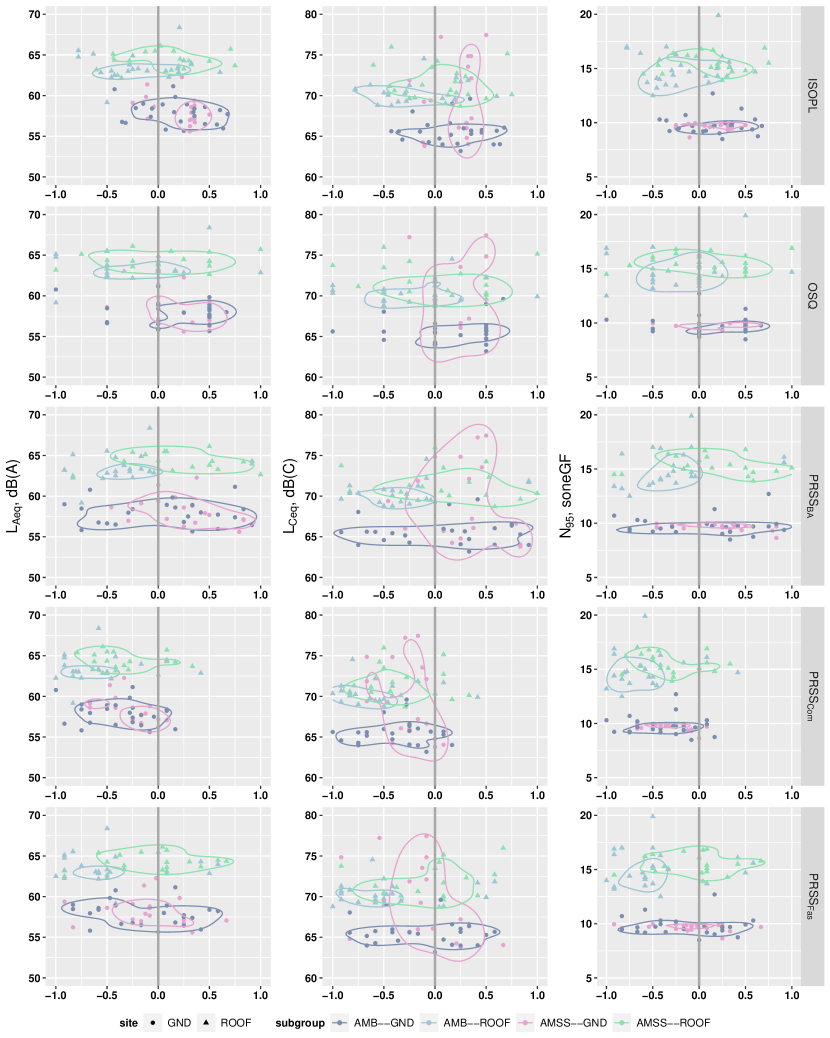
To examine the relationship between objective (psycho)acoustic parameters, and soundscape and restorative indicators, a correlation and distribution analysis was conducted between objective parameters (, , ), and soundscape (ISOPL, OSQ) and restorative (PRSSFas, PRSSBA, PRSSCom) indices that show statistical difference between AMB–ROOF and AMB–GND in Section 3. The Holm-adjusted Kendall correlation revealed no significant relationships between the (psycho)acoustic parameters and all the soundscape and restorative indices (Table B.3).
The disassociation between objective and perceptual indicators is further illustrated in the median contour plots of the mean perceptual score for each session as a function of each (psycho)acoustic parameter, organised into the condition–site pairs in Figure 4. Notably, distinct positive shift in median contours across all perceptual indicators was achieved with the introduction of AMSS at the ROOF despite a similar levels of , , or in the AMB–ROOF subgroup. Moreover, AMSS–ROOF exhibited similar ISOPL, PRSSFas, PRSSBA, and PRSSCom distributions as both GND subgroups. Although the OSQ contours in AMSS–ROOF largely overlapped with AMB–ROOF across all objective indices, there is a notable positive shift in the population distribution, as shown in Section 3.1. It is worth noting that the distribution was greatly skewed by the dominant low-frequency content of aircraft flyby sounds in the AMSS–GND sessions, which was not reflected in the and .
| Ambient | AMSS | AMSS (without aircraft flyby) | ||||
| GND, N = 24 | ROOF, N = 24 | GND, N = 20 | ROOF, N = 20 | GND, N = 17 | ROOF, N = 19 | |
| 57.91 (1.46) | 63.96 (2.95) | 61.04 (7.17) | 64.97 (3.38) | 58.26 (1.77) | 64.25 (1.07) | |
| 65.60 (1.55) | 70.81 (2.54) | 70.89 (6.42) | 72.30 (3.27) | 68.93 (4.39) | 71.71 (2.01) | |
| 9.80 (0.87) | 15.03 (1.64) | 9.67 (0.31) | 15.44 (0.87) | 9.66 (0.34) | 15.47 (0.88) | |
| ISOPL | 0.17 (0.32) | (0.37) | 0.17 (0.23) | 0.09 (0.38) | 0.20 (0.23) | 0.08 (0.38) |
| OSQ | 0.17 (0.29) | 0.03 (0.52) | 0.14 (0.43) | (0.47) | 0.21 (0.28) | 0.00 (0.52) |
| PRSSFas | (0.38) | (0.44) | (0.44) | (0.44) | (0.40) | (0.45) |
| PRSSBA | 0.21 (0.38) | 0.32 (0.63) | 0.10 (0.60) | (0.52) | 0.25 (0.37) | 0.30 (0.64) |
| PRSSCom | (0.24) | (0.36) | (0.32) | (0.37) | (0.24) | (0.37) |
5 Discussion
For clarity, the research questions put forward in Section 1.4 are discussed sequentially in Section 5.1, Section 5.2, and Section 5.3, respectively. The discussion culminates with the limitations of this study and suggestions for future research in Section 5.4.
5.1 Assessing perceptual changes brought about by AMSS at the traffic-expose site
The lack of studies focusing on ISOPL as a design goal, especially in the context of augmenting soundscape affected by traffic noise, highlights the novelty of our investigation. However, the findings could be placed in the context of a previous virtual reality-based lab study set in a comparable scenario – an outdoor recreational space subjected to traffic noise without direct visibility of the traffic source (i.e., location P2 in [19]). In that study, the scale increase in raw pleasantness at P2 in [19] ranged from to across four types of bird sounds, and from to across four types of water sounds, with each masker augmented lower than the ambient traffic noise levels at . With a higher increase in raw pleasantness of observed in this in-situ study (AMSS–ROOF: ; AMB–ROOF: ), it is reasonable to conclude that the maskers selected by the AMSS indeed prioritize maximizing ISOPL, where pleasantness is a significant component.
5.2 Perceptual implications of ISOPL as a soundscape intervention design goal
While the primary focus of AMSS optimization was ISOPL enhancement, significant improvements were evident across various soundscape quality and restorative indicators. Notably, the consistent use of birdsongs as maskers led to a significant increase in natural sound dominance (see Table 2), correlating with a reduction by in DOMHum and in DOMNoi, as explained by the informational masking theory [66, 29].
With the modification of dominant sound source types, AMSS effectively enhanced the overall soundscape quality (OSQ) at the traffic-exposed ROOF, surpassing the mean scale increase reported by [31] for their manual augmentation approach. While caution is warranted in directly comparing methodologies due to differing environments, the AMSS’s autonomous operation suggests a possible advantage over participant-led methods. Notably, the OSQ contrast in the AMB condition between GND and ROOF, as described in Section 3.2, highlights the substantial impact of traffic noise at the traffic-exposed ROOF. Additionally, the absence of significant differences between GND and ROOF within the AMSS group suggests that AMSS could align the perception of OSQ at a traffic-exposed site with that of the traffic-shielded environment.
The significant positive transition in positive affect (PA) induced by the AMSS suggests the potential for harnessing the health benefits of natural sounds [14], which is made more accessible through its perception-driven autonomous operation. It is important to note that non-optimized augmentation of natural sounds in urban environments could lead to undesirable effects on mood and affect [67, 68].
On the contrary, the lack of significant changes in ISOEV suggests that AMSS did not alter the perceived “Eventfulness” of the soundscape. This was likely due to the AMSS’s design goal, which focused solely on maximizing ISOPL without affecting ISOEV. Additionally, according to the circumplex model of soundscape perception in ISO/TS 12913-2:2018, ISOPL and ISOEV are theoretically orthogonal axes, as observed by [69]. Thus, the absence of significant differences in ISOEV serves as a validation of the circumplex model and underscores the efficacy of the AMSS, which did not inadvertently impact ISOEV.
The AMSS intervention demonstrated its restorative potential through a significant increase in the Fascination, Being-Away, and Compatibility PRSS dimensions. Particularly noteworthy was the increase in PRSSFas, indicating the maskers’ ability to captivate attention involuntarily [41], reinforcing the restorative effect of AMSS’s informational masking mechanism [70]. Moreover, the significant shift of Being-Away (PRSSBA) from negative to positive suggests AMSS effectively transformed the traffic-exposed ROOF soundscape from one associated with daily stressors to a source of respite [41, 40].
Nevertheless, while the rise in Compatibility (PRSSCom) due to AMSS was significant, its negative score fell short of expectations afforded by natural soundscapes such as waterfronts or vast green spaces [70]. The restorative limits of AMSS were also evident in both Extent-Coherence and Extent-Scope sub-dimensions. Despite a significant increase in natural sound dominance, perceived coherency (PRSSEC) and expansiveness (PRSSES) of the environment were unaffected, suggesting other factors, like visual impressions, may require adjustment. Notably, low PRSSEC and PRSSES scores are characteristic of urban environments [70], consistent with observations in the GND. With significant correlations between ISOPL and all PRSS dimensions except PRSSES (Extended Data Table 6), the positive link suggests the potential for the AMSS to enhance PRSS alongside ISOPL, minimizing the need for separate models.
5.3 Impact of AMSS through (psycho)acoustic metrics and their relation with perceptual factors
The disconnection between (psycho)acoustic parameters and restorative indicators (i.e. PRSSFas, PRSSBA) contrasts with [70], where correlated negatively with both PRSSFas and PRSSBA, albeit with a brief stimuli exposure time in [70]. This highlights the challenge of using objective metrics to assess the restorative impact of augmenting “wanted” sounds in noisy environments.
Considering the GND had a mean about lower than ROOF (Section 4), this suggests that AMSS augmentation could be akin to a perceived noise reduction in terms of ISOPL. However, unlike previous lab experiments [71], there was no change in PLN with AMSS, affirming that (psycho)acoustic parameters alone are unable to fully capture soundscape perception changes.
Limitations of objective parameters in predicting subjective responses to soundscape augmentation were highlighted in an indoor experiment [25], where perceived annoyance was more accurately predicted by and ISOPL than by objective parameters alone. Similarly, while accurately predicted perceived traffic noise loudness indoors [25], this did not hold true in this outdoor study, highlighting the need for caution in direct comparisons due to limited data (sites and conditions).
5.4 Limitations and opportunities
The AI model in the AMSS used only acoustic data to determine the optimal masker-gain combinations [44]. However, factors such as participant demographics and visual environment could influence perception [72, 73]. Future AMSS versions could explore multimodal models, incorporating participant-linked information and real-time visual data for broader applicability in different contexts [74, 46]. Since ISOEV is orthogonal to ISOPL, future models could optimize changes in ISOEV or a combination of both.
Drawing from an extensive survey and catalog of global soundscape interventions [75, 76], the AMSS stands out as the only AI-based intervention specifically engineered to autonomously elevate ISOPL levels. Notably, among AI models trained on comprehensive datasets adhering to ISO 12913 standards [77, 43, 78], the AMSS hosts the sole built-in prediction model capable of probabilistic modeling of ISOPL. The cloud-based framework behind AMSS could potentially streamline soundscape interventions and monitoring on a large scale. It holds the key to cost-effective, large-scale perceptual mapping compared to traditional methods reliant on human responses [79, 80]. This advancement could address challenges in widespread ISO 12913 standards adoption, particularly in predicting the socioeconomic impact of soundscapes [81, 80].
6 Conclusion
In conclusion, we described the implementation and validation of an AI-based soundscape augmentation system (the AMSS) deployed at a pavilion at which road traffic was the dominant noise source in the acoustic environment. Although the AMSS was designed only to select maskers for playback that maximized the ISOPL of the deployment location, we found corresponding improvements in the rated overall quality, perceived restorativeness, appropriateness, and positive affect by the participants in the validation study. The ISOPL of the deployment location was also found to have increased to a level similar to that of a different pavilion where road traffic was significantly less dominant, and where the objectively-measured SPL was signficantly lower. This was despite the fact that the AMSS caused a slight increase in objectively-measured SPL at the deployment location due to the playback of maskers via a four-speaker system.
In addition, the AMSS requires no human input to run, thereby allowing for reductions in time and labor required to pick suitable maskers for augmentation as compared to traditional approaches involving expert guidance or post hoc analysis of study results. The physical hardware of the AMSS was also installed after the pavilions had been built, with minimal alterations to the surrounding environment and infrastructure. Therefore, there is great potential to further develop the AMSS and its corresponding soundscape augmentation approach for sustainable management of noise pollution, especially in built-up areas where physical modifications to the surroundings to manage noise may be impractical or unfeasible.
Declaration of competing interest
The authors declare that they have no known competing financial interests or personal relationships that could have appeared to influence the work reported in this paper.
Acknowledgements
This research is supported by the Singapore Ministry of National Development and the National Research Foundation, Prime Minister’s Office under the Cities of Tomorrow Research Programme (Award No. COT-V4-2020-1). Any opinions, findings and conclusions or recommendations expressed in this material are those of the authors and do not reflect the view of National Research Foundation, Singapore, and Ministry of National Development, Singapore. We would also like to thank the People’s Association for their support in the participant recruitment process, and the Pasir Ris-Punggol Town Council for their assistance in the deployment of our system.
Part of this work was done while K. N. Watcharasupat was supported by the AAUW International Fellowship from the American Association of University Women (AAUW), and separately by the IEEE Signal Processing Society Scholarship.
Data Availability
The data that support the findings of this study are openly available in NTU research data repository DR-NTU (Data) at https://doi.org/10.21979/N9/NEH5TR. The replication code used in this study is available on GitHub at the following repository: https://doi.org/10.5281/zenodo.11141691. The code includes all the necessary scripts, functions, and instructions to reproduce the results reported in the study.
Appendix A Questionnaires
Table A.1
Site evaluation questionnaire for the assessment of the soundscapes at the two study sites GND and ROOF. Participants completed this questionnaire after a listening period at each site.
| Question Category | Instructions/Question | Specific Items | Rating Scale/Format |
|---|---|---|---|
| International Positive and Negative Affect Schedule Short Form (I-PANAS-SF) | Indicate to what extent you feel this way in this moment. | Active | Very slightly or not at all–Extremely (5-point categorical) |
| Attentive | |||
| Alert | |||
| Determined | |||
| Inspired | |||
| Hostile | |||
| Ashamed | |||
| Upset | |||
| Afraid | |||
| Nervous | |||
| Perceived Sound Source Dominance (DOM) | To what extent do you presently hear the following types of sounds? | Noise (e.g., traffic, construction, industry) | Not at all–Dominates completely (5-point categorical scale) |
| Sounds from human beings (e.g., conversation, laughter, children at play, footsteps) | |||
| Natural sounds (e.g., singing birds, flowing water, wind in vegetation) | |||
| Perceived Affective Quality (PAQ) | For each of the 8 scales below, to what extent do you agree or disagree that the surrounding sound environment you heard is | Eventful | Strongly disagree–Strongly agree (5-point Categorical scale) |
| Vibrant | |||
| Pleasant | |||
| Calm | |||
| Uneventful | |||
| Monotonous | |||
| Annoying | |||
| Chaotic | |||
| Overall Soundscape Quality (OSQ) | Overall, how would you describe the present surrounding sound environment? | Very good–Very bad (5-point Categorical scale) | |
| Appropriateness (APPR) | Overall, to what extent is the present surrounding sound environment appropriate to the present place? | Not at all–Perfectly (5-point Categorical scale) | |
| Perceived Loudness (PLN) | How loud would you say the sound environment is? | Not at all–Extremely (5-point Categorical scale) | |
| Perceived Restorativeness Soundscape Scale (PRSS) – Fascination (PRSSFas) | How much do you agree with the following statements? | My curiosity is awoken by these sounds | Not at all–Completely (7-point categorical scale) |
| There are plenty of sounds for me to discover | |||
| These sounds, I find fascinating | |||
| My interest is really held by following what is going on with these sounds | |||
| PRSS – Being-away (PRSSBA) | How much do you agree with the following statements? | I get a break from my day-to-day routine from spending time with these sounds | Not at all–Completely (7-point categorical scale) |
| I find that I don’t have to concentrate much when I’m surrounded by these sounds | |||
| The sounds give me a chance to step back from things that demand my focus | |||
| I feel free from work and/or responsibilities when I am with these sounds | |||
| These sounds are a refuge for me from unwanted distractions | |||
| PRSS – Compatibility (PRSSCom) | How much do you agree with the following statements? | I rapidly adapt to these sounds | Not at all–Completely (7-point categorical scale) |
| While I am with these sounds, it is easy to do what I want | |||
| The sounds fit well with my preferences | |||
| PRSS – Extent-Coherence (PRSSEC) | How much do you agree with the following statements? | The existing sounds belong to this soundscape | Not at all–Completely (7-point categorical scale) |
| The sounds blend together to create a harmonious soundscape | |||
| The sounds in this environment are well-organized, which makes it easy for me to hear the relationships between them | |||
| PRSS – Extent-Scope (PRSSES) | How much do you agree with the following statements? | There are lots of different sounds to explore in this place | Not at all–Completely (7-point categorical scale) |
| The sounds make it feel like this place is vast | |||
| These sounds have the quality to create a world of their own | |||
| PRSS Dimensions | PRSS Items (specific framing in Payne and Guastavino [41]) | PRSS Items (this study) | Remarks |
| Fascination | My curiosity is awoken by these sounds | - | |
| There are plenty of sounds for me to discover | - | ||
| These sounds, I find fascinating | - | ||
| My interest is really held by following what is going on with these sounds | - | ||
| Being-Away | I get a break from my day-to-day routine from spending time with these sounds | - | |
| My concentration is demanded by these sounds | I find that I don’t have to concentrate much when I’m surrounded by these sounds | rephrased | |
| From these sounds, I experience few attentional demands | The sounds give me a chance to step back from things that demand my focus | rephrased | |
| I feel free from work and/or responsibilities when I am with these sounds | - | ||
| I need to think of my obligations when I am with these sounds | - | removed | |
| These sounds are a refuge for me from unwanted distractions | |||
| Compatibility | There is an accordance between these sounds and what I like to do | - | removed |
| I rapidly adapt to these sounds | - | ||
| While I am with these sounds, it is easy to do what I want | - | ||
| My personal inclinations fits with being with these sounds | The sounds fit well with my preferences | rephrased | |
| Extent (Coherence) | The existing sounds belong to this soundscape | - | |
| The sounds fit together to form a coherent soundscape | The sounds blend together to create a harmonious soundscape | rephrased | |
| These sounds are coherent | The sounds in this environment are well-organized, which makes it easy for me to hear the relationships between them | combined | |
| The sounds are clearly organized | |||
| The physical arrangement of these sounds has a clear order | |||
| Extent (Scope) | There are plenty of sounds to allow exploration in many directions | There are lots of different sounds to explore in this place | rephrased |
| The extent of these sounds seems limitless | The sounds make it feel like this place is vast | combined | |
| These sounds feel very spacious | |||
| These sounds have the quality of being a whole world to themselves | These sounds have the quality to create a world of their own | rephrased | |
Table A.4
Participant information questionnaire administered prior to the end of each session. Participants completed this questionnaire after the soundscape evaluations had been completed at both study sites RTGP and GFP.
| Question Category | Instructions/Questions | Specific Items | Rating Scale/Format |
|---|---|---|---|
| Gender | What is your gender? | Male/Female/Non-conforming/Prefer not to say | |
| Age | What is your age? | Integer in [21,70] | |
| Occupation | What is your occupational status? | Employed/Unemployed/Retired/Student/Rather not say/Other | |
| Individual Noise Sensitivity (INS) | Select the option that best represents your level of agreement with the statement. | I wouldn’t mind living on a noisy street if the apartment I had was nice. | Strongly disagree–Strongly agree (5-point categorical scale) |
| I am more aware of noise than I used to be. | |||
| No one should mind much if someone turns up his stereo full blast once in a while. | |||
| At movies, whispering and crinkling candy wrappers disturb me. | |||
| I am easily awakened by noise. | |||
| If it’s noisy where I’m studying, I try to close the door or window or move someplace else. | |||
| I get annoyed when my neighbors are noisy. | |||
| I get used to most noises without much difficulty. | |||
| How much would it matter to you if an apartment you were interested in renting was located across from a fire station? | |||
| Sometimes noises get on my nerves and get me irritated. | Strongly disagree–Strongly agree (5-point categorical scale) | ||
| Even music I normally like will bother me if I’m trying to concentrate. | |||
| It wouldn’t bother me to hear the sounds of everyday living from neighbors (footsteps, running water, etc). | |||
| When I want to be alone, it disturbs me to hear outside noises. | |||
| I’m good at concentrating no matter what is going on around me. | |||
| In a library, I don’t mind if people carry on a conversation if they do it quietly. | |||
| There are often times when I want complete silence. | |||
| Motorcycles ought to be required to have bigger mufflers. | |||
| I find it hard to relax in a place that’s noisy. | |||
| I get mad at people who make noise that keeps me from falling asleep or getting work done. | |||
| I wouldn’t mind living in an apartment with thin walls. | |||
| I am sensitive to noise. | |||
| Baseline Noise Annoyance (BNA) | In general, how much does noise from bother, disturb, or annoy you? | Aircraft (military or civilian) | Not at all–Extremely (5-point Categorical scale) |
| Road traffic | |||
| MRT (trains) | |||
| Children | |||
| Other people | |||
| Animals | |||
| Construction worksites | |||
| Construction (renovations) | |||
| Any other noises | |||
| Perceived Stress Scale (PSS) | In the last month, how often have you… | been upset because of something that happened unexpectedly? | Never–Very often (5-point categorical scale) |
| felt that you were unable to control the important things in your life? | |||
| felt nervous and “stressed”? | |||
| felt confident about your ability to handle your personal problems? | |||
| felt that things were going your way? | |||
| found that you could not cope with all the things that you had to do? | |||
| been able to control irritations in your life? | |||
| felt that you were on top of things? | |||
| been angered because of things that were outside of your control? | |||
| felt difficulties were piling up so high that you could not overcome them? | |||
| WHO-Five Well-Being Index (WHO-5) | For each of these statements, which is the closest to how you have been feeling over the last two weeks? | I have felt cheerful and in good spirits. | At no time–All of the time (6-point Categorical scale) |
| I have felt calm and relaxed. | |||
| I have felt active and vigorous. | |||
| I woke up feeling fresh and rested. | |||
| My daily life has been filled with things that interest me. | |||
Appendix B Statistical results
| DOMNoi | Nature | DOMHum | OSQ | APPR | PLN | ISOPL | ISOEV | PA | New A | PRSSFas | PRSSBA | PRSSCom | PRSSEC | PRSSES | |
| Order | |||||||||||||||
| AMB | 1.00 | 1.00 | 1.00 | 1.00 | 1.00 | 1.00 | 1.00 | 1.00 | 1.00 | 1.00 | 1.00 | 1.00 | 1.00 | 1.00 | 1.00 |
| AMSS | 0.95 | 0.83 | 0.83 | 0.83 | 0.83 | 0.83 | 0.83 | 0.83 | 0.83 | 0.83 | 0.83 | 0.83 | 0.83 | 0.83 | 0.83 |
| Group Size | |||||||||||||||
| AMB | 0.98 | 0.98 | 0.98 | 0.98 | 0.96 | 0.96 | 0.98 | 0.96 | 0.98 | 0.96 | 0.98 | 0.96 | 0.96 | 0.98 | 0.96 |
| AMSS | 0.75 | 0.75 | 0.94 | 0.75 | 0.75 | 0.94 | 0.75 | 0.94 | 0.75 | 0.94 | 0.80 | 0.80 | 0.75 | 0.75 | 0.80 |
| Summary of statistical tests for attributes in soundscape evaluation questionnaire (sound source dominance, overall quality, appropriateness, loudness, ISOPL, ISOEV, and PRSS dimensions) across site (GND and ROOF), condition (AMSS and AMB), and their interaction (site:condition). Test abbreviations and symbols for significance levels and effect sizes are defined in the footnote. | |||
| Term | Test1 | value2 | Effect Size3 |
| \endfirsthead Continued from the previous page… | |||
| Term | Test1 | value2 | Effect Size3 |
| \endhead Continues to the next page… | |||
| \endfoot\endlastfoot Sound source dominance – Noise (DOMNoi) | |||
| site | 2ME-RT-RMANOVA | ****0.0000 | (L)0.3182 |
| condition | 2ME-RT-RMANOVA | 0.1571 | (S)0.0145 |
| site:condition | 2ME-RT-RMANOVA | 0.5667 | 0.0000 |
| Sound source dominance – Natural sounds (Nature) | |||
| site | 2ME-RT-RMANOVA | ***0.0004 | (L)0.1464 |
| condition | 2ME-RT-RMANOVA | **0.0015 | (M)0.1175 |
| site:condition | 2ME-RT-RMANOVA | ***0.0003 | (L)0.1492 |
| AMB–AMSS | GND | Simple Contrasts for Condition | 0.9513 | (S)0.0149 |
| AMB–AMSS | ROOF | Simple Contrasts for Condition | ****0.0000 | (L)-1.1574 |
| GND–ROOF | AMB | Simple Contrasts for Site | ****0.0000 | (L)1.1661 |
| GND–ROOF | AMSS | Simple Contrasts for Site | 0.9783 | -0.0061 |
| Sound source dominance – Human sounds (DOMHum) | |||
| site | 2ME-RT-RMANOVA | ****0.0000 | (L)0.5180 |
| condition | 2ME-RT-RMANOVA | 0.1039 | (S)0.0121 |
| site:condition | 2ME-RT-RMANOVA | 0.8785 | 0.0000 |
| Positive Affect (PA) | |||
| Residuals | Shapiro-Wilk normality test | 0.1731 | - |
| site | 2ME-RMANOVA | 0.6753 | 0.0000 |
| condition | 2ME-RMANOVA | 0.1620 | (S)0.0138 |
| site:condition | 2ME-RMANOVA | *0.0211 | (S)0.0403 |
| AMB–AMSS | GND | Simple Contrasts for Condition | 0.9835 | -0.0050 |
| AMB–AMSS | MP | Simple Contrasts for Condition | 0.2242 | (L)-0.2963 |
| AMB–AMSS | ROOF | Simple Contrasts for Condition | *0.0179 | (L)-0.5839 |
| GND–MP| AMB | Simple Contrasts for Site | 0.8971 | (S)0.0669 |
| GND–ROOF | AMB | Simple Contrasts for Site | 0.1369 | (L)0.2912 |
| MP–ROOF | AMB | Simple Contrasts for Site | 0.2999 | (L)0.2242 |
| GND–MP| AMSS | Simple Contrasts for Site | 0.2625 | (L)-0.2243 |
| GND–ROOF | AMSS | Simple Contrasts for Site | 0.1133 | (L)-0.2876 |
| MP–ROOF | AMSS | Simple Contrasts for Site | 0.8977 | (S)-0.0633 |
| Negative Affect (New A) | |||
| Residuals | Shapiro-Wilk normality test | ****0.0000 | - |
| site | 2ME-RT-RMANOVA | 0.3525 | 0.0006 |
| condition | 2ME-RT-RMANOVA | *0.0253 | (S)0.0550 |
| site:condition | 2ME-RT-RMANOVA | 0.1665 | (S)0.0114 |
| Overall soundscape quality (OSQ) | |||
| site | 2ME-RT-RMANOVA | **0.0041 | (M)0.0965 |
| condition | 2ME-RT-RMANOVA | 0.2204 | 0.0073 |
| site:condition | 2ME-RT-RMANOVA | *0.0271 | (S)0.0540 |
| AMB–AMSS | GND | Simple Contrasts for Condition | 0.7087 | (M)0.0910 |
| AMB–AMSS | ROOF | Simple Contrasts for Condition | *0.0221 | (L)-0.5631 |
| GND–ROOF | AMB | Simple Contrasts for Site | ***0.0009 | (L)0.7525 |
| GND–ROOF | AMSS | Simple Contrasts for Site | 0.6297 | (M)0.0984 |
| Appropriateness (APPR) | |||
| site | 2ME-RT-RMANOVA | **0.0024 | (M)0.1074 |
| condition | 2ME-RT-RMANOVA | ***0.0007 | (M)0.1327 |
| site:condition | 2ME-RT-RMANOVA | 0.1591 | (S)0.0142 |
| Perceived loudness (PLN) | |||
| site | 2ME-RT-RMANOVA | ****0.0000 | (L)0.3561 |
| condition | 2ME-RT-RMANOVA | 0.5667 | 0.0000 |
| site:condition | 2ME-RT-RMANOVA | *0.0221 | (S)0.0587 |
| AMB–AMSS | GND | Simple Contrasts for Condition | 0.4189 | (L)-0.1971 |
| AMB–AMSS | ROOF | Simple Contrasts for Condition | .0.0812 | (L)0.4274 |
| GND–ROOF | AMB | Simple Contrasts for Site | ****0.0000 | (L)-1.1600 |
| GND–ROOF | AMSS | Simple Contrasts for Site | **0.0057 | (L)-0.5355 |
| ISO Pleasantness (ISOPL) | |||
| Residuals | Shapiro-Wilk normality test | 0.1229 | - |
| site | 2ME-RMANOVA | **0.0011 | (M)0.1248 |
| condition | 2ME-RMANOVA | *0.0432 | (S)0.0434 |
| site:condition | 2ME-RMANOVA | **0.0082 | (M)0.0808 |
| AMB–AMSS | GND | Simple Contrasts for Condition | 0.8241 | (S)0.0541 |
| AMB–AMSS | ROOF | Simple Contrasts for Condition | **0.0014 | (L)-0.7926 |
| GND–ROOF | AMB | Simple Contrasts for Site | ***0.0001 | (L)0.9473 |
| GND–ROOF | AMSS | Simple Contrasts for Site | 0.6487 | (M)0.1006 |
| ISO Eventfulness (ISOEV) | |||
| Residuals | Shapiro-Wilk normality test | 0.7790 | - |
| site | 2ME-RMANOVA | 0.4576 | 0.0000 |
| condition | 2ME-RMANOVA | 0.5795 | 0.0000 |
| site:condition | 2ME-RMANOVA | 0.9990 | 0.0000 |
| Perceived Restorativeness Soundscape Scale: Fascination (PRSSFas) | |||
| Residuals | Shapiro-Wilk normality test | 0.8728 | - |
| site | 2ME-RMANOVA | *0.0203 | (M)0.0606 |
| condition | 2ME-RMANOVA | **0.0034 | (M)0.1000 |
| site:condition | 2ME-RMANOVA | **0.0083 | (M)0.0806 |
| AMB–AMSS | GND | Simple Contrasts for Condition | 0.4713 | (L)-0.1755 |
| AMB–AMSS | ROOF | Simple Contrasts for Condition | ***0.0001 | (L)-0.9538 |
| GND–ROOF | AMB | Simple Contrasts for Site | **0.0011 | (L)0.7314 |
| GND–ROOF | AMSS | Simple Contrasts for Site | 0.8178 | (M)-0.0468 |
| Perceived Restorativeness Soundscape Scale: Being-Away (PRSSBA) | |||
| Residuals | Shapiro-Wilk normality test | 0.7777 | - |
| site | 2ME-RMANOVA | 0.3081 | 0.0006 |
| condition | 2ME-RMANOVA | **0.0034 | (M)0.1005 |
| site:condition | 2ME-RMANOVA | *0.0193 | (M)0.0618 |
| AMB–AMSS | GND | Simple Contrasts for Condition | 0.4309 | (L)-0.1920 |
| AMB–AMSS | ROOF | Simple Contrasts for Condition | ***0.0003 | (L)-0.9116 |
| GND–ROOF | AMB | Simple Contrasts for Site | *0.0241 | (L)0.5165 |
| GND–ROOF | AMSS | Simple Contrasts for Site | 0.3390 | (L)-0.2031 |
| Perceived Restorativeness Soundscape Scale: Compatibility (PRSSCom) | |||
| Residuals | Shapiro-Wilk normality test | 0.3328 | - |
| site | 2ME-RMANOVA | ***0.0009 | (M)0.1287 |
| condition | 2ME-RMANOVA | *0.0135 | (M)0.0698 |
| site:condition | 2ME-RMANOVA | *0.0456 | (S)0.0422 |
| AMB–AMSS | GND | Simple Contrasts for Condition | 0.3652 | (L)-0.2209 |
| AMB–AMSS | ROOF | Simple Contrasts for Condition | **0.0020 | (L)-0.7697 |
| GND–ROOF | AMB | Simple Contrasts for Site | ***0.0005 | (L)0.7308 |
| GND–ROOF | AMSS | Simple Contrasts for Site | 0.3378 | (L)0.1819 |
| Perceived Restorativeness Soundscape Scale: Extent-Coherence (PRSSEC) | |||
| Residuals | Shapiro-Wilk normality test | 0.9051 | - |
| site | 2ME-RMANOVA | **0.0015 | (M)0.1182 |
| condition | 2ME-RMANOVA | **0.0023 | (M)0.1089 |
| site:condition | 2ME-RMANOVA | 0.2031 | 0.0090 |
| Perceived Restorativeness Soundscape Scale: Extent-Scope (PRSSES) | |||
| Residuals | Shapiro-Wilk normality test | 0.0581 | - |
| site | 2ME-RMANOVA | **0.0010 | (M)0.1254 |
| condition | 2ME-RMANOVA | *0.0410 | (S)0.0446 |
| site:condition | 2ME-RMANOVA | 0.1504 | (S)0.0155 |
1 Two-way linear mixed effects repeated measures Type III ANOVA (2ME-RMANOVA); Two-way linear mixed effects repeated measures Type III Rank-transformed ANOVA (2ME-RT-RMANOVA)
2 ; ; ;
3 Partial Omega squared () for linear mixed effects and Cohen’s for simple contrasts. (L) large effect ; (M) medium effect ; (S) small effect
| ISOPL | OSQ | PA | PLN | PRSSFas | PRSSBA | PRSSCom | ||||
| ISOPL | ***0.64 | 0.31 | **-0.40 | **0.40 | ***0.56 | ***0.61 | -0.22 | -0.10 | -0.18 | |
| OSQ | ***0.64 | 0.32 | ***-0.45 | 0.29 | ***0.49 | ***0.52 | -0.19 | -0.09 | -0.16 | |
| PA | **0.31 | **0.32 | -0.05 | **0.40 | ***0.44 | **0.40 | 0.00 | -0.04 | 0.04 | |
| PLN | ***-0.40 | ***-0.45 | -0.05 | -0.20 | -0.31 | ***-0.44 | 0.29 | 0.25 | 0.28 | |
| PRSSFas | ***0.40 | **0.29 | ***0.40 | -0.20 | ***0.59 | ***0.59 | -0.09 | -0.07 | -0.11 | |
| PRSSBA | ***0.56 | ***0.49 | ***0.44 | **-0.31 | ***0.59 | ***0.71 | -0.05 | 0.01 | -0.05 | |
| PRSSCom | ***0.61 | ***0.52 | ***0.40 | ***-0.44 | ***0.59 | ***0.71 | -0.19 | -0.12 | -0.18 | |
| *-0.22 | .-0.19 | 0.00 | **0.29 | -0.09 | -0.05 | -0.19 | ***0.59 | ***0.68 | ||
| -0.10 | -0.09 | -0.04 | *0.25 | -0.07 | 0.01 | -0.12 | ***0.59 | ***0.47 | ||
| -0.18 | -0.16 | 0.04 | **0.28 | -0.11 | -0.05 | -0.18 | ***0.68 | ***0.47 |
References
- World Health Organization Regional Office for Europe [2018] World Health Organization Regional Office for Europe, Environmental Noise Guidelines for the European Region, The Regional Office for Europe of the World Health Organization, Copenhagen, Denmark, 2018.
- Department of Environment Food and Rural Affairs [2014] Department of Environment Food and Rural Affairs, Noise Pollution: Economic Analysis, 2014. URL: https://www.gov.uk/guidance/noise-pollution-economic-analysis#full-publication-update-history.
- King [2022] E. A. King, Environment: Science and Policy for Sustainable Development 64 (2022) 17–32. doi:10.1080/00139157.2022.2046456, publisher: Routledge.
- Fink [2019] D. Fink, Acoustics Today 15 (2019) 38. doi:10.1121/AT.2019.15.3.38.
- Newbury et al. [2024] J. B. Newbury, J. Heron, J. B. Kirkbride, H. L. Fisher, I. Bakolis, A. Boyd, R. Thomas, S. Zammit, JAMA Network Open 7 (2024) e2412169. URL: https://doi.org/10.1001/jamanetworkopen.2024.12169. doi:10.1001/jamanetworkopen.2024.12169.
- Hahad et al. [2024] O. Hahad, M. Kuntic, S. Al-Kindi, I. Kuntic, D. Gilan, K. Petrowski, A. Daiber, T. Münzel, Journal of Exposure Science & Environmental Epidemiology (2024) 1–8. URL: https://www.nature.com/articles/s41370-024-00642-5. doi:10.1038/s41370-024-00642-5, publisher: Nature Publishing Group.
- Guski et al. [2017] R. Guski, D. Schreckenberg, R. Schuemer, International Journal of Environmental Research and Public Health 14 (2017) 1–39. doi:10.3390/ijerph14121539.
- Kang [2007] J. Kang, Urban Sound Environment, Taylor & Francis, London, UK, 2007.
- Kang [2017] J. Kang, Frontiers of Engineering Management 4 (2017) 184–194. URL: http://engineering.cae.cn/fem/EN/10.15302/J-FEM-2017026. doi:10.15302/J-FEM-2017026.
- Kang et al. [2016] J. Kang, F. Aletta, T. T. Gjestland, L. A. Brown, D. Botteldooren, B. Schulte-Fortkamp, P. Lercher, I. van Kamp, K. Genuit, A. Fiebig, J. L. Bento Coelho, L. Maffei, L. Lavia, Building and Environment 108 (2016) 284–294. URL: http://linkinghub.elsevier.com/retrieve/pii/S0360132316303067. doi:10.1016/j.buildenv.2016.08.011, iSBN: 03601323.
- International Organization for Standardization [2014] International Organization for Standardization, ISO 12913-1:2014 Acoustics — Soundscape — Part 1 : Definition and conceptual framework, International Organization for Standardization, Geneva, Switzerland, 2014.
- International Organization for Standardization [2018] International Organization for Standardization, ISO/TS 12913-2:2018 Acoustics — Soundscape — Part 2: Data collection and reporting requirements, International Organization for Standardization, Geneva, Switzerland, Switzerland, 2018.
- International Organization for Standardization [2019] International Organization for Standardization, ISO/TS 12913-3:2019 - Acoustics — Soundscape - Part 3: Data analysis, International Organization for Standardization, Geneva, Switzerland, 2019.
- Buxton et al. [2021] R. T. Buxton, A. L. Pearson, C. Allou, K. Fristrup, G. Wittemyer, Proceedings of the National Academy of Sciences 118 (2021) e2013097118. URL: https://www.pnas.org/content/118/14/e2013097118. doi:10.1073/pnas.2013097118, publisher: National Academy of Sciences.
- United Nations Environment Programme [2022] United Nations Environment Programme, Frontiers 2022: Noise, Blazes and Mismatches – Emerging Issues of Environmental Concern, Nairobi, Kenya, 2022.
- Fisher et al. [2023] J. C. Fisher, M. Dallimer, K. N. Irvine, S. G. Aizlewood, G. E. Austen, R. D. Fish, P. M. King, Z. G. Davies, Nature Sustainability 6 (2023) 1219–1227. URL: well. doi:10.1038/s41893-023-01151-3, publisher: Springer US.
- Jeon et al. [2010] J. Y. Jeon, P. J. Lee, J. You, J. Kang, The Journal of the Acoustical Society of America 127 (2010) 1357–1366. doi:10.1121/1.3298437, iSBN: 0001-4966.
- Hao et al. [2016] Y. Hao, J. Kang, H. Wörtche, The Journal of the Acoustical Society of America 140 (2016) 978–987. doi:10.1121/1.4960570, publisher: Acoustical Society of America.
- Hong et al. [2020] J. Y. Hong, B. Lam, Z.-T. Ong, K. Ooi, W.-S. Gan, J. Kang, S. Yeong, I. Lee, S.-T. Tan, Sustainable Cities and Society 63 (2020) 102475. doi:10.1016/j.scs.2020.102475, publisher: Elsevier Ltd.
- Hong et al. [2017] J. Y. Hong, B. Lam, Z.-T. Ong, R. Gupta, W.-S. Gan, Proceedings of the 24th International Congress on Sound and Vibration (2017) 1–6.
- Yang and Moon [2019] W. Yang, H. J. Moon, Applied Acoustics 145 (2019) 234–244. doi:10.1016/j.apacoust.2018.10.015, publisher: Elsevier Ltd.
- Jeon et al. [2012] J. Y. Jeon, P. J. Lee, J. You, J. Kang, The Journal of the Acoustical Society of America 131 (2012) 2101–2109. doi:10.1121/1.3681938, iSBN: 1520-8524.
- Rådsten-Ekman et al. [2013] M. Rådsten-Ekman, . Axelsson, M. E. Nilsson, Acta Acustica united with Acustica 99 (2013) 218–225. URL: http://openurl.ingenta.com/content/xref?genre=article&issn=1610-1928&volume=99&issue=2&spage=218. doi:10.3813/AAA.918605.
- You et al. [2010] J. You, P. J. Lee, J. Y. Jeon, Noise Control Engineering Journal 58 (2010) 477. doi:10.3397/1.3484183.
- Lam et al. [2023] B. Lam, K. C. Q. Lim, K. Ooi, Z.-T. Ong, D. Shi, W.-S. Gan, Sustainable Cities and Society (2023) 104763. doi:10.1016/j.scs.2023.104763.
- Cerwén [2016] G. Cerwén, Landscape Research 41 (2016) 481–494. doi:10.1080/01426397.2015.1117062.
- Calarco and Galbrun [2024] F. M. Calarco, L. Galbrun, Applied Acoustics 219 (2024) 109947. URL: https://doi.org/10.1016/j.apacoust.2024.109947. doi:10.1016/j.apacoust.2024.109947, publisher: Elsevier Ltd.
- Nilsson et al. [2010] M. E. Nilsson, J. Alvarsson, M. Rådsten-Ekman, K. Bolin, Noise Control Engineering Journal 58 (2010) 524. URL: http://www.ingentaconnect.com/content/ince/ncej/2010/00000058/00000005/art00007. doi:10.3397/1.3484182.
- Chau et al. [2023] C. K. Chau, T. M. Leung, W. K. Chung, S. K. Tang, Applied Acoustics 213 (2023) 109650. URL: https://doi.org/10.1016/j.apacoust.2023.109650. doi:10.1016/j.apacoust.2023.109650, publisher: Elsevier Ltd.
- Hedblom et al. [2019] M. Hedblom, B. Gunnarsson, M. Schaefer, I. Knez, P. Thorsson, J. N. Lundström, International Journal of Environmental Research and Public Health 16 (2019). URL: https://www.proquest.com/scholarly-journals/sounds-nature-city-no-evidence-bird-song/docview/2329226373/se-2?accountid=12691NS-. doi:10.3390/ijerph16081390, publisher: MDPI AG Place: Basel ISBN: 4618671041.
- Van Renterghem et al. [2020] T. Van Renterghem, K. Vanhecke, K. Filipan, K. Sun, T. De Pessemier, B. De Coensel, W. Joseph, D. Botteldooren, Landscape and Urban Planning 194 (2020) 103705. URL: https://linkinghub.elsevier.com/retrieve/pii/S016920461931093X. doi:10.1016/j.landurbplan.2019.103705, publisher: Elsevier.
- Lam et al. [2021] B. Lam, W.-S. Gan, D. Shi, M. Nishimura, S. Elliott, Building and Environment 200 (2021) 107928. doi:10.1016/j.buildenv.2021.107928.
- Hong et al. [2021] J. Y. Hong, B. Lam, Z.-T. Ong, K. Ooi, W.-S. Gan, J. Kang, S. Yeong, I. Lee, S.-T. Tan, Building and Environment 194 (2021) 107688. URL: https://linkinghub.elsevier.com/retrieve/pii/S0360132321000998. doi:10.1016/j.buildenv.2021.107688, publisher: Pergamon.
- Regazzi et al. [2021] R. Regazzi, B. Cunha, H. V. d. Miranda, J. J. Gómez Acosta, C. R. Hall Barbosa, M. N. Frota, J. V. Souza, C. A. Machado Gomes, Applied Sciences 11 (2021) 7771. URL: https://www.proquest.com/scholarly-journals/development-validation-masking-system-mitigation/docview/2570578969/se-2NS-. doi:http://dx.doi.org/10.3390/app11177771, publisher: MDPI AG Place: Basel.
- Lenne et al. [2020] L. Lenne, P. Chevret, J. Marchand, Applied Acoustics 158 (2020) 107049. doi:10.1016/j.apacoust.2019.107049, publisher: Elsevier Ltd.
- Nordahl [2010] R. Nordahl, Eurasip Journal on Audio, Speech, and Music Processing 2010 (2010). URL: https://www.scopus.com/inward/record.uri?eid=2-s2.0-79251564887&doi=10.1155%2F2010%2F426937&partnerID=40&md5=305958c69a3584a26bc1547ee67c4d1dNS-. doi:10.1155/2010/426937.
- Nordahl et al. [2011] R. Nordahl, L. Turchet, S. Serafin, IEEE Transactions on Visualization and Computer Graphics 17 (2011) 1234–1244. URL: https://www.proquest.com/scholarly-journals/sound-synthesis-evaluation-interactive-footsteps/docview/876217463/se-2?accountid=12691NS-. doi:http://dx.doi.org/10.1109/TVCG.2011.30, publisher: The Institute of Electrical and Electronics Engineers, Inc. (IEEE) Place: New York.
- Turchet and Serafin [2013] L. Turchet, S. Serafin, Appl Acoust 74 (2013) 566–574. URL: https://www.scopus.com/inward/record.uri?eid=2-s2.0-84878053328&doi=10.1016%2Fj.apacoust.2012.10.010&partnerID=40&md5=e871f6f552e7dbc0b5433367b464c048NS-. doi:10.1016/j.apacoust.2012.10.010, publisher: Elsevier Ltd.
- Suhanek et al. [2019] M. Suhanek, S. Grubeša, I. Djurek, A. Petošic, in: Proceedings of the 23rd International Congress on Acoustics, International Commission for Acoustics (ICA), Aachen, Germany, 2019, pp. 884–890. doi:10.18154/RWTH-CONV-239246.
- Payne [2013] S. R. Payne, Applied Acoustics 74 (2013) 255–263. doi:10.1016/j.apacoust.2011.11.005, publisher: Elsevier Ltd.
- Payne and Guastavino [2018] S. R. Payne, C. Guastavino, Frontiers in Psychology 9 (2018) 1–17. doi:10.3389/fpsyg.2018.02224.
- Lionello et al. [2020] M. Lionello, F. Aletta, J. Kang, Applied Acoustics 170 (2020) 107479. URL: https://linkinghub.elsevier.com/retrieve/pii/S0003682X20305831. doi:10.1016/j.apacoust.2020.107479, publisher: Elsevier Ltd.
- Hou et al. [2023] Y. Hou, Q. Ren, H. Zhang, A. Mitchell, F. Aletta, J. Kang, D. Botteldooren, The Journal of the Acoustical Society of America 154 (2023) 3145–3157. doi:10.1121/10.0022408, publisher: Acoustical Society of America.
- Watcharasupat et al. [2022] K. N. Watcharasupat, K. Ooi, B. Lam, T. Wong, Z.-T. Ong, W.-S. Gan, IEEE Signal Processing Letters 29 (2022) 1749–1753. URL: https://ieeexplore.ieee.org/document/9841611/. doi:10.1109/LSP.2022.3194419.
- Ooi et al. [2022] K. Ooi, K. N. Watcharasupat, B. Lam, Z.-T. Ong, W.-S. Gan, in: ICASSP 2022 - 2022 IEEE International Conference on Acoustics, Speech and Signal Processing (ICASSP), IEEE, Singapore, 2022, pp. 8887–8891. doi:10.1109/ICASSP43922.2022.9746897.
- Ooi et al. [2023] K. Ooi, K. N. Watcharasupat, B. Lam, Z.-T. Ong, W.-S. Gan, in: ICASSP 2023 - 2023 IEEE International Conference on Acoustics, Speech and Signal Processing (ICASSP), IEEE, Rhodes Island, Greece, 2023, pp. 1–5. doi:10.1109/ICASSP49357.2023.10094866.
- Moshona et al. [2023] C. Moshona, F. Aletta, X. Chen, A. Fiebig, H. Henze, J. Kang, A. Mitchell, T. Oberman, B. Schulte-Fortkamp, H. Tong, in: Forum Acusticum 2023, 10th Convention of the European Acoustics Association, Turin, Italy. doi:10.61782/fa.2023.0087.
- Ooi et al. [2023] K. Ooi, Z.-T. Ong, K. N. Watcharasupat, B. Lam, J. Y. Hong, W.-S. Gan, IEEE Transactions on Affective Computing (2023) 1–17. doi:10.1109/TAFFC.2023.3247914, arXiv: 2207.01078.
- Wong et al. [2022] T. Wong, K. N. Watcharasupat, B. Lam, K. Ooi, Z.-T. Ong, F. A. Karnapi, W.-S. Gan, in: INTER-NOISE and NOISE-CON Congress and Conference Proceedings, volume 265, Institute of Noise Control Engineering, Glasgow, UK, 2022, pp. 2013–2021. URL: http://arxiv.org/abs/2204.13890. doi:10.3397/IN_2022_0290, arXiv: 2204.13890 Issue: 5 ISSN: 0736-2935.
- Thompson [2007] E. R. Thompson, Journal of Cross-Cultural Psychology 38 (2007) 227–242. URL: https://doi.org/10.1177/0022022106297301. doi:10.1177/0022022106297301, publisher: SAGE Publications Inc.
- Weinstein [1978] N. D. Weinstein, Journal of Applied Psychology 63 (1978) 458–466. URL: /record/1979-09992-001. doi:10.1037/0021-9010.63.4.458.
- International Organization for Standardization [2021] International Organization for Standardization, ISO/TS 15666 Acoustics — Assessment of noise annoyance by means of social and socio-acoustic surveys, International Organization for Standardization, Geneva, Switzerland, 2021.
- Cohen et al. [1983] S. Cohen, T. Kamarck, R. Mermelstein, Journal of Health and Social Behavior 24 (1983) 385. doi:10.2307/2136404.
- World Health Organization Regional Office for Europe [1998] World Health Organization Regional Office for Europe, Wellbeing measures in primary health care/the DepCare Project: report on a WHO meeting, Technical Report WHO/EURO:1998-4234-43993-62027, World Health Organization, Stockholm, Sweden, 1998. URL: https://iris.who.int/handle/10665/349766.
- Ooi et al. [2021] K. Ooi, Y. Xie, B. Lam, W.-S. Gan, MethodsX 8 (2021) 101288. doi:10.1016/j.mex.2021.101288.
- Gao et al. [2023] W. Gao, J. Kang, H. Ma, C. Wang, Building and Environment 245 (2023) 110945. URL: https://www.sciencedirect.com/science/article/pii/S0360132323009721. doi:10.1016/j.buildenv.2023.110945.
- Tarlao et al. [2021] C. Tarlao, J. Steffens, C. Guastavino, Building and Environment 188 (2021) 107490. doi:10.1016/j.buildenv.2020.107490, publisher: Elsevier Ltd.
- International Organization for Standardization [2017] International Organization for Standardization, ISO 532-1:2017 - Acoustics — Method for calculating loudness — Part 1: Zwicker method, volume 7, International Organization for Standardization, Geneva, Switzerland, 2017. Publication Title: ISO 532-1.
- Watson et al. [1988] D. Watson, L. A. Clark, A. Tellegen, Journal of Personality and Social Psychology 54 (1988) 1063–1070. doi:10.1037/0022-3514.54.6.1063.
- Conover and Iman [1981] W. J. Conover, R. L. Iman, The American Statistician 35 (1981) 124. URL: https://www.jstor.org/stable/2683975?origin=crossref. doi:10.2307/2683975.
- R Core Team [2023] R Core Team, R: A Language and Environment for Statistical Computing, 2023. URL: https://www.r-project.org/, place: Vienna, Austria.
- Kuznetsova et al. [2017] A. Kuznetsova, P. B. Brockhoff, R. H. B. Christensen, Journal of Statistical Software 82 (2017). doi:10.18637/jss.v082.i13.
- Fox and Weisberg [2019] J. Fox, S. Weisberg, An {R} Companion to Applied Regression, Sage, Thousand Oaks {CA}, 2019. URL: https://socialsciences.mcmaster.ca/jfox/Books/Companion/.
- Ben-Shachar et al. [2020] M. Ben-Shachar, D. Lüdecke, D. Makowski, Journal of Open Source Software 5 (2020) 2815. doi:10.21105/joss.02815.
- Lenth [2023] R. V. Lenth, emmeans: Estimated Marginal Means, aka Least-Squares Means, 2023. URL: https://cran.r-project.org/package=emmeans.
- Kidd and Colburn [2017] G. Kidd, H. S. Colburn, in: J. C. Middlebrooks, J. Z. Simon, A. N. Popper, R. R. Fay (Eds.), The Auditory System at the Cocktail Party, Springer Cham, Cham, Switzerland, 2017, pp. 75–109. doi:10.1007/978-3-319-51662-2_4.
- Jiang et al. [2021] B. Jiang, W. Xu, W. Ji, G. Kim, M. Pryor, W. C. Sullivan, Journal of Environmental Psychology 77 (2021) 101659. doi:10.1016/j.jenvp.2021.101659, publisher: Academic Press.
- Benfield et al. [2010] J. A. Benfield, P. A. Bell, L. J. Troup, N. C. Soderstrom, Journal of Environmental Psychology 30 (2010) 103–111. doi:10.1016/j.jenvp.2009.10.002, publisher: Elsevier Ltd.
- Axelsson et al. [2010] \. Axelsson, M. E. Nilsson, B. Berglund, The Journal of the Acoustical Society of America 128 (2010) 2836–2846. URL: http://asa.scitation.org/doi/10.1121/1.3493436. doi:10.1121/1.3493436, publisher: Acoustical Society of America (ASA) ISBN: 9781441905604.
- Jeon et al. [2023] J. Y. Jeon, H. I. Jo, K. Lee, Sustainable Cities and Society 99 (2023) 104929. URL: https://doi.org/10.1016/j.scs.2023.104929. doi:10.1016/j.scs.2023.104929, publisher: Elsevier Ltd.
- Hong et al. [2020] J. Y. Hong, B. Lam, Z.-T. Ong, K. Ooi, W.-S. Gan, J. Kang, S. Yeong, I. Lee, S.-T. T. Tan, Building and Environment 167 (2020) 106423. doi:10.1016/j.buildenv.2019.106423, publisher: Elsevier Ltd.
- Erfanian et al. [2021] M. Erfanian, A. Mitchell, F. Aletta, J. Kang, Journal of Environmental Psychology 77 (2021) 101660. doi:10.1016/j.jenvp.2021.101660, publisher: Elsevier Ltd.
- Li and Lau [2020] H. Li, S.-K. Lau, Applied Acoustics 166 (2020) 107372. doi:10.1016/j.apacoust.2020.107372, publisher: Elsevier Ltd.
- Karnapi et al. [2021] F. A. Karnapi, B. Lam, T. Wong, K. Ooi, Z.-T. Ong, W.-S. Gan, J. Hong, S. Yeong, in: INTER-NOISE and NOISE-CON Congress and Conference Proceedings, volume 263, The Institute of Noise Control Engineering of the USA, Inc., Washington, D.C., USA, 2021, pp. 2253–2258. doi:10.3397/IN-2021-2084, issue: 4 ISSN: 0736-2935.
- Moshona et al. [2023a] C. Moshona, F. Aletta, H. Henze, X. Chen, A. Mitchell, T. Oberman, H. Tong, A. Fiebig, J. Kang, B. Schulte-Fortkamp, in: INTER-NOISE and NOISE-CON Congress and Conference Proceedings, volume 265, pp. 854–862. doi:10.3397/IN_2022_0121, issue: 7 ISSN: 0736-2935.
- Moshona et al. [2023b] C. C. Moshona, S. Lepa, A. Fiebig, Applied Acoustics 207 (2023b) 109338. doi:10.1016/j.apacoust.2023.109338.
- Hou et al. [2023] Y. Hou, S. Song, C. Luo, A. Mitchell, Q. Ren, W. Xie, J. Kang, W. Wang, D. Botteldooren, in: INTERSPEECH 2023, ISCA, ISCA, 2023, pp. 331–335. doi:10.21437/Interspeech.2023-1021, arXiv: 2308.11980 ISSN: 19909772.
- Mitchell et al. [2021] A. Mitchell, T. Oberman, F. Aletta, M. Erfanian, M. Kachlicka, M. Lionello, J. Kang, The International Soundscape Database: An integrated multimedia database of urban soundscape surveys – questionnaires with acoustical and contextual information (0.2.2) [Data set], 2021. doi:10.5281/zenodo.5705908.
- Mitchell et al. [2023] A. Mitchell, F. Aletta, T. Oberman, M. Erfanian, J. Kang, INTER-NOISE and NOISE-CON Congress and Conference Proceedings 268 (2023) 2108–2118. doi:10.3397/IN_2023_0309.
- Jiang et al. [2022] L. Jiang, A. Bristow, J. Kang, F. Aletta, R. Thomas, H. Notley, A. Thomas, J. Nellthorp, Building and Environment 219 (2022) 109231. doi:10.1016/j.buildenv.2022.109231, publisher: Elsevier Ltd.
- Aletta et al. [2024] F. Aletta, J. Xiao, J. Kang, JASA Express Letters 4 (2024). URL: https://pubs.aip.org/jel/article/4/4/047401/3280368/Identifying-barriers-to-engage-with-soundscape. doi:10.1121/10.0025454.