HCS-TNAS: Hybrid Constraint-driven Semi-supervised Transformer-NAS for Ultrasound Image Segmentation
Abstract.
Accurate ultrasound segmentation is pursued because it aids clinicians in achieving a comprehensive diagnosis. Due to the presence of low image quality and high costs associated with annotation, two primary concerns arise: (1) enhancing the understanding of multi-scale features, and (2) improving the resistance to data dependency. To mitigate these concerns, we propose HCS-TNAS, a novel neural architecture search (NAS) method that automatically designs the network. For the first concern, we employ multi-level searching encompassing cellular, layer, and module levels. Specifically, we design an Efficient NAS-ViT module that searches for multi-scale tokens in the vision Transformer (ViT) to capture context and local information, rather than relying solely on simple combinations of operations. For the second concern, we propose a hybrid constraint-driven semi-supervised learning method that considers additional network independence and incorporates contrastive loss in a NAS formulation. By further developing a stage-wise optimization strategy, a rational network structure can be identified. Extensive experiments on three publicly available ultrasound image datasets demonstrate that HCS-TNAS effectively improves segmentation accuracy and outperforms state-of-the-art methods.
1. Introduction
Echocardiography (cardiovascular ultrasound) is a critical medical imaging tool for diagnosing cardiac diseases, and achieving precise segmentation of echocardiographic images can further assist clinicians in comprehensively analyzing cardiac conditions (Leclerc et al., 2019). However, segmentation algorithms face challenges such as the lack of annotated data, speckle noise in ultrasound images, and the difficulty in discriminating adjacent anatomical structures (Zhou et al., 2023), which necessitates (1) the understanding of multi-scale features, and (2) robustness to data dependency.
Over the past years, the development of deep learning (DL) in medical image segmentation has represented a progression in understanding multi-scale features. Yu et al. (Yu et al., 2016) first introduced dynamic convolutional neural networks for fetal left ventricle segmentation, aiming to maximize the effectiveness of local feature perception. With the proposal of U-Net (Ronneberger et al., 2015), which exhibited extraordinary feature extraction ability, the U-shaped encoder-decoder network garnered attention and spawned multiple variants, such as UNet++ (Zhou et al., 2019). Inspired by this, the Res-U network (Ali et al., 2021) combines ResNet (He et al., 2016) and U-Net, generating reliable results by leveraging skip connections within functional blocks to extract accessible features. While these works focus on local feature perception, the vision Transformer (ViT) (Dosovitskiy et al., 2020) was proposed with a strong context-sensing ability to capture the relationship between distant pixels. Subsequently, Chen et al. (Chen et al., 2021a) proposed TransUNet, which combines a U-shaped network with the Transformer. Cai et al. proposed EfficientViT (Cai et al., 2023), which employs ReLU linear attention in the ViT to enhance the model’s capability while reducing the number of parameters.
While handcrafted networks necessitate a substantial level of expertise to design a rational structure for understanding multi-scale features, neural architecture search (NAS) has garnered attention as it enables automatic optimization of network structures within the provided search space. Grounded in the concept of hierarchical structure, Auto-DeepLab (Liu et al., 2019) was proposed to search for network backbones across multiple levels, achieving commendable performance on large-scale general datasets. Ren et al. (Ren et al., 2021) also employed NAS for left ventricular myocardium segmentation. However, the current NAS methods applied to ultrasound image segmentation tend to blindly expand the search space while neglecting efficiency, resulting in heavy parameter loads but marginal improvements.
On the other hand, medical image datasets often suffer from a scarcity of labeled data, causing traditional supervised models to exhibit a high degree of data dependency and fail to achieve satisfactory results. Hence, unlabeled data needs to be utilized for segmentation tasks, and semi-supervised learning (SSL) provides an excellent solution. Current SSL methods, such as Mean Teacher (Tarvainen and Valpola, 2017) and co-training (Chen et al., 2021b), efficiently enhance model robustness against data dependency and have been employed for echocardiographic segmentation. Wu et al. (Wu et al., 2022) designed an adaptive spatiotemporal semantic calibration algorithm for their semi-supervised model, achieving satisfactory performance. After years of research, it has then been noticed that combining NAS and SSL can be meaningful. Pauletto et al. (Pauletto et al., 2022) demonstrated the effectiveness of this idea by proposing a self-semi-supervised NAS for accurate semantic segmentation. Nonetheless, semi-supervised NAS still holds research potential, as previous work has merely involved rudimentary stitching, treating this concept superficially. Inspired by CauSSL (Miao et al., 2023), which additionally considered the algorithmic independence of the model on top of the co-training framework and got outstanding results, we begin considering designing hybrid constraint-driven semi-supervised learning for the NAS model, leveraging the distinctive network characteristics of NAS.
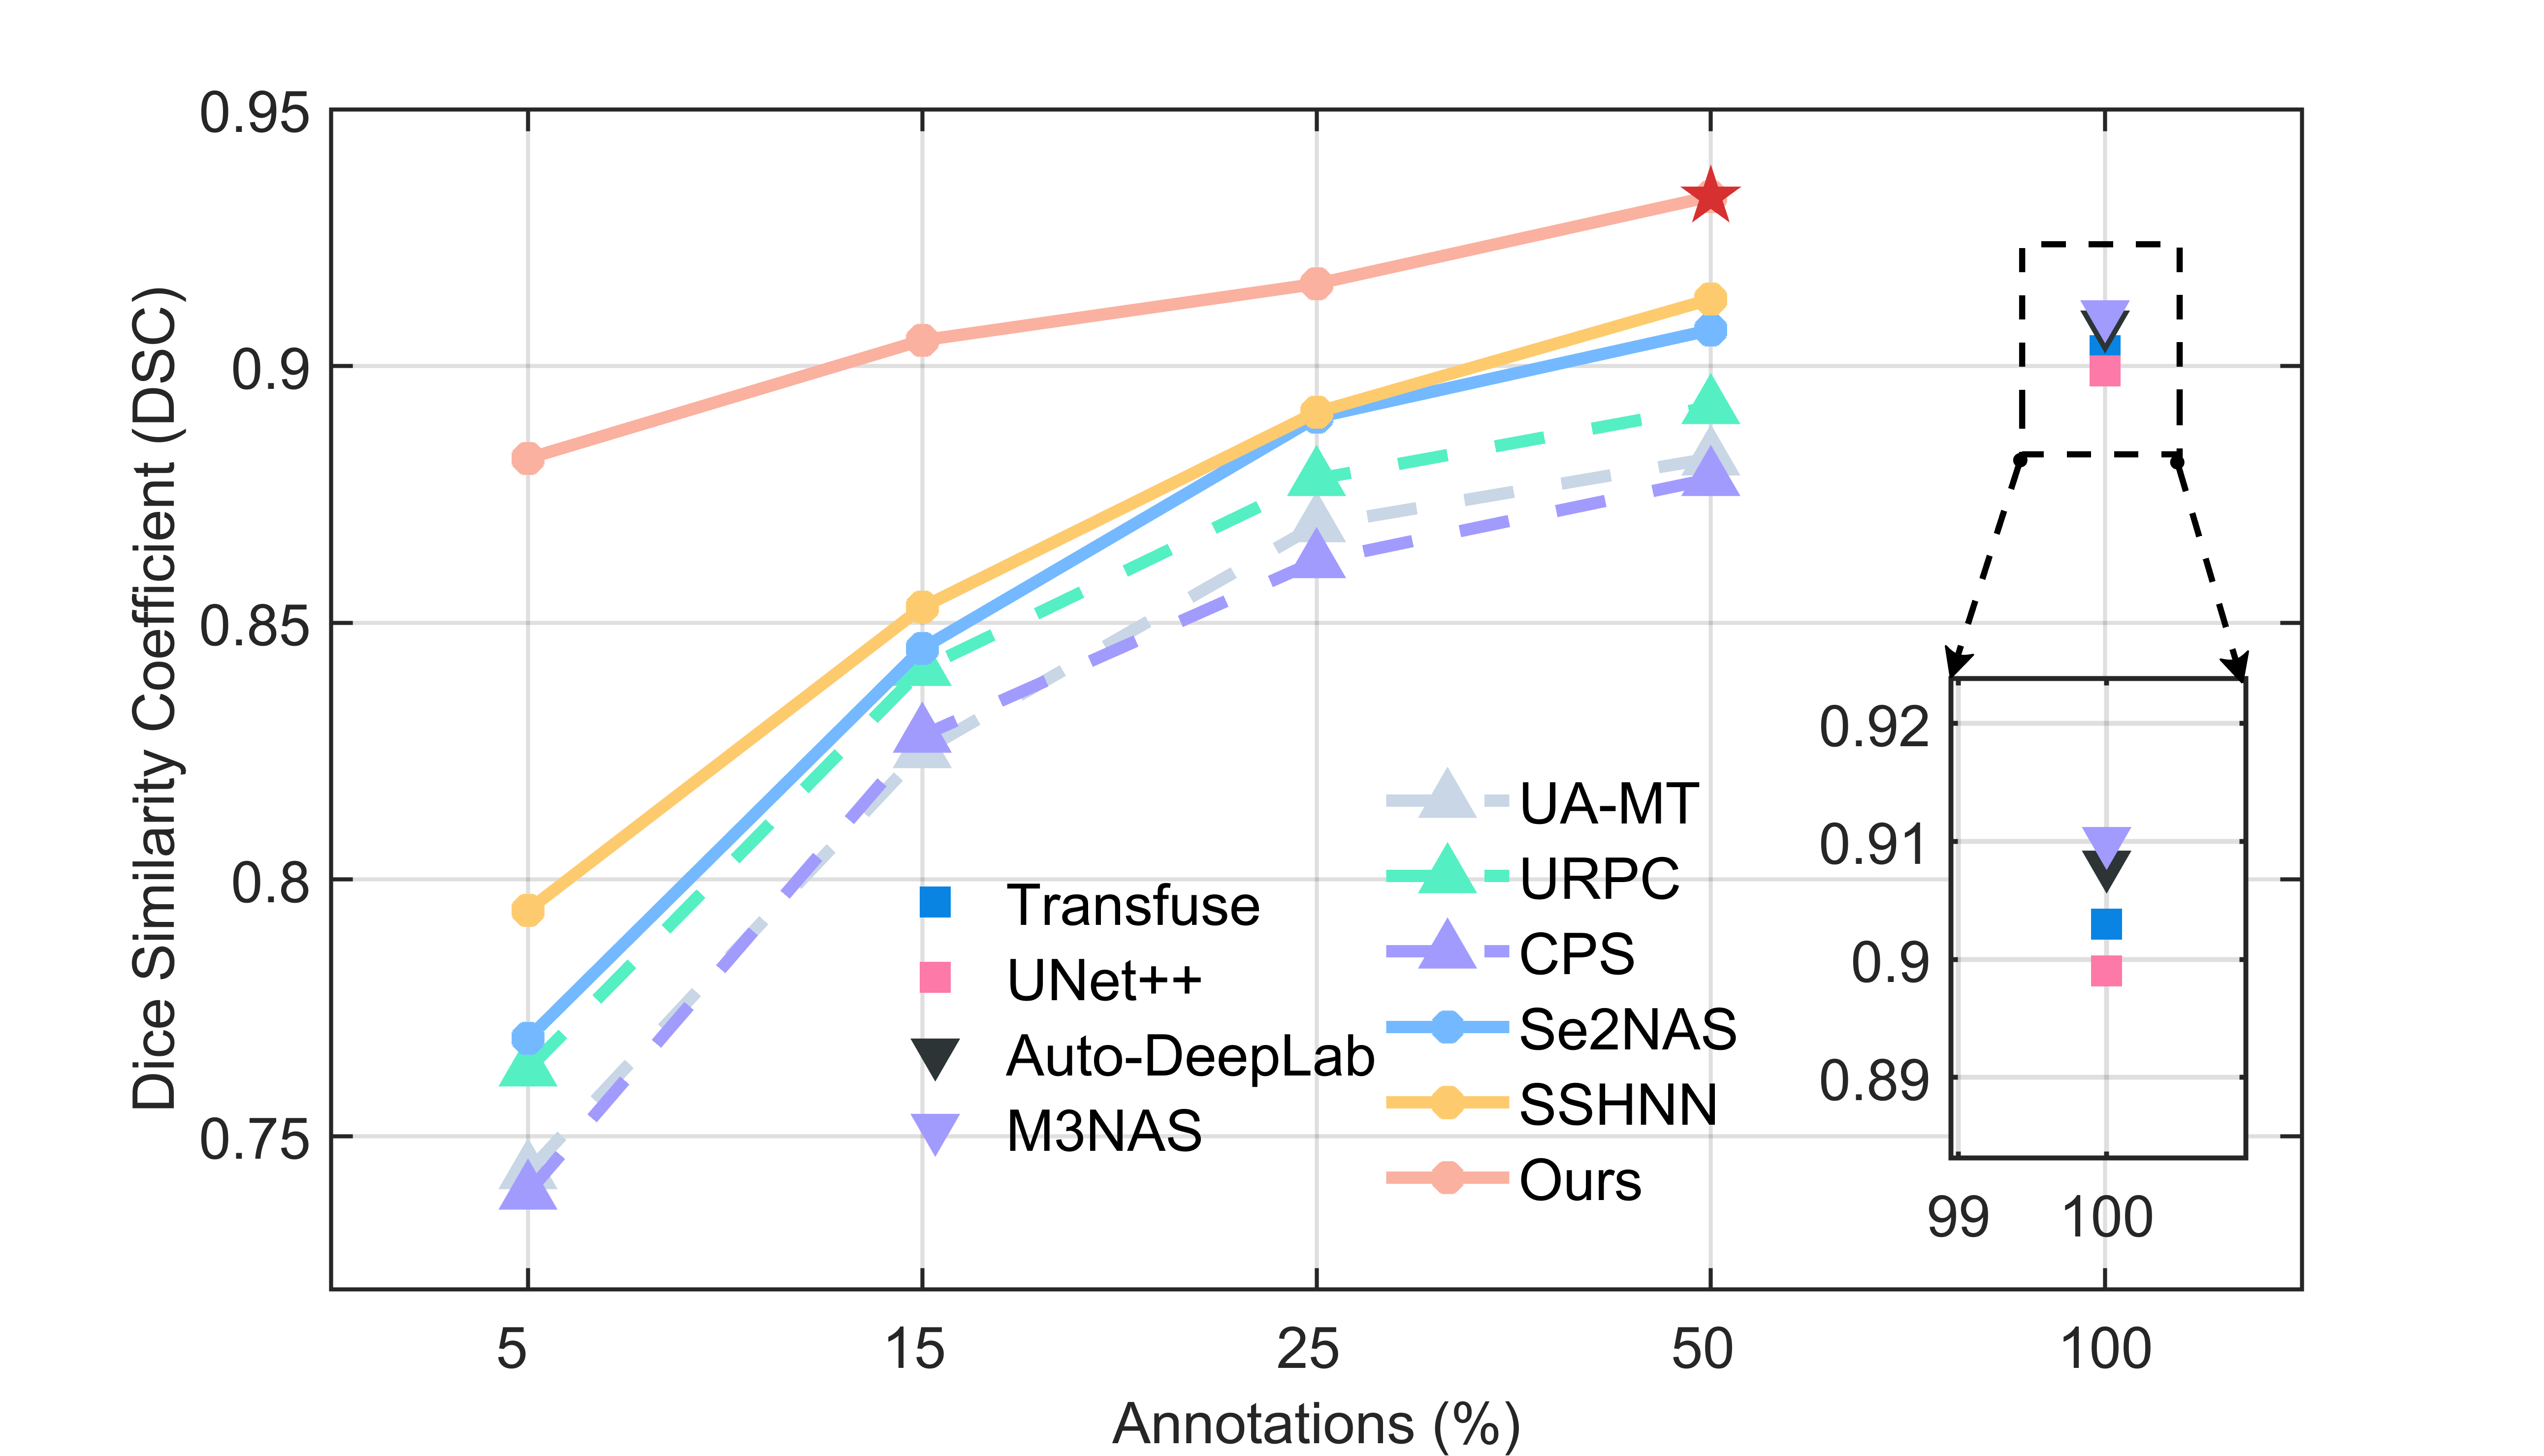
Based on the above analysis, we propose HCS-TNAS, a hybrid constraint-driven semi-supervised Transformer neural architecture search, for ultrasound image segmentation. We summarize the differences between our method and seminal methods in Tab. 1. For the issue of multi-scale feature extraction and understanding, we implement hierarchical NAS, searching for the optimal structure at the cellular, layer, and module (i.e., encoder and decoder) levels. At the basic cellular layer, we propose an Efficient NAS-ViT module that combines NAS with ViT for multi-scale token processing while mitigating the issue of excessive parameters caused by using the Transformer. At the layer level, we use feature fusion blocks to aggregate multi-resolution features. At the module level, we design NAS in both the encoder and decoder with specific search spaces to ensure their respective functionalities. For the issue of data dependency, different from existing semi-supervised NAS methods, we consider multiple constraints on top of the co-training framework, including network independence loss and contrastive loss. The network independence loss encourages the two co-trained models to be algorithmically independent, providing complementary assistance to each other (Miao et al., 2023). Additionally, contrastive loss assists in maximizing mutual information across different views of the same image (Bachman et al., 2019) from complementary networks. Our performance comparison with other models is shown in Fig. 1.
In summary, the main contributions of this paper are as follows:
(1) We propose a Hybrid Constraint-driven Semi-supervised Transformer-NAS, termed HCS-TNAS, for accurate ultrasound image segmentation. The two main issues are concluded: the multi-scale feature understanding, and the data dependency.
(2) We adopt multi-level searching for the issue of the multi-scale feature understanding. Specifically, we design an Efficient NAS-ViT module to generate multi-scale tokens. To the best of our knowledge, this is the first study that introduces NAS into the ViT for token-level searching, departing from the linear combination of features in existing works.
(3) We propose a hybrid constraint-driven SSL for the issue of data dependency. Building upon the co-training, we incorporate algorithmic independence and contrastive learning into the unique multi-stage optimization of NAS, thereby maximizing the utilization of spatial and geometric information for feature discrimination.
(4) We conduct extensive experiments on three public ultrasound image datasets, demonstrating the advancement of HCS-TNAS.
2. Related Work
2.1. Neural Architecture Search
NAS is proposed to resolve the difficulty of network design and find the optimal network architecture within the search space. After the introduction of differentiable architecture search (DARTS) (Liu et al., 2018), which created a continuous relaxation algorithm to provide differentiable candidate operation weights, gradient-based NAS became trainable on a single GPU, alleviating the high computational complexity and time overhead issues. As a DARTS variant, PC-DARTS (Xu et al., 2019) proposed two new techniques: partial channel connections and edge normalization, further reducing GPU memory consumption. Edge normalization also inspired the development of hierarchical NAS (HNAS), enabling a multi-level search. Liu et al. (Liu et al., 2019) first proposed Auto-DeepLab, which optimizes the network at the cell and layer levels. In DCNAS (Zhang et al., 2021b), Zhang et al. incorporated skip connections into HNAS to promote model capacity. Moreover, the Transformer is also used in HNAS to compensate for the lack of context information. In HCT-Net (Yu et al., 2023), Yu et al. utilized a Transformer to process feature maps of varying resolutions. Yang et al. proposed DAST (Yang et al., 2023) which incorporates the Transformer layer as candidate operations for cell-level searching.
In contrast to these NAS works, we search architecture from three levels: cell, layer, and encoder-decoder, allowing for higher degrees of freedom. Specifically, to mitigate the issue of excessive parameters caused by the Transformer and facilitate better multi-scale feature understanding, we creatively implement NAS in ViT for multi-scale tokens rather than relying on mixed feature maps.
2.2. SSL for Medical Image Segmentation
SSL can alleviate the scarcity of labeled data in medical image segmentation, which can be broadly categorized into pseudo-labeling methods and consistency regularization methods. Pseudo-labeling method produces pseudo-labels for unlabeled data for refining accurate segmentation results. Bai et al. (Bai et al., 2017) proposed a self-training framework for cardiac MRI segmentation. The network predictions for unlabeled data were treated as pseudo labels and network parameters were iteratively updated. In (Wang et al., 2021), SSL was enhanced by adopting uncertainty-guided confidence-aware refinement at the pixel level to promote pseudo-label precision and leveraging image-level uncertainty to mitigate the influence of low-quality pseudo labels. For consistency regularization methods, Tarvainen et al. (Tarvainen and Valpola, 2017) proposed mean teacher (MT), which averaged weight parameters to form a target-generating teacher model for promoting the consistency between predictions and targets. Building upon this, Yu et al. (Yu et al., 2019) proposed a novel uncertainty-aware mean teacher (UA-MT) framework for left atrium segmentation. Apart from the popular MT framework, Qiao et al. (Qiao et al., 2018) proposed the Deep co-training framework, which trained multiple networks to provide different and complementary information regarding the data. Xia et al. (Xia et al., 2020) developed the uncertainty-aware multi-view co-training (UMCT), proving the effectiveness of multi-view consistency in co-training.
In our work, we opt to design a hybrid constraint-driven SSL framework, tailored for NAS. Building upon the co-training, we first introduce network independence loss for multi-view consistency and show its utility for NAS. Furthermore, we ingeniously leverage the hierarchical architecture of the decoder NAS to define additional contrastive loss, maximizing mutual information from the diverse perspectives generated by complementary networks.
3. Method
3.1. Overview

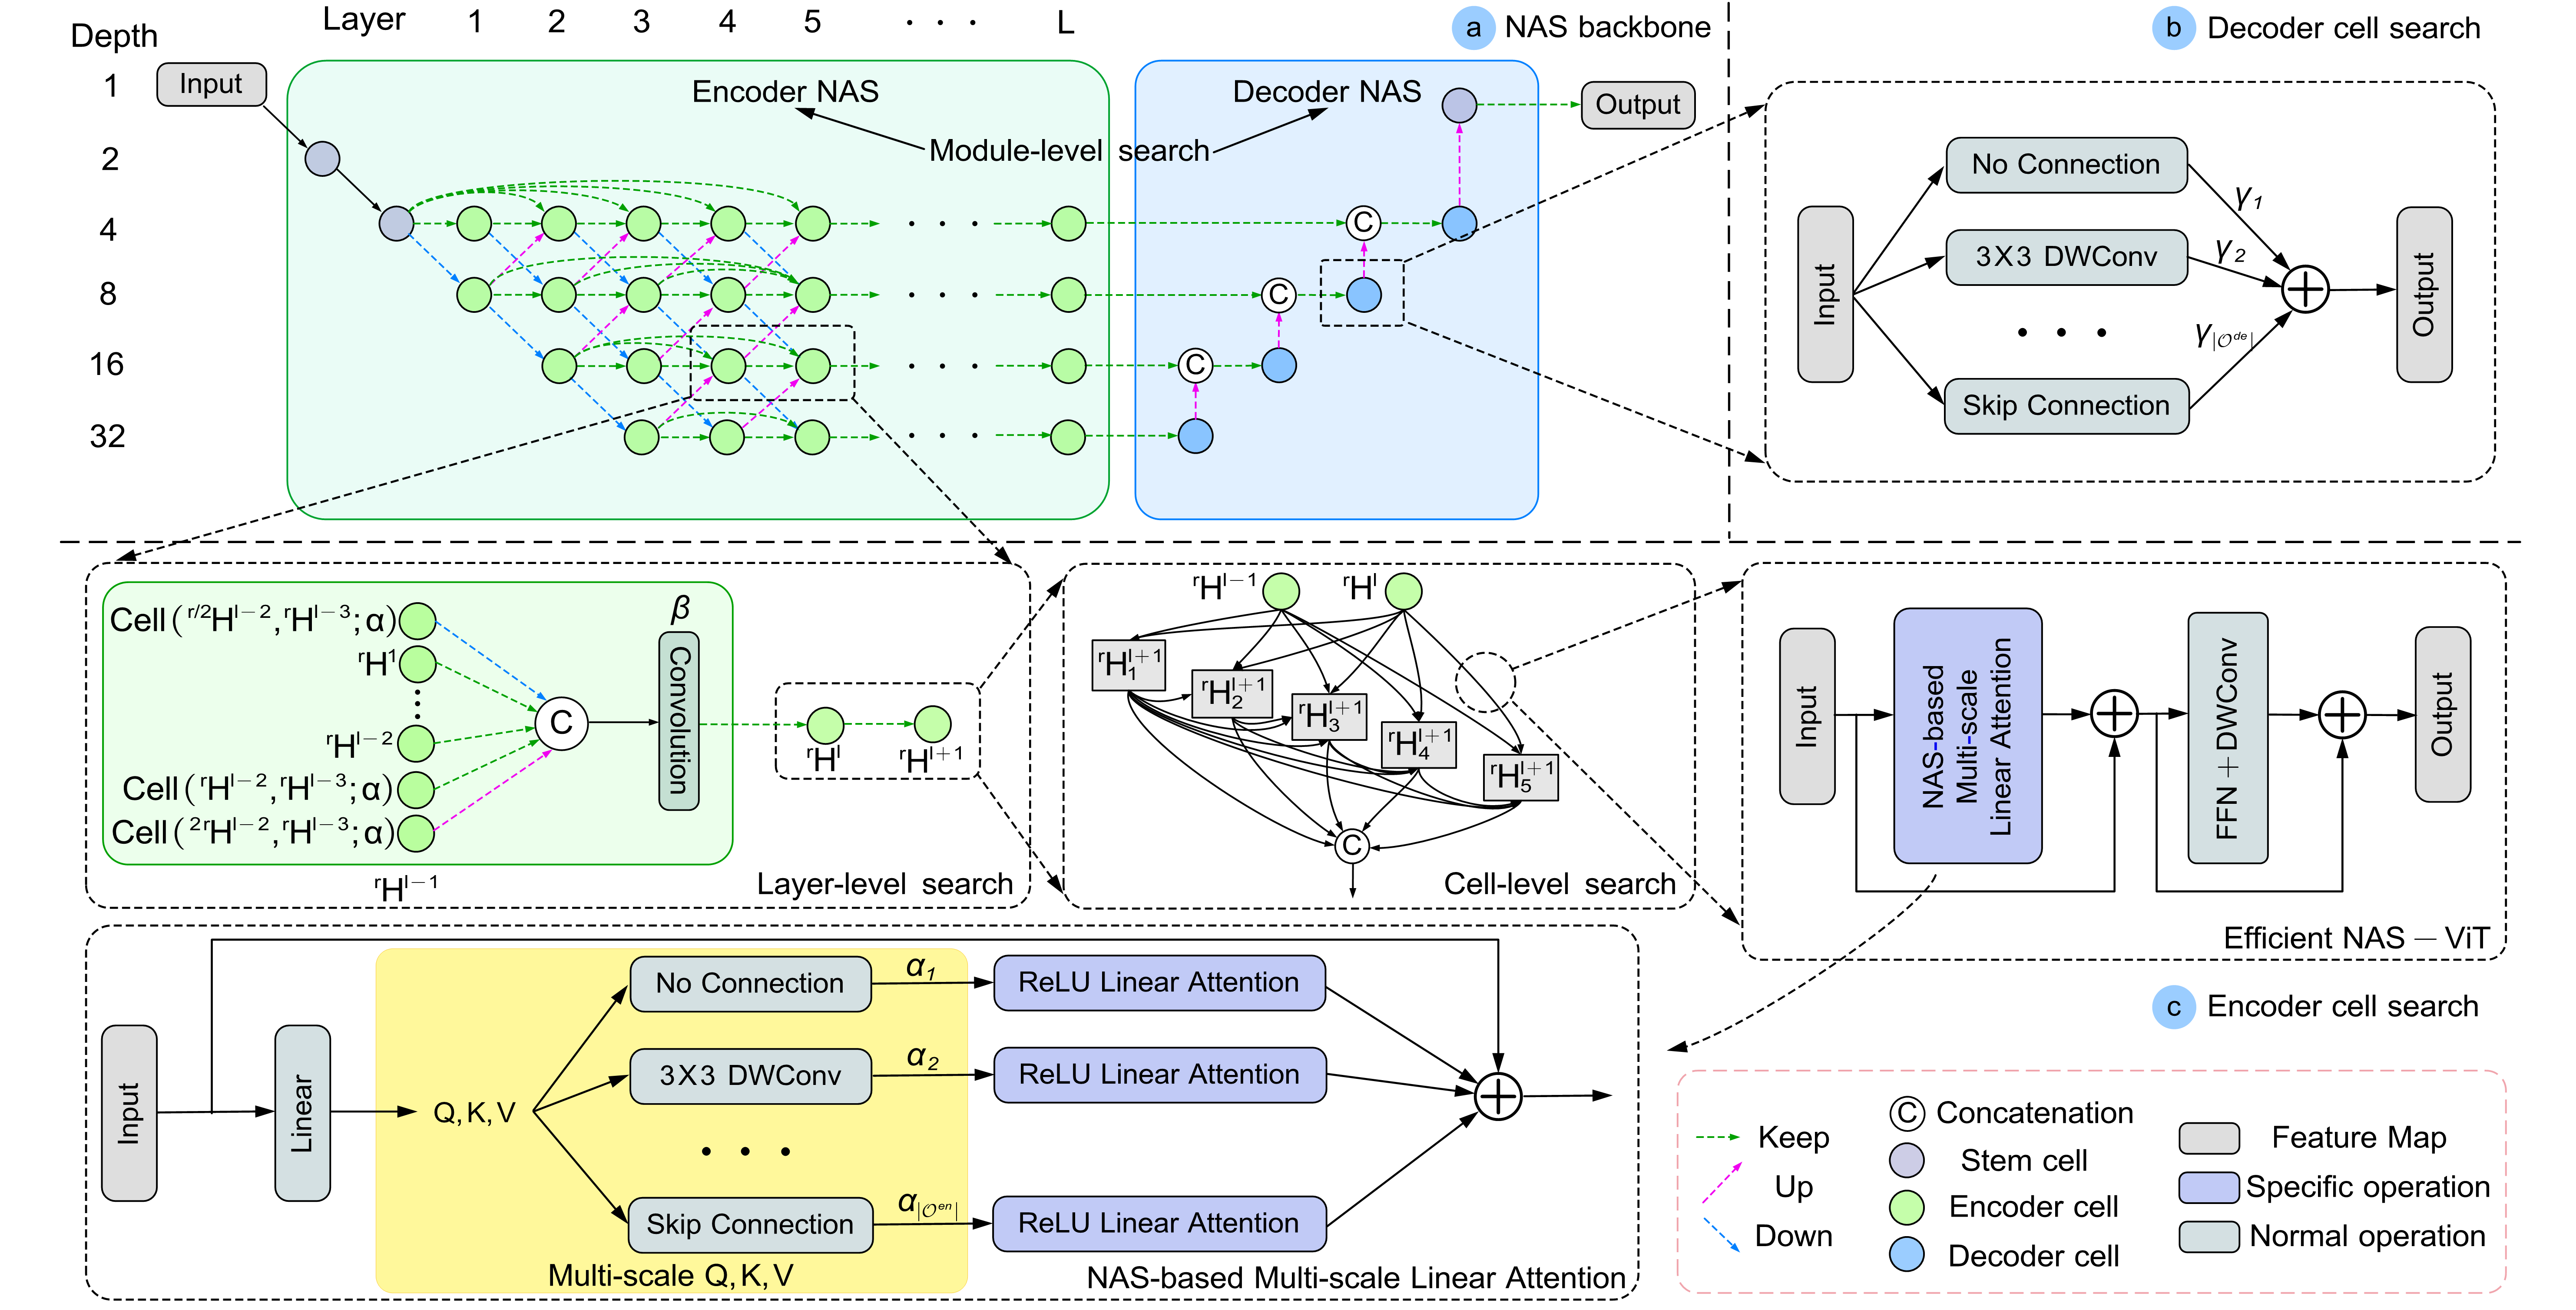
An overview of the proposed HCS-TNAS is provided in Fig. 2. Our framework uses two neural networks based on the co-training framework: a Student network and a Teacher network , where both networks share the same HNAS-based backbone but use different parameters and independent optimizers. Our HNAS backbone comprises two parts: an encoder NAS and a decoder NAS, with further details presented in Sec. 3.3. To explore a novel approach that integrates NAS with ViT for global context modeling, we propose an Efficient NAS-ViT module (Sec. 3.2) in NAS backbone, in contrast to linear combinations of feature maps (after candidate operations) in existing works. Moreover, the encoder and decoder consider different sets of candidate operations, as shown in Table 2. Instead of the Mean Teacher, we adopt a hybrid constraint-driven SSL method (Sec. 3.4) on top of the co-training framework to update network parameters. The overall loss function is represented by:
| (1) |
where , corresponds to and , respectively, is the supervised loss, which is the combination of the cross-entropy loss and the Dice loss calculated from the predictions and the ground truth labels on the labeled dataset:
| (2) |
and is the unsupervised loss, is the network independence loss, and is the contrastive loss. The details are provided in Sec. 3.4. , , and are hyper-parameters.
3.2. Efficient NAS-ViT Module
Candidate Operations Encoder Cell Decoder Cell 33 separable convolution ✓ ✓ 55 separable convolution ✓ ✓ 33 convolution with dilation rate 2 ✓ ✓ 55 convolution with dilation rate 2 ✓ ✓ 33 average/max pooling ✓ ✗ skip connection ✓ ✓ no connection (zero) ✓ ✗
In DAST (Yang et al., 2023), the ViT layer is directly added to candidate operations, leading to increased computation complexity. On the other hand, since the ViT is more complex than other operations, the model tends to favor selecting the ViT during backbone optimization, rendering the search less meaningless. To resolve this issue, we replace it with EfficientViT (Cai et al., 2023) as a base module, further implementing NAS before attention calculation for searching multi-scale tokens and reducing excessive parameter overhead, termed Efficient NAS-ViT. It will be used in the inner cell search of the encoder NAS and the effectiveness of this novel Transformer-based approach for NAS will be shown through the empirical results of Sec. 4.4. An overview of the Efficient NAS-ViT is illustrated in Fig. 3 (d), featuring the NAS-based Multi-scale Linear Attention, which integrates NAS with ReLU linear attention. The FFN+DWConv refers to the application of depthwise convolution on the FFN layer.
Given input after linear projection, tokens , , , where is the learnable linear projection matrix. Instead of using fixed operations to obtain multi-scale tokens in the original work, which constrains the token representation and affects attention calculation, we leverage the NAS technique to search for token representations, thereby enhancing the multi-scale learning capacity. By incorporating partial channel connections to reduce memory overhead and reusing continuous relaxation for a differentiable search space, the multi-scale tokens are formulated as:
| (3) | ||||
where P is the sampling mask for channel selection, denotes the operation selected from the set of encoder candidate operations , and is cell architecture parameter after applying the softmax, which measures the weight of related candidate operation.
Subsequently, tokens are computed by ReLU linear attention:
| (4) |
where denotes the row of . Benefiting from the attention mechanism, ReLU linear attention captures contextual information. Then, the output is fed into the FFN+DWConv layer, which captures local information.
3.3. NAS Backbone
3.3.1. Encoder NAS
It comprises cell- and layer-level searches, which encompass a larger search space for multi-scale feature extraction. Regarding the cell, there are intermediate nodes in cell search space, where the edge between nodes corresponds to the proposed Efficient NAS-ViT module, shown in the Right of Fig. 3(c). After processing the inputs by Efficient NAS-ViT, the output of the node of the encoder cell in the layer is:
| (5) |
where the inputs includes the previous cell’s output and previous nodes’ output in the current cell. The final output tensor of the cell is the concatenation of outputs from all nodes (shown in the Middle of the Fig. 3). For simplicity, the cell-level search is written as:
| (6) |
The layer-level search aims at aggregating features from different resolutions by employing convolution kernels and skip connections, illustrated in the Left of the Fig. 3. The parameters of these kernels are referred to as the architecture parameters . There are layers in the backbone. To capture multi-resolution features, our model considers six resolutions: , where corresponds to the original image size. When , the spatial size of the feature maps is of the case where . The formulation of the layer level search is denoted as:
| (7) | ||||
where denotes the convolution, transforming fused features to the same channel counts of -resolution, denotes downsampling, and denotes upsampling.
3.3.2. Decoder NAS
Instead of employing fixed convolution kernel sizes, we introduce NAS for the decoder design to enhance the capability. The set of candidate operations for the decoder is presented in Table 8. Specifically, a U-shaped architecture is used as the backbone for the decoder NAS, as depicted in Fig. 3(a).
In the decoder NAS, the features from the layer after the encoder NAS are fed into the decoder cell as the initial input. To mitigate the excessive computational complexity introduced by NAS, the decoder cell does not contain any intermediate nodes, as shown in Fig. 3(b). The search can be denoted as:
| (8) |
where are decoder architecture parameters, and is the final output tensor of decoder cell in -resolution.
After upsampling, the features are concatenated with , and a convolution layer is applied to match the number of channels with the decoder NAS. This process is then repeated until the features are combined. Finally, an upsample layer is employed to recover the outputs to the full resolution, followed by a convolution layer to obtain the desired number of classes for segmentation tasks.
3.4. Hybrid Constraints-driven SSL
Owing to the challenges of annotating medical images, public datasets typically comprise a substantial amount of unlabeled data and a limited amount of labeled data. To leverage the unlabeled data, the co-training framework of SSL is implemented, where the unsupervised loss is defined as:
| (9) |
where is the predicted probability maps generated by one network on the unlabeled data, and is the corresponding one-hot pseudo label generated by the other network:
| (10) |
Through the analysis in SSL (Miao et al., 2023), the algorithmic independence property has been demonstrated to facilitate the creation of two distinct networks, especially in the co-training. Complementary networks are capable of capturing diverse feature information and contributing to the segmentation accuracy promotion. Thus, we incorporate network independence loss and propose a stage-wise optimization strategy (Sec 3.5) to fulfill this potential. We define the network dependence between two NAS backbones based on the convolutional layers at the same position as follows:
| (11) |
where denotes the total number of convolutional layers. are the weight parameters of the convolutional layer for two networks, which are reshaped into a matrix form for loss calculation, where is the kernel size, is the number of input feature channels and corresponds to the number of output feature channels. are the corresponding optimal coefficient matrix. The network independence loss is defined as:
| (12) | ||||
where is the row vector of matrix , and is the vector obtained by performing linear combination on using the . The network independence is summarized as a min-max optimization:
| (13) |
Since algorithmic independence essentially endows the network with the capability to observe the same image from different perspectives, contrastive loss (Bachman et al., 2019; Huang et al., 2023) is utilized as an additional constraint to maximize the mutual information across these views. Benefiting from network independence, there is no need to construct an asymmetric architecture for contrastive loss.
In this work, an uncertainty-based contrastive loss is creatively proposed in the form of NAS, measured on the outputs at different stages of the decoder cell between two networks. The uncertainty estimation is defined using smoothed KL-divergence to avoid singular values and consider features at various resolutions as follows:
| (14) |
where is the channel dimension, is a small bias term, are used, and are the output tensors of the decoder cell at the -resolution for and , respectively. is the mean value across the channel dimension. A higher estimation value reflects a higher uncertainty, which can be used to compel the lower-quality features to align with their higher-quality counterparts.
Consequently, the positions of these features are estimated by:
| (15) |
where denotes Hadamard product and contrastive loss is:
| (16) |
3.5. Stage-wise Optimization Strategy
To adapt to the hybrid constraint-driven SSL, we propose a stage-wise optimization strategy, summarized in Alg. 1. In each iteration, we first fix the network parameters and optimize the combination matrix for epochs. In the second stage, we fix the combination matrix and network architecture parameters and then update the network weights by minimizing . In the third stage, we only update the architecture parameters by minimizing after epochs. During the optimization, continuous relaxation is implemented for the gradient descent algorithm.
4. Experiments
Learning Design Method HMC-QU CETUS CAMUS Paradigm Strategy DSC IoU 95HD DSC IoU 95HD DSC IoU 95HD Manual UNet++ (Zhou et al., 2019) nnU-Net (Isensee et al., 2021) Fully Transfuse (Zhang et al., 2021a) (100%) NAS Auto-DeepLab (Liu et al., 2019) M3NAS (Lu et al., 2022) NasUNet (Weng et al., 2019) Manual UA-MT (Yu et al., 2019) URPC (Luo et al., 2021) Semi CPS (Chen et al., 2021b) (50%) NAS Se2NAS (Pauletto et al., 2022) SSHNN-L (Chen et al., 2024) HCS-TNAS
4.1. Datasets
To evaluate the effectiveness of our proposed HCS-TNAS method, three public datasets are utilized: (i) CAMUS dataset (Leclerc et al., 2019) is a large-scale 2D echocardiography dataset, comprising 2000 labeled images, and approximately 19000 unlabeled images. It includes four classes of labels: left ventricle endocardium (LV), left atrium, myocardium, and background. (ii) HMC-QU dataset (Kiranyaz et al., 2020) consists of 2D echocardiography videos. By splitting these sequences into individual images, a total of 4989 images are obtained, among which 2349 images are annotated with two classes of labels: left ventricle wall and background. (iii) CETUS dataset (Bernard et al., 2015) comprises 90 sequences of 3D ultrasound volumes. After randomly selecting 80 frames from each sequence, a total of 7200 annotated images are obtained, with two classes of labels: LV and background. In our experiments, 3400 of these images are utilized as unlabeled data.
For the CAMUS dataset, the training and test sets comprise 1800 and 200 labeled images, respectively, while for the CETUS dataset, they comprise 3400 and 400 labeled images, and for the HMC-QU dataset, they comprise 2000 and 349 labeled images. For the SSL experiments with HCS-TNAS on the CAMUS dataset, we randomly selected 90, 270, 450, and 900 images from the training set, corresponding to 5%, 15%, 25%, and 50% labeled data, respectively, while using 19432 unlabeled images for training. On the CETUS dataset, we randomly selected 170, 510, 850, and 1700 images from the training set, corresponding to 5%, 15%, 25%, and 50% labeled data, respectively, and used 3400 unlabeled images for training. For the HMC-QU dataset, 100, 300, 500, and 1000 images are randomly selected as 5%, 15%, 25%, and 50% labeled data, respectively, while 2640 unlabeled images are used for training.
4.2. Implementation Details
4.2.1. Network Architecture
In the encoder NAS, each cell has intermediate nodes. For the resolution , the channel numbers are fixed as 8 for each node. When doubles, the number of channels doubles accordingly. For partial channel connections, of the channels are allowed for searching. The default number of layers is set to 8 and the default proportion of labeled data utilized is 50%.
4.2.2. Training Setup
The experiments are conducted using PyTorch on an Nvidia RTX 3090Ti GPU. The hyper-parameters , are adopted following (Yu et al., 2019; Huang et al., 2023) at the epoch, where , and . The impact of the hyper-parameters is discussed in Sec. 4.5. The linear coefficient matrices are optimized by Adam (Kingma and Ba, 2014) with a fixed learning rate of 0.001. The network weights and architecture parameters are optimized using SGD with an initial learning rate of 0,001, a momentum of 0.9, and a weight decay of 0.0003. For the architecture parameters and , the Adam optimizer is applied with a learning rate of 0.003 and weight decay of 0.001. The total number of epochs is set to and the architecture optimization begins at . In each epoch, is updated times.
No. Efficient HMC-QU (50%) CETUS (50%) CAMUS (50%) NAS-ViT DSC IoU 95HD DSC IoU 95HD DSC IoU 95HD 1 ✗ ✗ ✗ ✗ 2 ✓ ✗ ✗ ✗ 3 ✗ ✓ ✗ ✗ 4 ✗ ✓ ✓ ✗ 5 ✗ ✓ ✗ ✓ 6 ✓ ✓ ✗ ✗ 7 ✓ ✓ ✓ ✗ 8 ✓ ✓ ✓ ✓
4.2.3. Metrics
Three measures are used for evaluation: the Dice Similarity Coefficient (DSC), the Intersection over Union (IoU), and the 95% Hausdorff Distance (95HD). The experiments are repeated with 5 different random seeds, and the average accuracy and standard deviation are reported, with the standard deviations shown in parentheses. The best results are highlighted in bold.
4.3. Comparison with SOTA Methods
Table 3 presents the quantitative results of various methods on the HMC-QU, CETUS, and CAMUS datasets. SSL methods are trained using 50% of annotated data, while supervised learning methods are trained using 100% of annotated data without utilizing any unlabeled data. The mainstream segmentation methods are classified based on the learning paradigm and design strategy. Representative works from each group are selected for a comprehensive analysis. It can observed that HCS-TNAS achieves the best results across all evaluation metrics. On the HMC-QU dataset, HCS-TNAS outperforms the original SOTA method (SSHNN-L) by approximately 2.0% in DSC, 1.9% in IoU, and 1.131 in 95HD, while it also achieves superior performance on the CAMUS the CETUS datasets. These results demonstrate that our proposed method offers an effective solution to two main issues in ultrasound image segmentation.
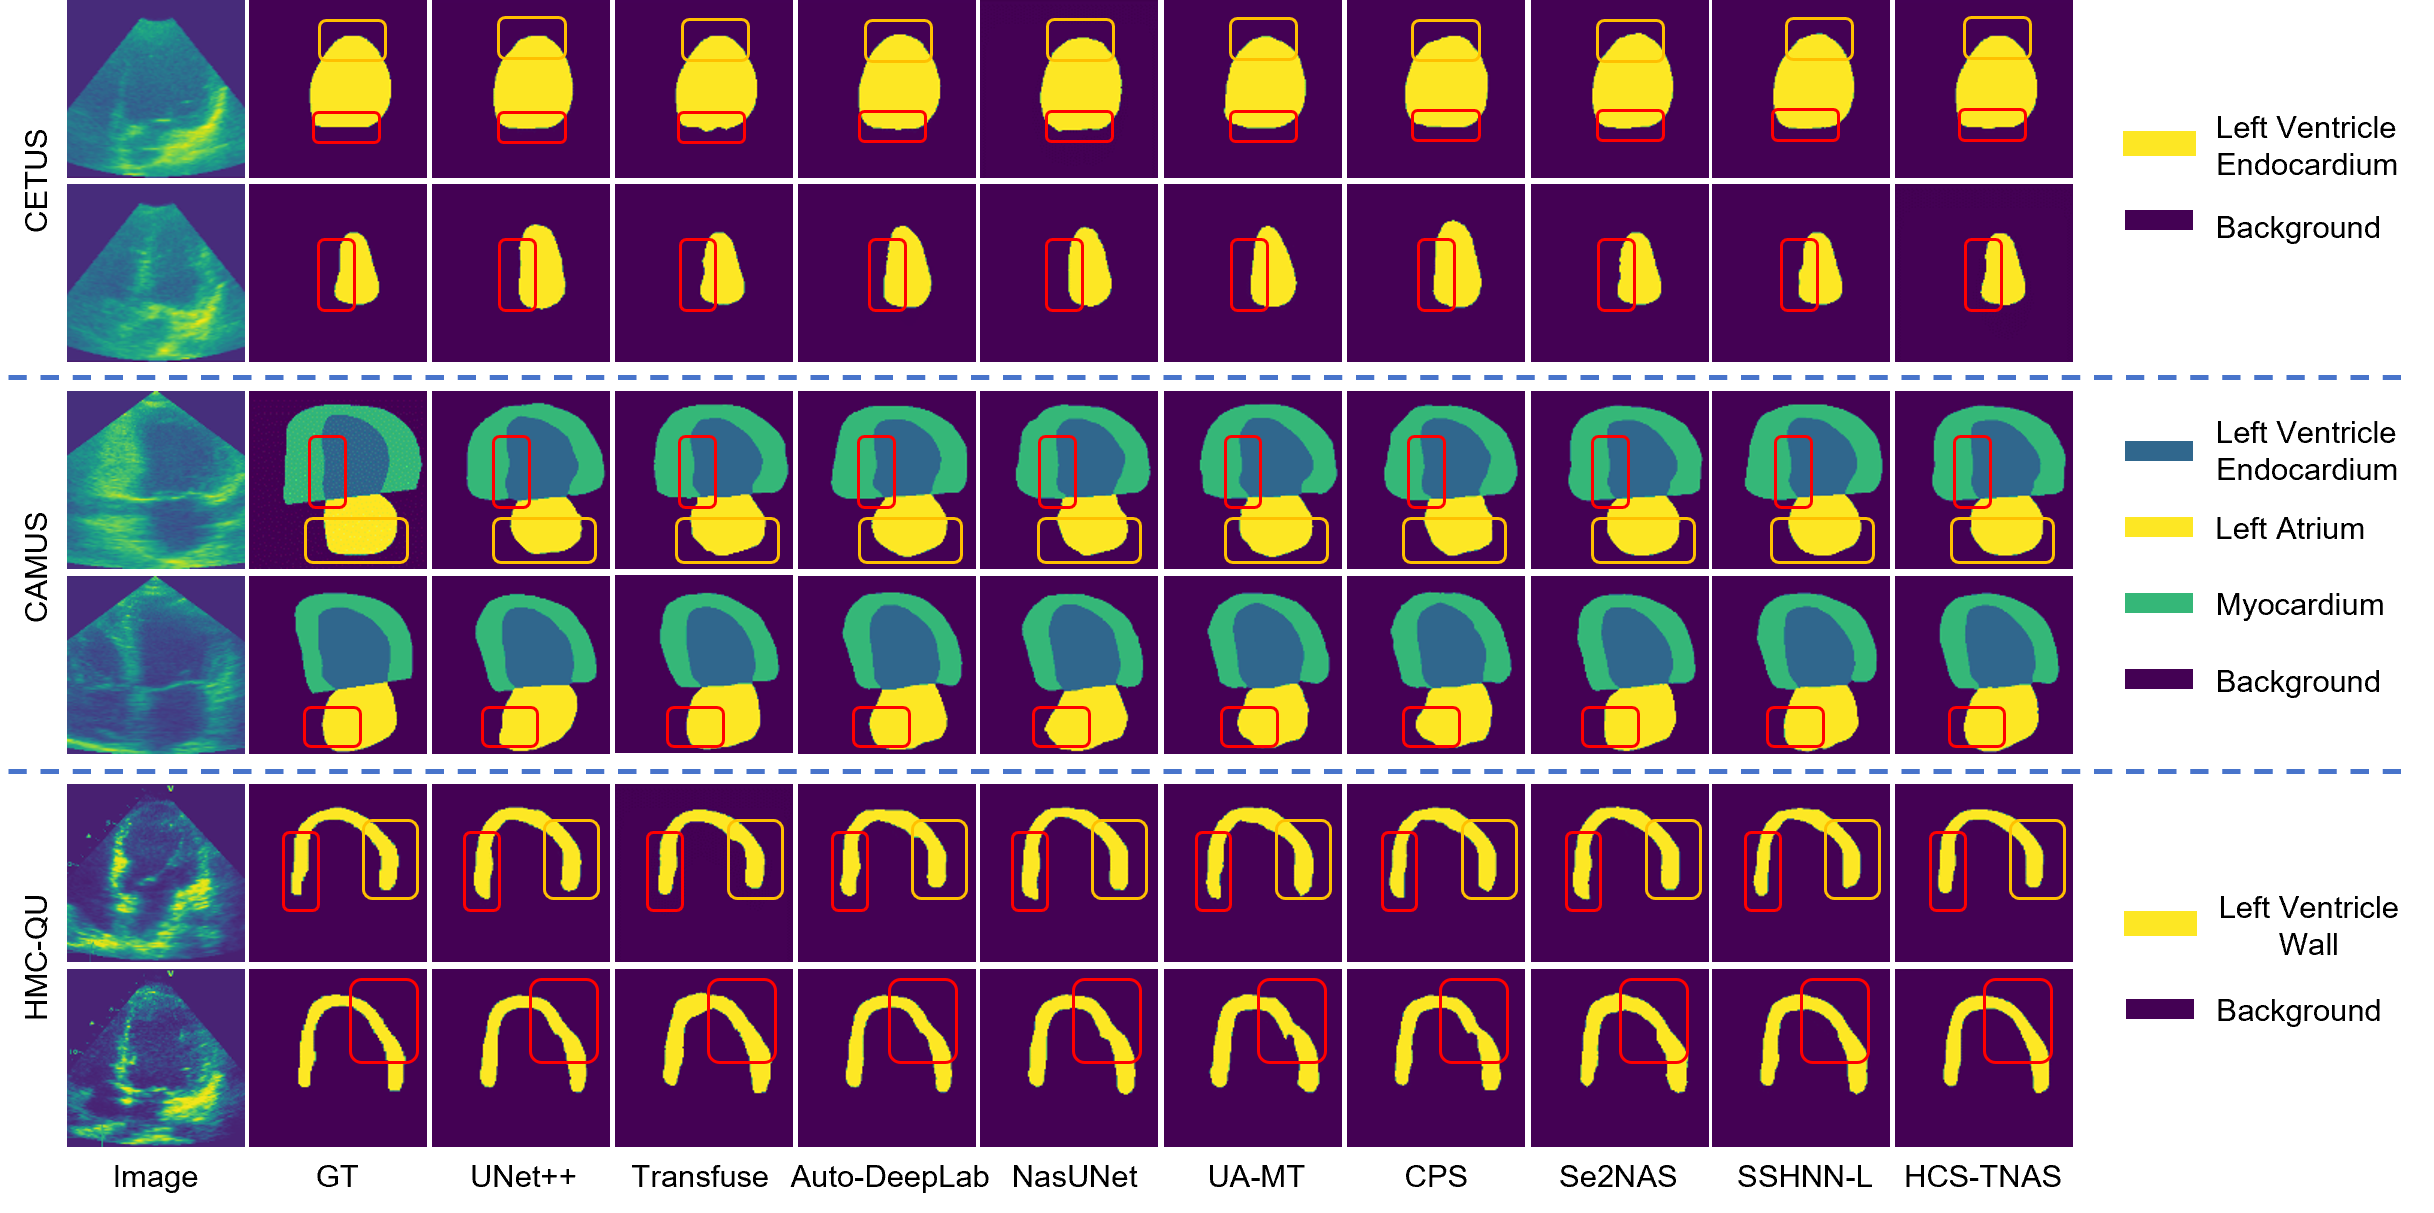
Fig. 4 elaborates the qualitative results of various methods. It can be observed that our method mitigates over and under-segmentation issues, and exhibits smoother boundaries between different labels.
Type Method Application Mode DSC IoU 95HD Params (M) FLOPs (G) Manual TransUNet (Chen et al., 2021a) Employ Transformer as Encoder 96.07 48.34 Manual EfficientViT-L2 (Cai et al., 2023) Multi-scale Tokens 52.12 91.45 NAS Auto-DeepLab (Liu et al., 2019) No Transformer is Applied 44.42 347.52 NAS SSHNN-L (Chen et al., 2024) Treat Transformer as Additional Branch 38.82 52.78 NAS DAST (Yang et al., 2023) Treat Transformer as Candidate Operation 192.44 110.36 NAS HCS-TNAS-E Treat EfficientViT as Candidate Operation 38.48 55.47 NAS HCS-TNAS Efficient NAS-ViT 41.20 67.50
4.4. Ablation Studies
4.4.1. Effects of Sub-modules
To analyze the effects of each sub-module, experiments are conducted in Table 4. The baseline model (No. 1) is the NAS backbone (Sec 3.3) without the Efficient NAS-ViT module, trained using 50% of the annotated data. Firstly, incorporating the Efficient NAS-ViT module improves the segmentation performance from a DSC of 0.905 to 0.912 on the HMC-QU dataset, consistent with the expectation of enhancing the context extraction capabilities. After introducing the co-training algorithm as the SSL framework (No. 6), HCS-TNAS obtains 0.7%, 0.4%, and 0.5% DSC improvements on three datasets, respectively, attributed to the additional information gained from the unlabeled data facilitated by the SSL. Furthermore, when the network independence loss is considered (No. 7), there are 17.12%, 7.66%, and 15.53% 95HD increments over the previous version (No. 6) on three datasets respectively. The effectiveness of contrastive learning is validated in No. 5, which improves the performance by 0.77% in DSC on the HMC-QU dataset compared to independently using the in No. 3.
Method CAMUS (5%) CAMUS (15%) CAMUS (25%) CAMUS (50%) DSC IoU 95HD DSC IoU 95HD DSC IoU 95HD DSC IoU 95HD UA-MT CPS Se2NAS SSHNN-L HCS-TNAS
4.4.2. Effects of Transformer Application Modes
Table 5 presents an assessment of various networks employing different Transformer application modes. TransUNet uses pure Transformers as the encoder. EfficientViT-L2 uses fixed multi-scale tokens within the Transformer. Auto-DeepLab is a NAS model that does not apply the Transformer. SSHNN-L is a NAS network that adopts Transformers as an additional branch. DAST directly uses the Transformer as a candidate operation during the network search process. In the HCS-TNAS-E, we also evaluated the case where EfficientViT was treated as a candidate operation instead of employing the Efficient NAS-ViT. While maintaining the highest segmentation accuracy, our method exhibits a smaller model scale and lower FLOPs. Moreover, the results of the HCS-TNAS-E variant clearly show that the Transformer application mode significantly impacts model performance.
4.4.3. Impact of the Annotation Ratio
Table 6 elaborates the results of representative SSL networks and HCS-TNAS with varying proportions of annotations. It can be observed that HCS-TNAS performs more stable than other advanced SSL methods. When the annotation ratio descends from 50% to 5%, the DSC of UA-MT, CPS, Se2NAS, and SSHNN-L drops by 13.6%, 14.4%, 6.6%, and 6.9%, respectively. However, the DSC of HCS-TNAS only decreases by 4.6%, verifying its robustness. We attribute this achievement to the hybrid constraint-driven SSL approach, which enhances the utilization of limited data.
Method HMC-QU (25%) HMC-QU (50%) DSC 95HD DSC 95HD Remove Remove Remove HCS-TNAS
4.4.4. Sensitivity Analysis of Hybrid Constraints
We investigate whether excluding the algorithmic independence loss or contrastive loss would impact its performance under varying annotation ratios, presented in Table 7. When both and are removed, there is a 3.4% drop in DSC as the annotation ratio decreases from 50% to 25%, which is larger than the 2.7% and 2.8% DSC decreases observed when or is excluded, respectively. Notably, the DSC of HCS-TNAS decreases by 1.7%, representing the smallest drop among these cases. These results align with our expectations as encourages the creation of complementary networks that assist in training by providing multi-view information from the same data, especially when focusing on the convolution layers responsible for feature extraction and aggregation. Additionally, as for , by considering feature-level uncertainty in SSL, the enhanced underlying structural information between the locally aware CNN and the globally aware Transformer is facilitated. Specifically, regions with lower uncertainty are filtered out, which contributes to stable training under limited annotations.
4.5. Study on Hyper-parameter Sensitivity
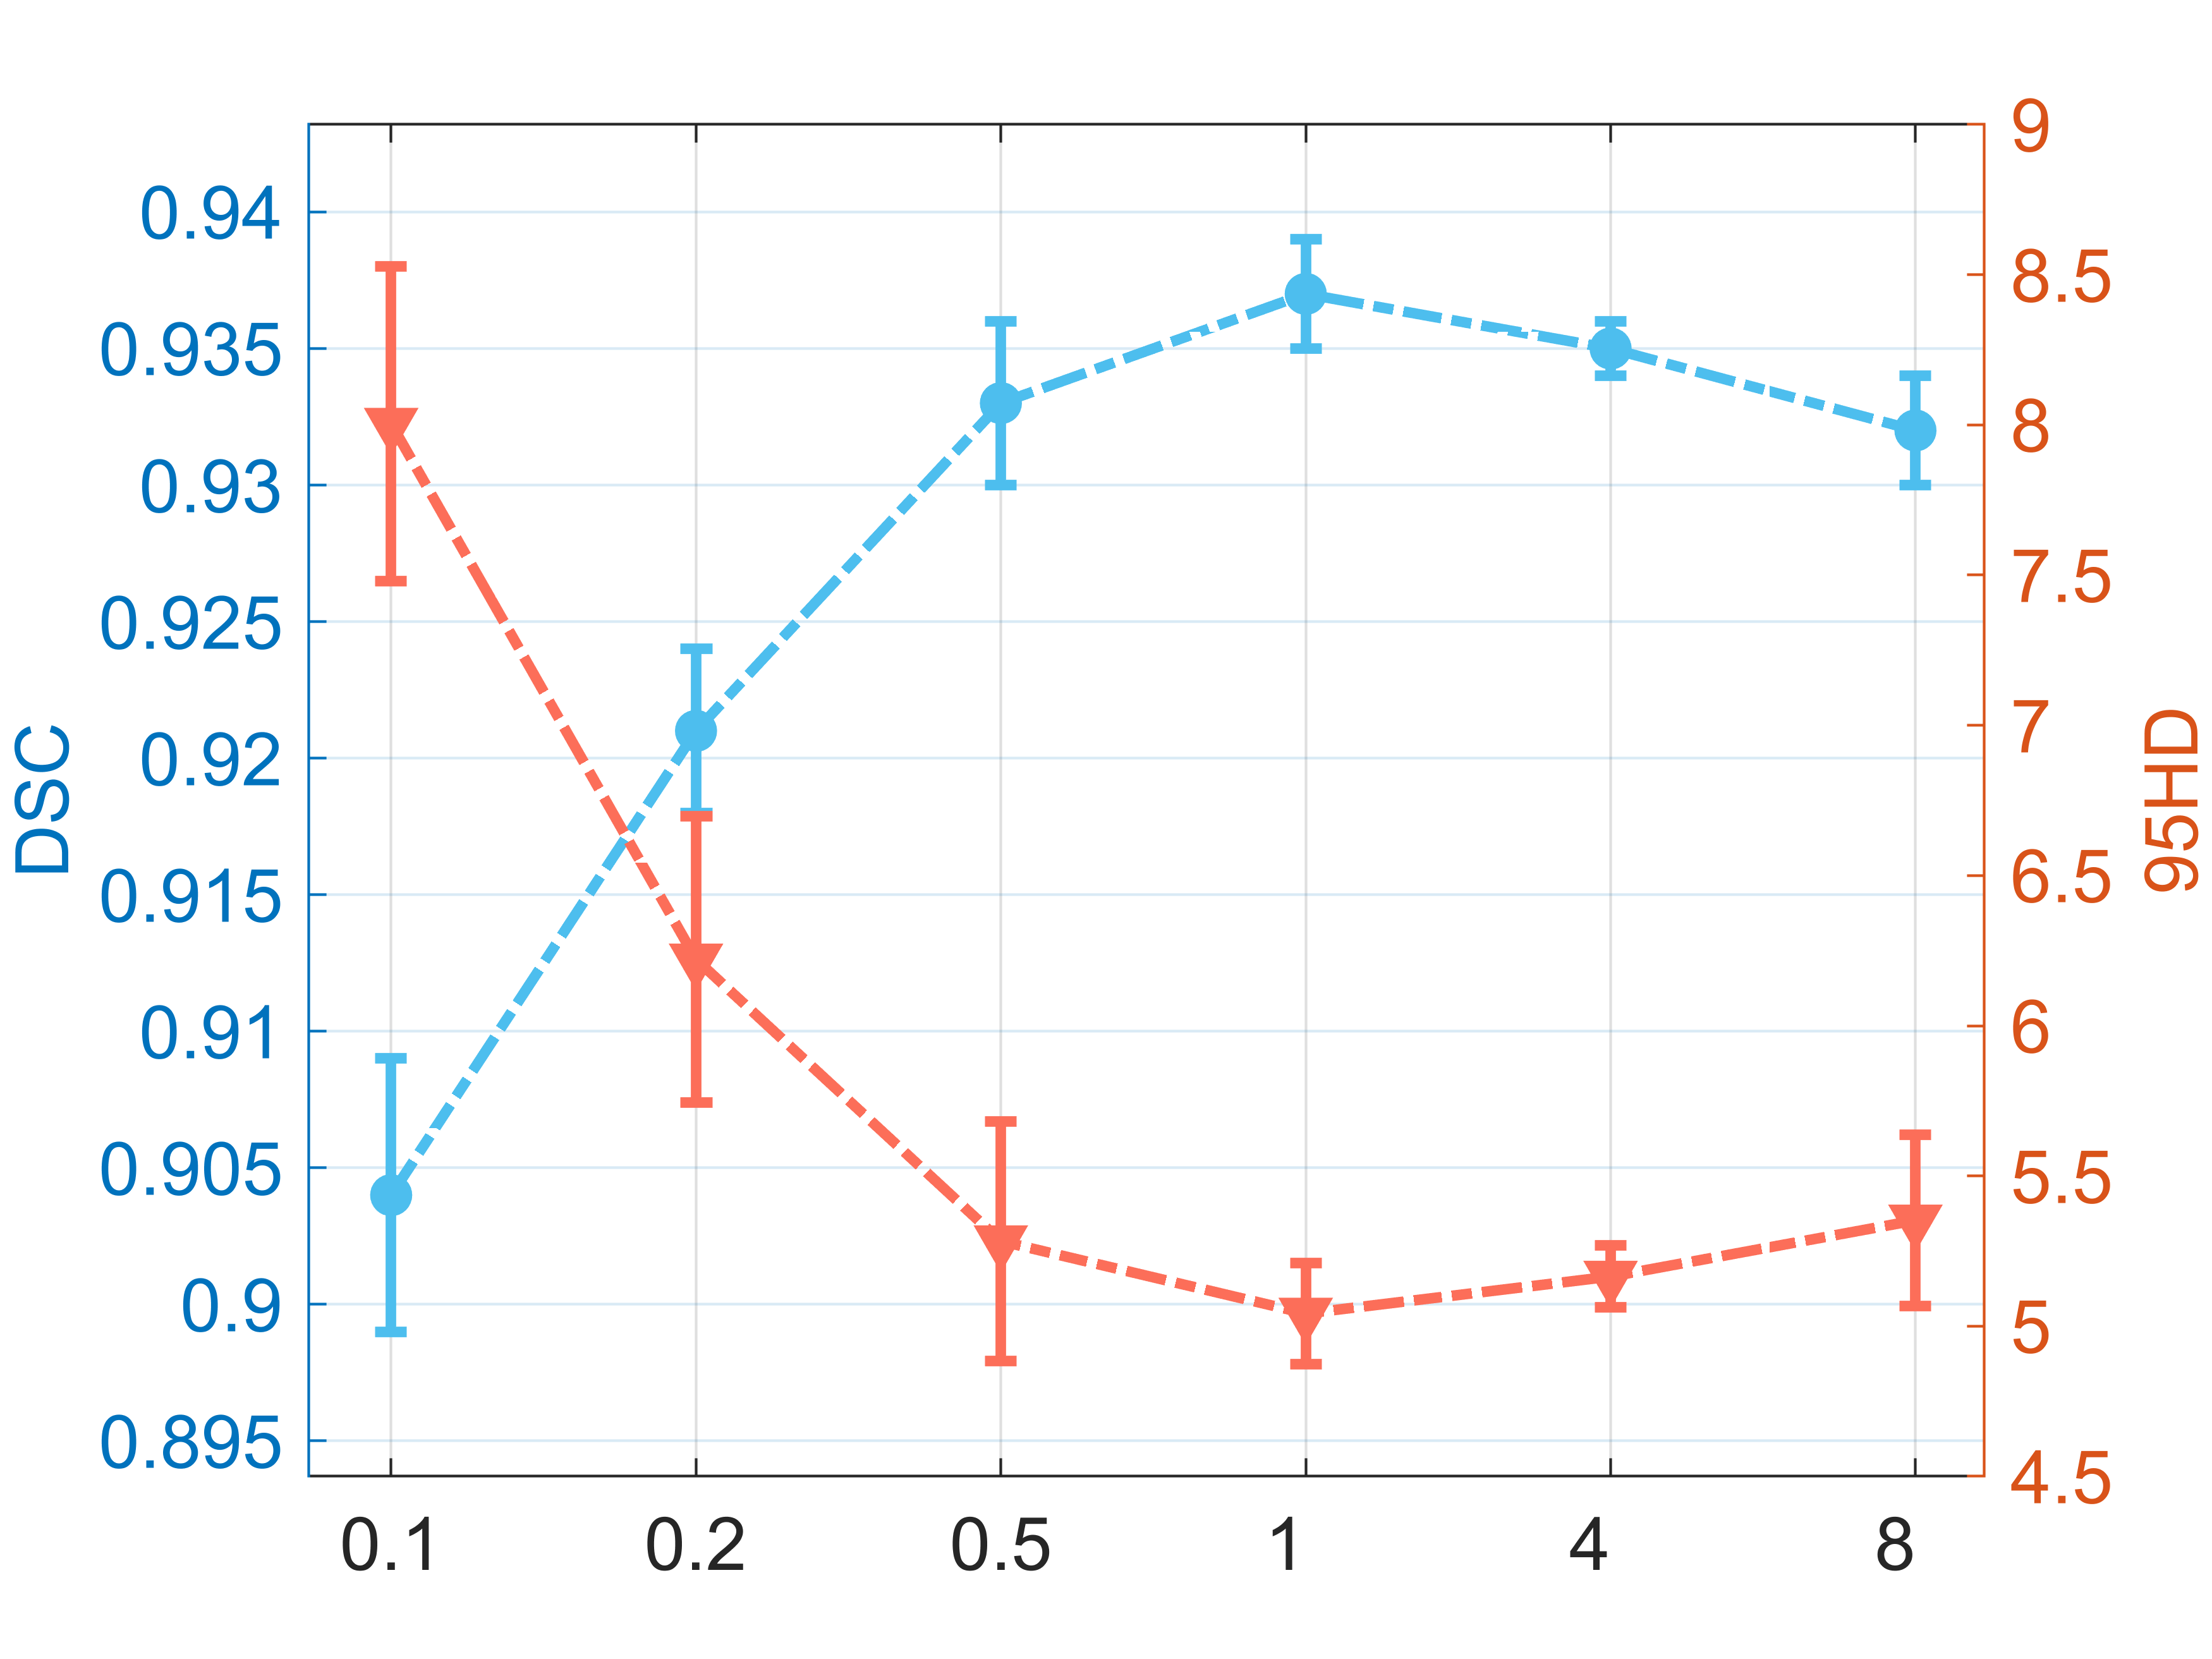
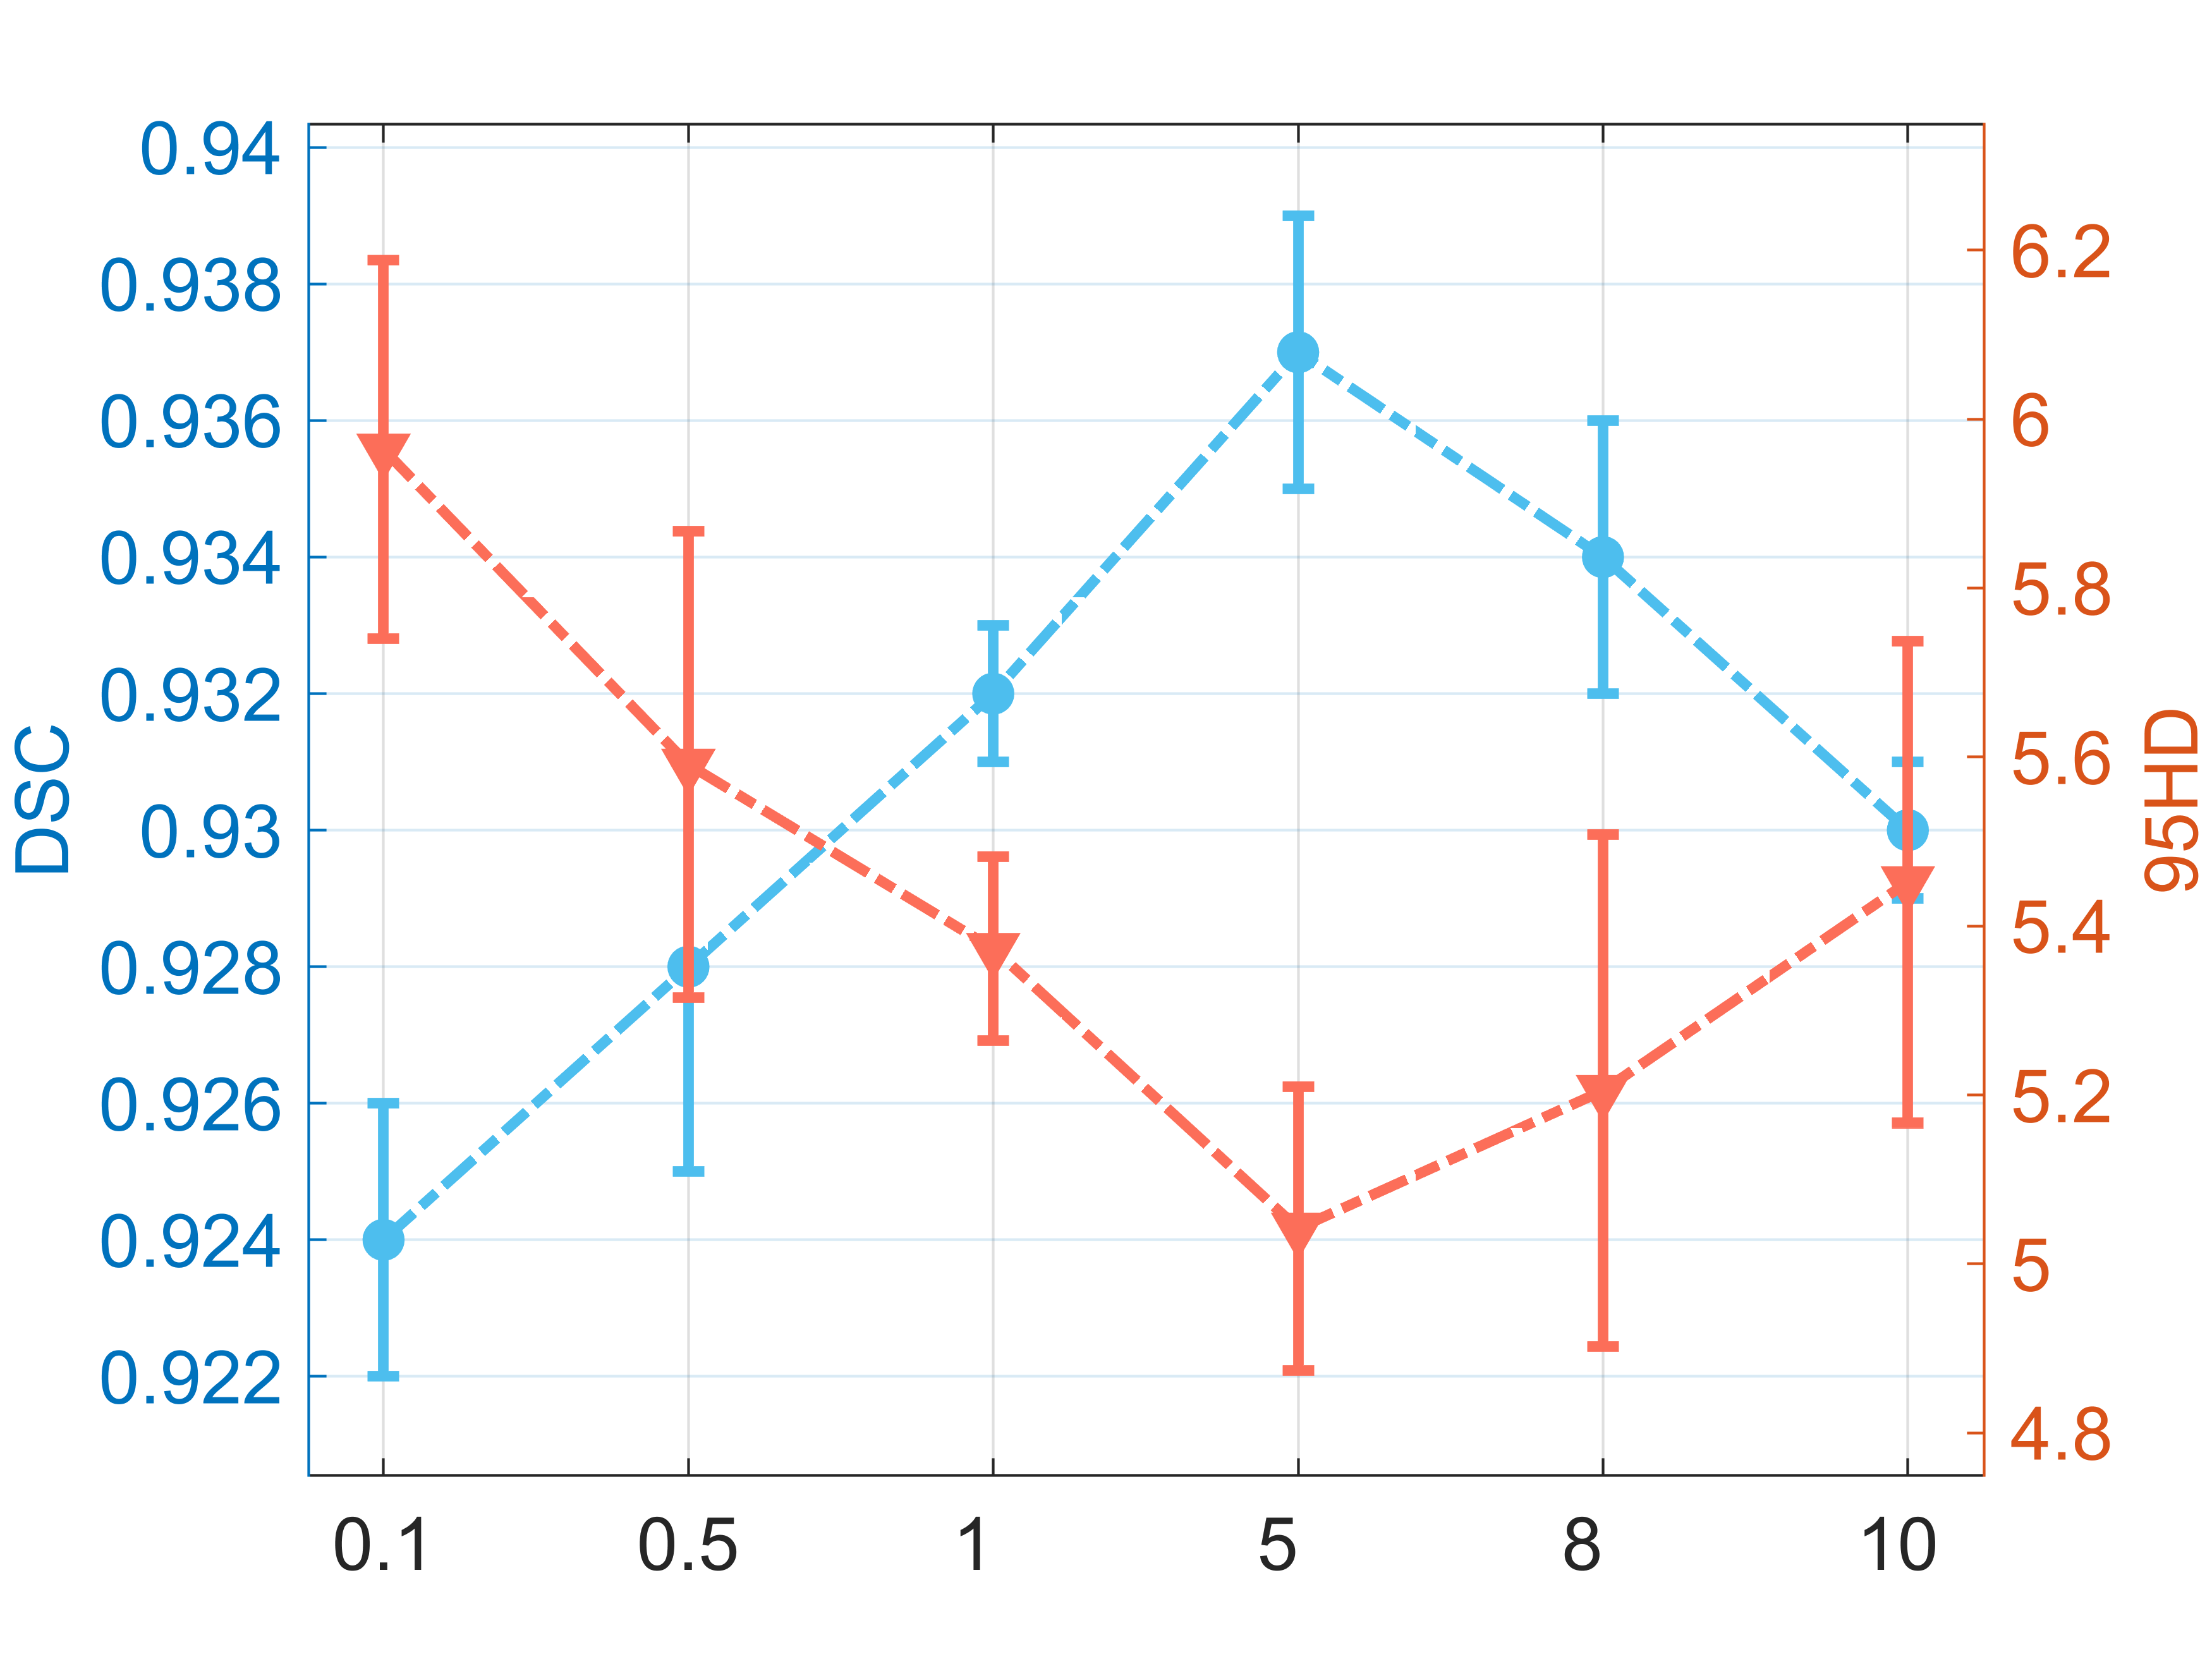
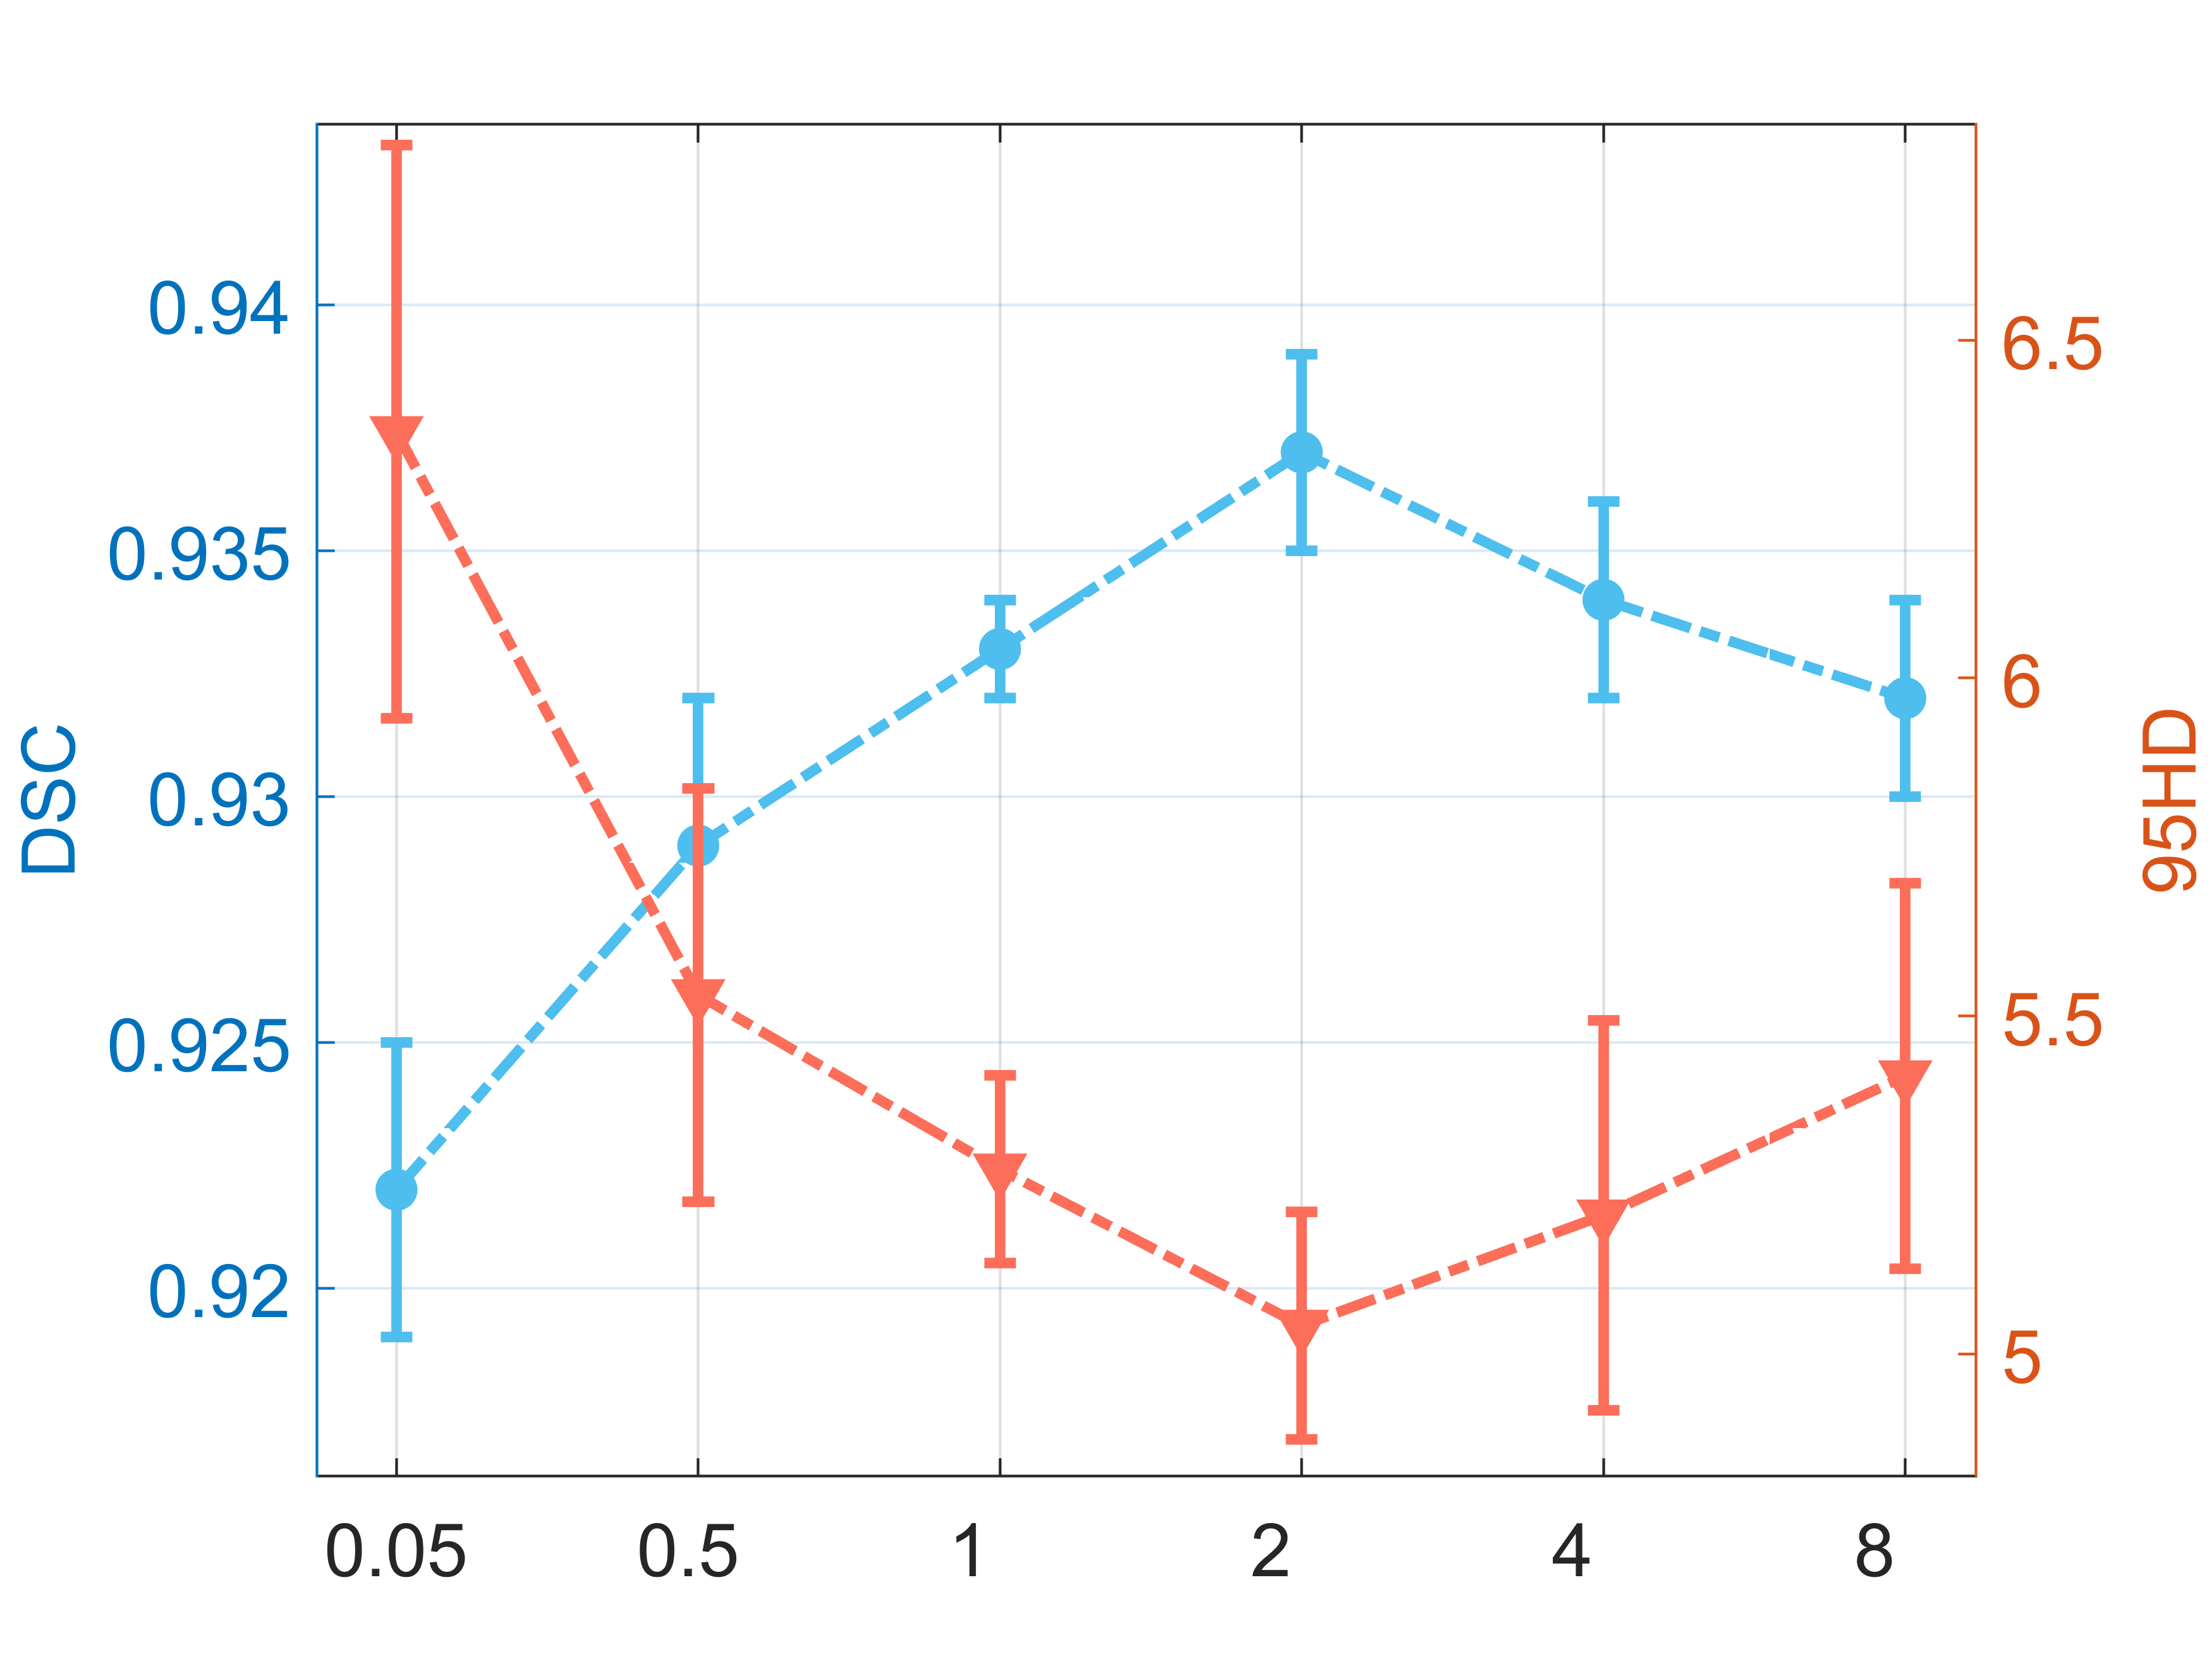
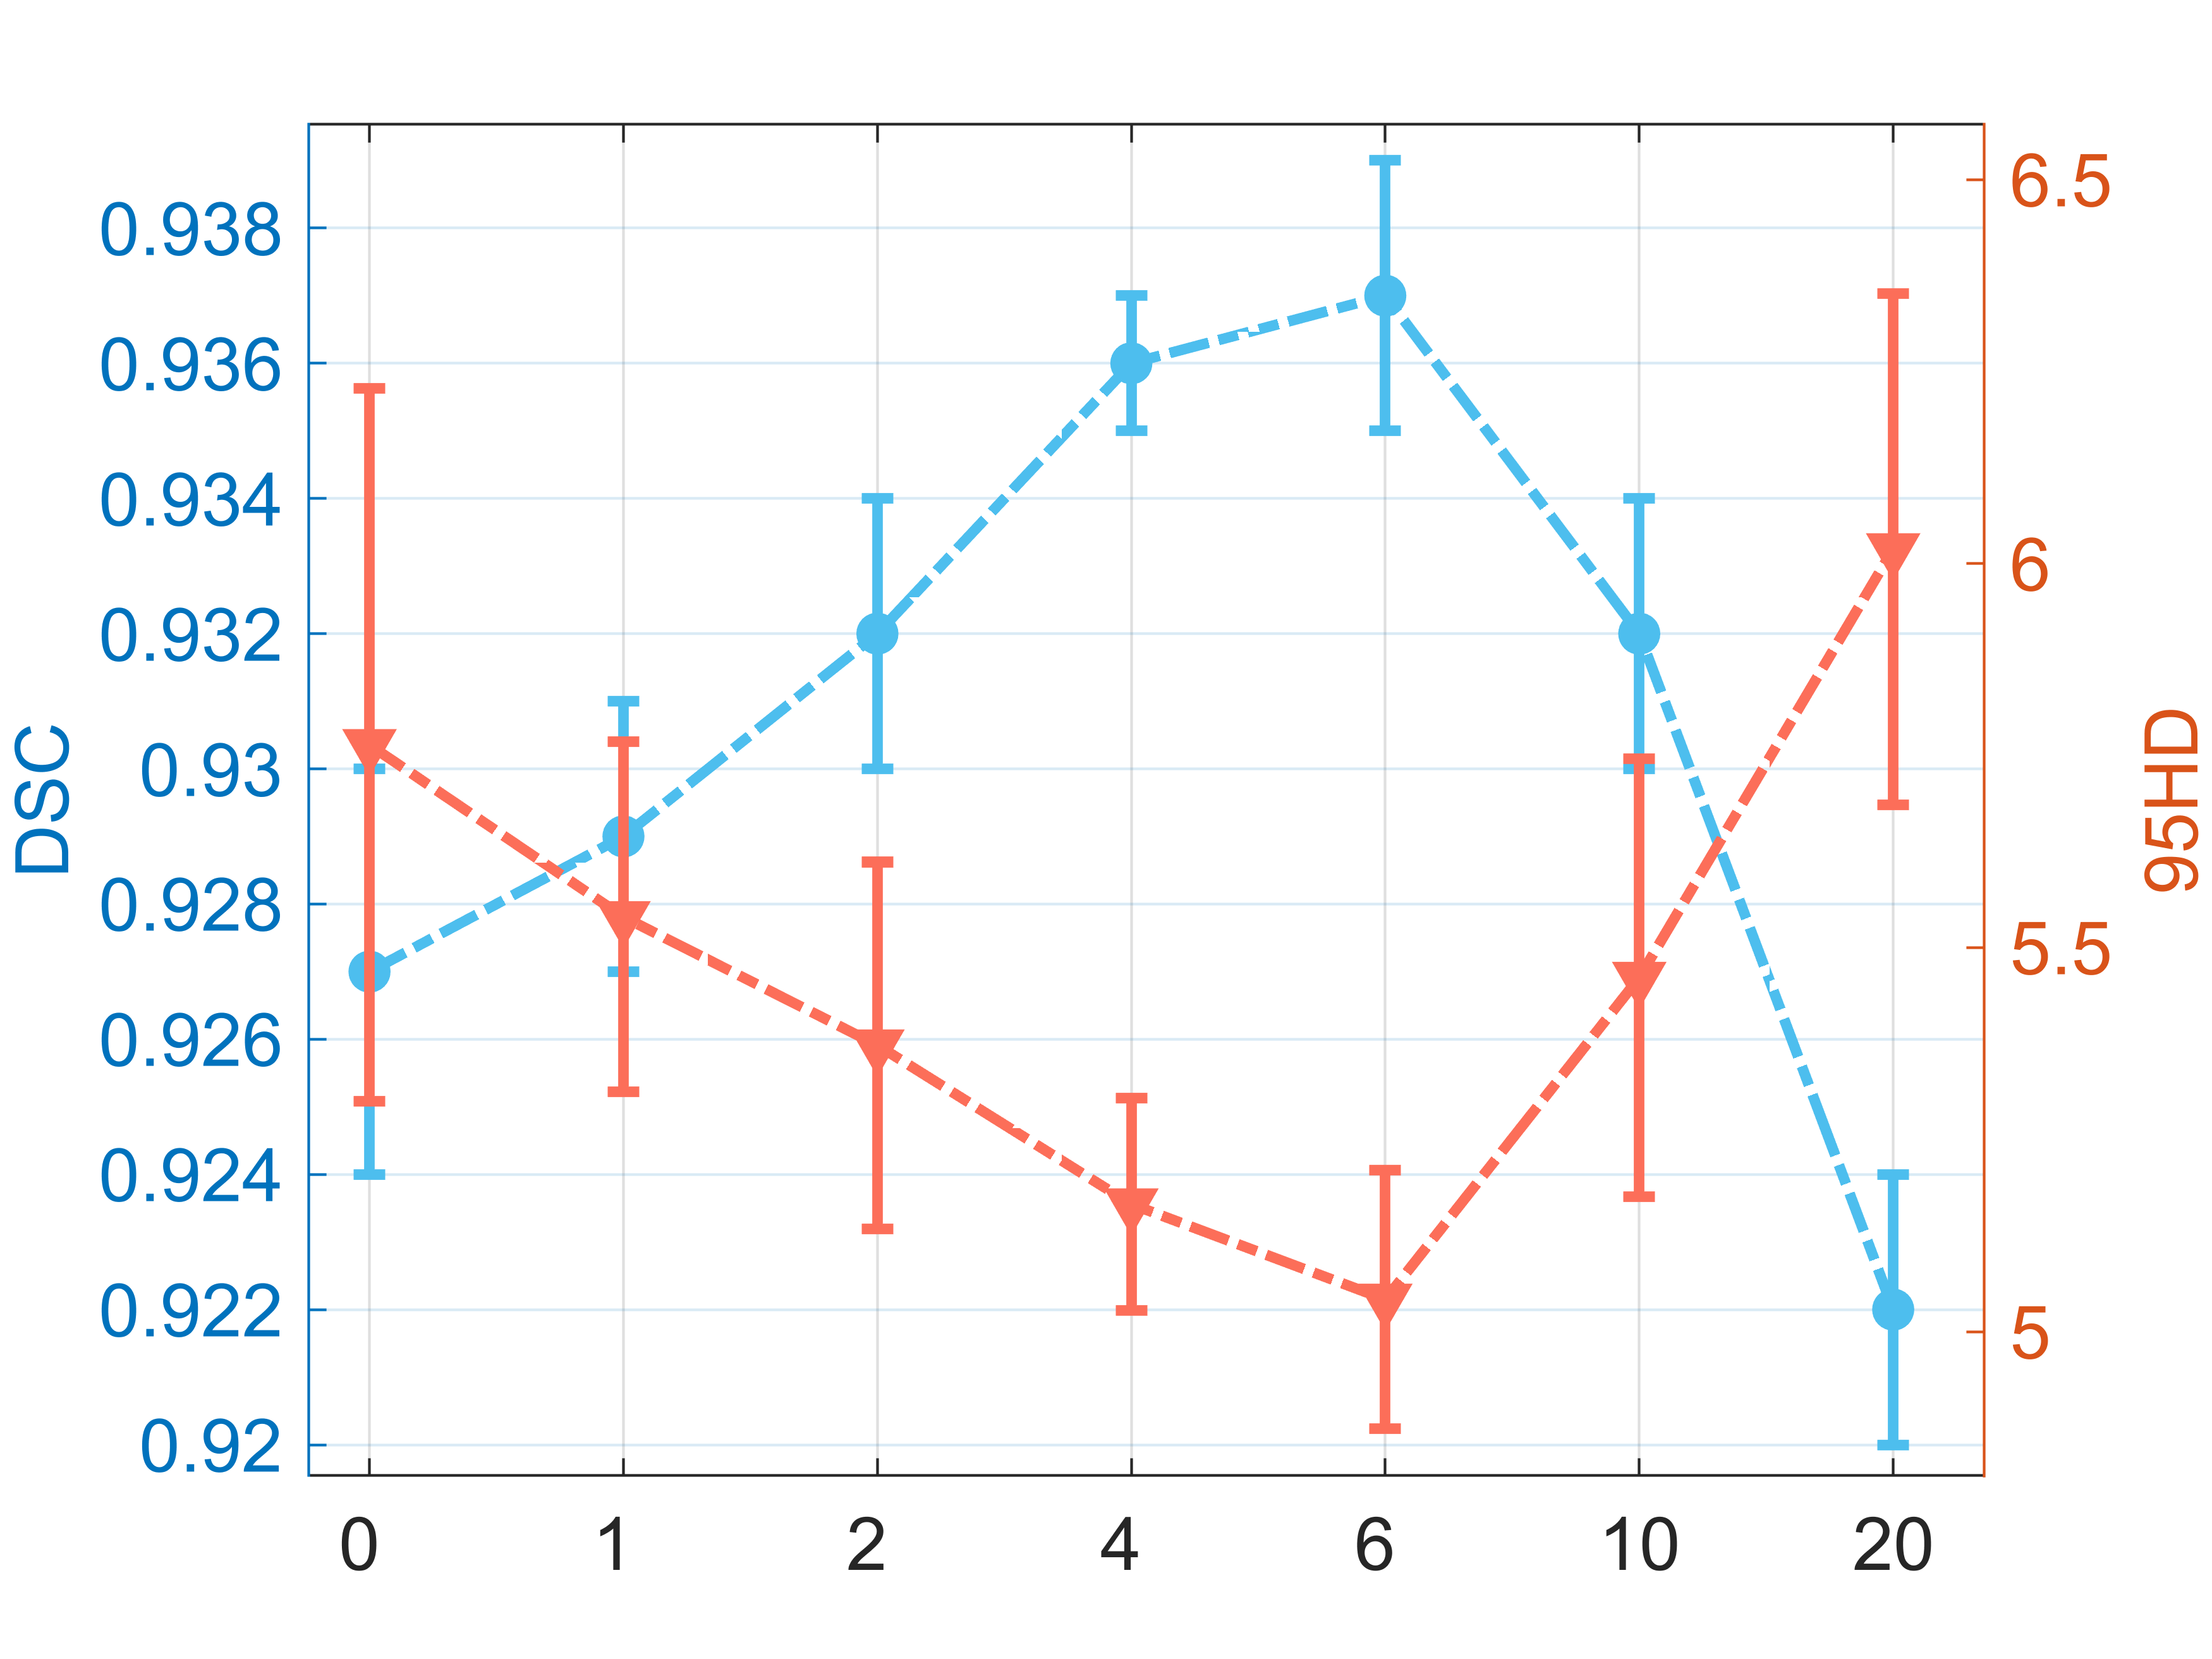
The sensitivity of our method to different hyper-parameter settings under a 50% annotation ratio is illustrated in Fig. 5. As shown in Fig. 5(a), the fluctuations in DSC caused by varying indicate that the supervised loss plays a dominant role. From Fig. 5(b), we observe that assigning a low weight to the initial value of weakens the role of the co-training while setting it too high causes HCS-TNAS to deviate from the main segmentation task. This principle is also applicable to the contrastive loss coefficient . As observed in Fig. 5(c) and (d), the degree of emphasis on network independence has an obvious influence. When and , we obtain the highest DSC, whereas assigning a small weight to the independence loss fails to utilize the advantage of co-training, and a small number of iterations also lead to insufficient network independence estimation. On the other hand, an excessive focus on independence causes the NAS backbone to deviate from the optimum.
5. Conclusion
In this paper, we propose a hybrid constraint-driven semi-supervised Transformer-NAS (HCS-TNAS) to address two key challenges in ultrasound segmentation: enhance multi-scale feature understanding and mitigate data dependency. For the first issue, HCS-TNAS implements a three-level search strategy, coupled with an Efficient NAS-ViT module designed to enhance contextual feature extraction. For the second issue, we propose a hybrid constraint-driven SSL framework to boost model performance under limited annotations. Extensive experiments on three public datasets prove the effectiveness of the proposed method.
References
- (1)
- Ali et al. (2021) Yasser Ali, Farrokh Janabi-Sharifi, and Soosan Beheshti. 2021. Echocardiographic image segmentation using deep Res-U network. Biomedical Signal Processing and Control 64 (2021), 102248.
- Bachman et al. (2019) Philip Bachman, R Devon Hjelm, and William Buchwalter. 2019. Learning representations by maximizing mutual information across views. Advances in neural information processing systems 32 (2019).
- Bai et al. (2017) Wenjia Bai, Ozan Oktay, Matthew Sinclair, Hideaki Suzuki, Martin Rajchl, Giacomo Tarroni, Ben Glocker, Andrew King, Paul M Matthews, and Daniel Rueckert. 2017. Semi-supervised learning for network-based cardiac MR image segmentation. In Medical Image Computing and Computer-Assisted Intervention- MICCAI 2017: 20th International Conference, Quebec City, QC, Canada, September 11-13, 2017, Proceedings, Part II 20. Springer, 253–260.
- Bernard et al. (2015) Olivier Bernard, Johan G Bosch, Brecht Heyde, Martino Alessandrini, Daniel Barbosa, Sorina Camarasu-Pop, Frederic Cervenansky, Sébastien Valette, Oana Mirea, Michel Bernier, et al. 2015. Standardized evaluation system for left ventricular segmentation algorithms in 3D echocardiography. IEEE transactions on medical imaging 35, 4 (2015), 967–977.
- Cai et al. (2023) Han Cai, Junyan Li, Muyan Hu, Chuang Gan, and Song Han. 2023. Efficientvit: Lightweight multi-scale attention for high-resolution dense prediction. In Proceedings of the IEEE/CVF International Conference on Computer Vision. 17302–17313.
- Chen et al. (2021a) Jieneng Chen, Yongyi Lu, Qihang Yu, Xiangde Luo, Ehsan Adeli, Yan Wang, Le Lu, Alan L Yuille, and Yuyin Zhou. 2021a. Transunet: Transformers make strong encoders for medical image segmentation. arXiv preprint arXiv:2102.04306 (2021).
- Chen et al. (2024) Renqi Chen, Jingjing Luo, Fan Nian, Yuhui Cen, Yiheng Peng, and Zekuan Yu. 2024. SSHNN: Semi-Supervised Hybrid NAS Network for Echocardiographic Image Segmentation. In ICASSP 2024-2024 IEEE International Conference on Acoustics, Speech and Signal Processing (ICASSP). IEEE, 1541–1545.
- Chen et al. (2021b) Xiaokang Chen, Yuhui Yuan, Gang Zeng, and Jingdong Wang. 2021b. Semi-supervised semantic segmentation with cross pseudo supervision. In Proceedings of the IEEE/CVF Conference on Computer Vision and Pattern Recognition. 2613–2622.
- Dosovitskiy et al. (2020) Alexey Dosovitskiy, Lucas Beyer, Alexander Kolesnikov, Dirk Weissenborn, Xiaohua Zhai, Thomas Unterthiner, Mostafa Dehghani, Matthias Minderer, Georg Heigold, Sylvain Gelly, et al. 2020. An image is worth 16x16 words: Transformers for image recognition at scale. arXiv preprint arXiv:2010.11929 (2020).
- He et al. (2016) Kaiming He, Xiangyu Zhang, Shaoqing Ren, and Jian Sun. 2016. Deep residual learning for image recognition. In Proceedings of the IEEE conference on computer vision and pattern recognition. 770–778.
- Huang et al. (2023) Huimin Huang, Yawen Huang, Shiao Xie, Lanfen Lin, Tong Ruofeng, Yen-wei Chen, Yuexiang Li, and Yefeng Zheng. 2023. Semi-Supervised Convolutional Vision Transformer with Bi-Level Uncertainty Estimation for Medical Image Segmentation. In Proceedings of the 31st ACM International Conference on Multimedia. 5214–5222.
- Isensee et al. (2021) Fabian Isensee, Paul F Jaeger, Simon AA Kohl, Jens Petersen, and Klaus H Maier-Hein. 2021. nnU-Net: a self-configuring method for deep learning-based biomedical image segmentation. Nature methods 18, 2 (2021), 203–211.
- Kingma and Ba (2014) Diederik P Kingma and Jimmy Ba. 2014. Adam: A method for stochastic optimization. arXiv preprint arXiv:1412.6980 (2014).
- Kiranyaz et al. (2020) Serkan Kiranyaz, Aysen Degerli, Tahir Hamid, Rashid Mazhar, Rayyan El Fadil Ahmed, Rayaan Abouhasera, Morteza Zabihi, Junaid Malik, Ridha Hamila, and Moncef Gabbouj. 2020. Left ventricular wall motion estimation by active polynomials for acute myocardial infarction detection. IEEE Access 8 (2020), 210301–210317.
- Leclerc et al. (2019) Sarah Leclerc, Erik Smistad, Joao Pedrosa, Andreas Østvik, Frederic Cervenansky, Florian Espinosa, Torvald Espeland, Erik Andreas Rye Berg, Pierre-Marc Jodoin, Thomas Grenier, et al. 2019. Deep learning for segmentation using an open large-scale dataset in 2D echocardiography. IEEE transactions on medical imaging 38, 9 (2019), 2198–2210.
- Liu et al. (2019) Chenxi Liu, Liang-Chieh Chen, Florian Schroff, Hartwig Adam, Wei Hua, Alan L Yuille, and Li Fei-Fei. 2019. Auto-deeplab: Hierarchical neural architecture search for semantic image segmentation. In Proceedings of the IEEE/CVF conference on computer vision and pattern recognition. 82–92.
- Liu et al. (2018) Hanxiao Liu, Karen Simonyan, and Yiming Yang. 2018. Darts: Differentiable architecture search. arXiv preprint arXiv:1806.09055 (2018).
- Lu et al. (2022) Zexin Lu, Wenjun Xia, Yongqiang Huang, Mingzheng Hou, Hu Chen, Jiliu Zhou, Hongming Shan, and Yi Zhang. 2022. M 3 NAS: Multi-scale and multi-level memory-efficient neural architecture search for low-dose CT denoising. IEEE Transactions on Medical Imaging 42, 3 (2022), 850–863.
- Luo et al. (2021) Xiangde Luo, Wenjun Liao, Jieneng Chen, Tao Song, Yinan Chen, Shichuan Zhang, Nianyong Chen, Guotai Wang, and Shaoting Zhang. 2021. Efficient semi-supervised gross target volume of nasopharyngeal carcinoma segmentation via uncertainty rectified pyramid consistency. In Medical Image Computing and Computer Assisted Intervention–MICCAI 2021: 24th International Conference, Strasbourg, France, September 27–October 1, 2021, Proceedings, Part II 24. Springer, 318–329.
- Miao et al. (2023) Juzheng Miao, Cheng Chen, Furui Liu, Hao Wei, and Pheng-Ann Heng. 2023. CauSSL: Causality-inspired Semi-supervised Learning for Medical Image Segmentation. In Proceedings of the IEEE/CVF International Conference on Computer Vision. 21426–21437.
- Pauletto et al. (2022) Loïc Pauletto, Massih-Reza Amini, and Nicolas Winckler. 2022. Se 2 NAS: Self-Semi-Supervised architecture optimization for Semantic Segmentation. In 2022 26th International Conference on Pattern Recognition (ICPR). IEEE, 54–60.
- Qiao et al. (2018) Siyuan Qiao, Wei Shen, Zhishuai Zhang, Bo Wang, and Alan Yuille. 2018. Deep co-training for semi-supervised image recognition. In Proceedings of the european conference on computer vision (eccv). 135–152.
- Ren et al. (2021) Shenghan Ren, Yongbing Wang, Rui Hu, Lei Zuo, Liwen Liu, and Heng Zhao. 2021. Automated segmentation of left ventricular myocardium using cascading convolutional neural networks based on echocardiography. AIP Advances 11, 4 (2021).
- Ronneberger et al. (2015) Olaf Ronneberger, Philipp Fischer, and Thomas Brox. 2015. U-net: Convolutional networks for biomedical image segmentation. In Medical Image Computing and Computer-Assisted Intervention–MICCAI 2015: 18th International Conference, Munich, Germany, October 5-9, 2015, Proceedings, Part III 18. Springer, 234–241.
- Shen et al. (2022) Ning Shen, Tingfa Xu, Ziyang Bian, Shiqi Huang, Feng Mu, Bo Huang, Yuze Xiao, and Jianan Li. 2022. SCANet: A unified semi-supervised learning framework for vessel segmentation. IEEE Transactions on Medical Imaging (2022).
- Tarvainen and Valpola (2017) Antti Tarvainen and Harri Valpola. 2017. Mean teachers are better role models: Weight-averaged consistency targets improve semi-supervised deep learning results. Advances in neural information processing systems 30 (2017).
- Wang et al. (2021) Guotai Wang, Shuwei Zhai, Giovanni Lasio, Baoshe Zhang, Byong Yi, Shifeng Chen, Thomas J Macvittie, Dimitris Metaxas, Jinghao Zhou, and Shaoting Zhang. 2021. Semi-supervised segmentation of radiation-induced pulmonary fibrosis from lung CT scans with multi-scale guided dense attention. IEEE transactions on medical imaging 41, 3 (2021), 531–542.
- Weng et al. (2019) Yu Weng, Tianbao Zhou, Yujie Li, and Xiaoyu Qiu. 2019. Nas-unet: Neural architecture search for medical image segmentation. IEEE access 7 (2019), 44247–44257.
- Wu et al. (2022) Huisi Wu, Jiasheng Liu, Fangyan Xiao, Zhenkun Wen, Lan Cheng, and Jing Qin. 2022. Semi-supervised segmentation of echocardiography videos via noise-resilient spatiotemporal semantic calibration and fusion. Medical Image Analysis 78 (2022), 102397.
- Xia et al. (2020) Yingda Xia, Dong Yang, Zhiding Yu, Fengze Liu, Jinzheng Cai, Lequan Yu, Zhuotun Zhu, Daguang Xu, Alan Yuille, and Holger Roth. 2020. Uncertainty-aware multi-view co-training for semi-supervised medical image segmentation and domain adaptation. Medical image analysis 65 (2020), 101766.
- Xu et al. (2019) Yuhui Xu, Lingxi Xie, Xiaopeng Zhang, Xin Chen, Guo-Jun Qi, Qi Tian, and Hongkai Xiong. 2019. Pc-darts: Partial channel connections for memory-efficient architecture search. arXiv preprint arXiv:1907.05737 (2019).
- Yang et al. (2023) Dong Yang, Ziyue Xu, Yufan He, Vishwesh Nath, Wenqi Li, Andriy Myronenko, Ali Hatamizadeh, Can Zhao, Holger R Roth, and Daguang Xu. 2023. DAST: Differentiable Architecture Search with Transformer for 3D Medical Image Segmentation. In International Conference on Medical Image Computing and Computer-Assisted Intervention. Springer, 747–756.
- Yu et al. (2016) Li Yu, Yi Guo, Yuanyuan Wang, Jinhua Yu, and Ping Chen. 2016. Segmentation of fetal left ventricle in echocardiographic sequences based on dynamic convolutional neural networks. IEEE Transactions on Biomedical Engineering 64, 8 (2016), 1886–1895.
- Yu et al. (2019) Lequan Yu, Shujun Wang, Xiaomeng Li, Chi-Wing Fu, and Pheng-Ann Heng. 2019. Uncertainty-aware self-ensembling model for semi-supervised 3D left atrium segmentation. In Medical Image Computing and Computer Assisted Intervention–MICCAI 2019: 22nd International Conference, Shenzhen, China, October 13–17, 2019, Proceedings, Part II 22. Springer, 605–613.
- Yu et al. (2023) Zhihong Yu, Feifei Lee, and Qiu Chen. 2023. HCT-net: hybrid CNN-transformer model based on a neural architecture search network for medical image segmentation. Applied Intelligence (2023), 1–17.
- Zhang et al. (2021b) Xiong Zhang, Hongmin Xu, Hong Mo, Jianchao Tan, Cheng Yang, Lei Wang, and Wenqi Ren. 2021b. Dcnas: Densely connected neural architecture search for semantic image segmentation. In Proceedings of the IEEE/CVF conference on computer vision and pattern recognition. 13956–13967.
- Zhang et al. (2021a) Yundong Zhang, Huiye Liu, and Qiang Hu. 2021a. Transfuse: Fusing transformers and cnns for medical image segmentation. In Medical Image Computing and Computer Assisted Intervention–MICCAI 2021: 24th International Conference, Strasbourg, France, September 27–October 1, 2021, Proceedings, Part I 24. Springer, 14–24.
- Zhou et al. (2023) Guang-Quan Zhou, Wen-Bo Zhang, Zhong-Qing Shi, Zhan-Ru Qi, Kai-Ni Wang, Hong Song, Jing Yao, and Yang Chen. 2023. DSANet: Dual-branch Shape-Aware Network for Echocardiography Segmentation in Apical Views. IEEE Journal of Biomedical and Health Informatics (2023).
- Zhou et al. (2019) Zongwei Zhou, Md Mahfuzur Rahman Siddiquee, Nima Tajbakhsh, and Jianming Liang. 2019. Unet++: Redesigning skip connections to exploit multiscale features in image segmentation. IEEE transactions on medical imaging 39, 6 (2019), 1856–1867.
Supplementary Material
In this supplementary material, we provide additional details and experimental results to enhance the understanding and insights into our proposed HCS-TNAS. This supplementary material is organized as follows:
-
•
A more detailed description of the role of architecture parameters for the NAS backbone in Sec. 3.3 is shown in Sec. A.
-
•
We provide more details about the employed datasets in Sec. B.1 and comprehensive analysis of the experimental results (under the experimental conditions presented in Sec. B.2) from the perspectives of training convergence, statistical significance testing, and proportions of candidate operations in Sec. B.3, B.4, and B.5, respectively.
- •
-
•
We also present additional parameter studies in Sec. D, discussing the impact of the network size.
-
•
Finally, we discuss the potential limitations of the proposed HCS-TNAS and future research directions in Sec. E.
Candidate Operations Encoder Cell Decoder Cell 33 separable convolution ✓ ✓ 55 separable convolution ✓ ✓ 33 convolution with dilation rate 2 ✓ ✓ 55 convolution with dilation rate 2 ✓ ✓ 33 average/max pooling ✓ ✗ skip connection ✓ ✓ no connection (zero) ✓ ✗
Appendix A More Details about HCS-TNAS
As we introduced in Sec. 3.3 of the main paper, the architecture parameters and are responsible for updating the candidate operations in the encoder and decoder cells, respectively. In HCS-TNAS, to enlarge the search space, unlike existing works where all cells share the same architecture parameters, our architecture parameters are defined as a 3-dimensional tuple (), and is defined as a 2-dimensional tuple ().
-
•
indicates that different cells are optimized by specialized parameters, overcoming the limitation of a simple cell type, and enabling a larger search space to be explored.
-
•
represents the connection between each intermediate node within a cell, which is used for feature aggregation at the intermediate nodes. Note that the decoder cell does not have this parameter to reduce the parameter count and training time.
-
•
denotes the number of operation types. As shown in Table 1, 8 different choices are provided for the encoder to ensure diversity in the selection, while 5 different choices are provided for the decoder. The rationale behind designing different candidate operation sets is discussed in Sec. C.1.
Thus, in the search process for the encoder and decoder cells, we allow different cells to have different structures, and different node-to-node connections to have different operations. This approach enables the network to have a vast search space and optimization potential without requiring a large number of layers.
Appendix B More Experimental Results
B.1. Dataset Details
CAMUS dataset. The CAMUS dataset (Leclerc et al., 2019) is a large open 2D echocardiography dataset collected from 500 patients. Each patient contributes a 4-chamber and a 2-chamber view sequence, each containing approximately 20 unlabeled images. Exceptions are made for annotations at the moments of end-diastole (ED) and end-systole (ES). Thus, there are 2000 labeled images and approximately 19000 unlabeled images. The segmentation labels include four categories: the left ventricle endocardium, the myocardium, the left atrium, and the background. All images are resized to 256256 pixels for training.
HMC-QU dataset. The HMC-QU dataset (Kiranyaz et al., 2020) is composed of 2D echocardiography videos from the apical 4-chamber (A4C) and apical 2-chamber (A2C) views. In a specific subset of HMC-QU dataset, 109 A4C view echocardiography recordings from 72 myocardial infarction (MI) patients and 37 non-MI subjects are annotated for one cardiac cycle. The remaining frames are unlabeled. Through the statistical analysis, the HMC-QU dataset consists of 4989 images in total, with 2349 images labeled for two categories: the left ventricle wall and the background. All images are resized to 192192 pixels for training.
CETUS dataset. The CETUS dataset (Bernard et al., 2015) comprises 90 sequences (both ED and ES) of 3D ultrasound volumes capturing one complete cardiac cycle, collected from 45 patients. It can be categorized into three subgroups: 15 healthy individuals, 15 patients with a history of myocardial infarction at least 3 months prior to data acquisition, and 15 patients with dilated cardiomyopathy. To address the non-uniform duration of left ventricle endocardium presence and ensure fairness, we randomly selected 80 frames from each sequence to form the dataset. Consequently, the selection process provides 7200 labeled images, all resized to 192192 pixels. The ground-truth mask consists of two distinct labels: the left ventricle endocardium and the background.
Fully-supervised Semi-supervised UNet++ nnU-Net Transfuse Auto-DeepLab M3NAS NasUNet UA-MT URPC CPS Se2NAS SSHNN-L HCS-TNAS (Zhou et al., 2019) (Isensee et al., 2021) (Zhang et al., 2021a) (Liu et al., 2019) (Lu et al., 2022) (Weng et al., 2019) (Yu et al., 2019) (Luo et al., 2021) (Chen et al., 2021b) (Pauletto et al., 2022) (Chen et al., 2024) HMC-QU - CETUS - CAMUS -
B.2. Implementation Details
Network Architecture. In the encoder NAS, each cell has intermediate nodes. For the resolution , the channel numbers are fixed as 8 for each node. When doubles, the number of channels doubles accordingly. For partial channel connections, of the channels are allowed for searching, following the settings in (Xu et al., 2019). The default number of layers is set to 8 and the default proportion of labeled data utilized is 50%.
Training Setup. The experiments are conducted using PyTorch on an Nvidia RTX 3090Ti GPU. The hyper-parameters , are adopted following (Yu et al., 2019; Huang et al., 2023) at the epoch, where , and . The linear coefficient matrices are optimized by Adam (Kingma and Ba, 2014) with a fixed learning rate of 0.001. The network weights and architecture parameters are optimized using SGD with an initial learning rate of 0,001, a momentum of 0.9, and a weight decay of 0.0003. For the architecture parameters and , the Adam optimizer is applied with a learning rate of 0.003 and weight decay of 0.001. The total number of epochs is set to and the architecture optimization begins at . In each epoch, is updated times.
B.3. Convergence Behavior
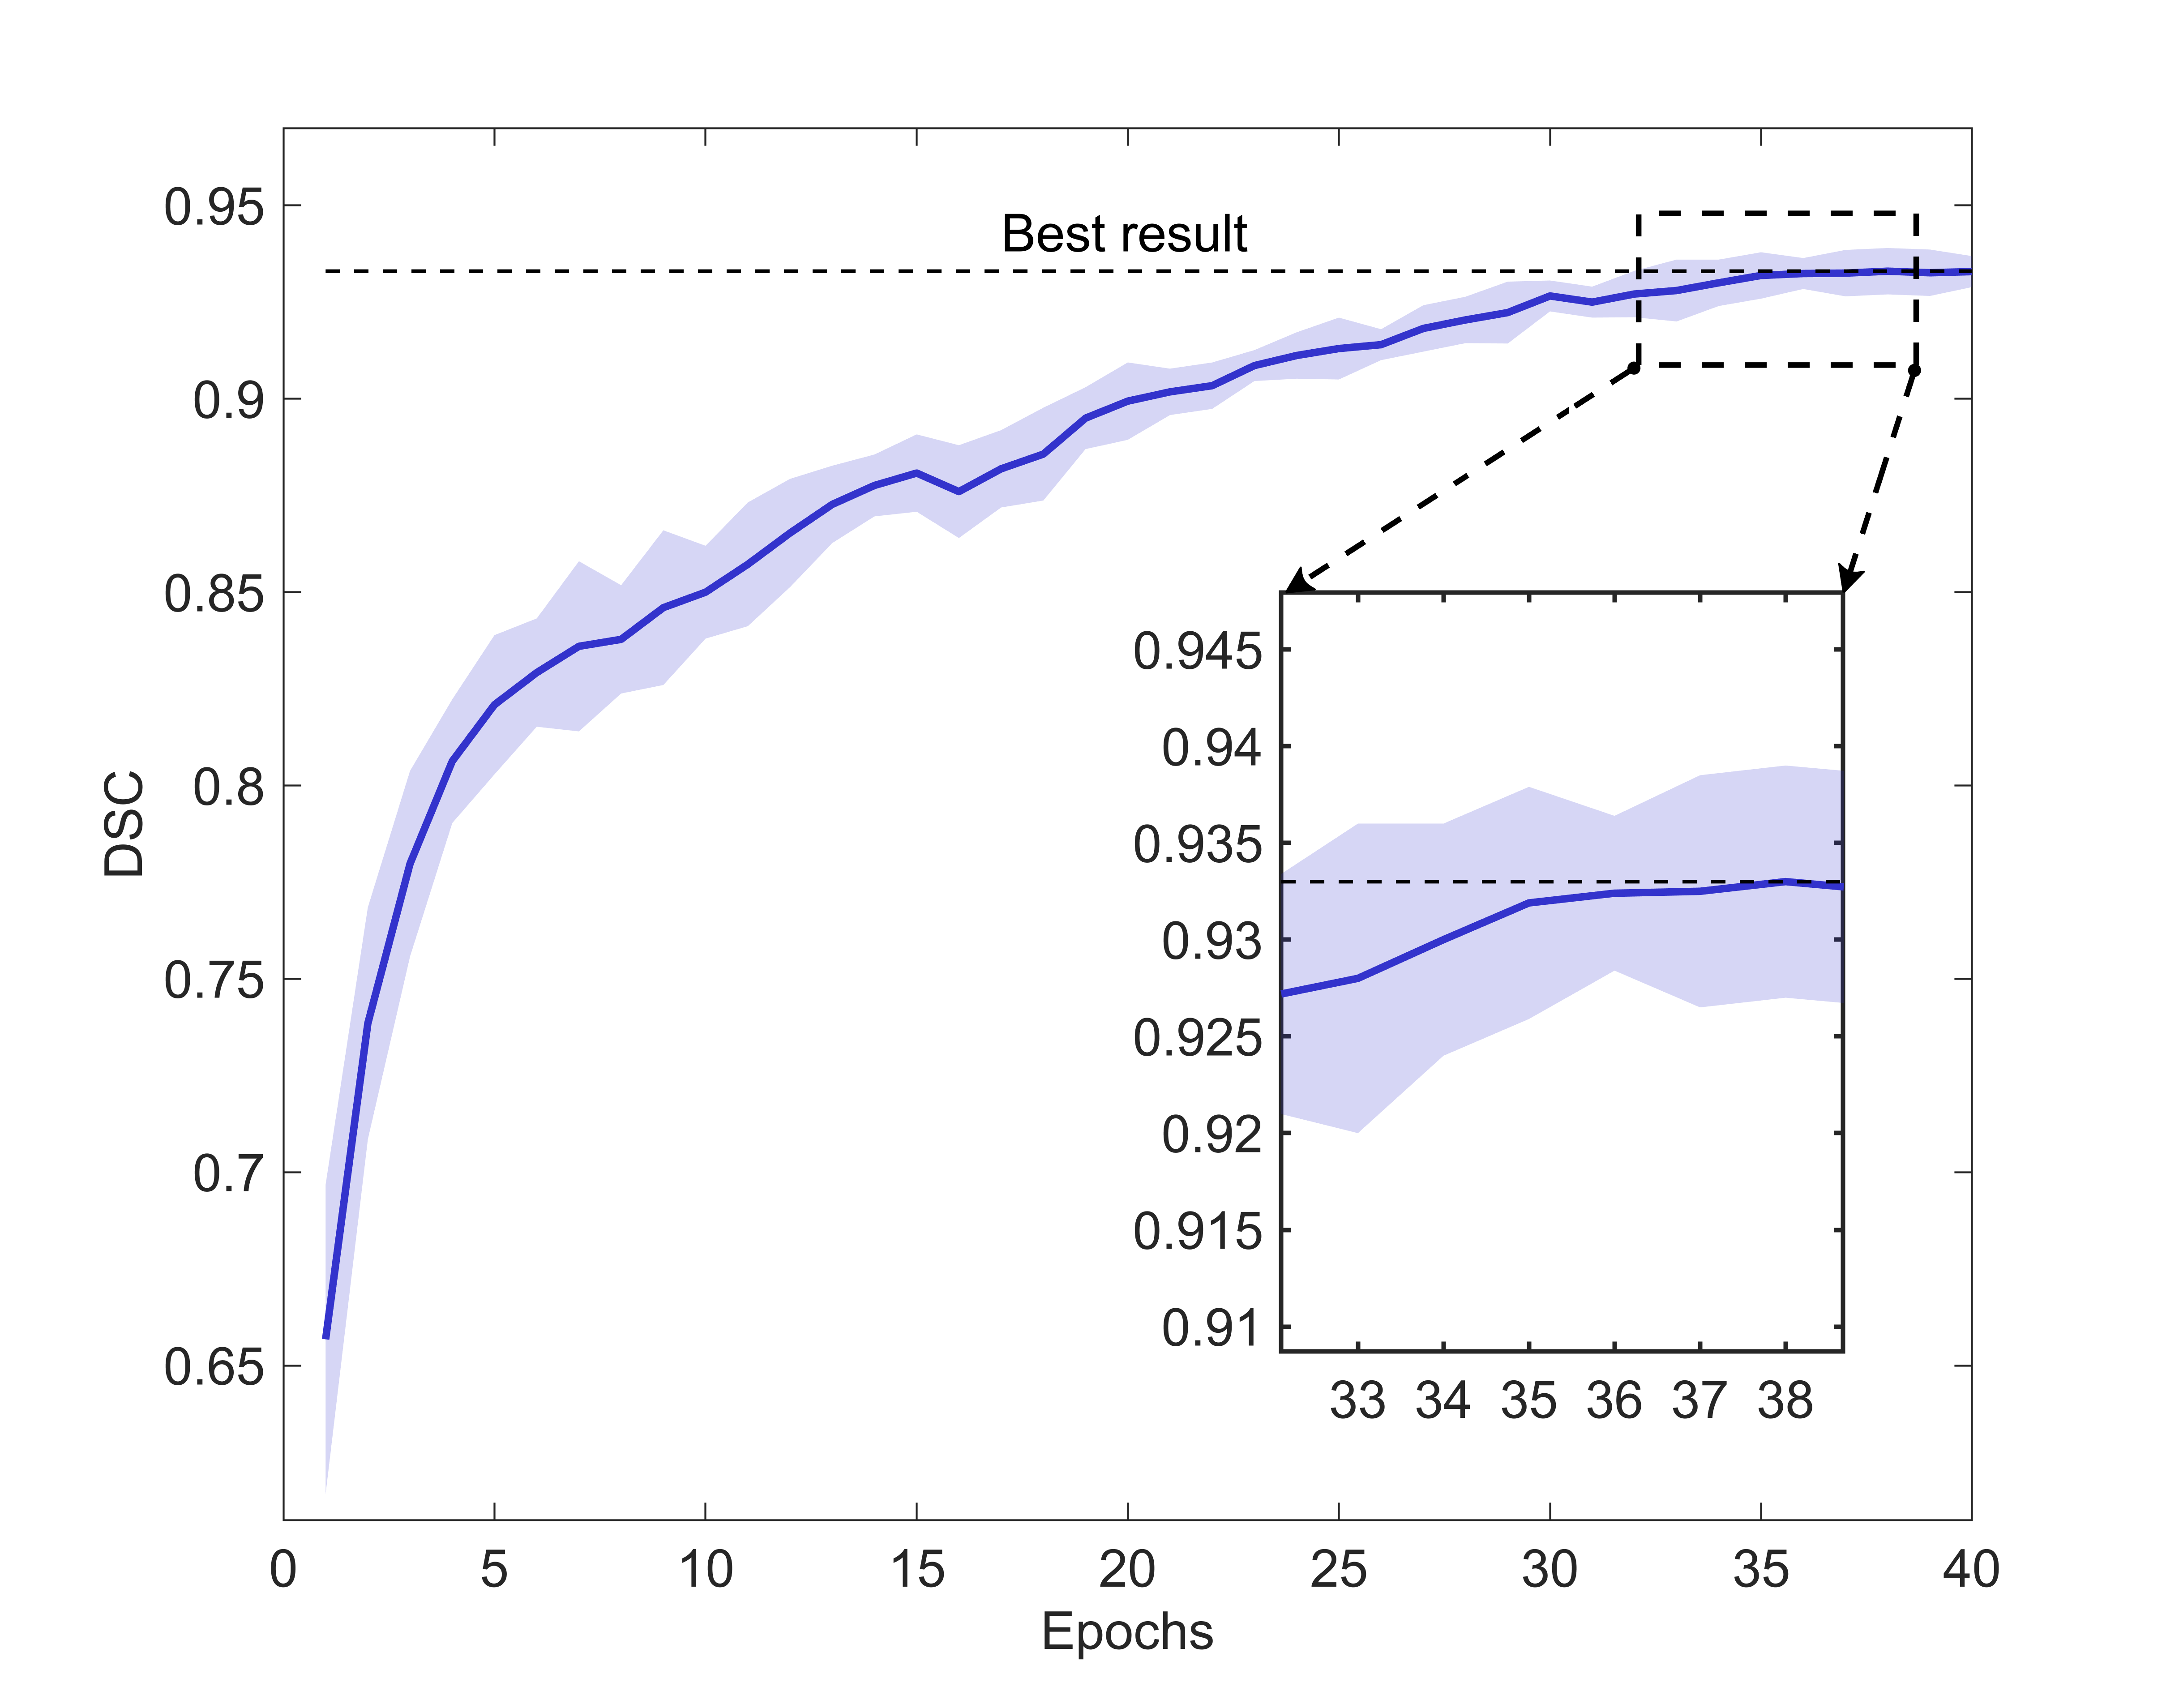
Fig. 6 depicts the validation accuracy trajectory over 40 epochs during the architecture search optimization process of HCS-TNAS in the metric of DSC, presenting our experimental results across 10 random trials on the HMC-QU dataset using 50% labeled data. While the deep blue curve represents the mean validation accuracy, the light blue shaded region around it suggests variability across trials. The validation accuracy curve exhibits an initial steep ascent, followed by a more gradual increase, ultimately converging close to 0.933. An inset magnifies the changes of the curve at final epochs, revealing minor fluctuations within a tight range during terminal convergence and presenting stability after 37 epochs. We also experimented with searching for longer epochs (50, 60, 70), but did not observe any significant benefit.
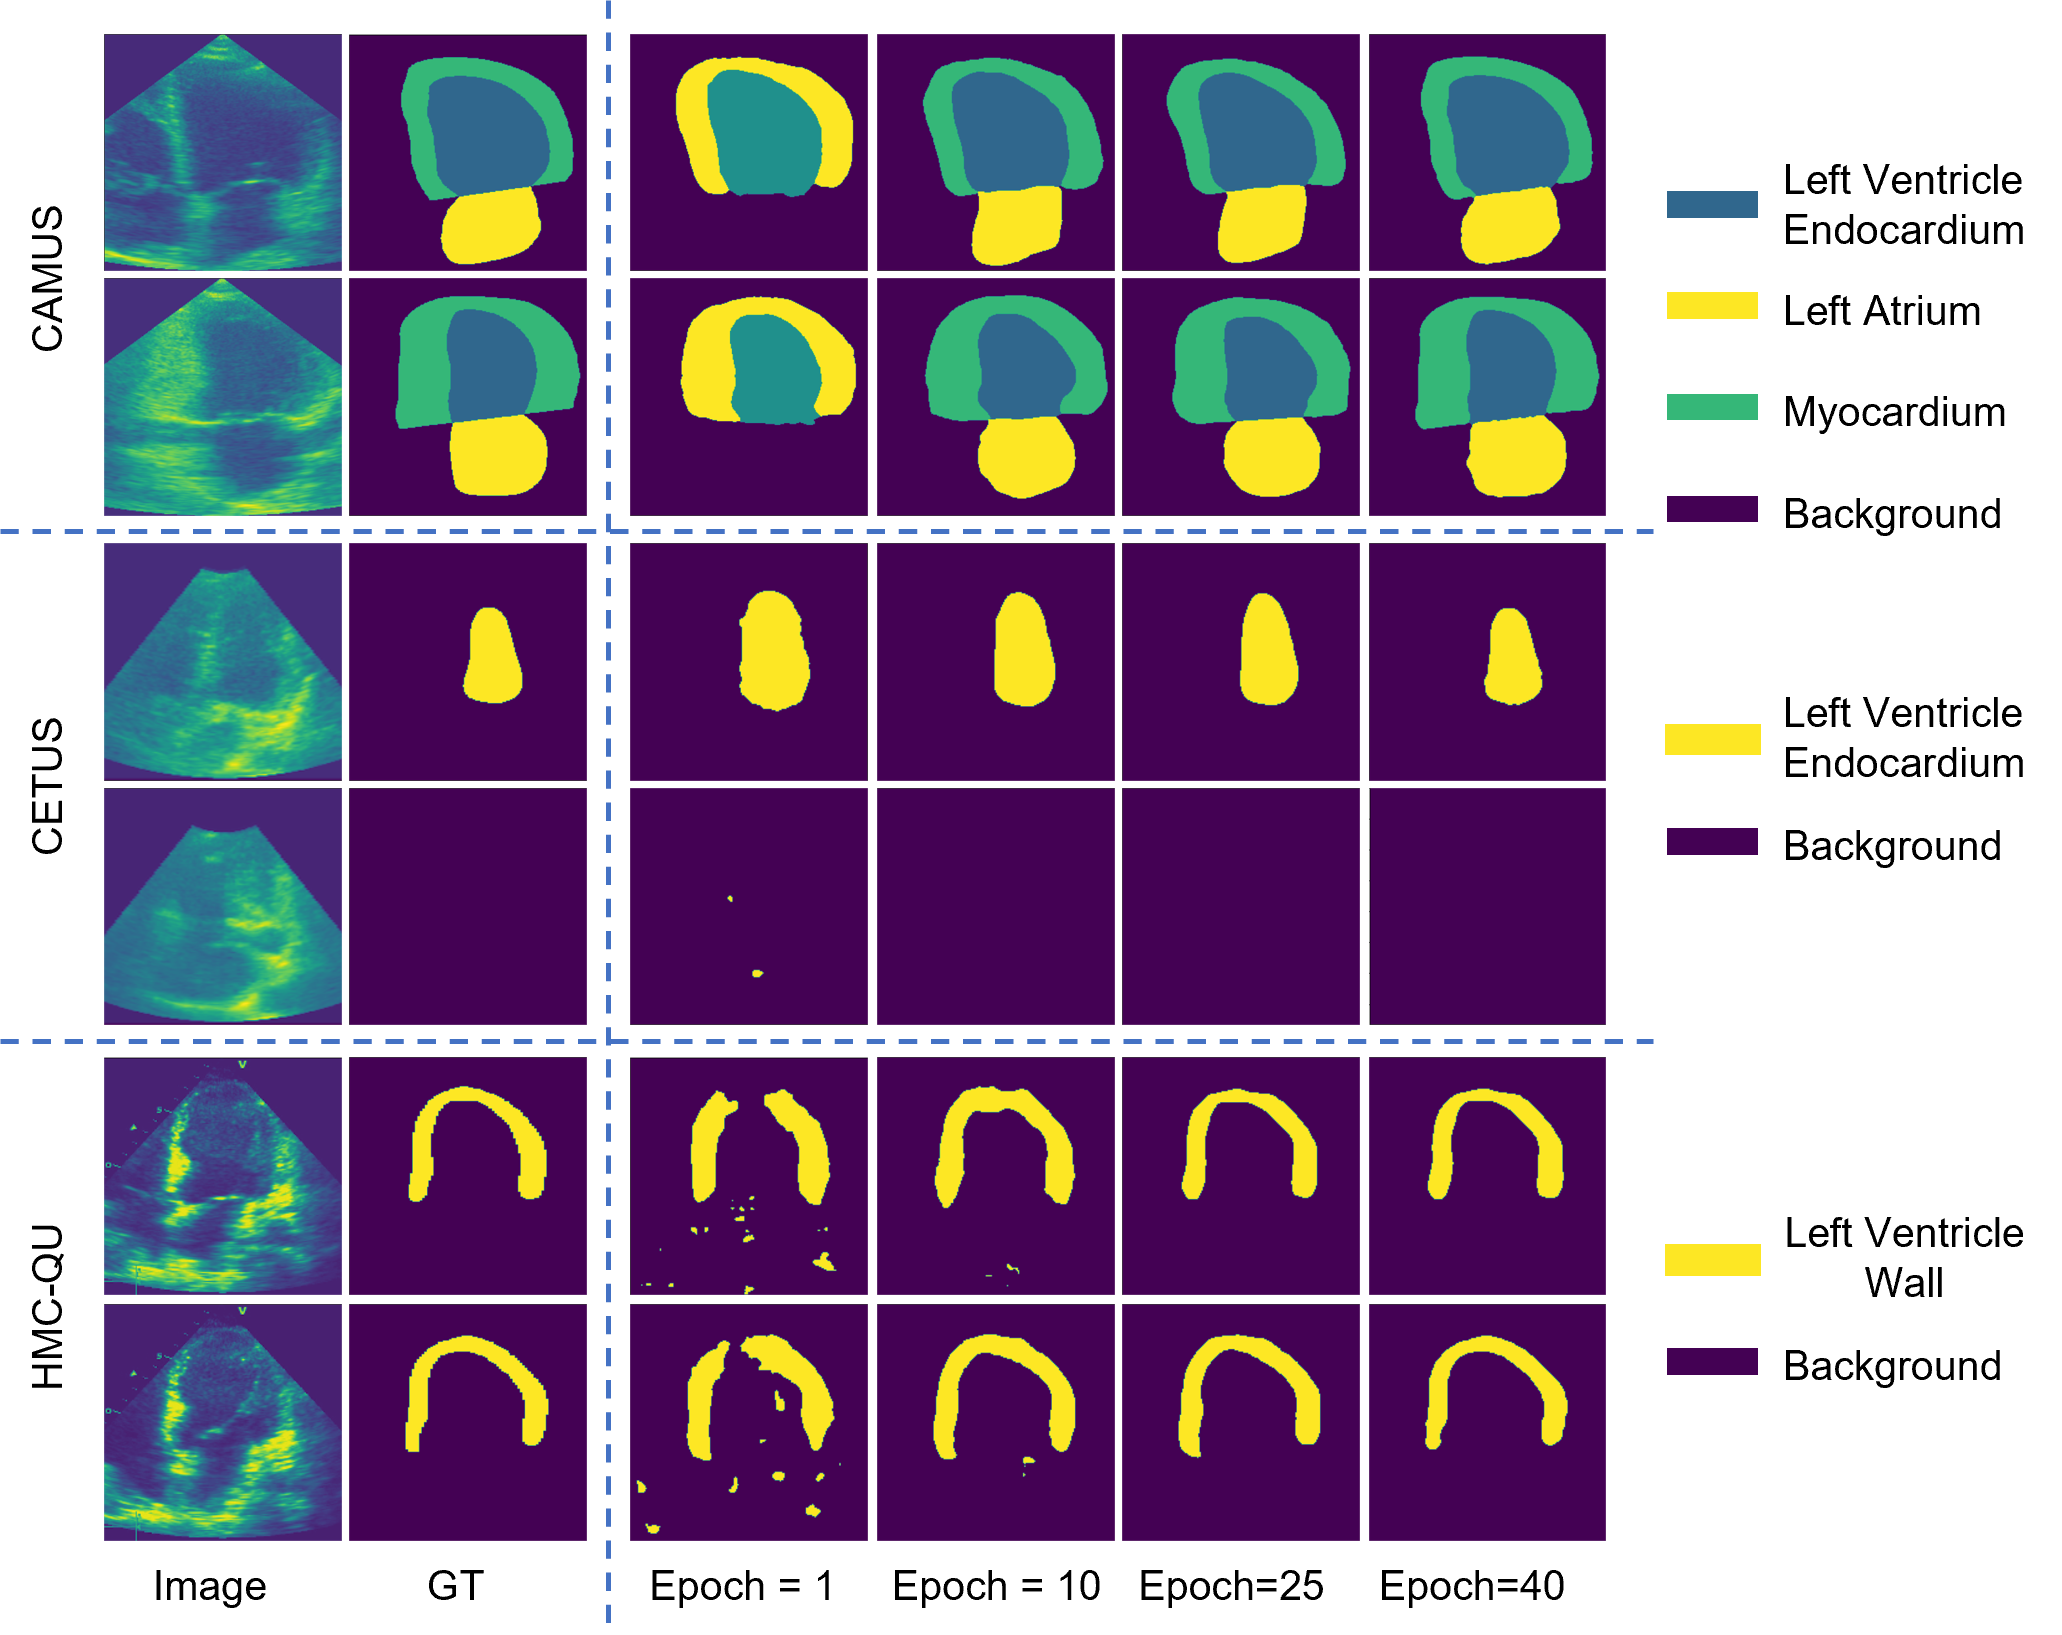
Fig. 7 illustrates the progressive refinement of segmentation predictions during the training process of the HCS-TNAS for ultrasound image segmentation on the CAMUS, CETUS, and HMC-QU datasets, offering an instructive portrayal of the model’s progressive enhancement in this clinically significant application.
B.4. Statistical Significance Test
We conducted a two-tailed paired -test on the DSC scores to analyze the statistical significance between HCS-TNAS and other advanced algorithms, as elaborated in Table 9. For each dataset, we used 200 test samples from the corresponding test sets. A -value less than 0.05 indicates a statistically significant difference between the comparing methods (Shen et al., 2022). The circular markers visually underscore the statistically significant improvement of the HCS-TNAS over the compared approaches, indicating its superiority over the other fully-supervised and semi-supervised techniques by a considerable margin.
B.5. Analysis on Candidate Operation Proportion
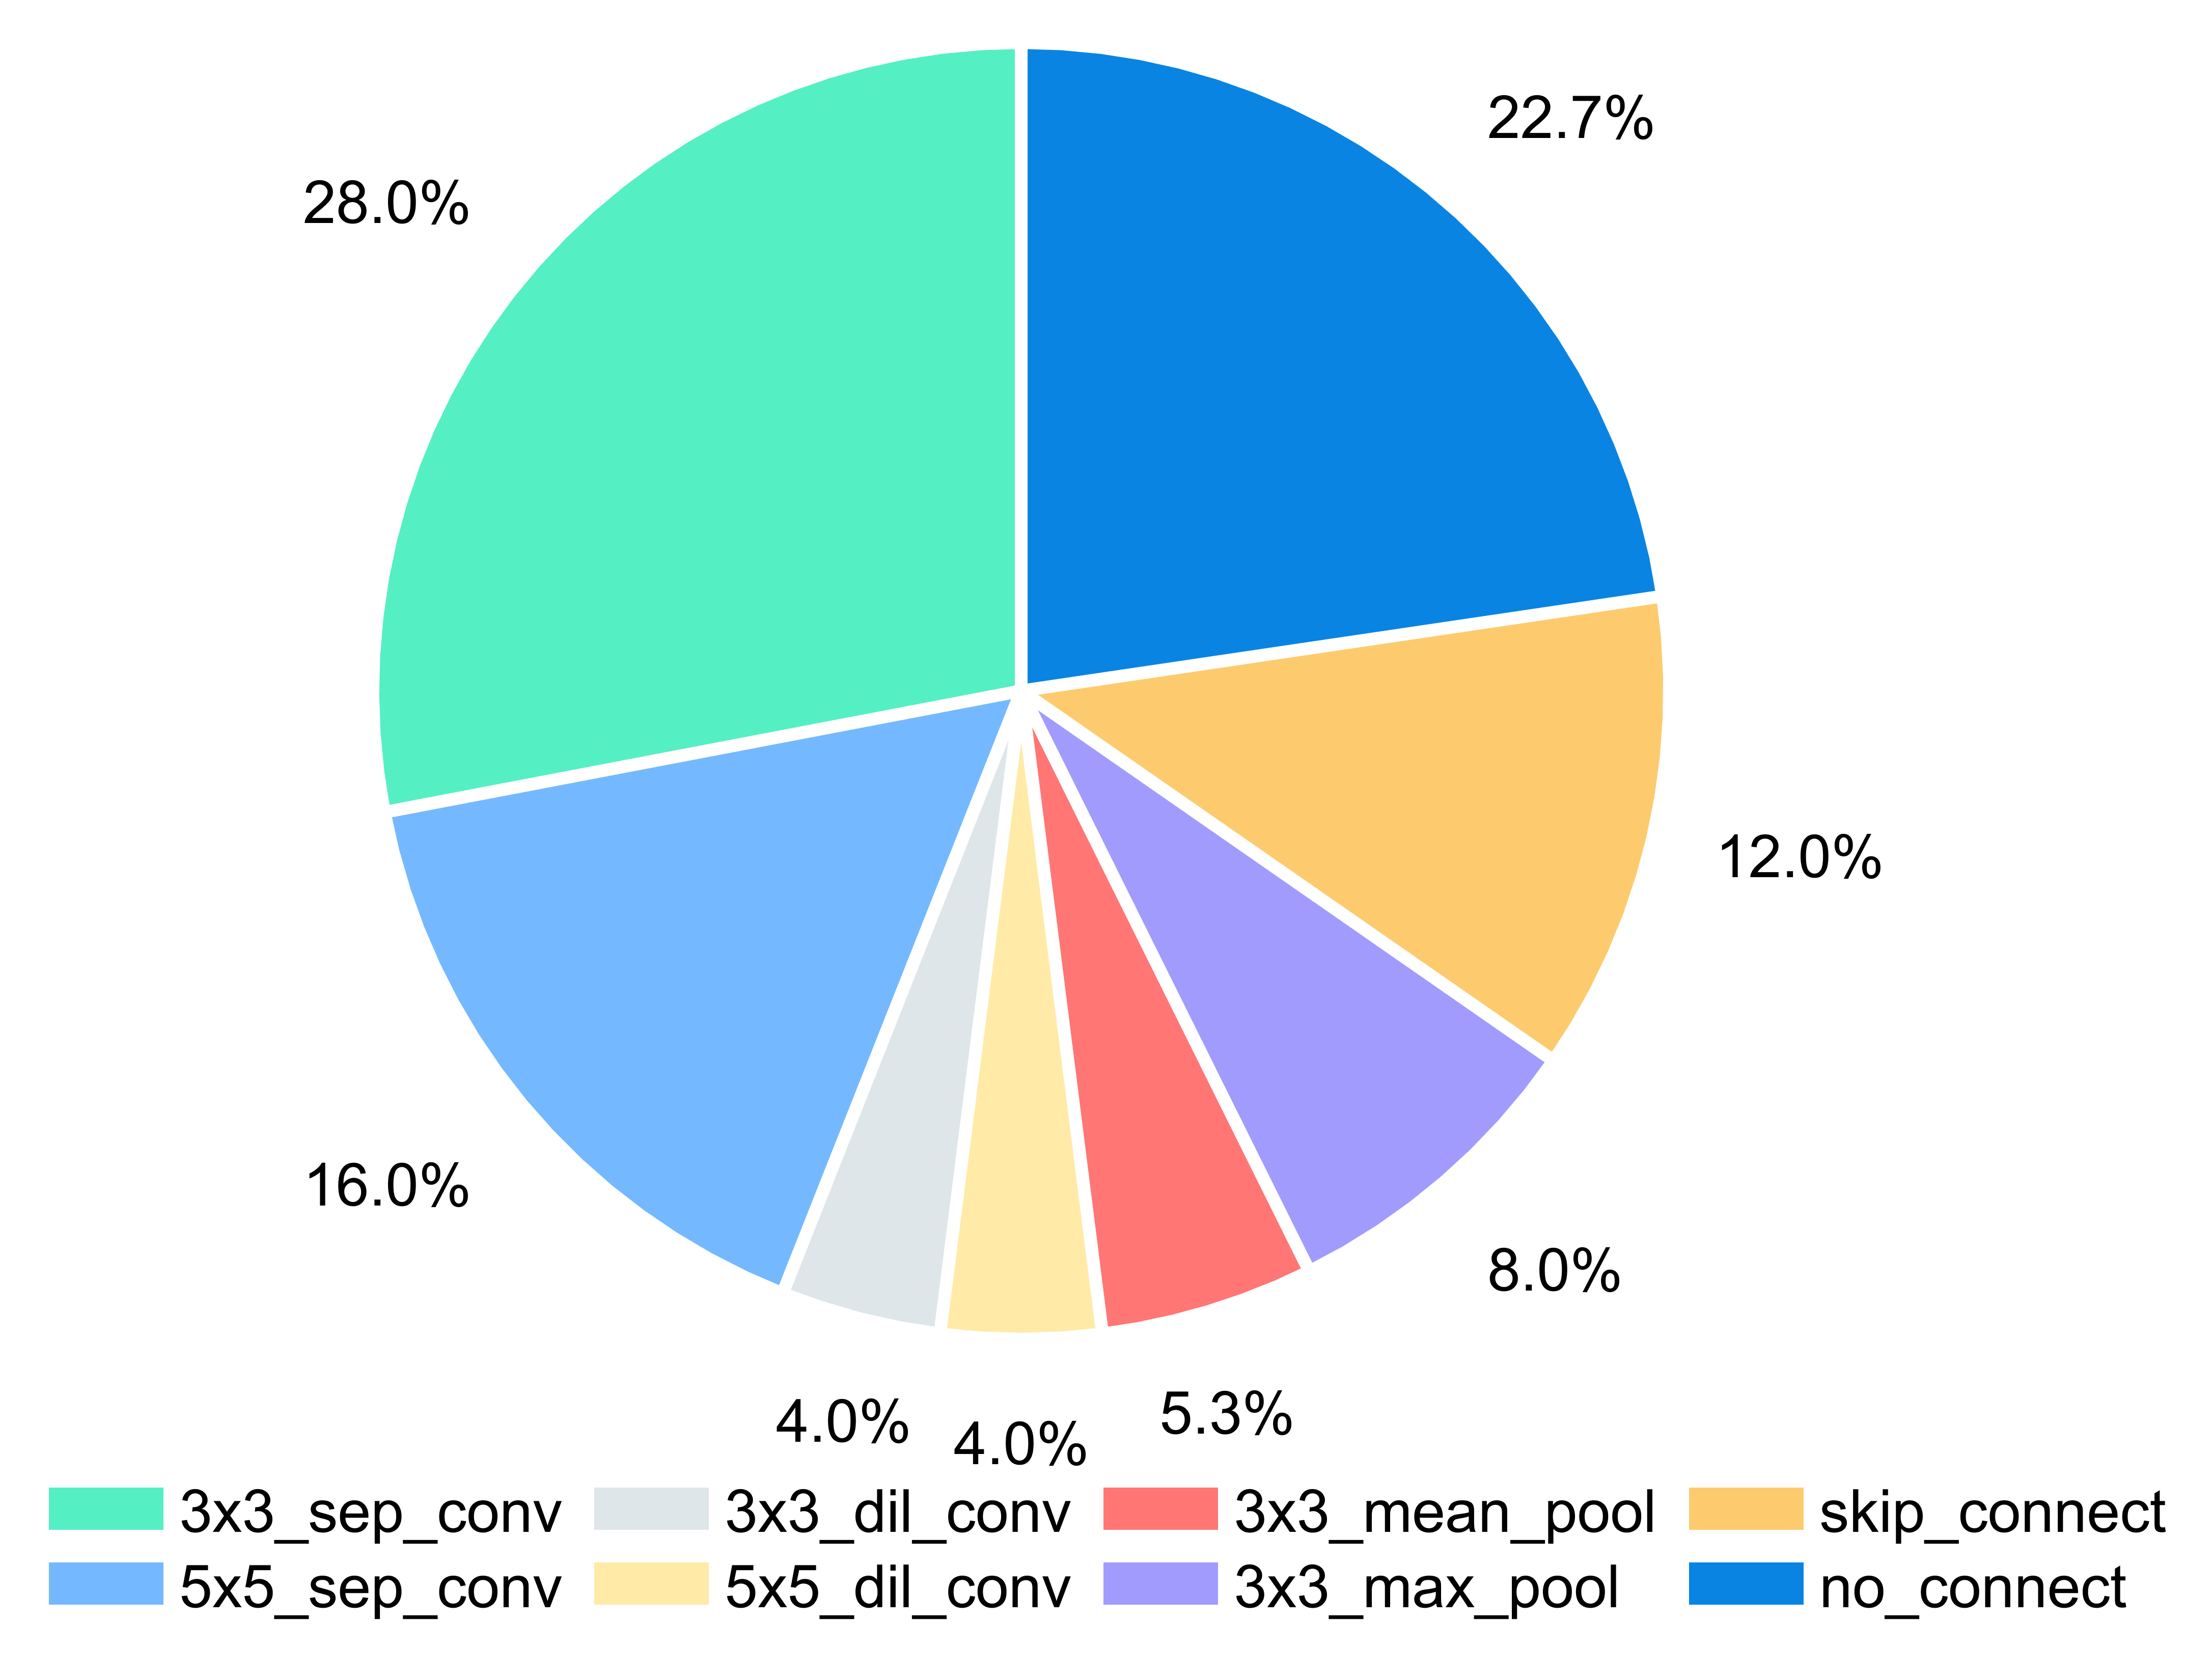
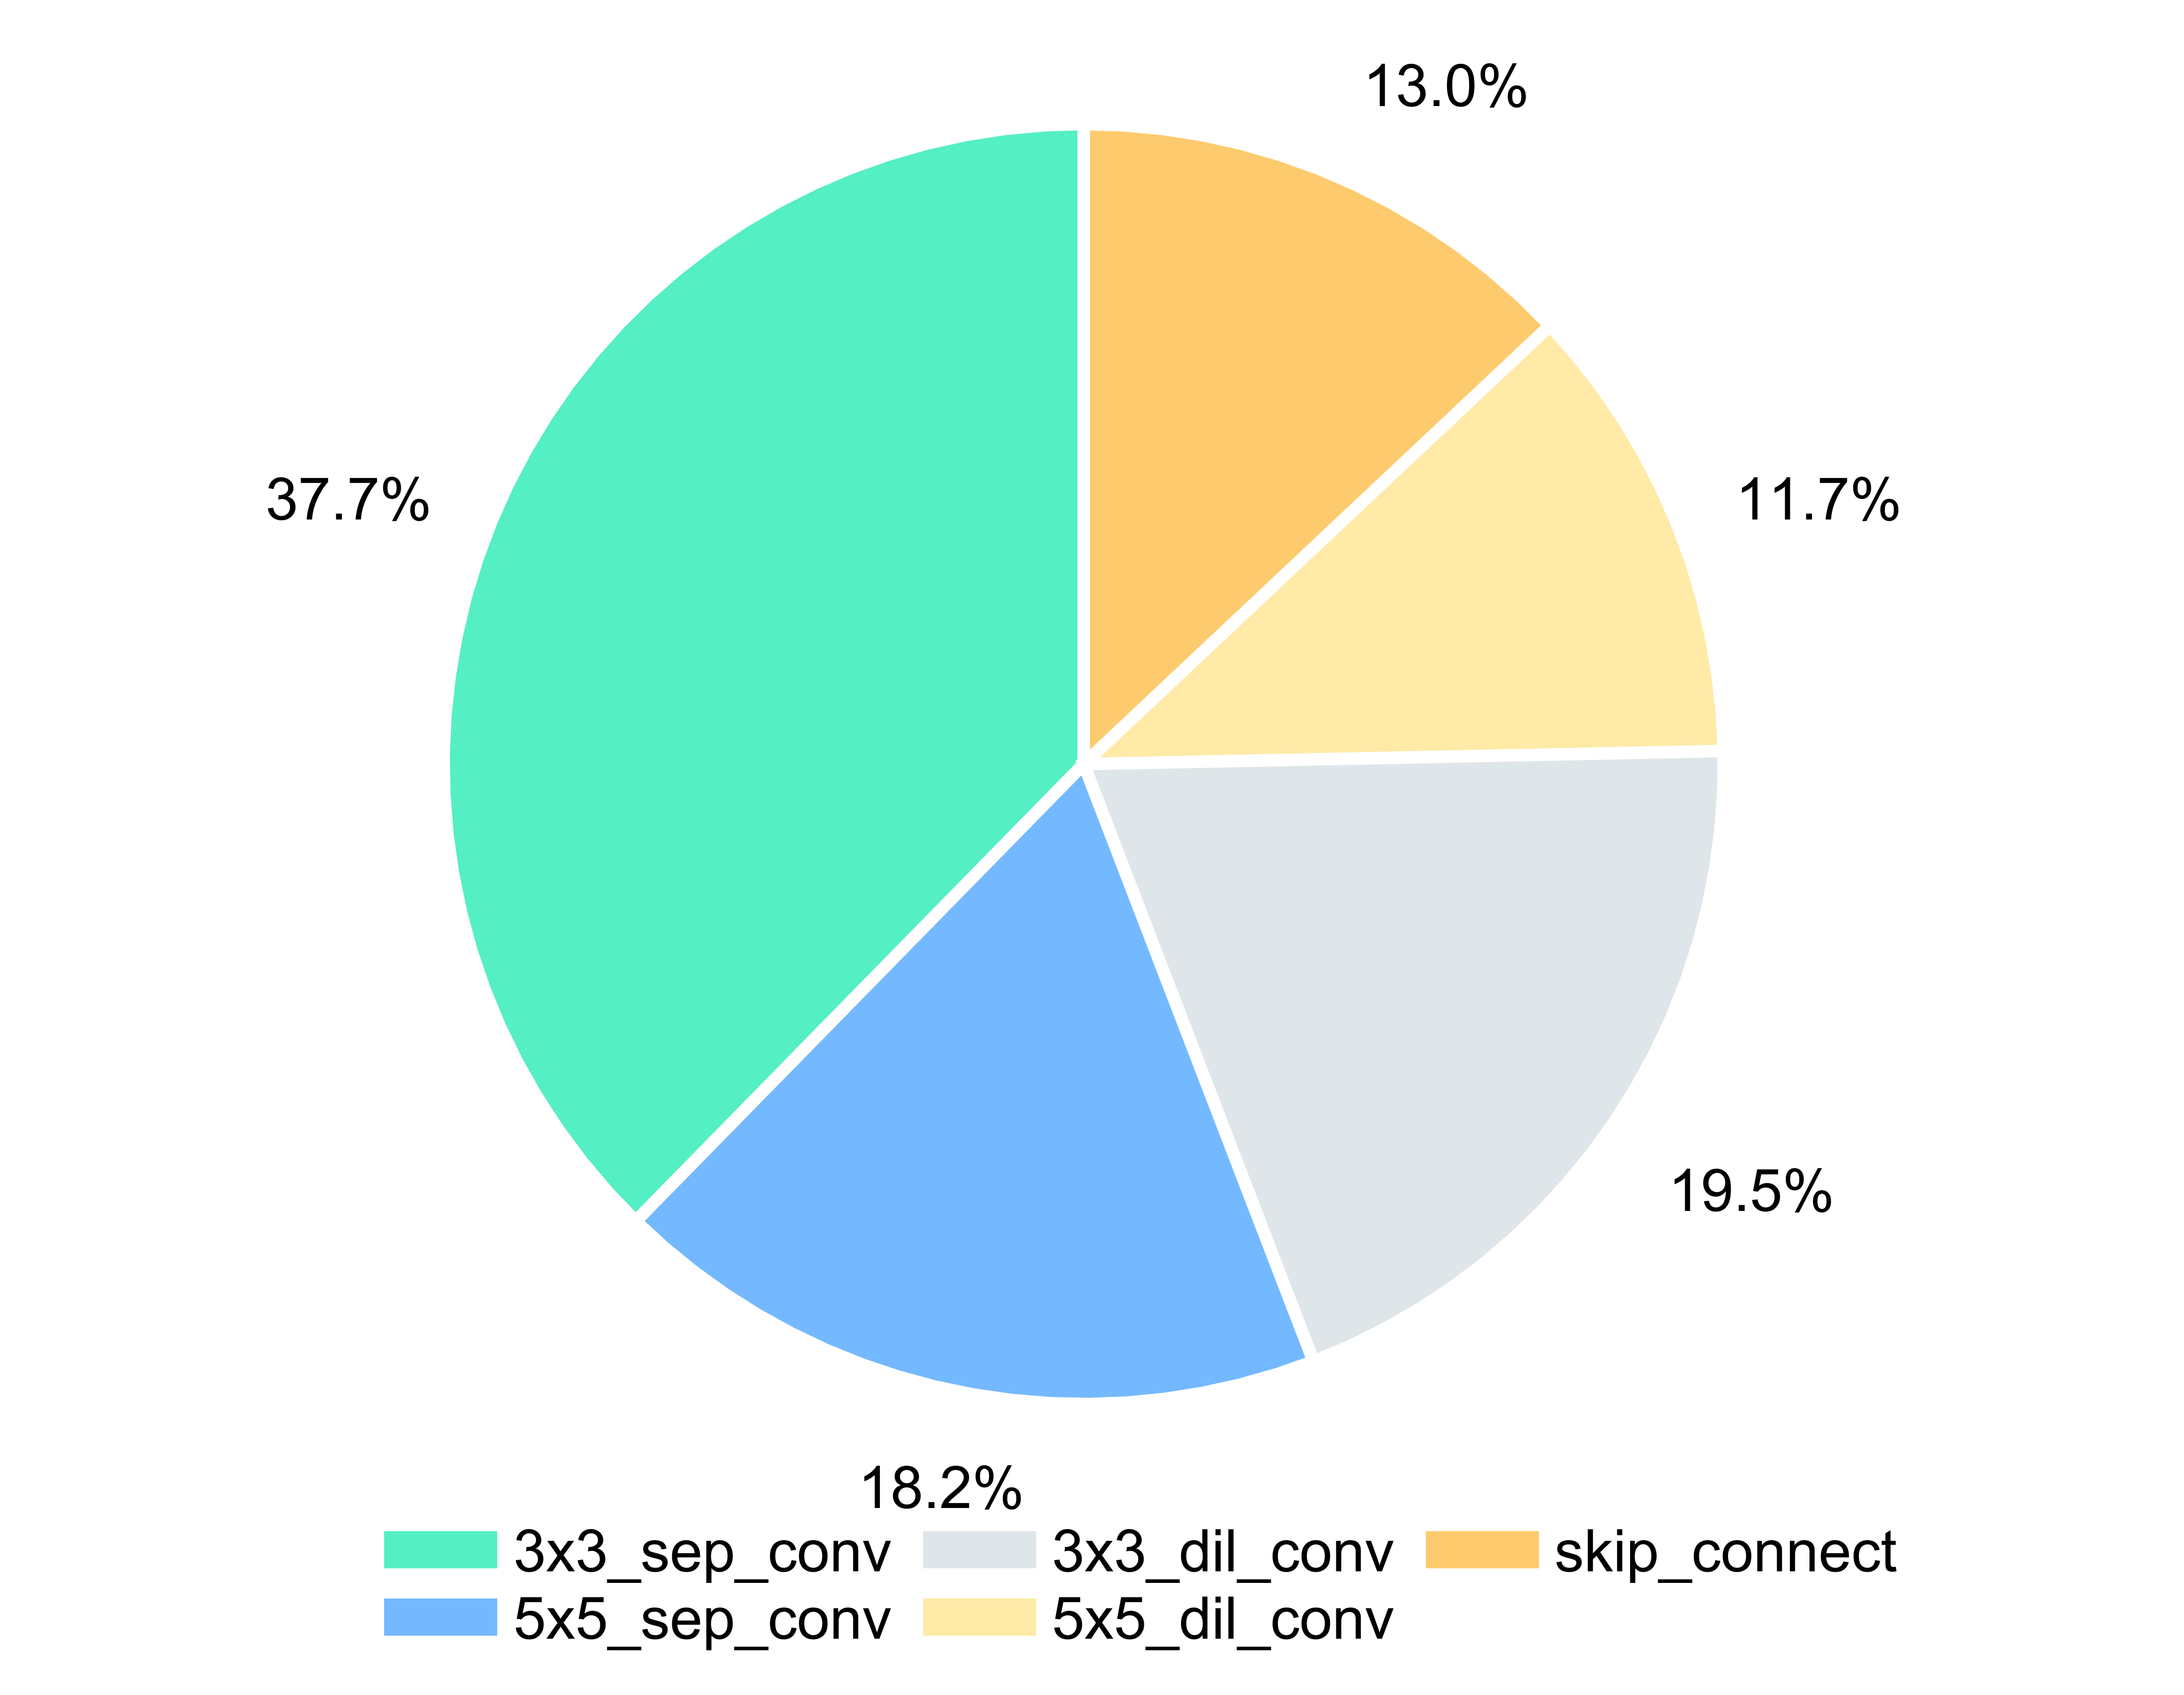
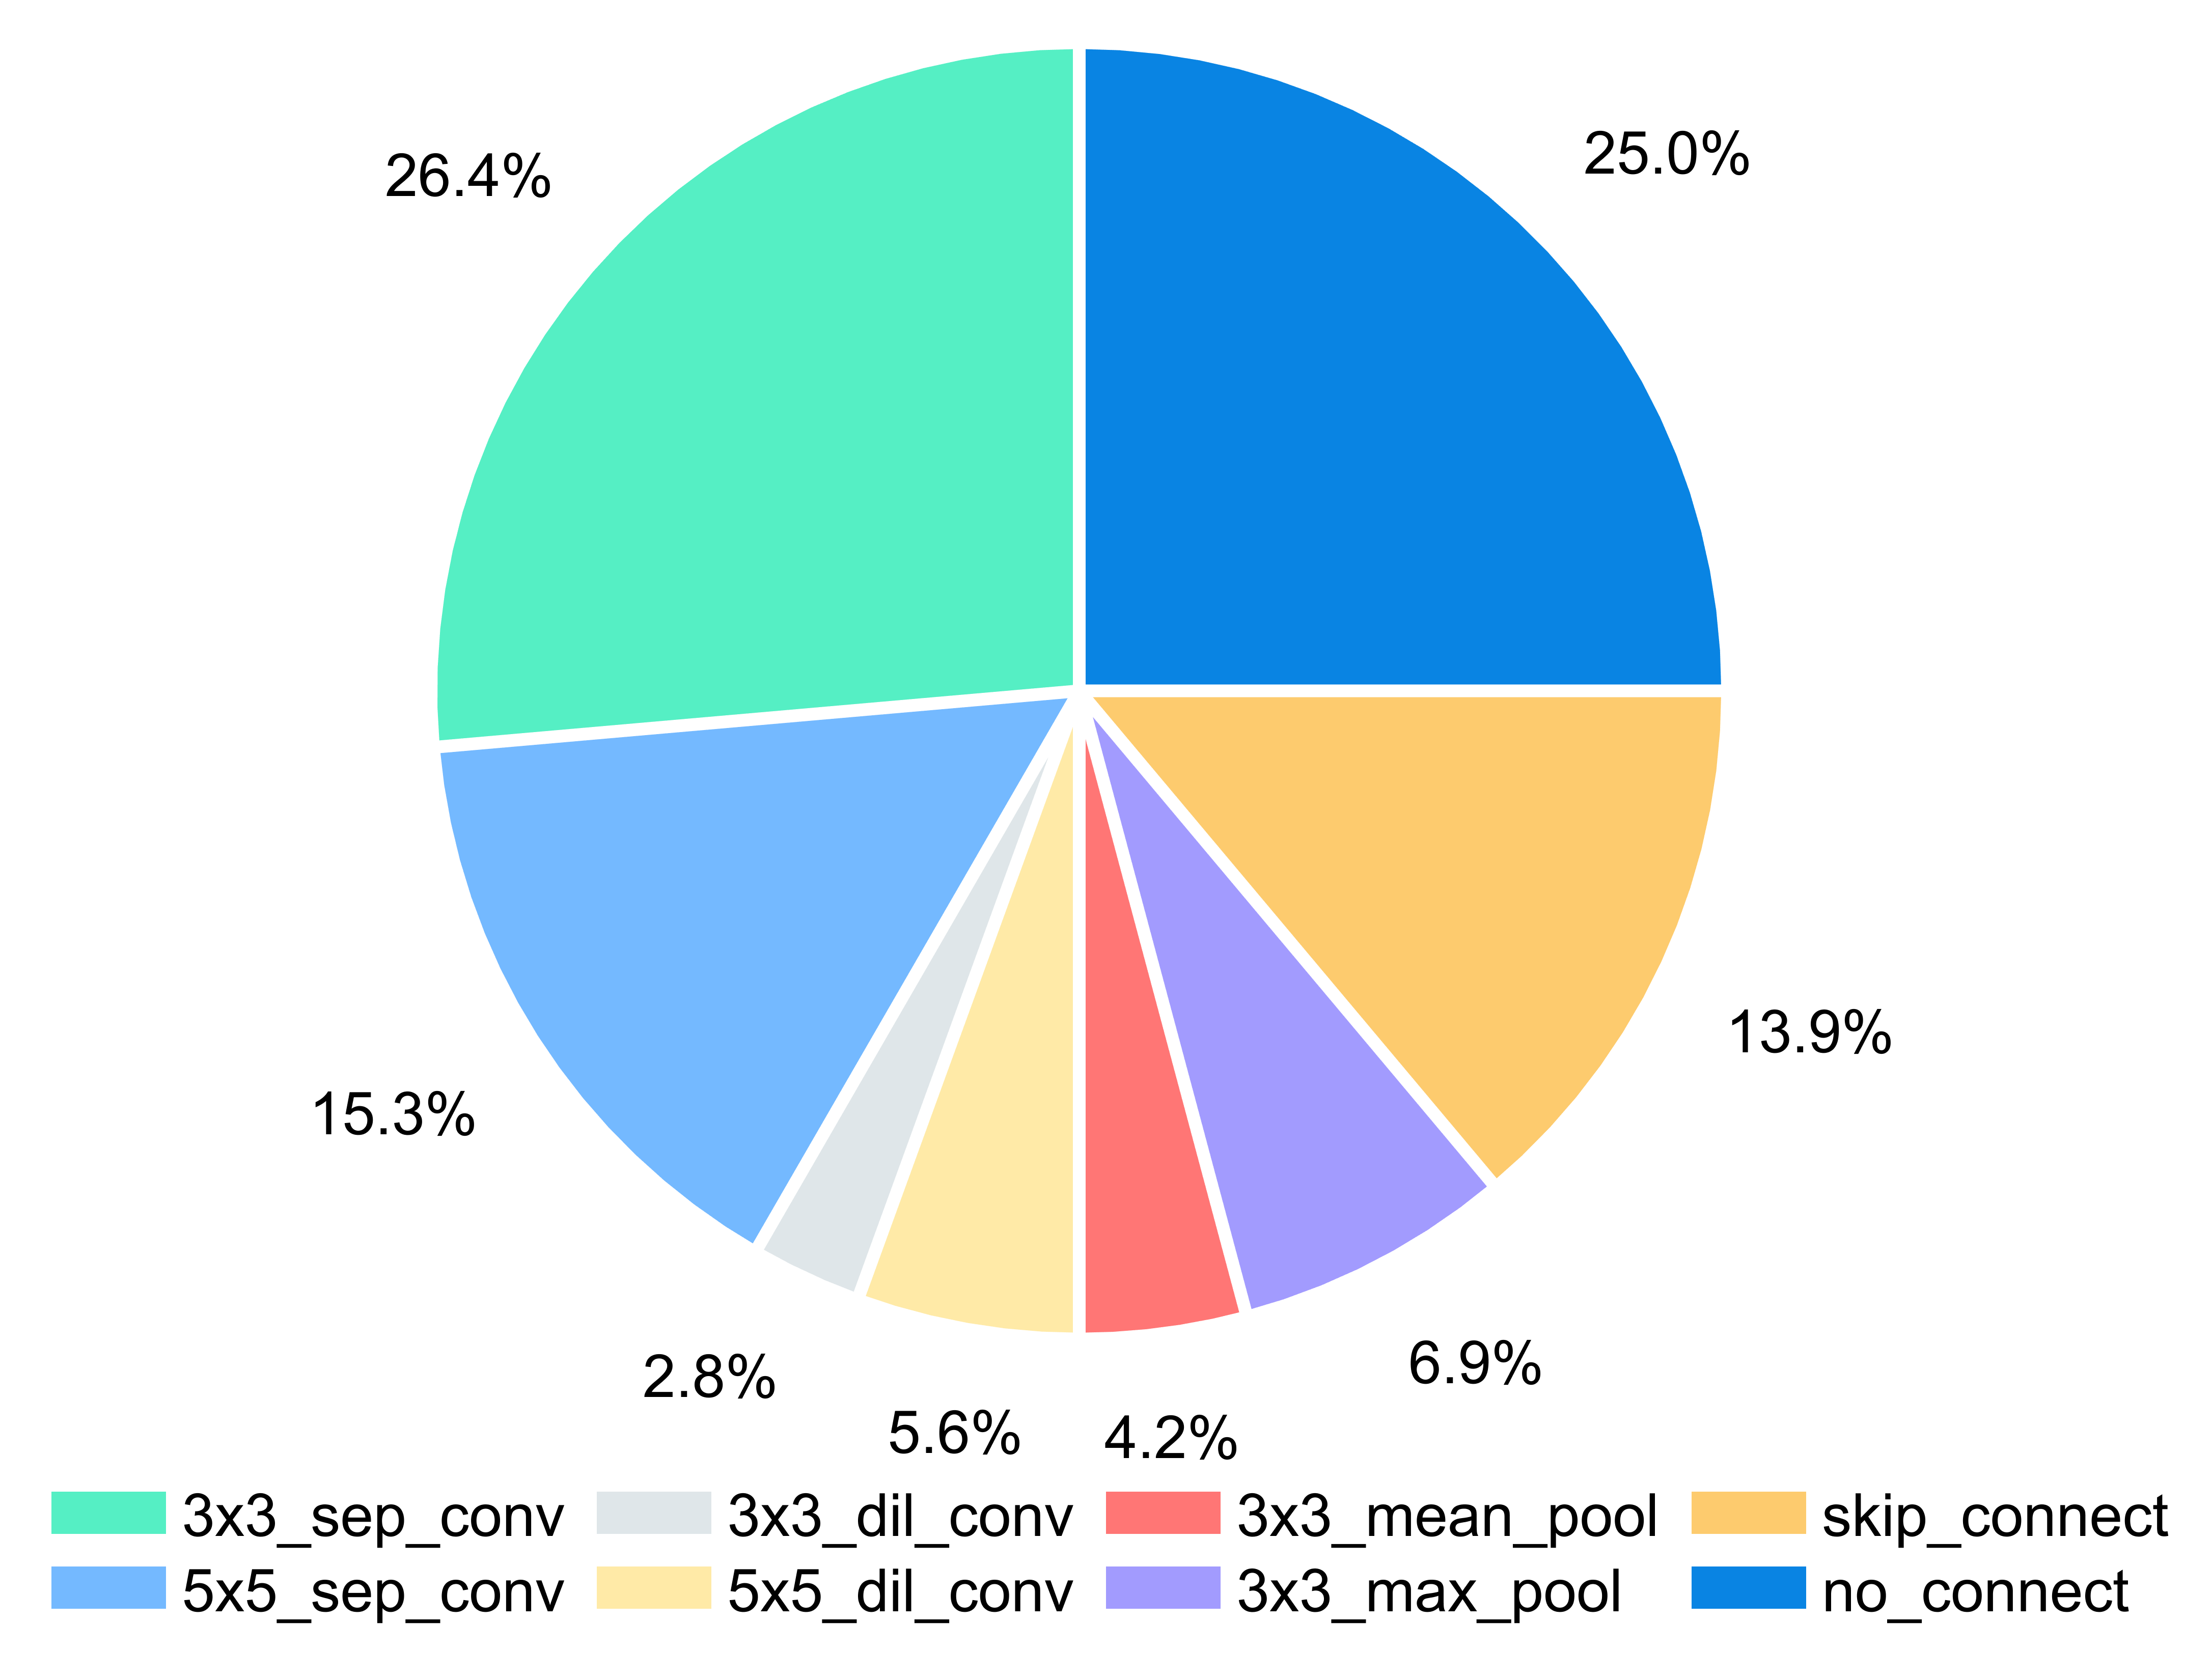
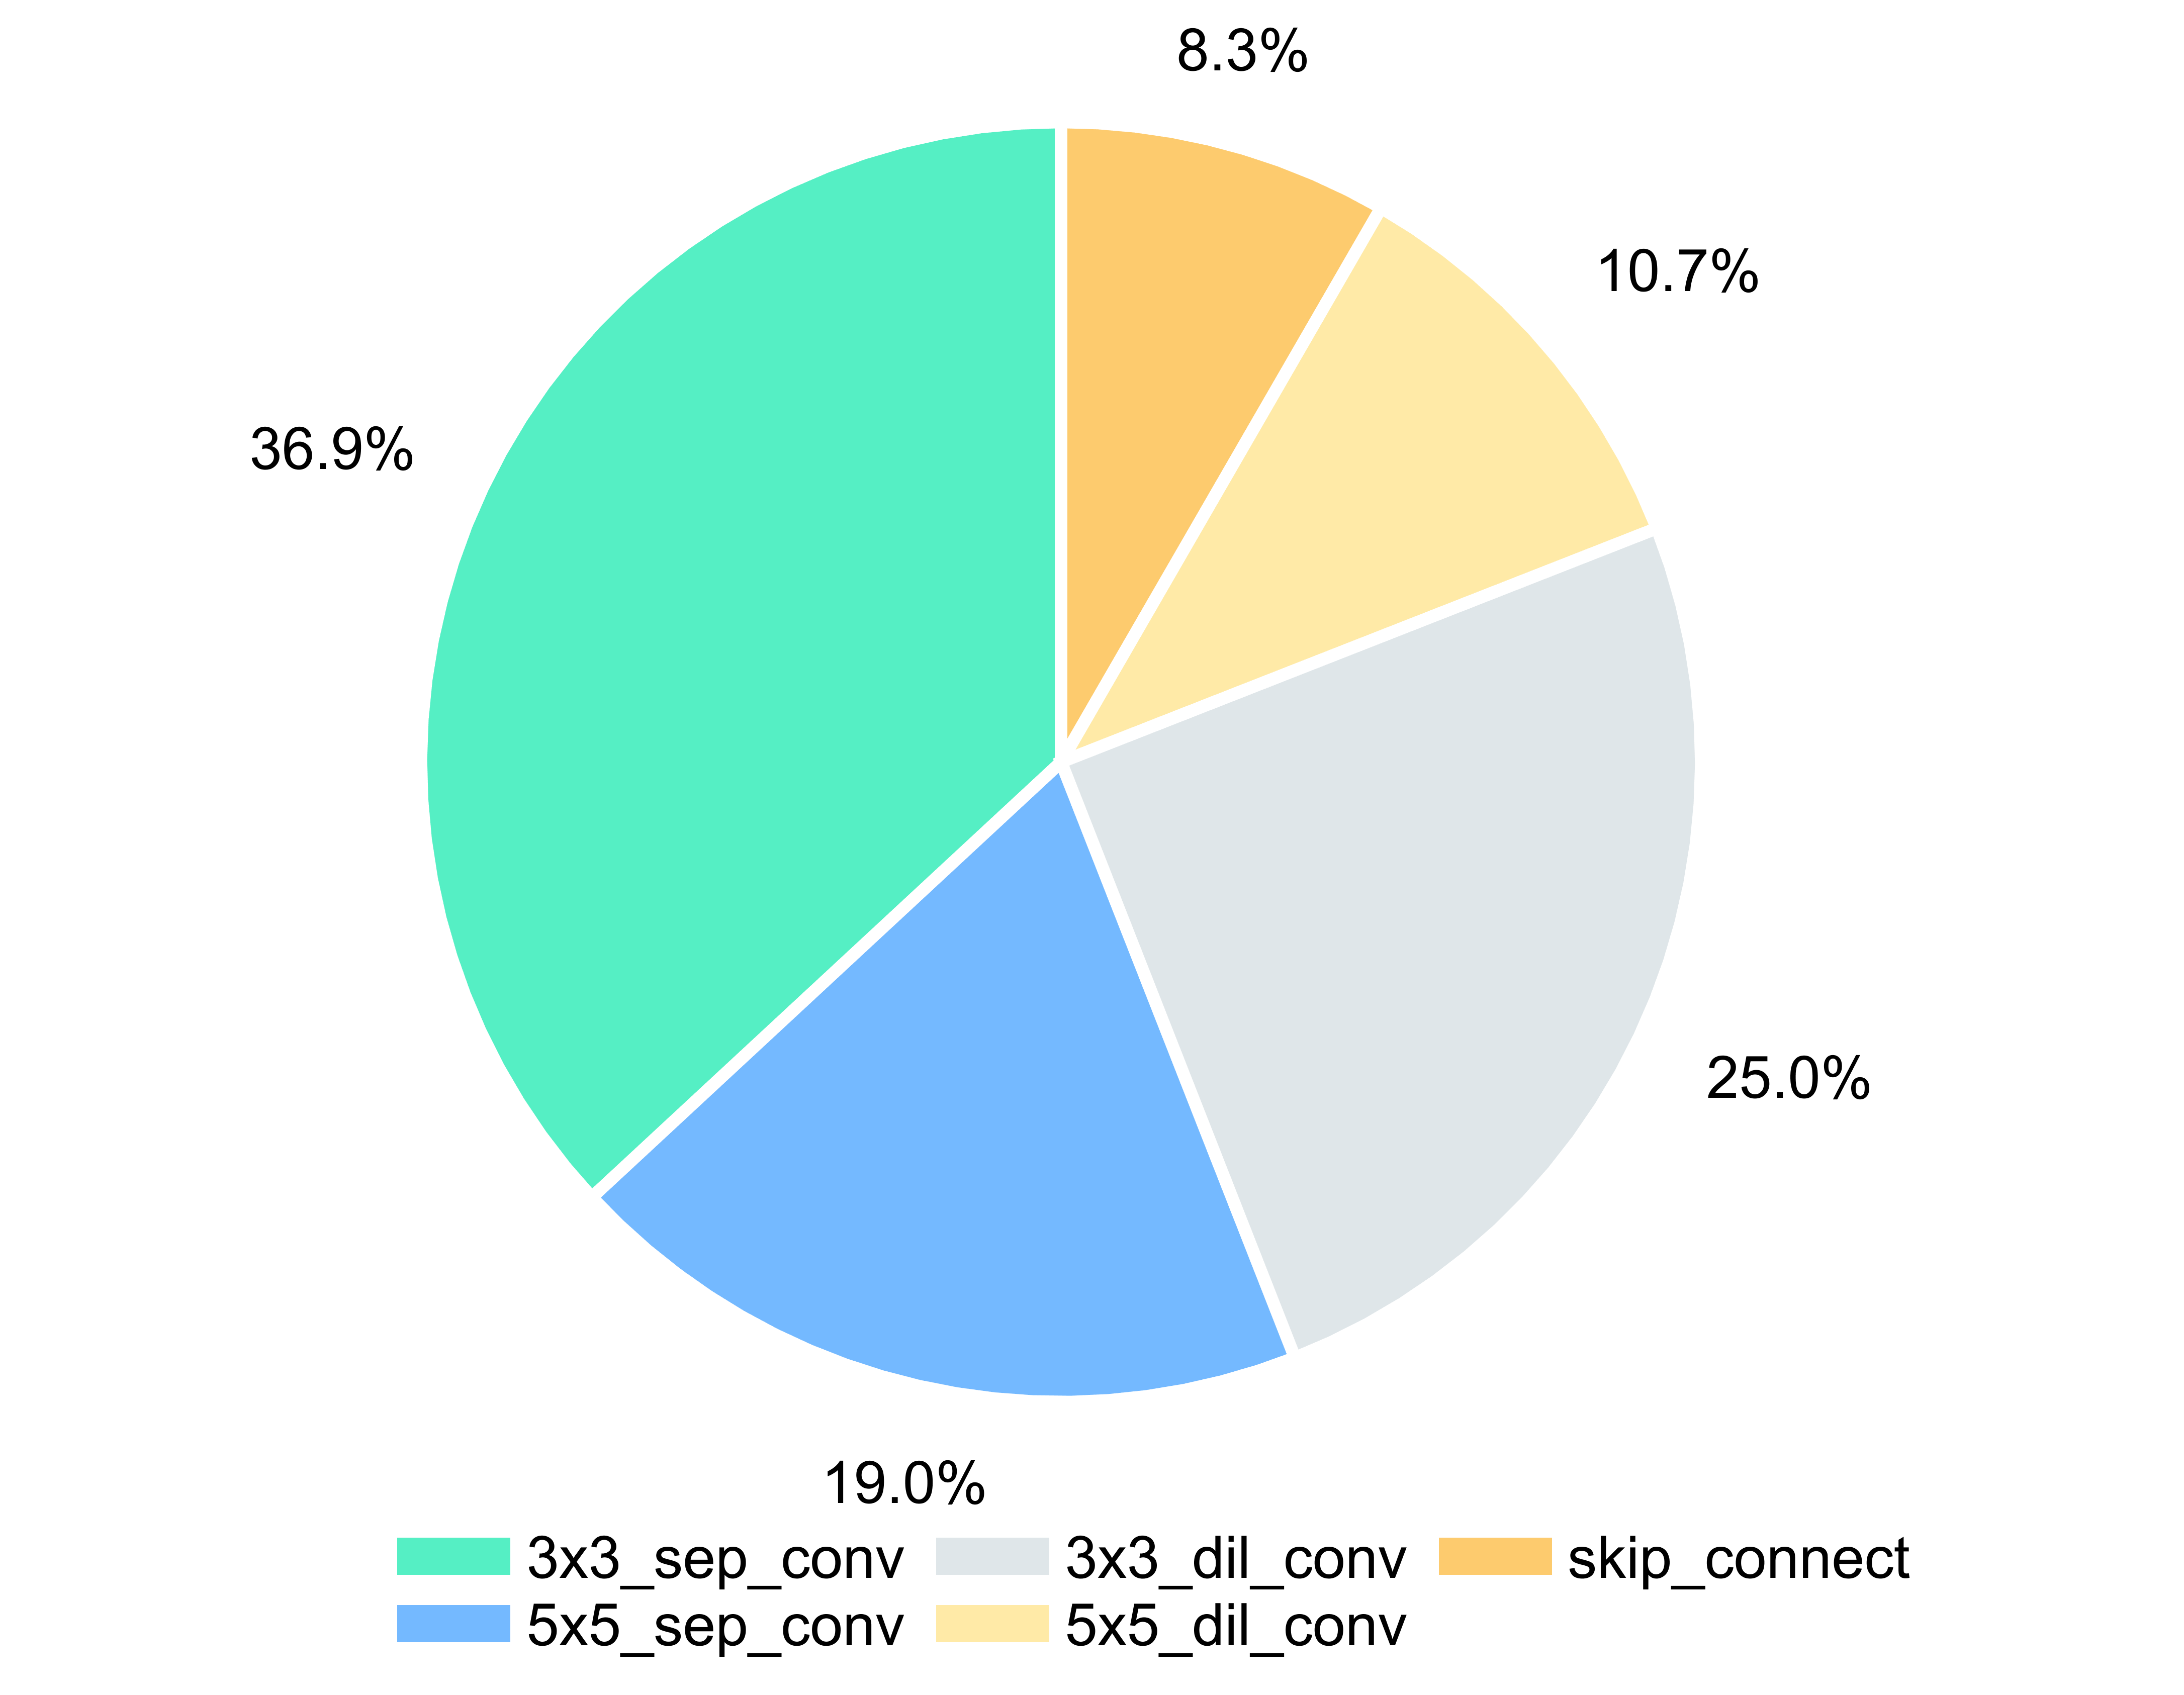
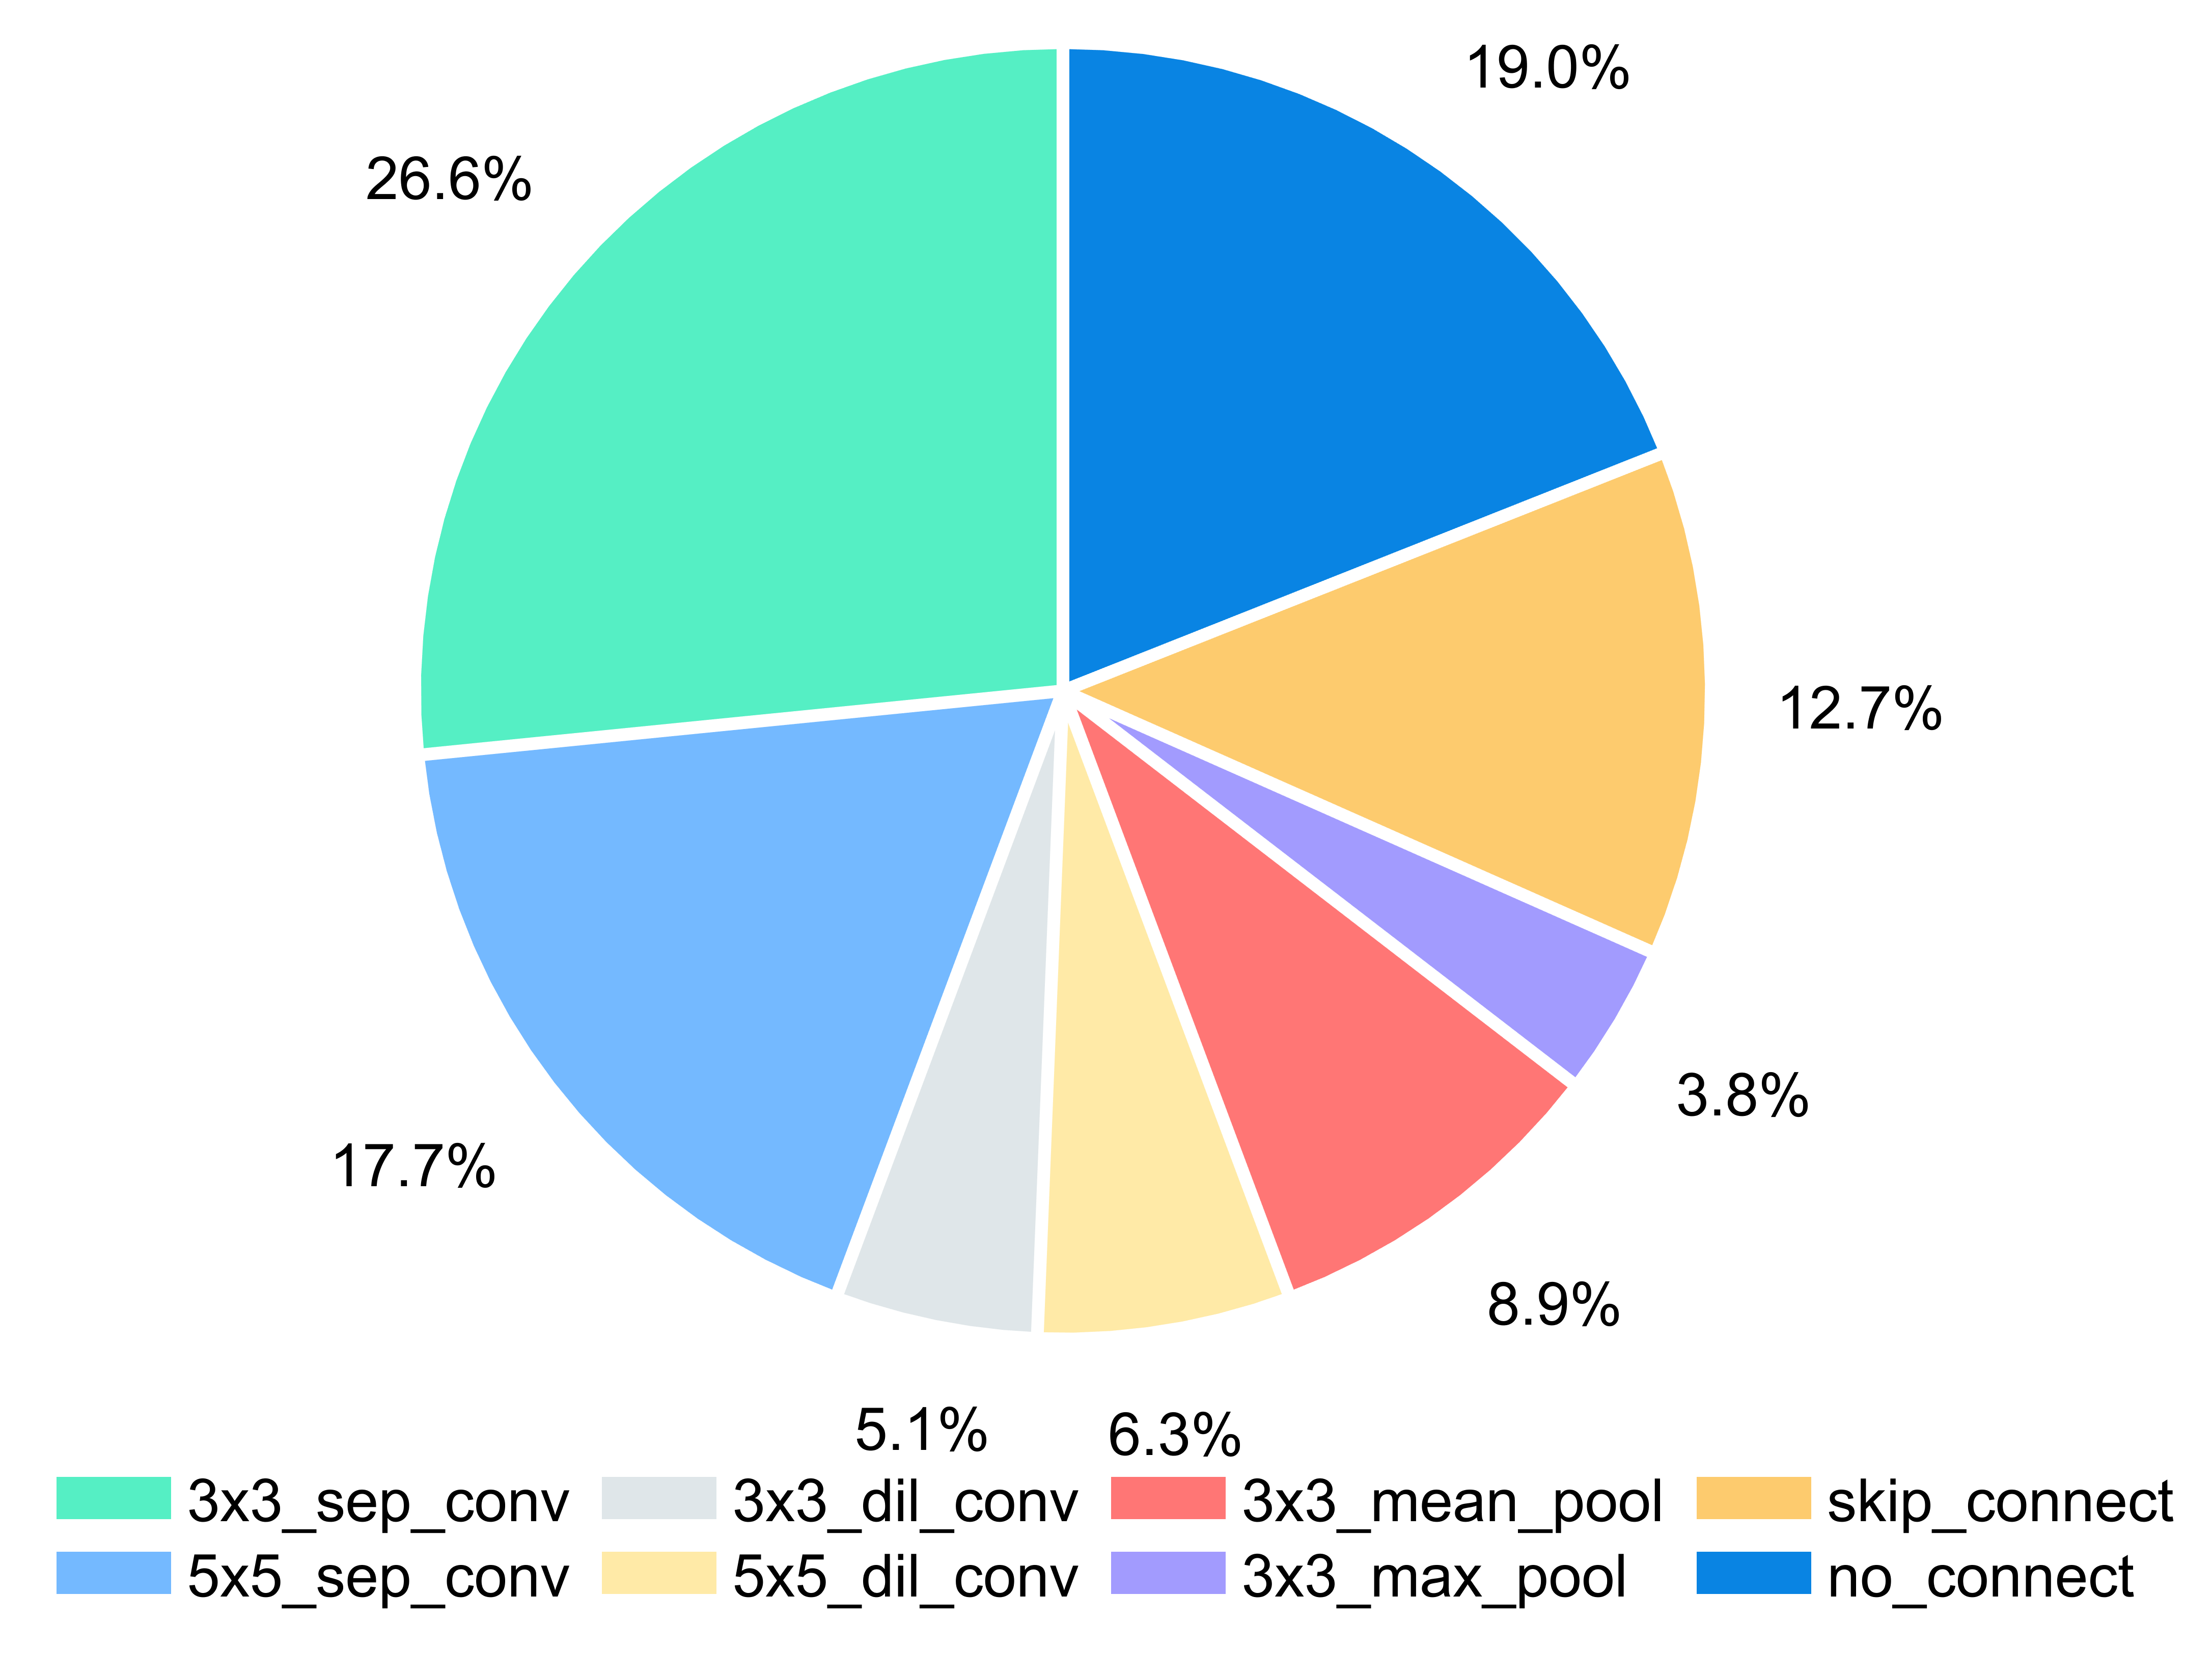
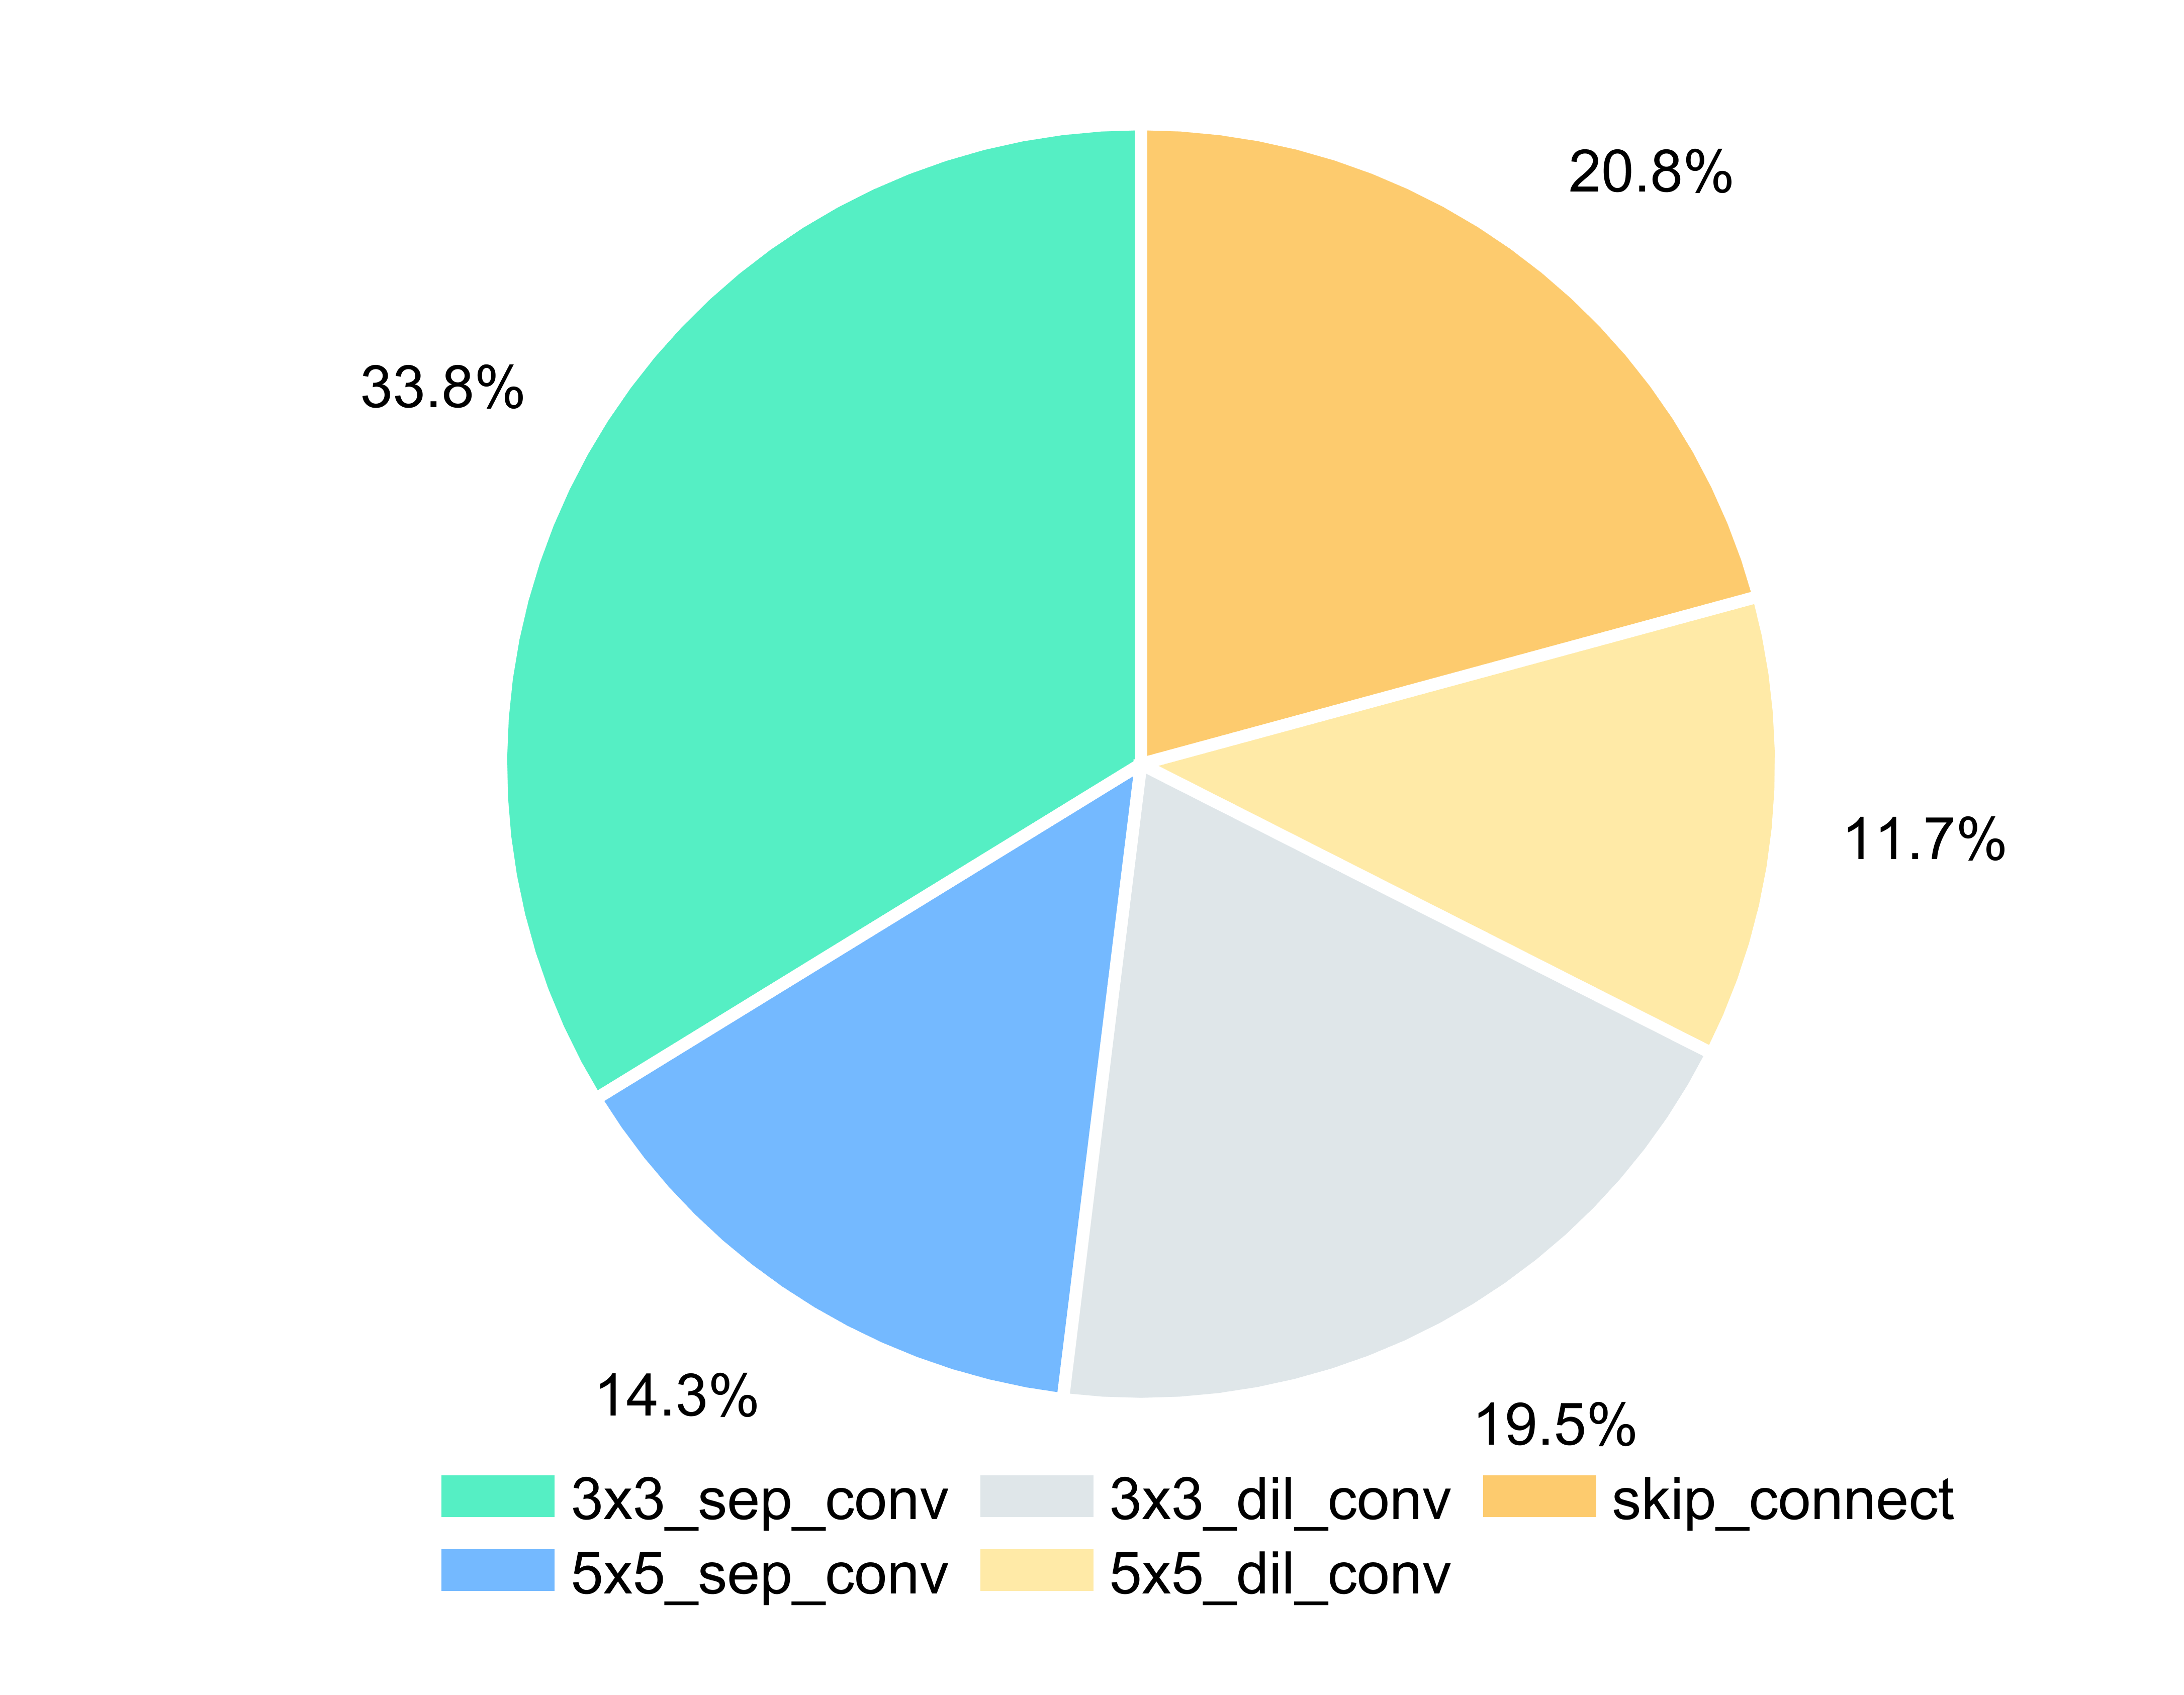
As mentioned previously, we have defined that the cells within both the encoder and decoder architectures possess their distinct architecture parameters rather than sharing them. To gain a deeper insight into the final architecture, the statistical distributions of candidate operations in the final searched encoder and decoder architecture on three datasets (CAMUS, CETUS, and HMC-QU) are presented in Fig. 8 through Fig. 13, where the compositions of operations within the encoder and decoder cells are individually characterized. The proportion of each candidate operation in the encoder and decoder cells is calculated as follows:
| (17) |
and
| (18) |
where denotes the total number of the encoder or decoder cells, and denotes the total number of node-to-node edges in the encoder. and represent the sets of candidate operations for the encoder and decoder, respectively.
By comparing the two charts (encoder and decoder) for each dataset, it can be observed that while the decoder favors skip connections and a more diverse set of convolution operations, the encoder places greater emphasis on separable convolutions and also includes pooling operations. Specifically, the decoder architecture searched by NAS has a much higher proportion of dilated convolutions compared to the encoder architecture. This distinction in operation distributions between the decoder and encoder components likely reflects their respective roles and computational requirements within the overall architecture, with the decoder emphasizing skip connections and diverse convolutions for upsampling and feature synthesis, while the encoder focuses on efficient feature extraction through separable convolutions and pooling operations.
Appendix C More Ablation Studies
C.1. Effect of Candidate Operation Set
Table 10 presents an ablation study that investigates the effect of including or excluding pooling and no connection operations from the set of candidate operations for the decoder component, evaluated on the HMC-QU dataset. The differences between the two scenarios are quantified in the final row, demonstrating that excluding pooling and no connection operations from the decoder cells leads to superior performance across all three evaluation metrics.
These empirical findings suggest that, for the given task and dataset, a simpler decoder architecture without pooling and no connection operations is more effective in achieving superior segmentation performance. The inclusion of these operations appears to be detrimental, potentially introducing noise or feature degradation that outweighs any potential benefits.
Method DSC IoU 95HD Include pooling and no connection Exclude pooling and no connection Gain
C.2. Impact of Contrastive Loss at Different Feature Resolutions
We further investigate whether incorporating the contrastive loss at different feature resolutions can improve the model performance on the HMC-QU dataset. We gradually combine intermediate features from resolutions . As shown in Table 11, the performance is promoted by gradually incorporating resolutions from to . Nevertheless, the performance decreases when leveraging the . This is mainly because feature maps at contain high-level semantic information but lack detailed information necessary for contrastive analysis, and then the loss computed at this resolution does not contribute to the improvement.
| Method | DSC | IoU | 95HD |
|---|---|---|---|
| None | |||
Appendix D More Hyper-parameter Studies
To evaluate the effect of the number of network layers , the network is initialized with 4, 6, and 8 layers, respectively, while maintaining the other parameters constant to facilitate a fair comparison. The quantitative results obtained across the HMC-QU, CETUS, and CAMUS datasets are presented in Table 12. It can be observed that the proposed model employing 8 layers achieves superior performance in comparison to using 4 and 6 layers. Based on this finding, in our model is initialized to 8.
| HMC-QU | CETUS | CAMUS | |
|---|---|---|---|
Appendix E Limitations and Future Work
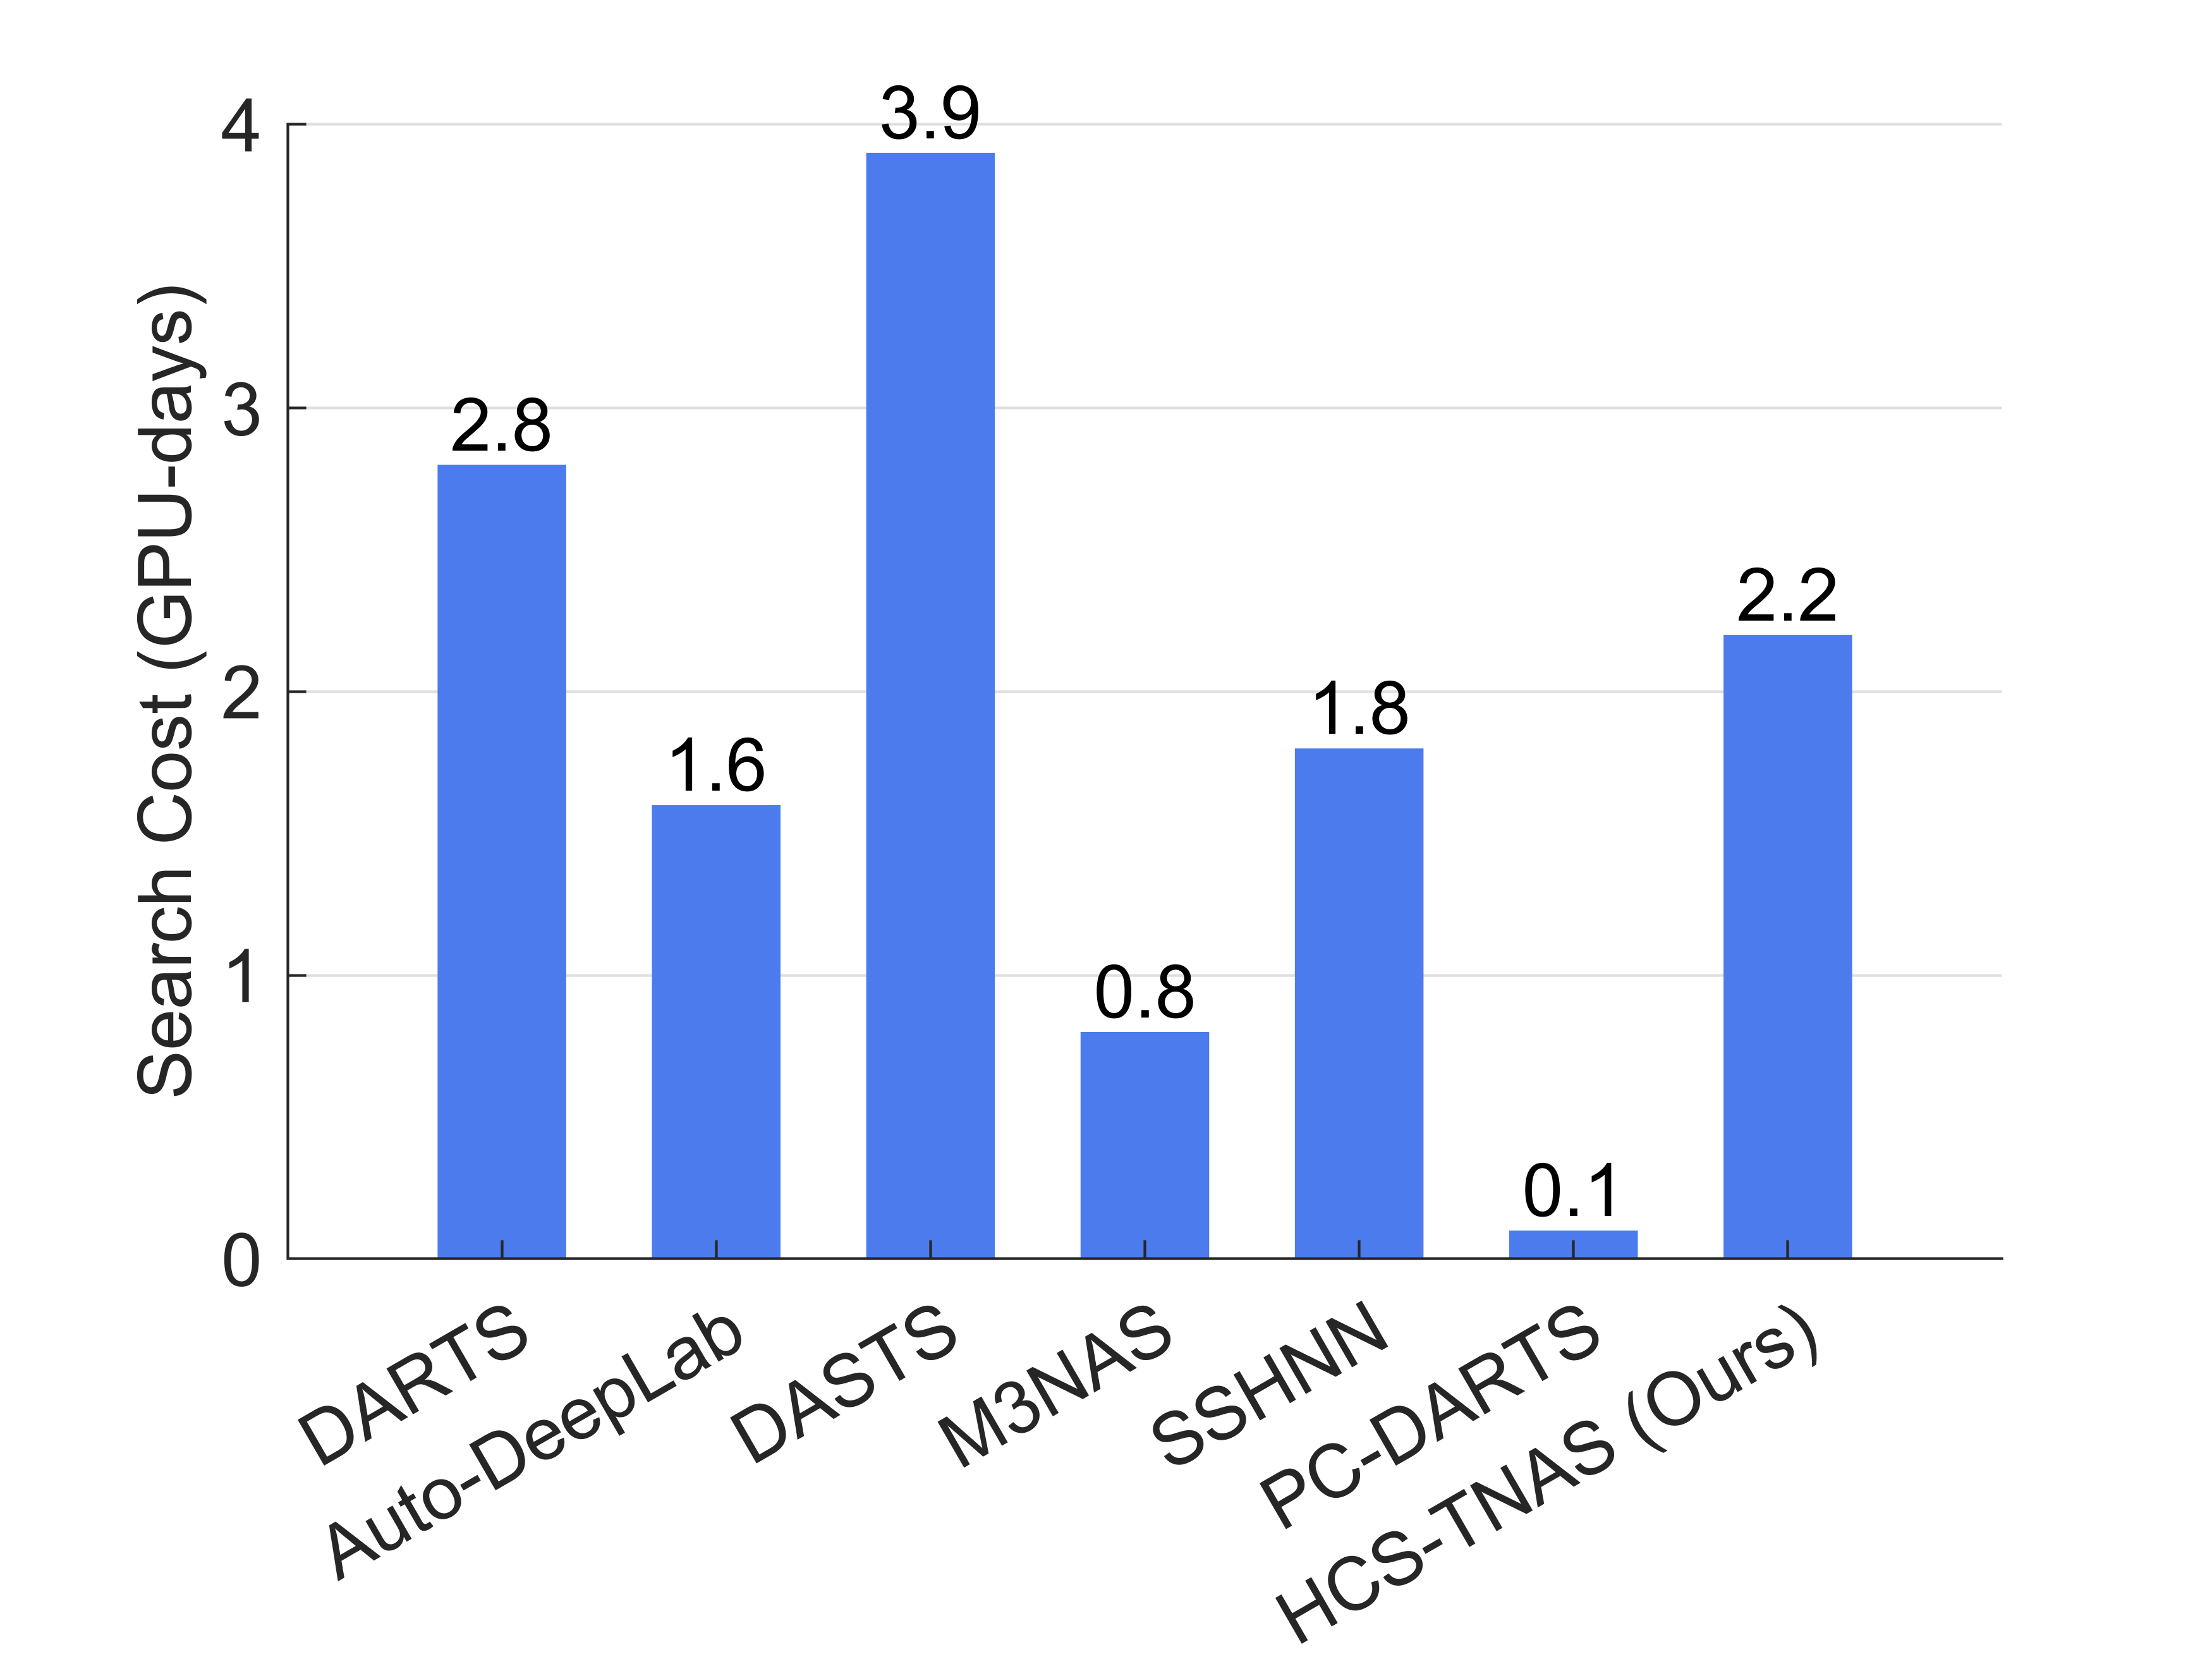
We acknowledge certain limitations in our work. In Fig. 14, we compare the required architecture search time of HCS-TNAS with other SOTA NAS frameworks on the HMC-QU dataset, including DARTS (Liu et al., 2018), Auto-DeepLab (Liu et al., 2019), DASTS (Yang et al., 2023), M3NAS (Lu et al., 2022), SSHNN (Chen et al., 2024), and PC-DARTS (Xu et al., 2019). We measure the execution time spent on the network search process, using a single Nvidia RTX 3090Ti GPU. Although we replaced the vanilla Transformer with EfficientViT as the NAS backbone to reduce GPU memory usage and training time, the search process is still time- and resource-intensive. In the present study, it takes approximately 2 GPU days to train the model. This is mainly attributed to the employed stage-wise optimization strategy, where additional time is required to update combination matrices for estimating network independence. While we plan to consider designing a more efficient optimization strategy in the future, we think that it also allows researchers to evaluate the computational requirements and potential trade-offs when selecting a suitable approach for a specific task or application.
Another direction for our future work is to enhance the generalization capabilities of our model. Specifically, while our current approach involves training on ultrasound image datasets, we aim to investigate the model’s transferability and robustness by evaluating its performance on other medical imaging modalities, such as magnetic resonance imaging (MRI) or computed tomography (CT) scans. This cross-modality research will provide insights into the model’s ability to generalize and adapt to diverse imaging data, which is crucial for practical clinical applications. By enhancing generalization across modalities, we strive to develop a more versatile and robust solution for medical image analysis workflows, ultimately contributing to improved patient care.