Energy landscape interpretation of universal linearly increasing absorption with frequency
Abstract
Absorption of elastic waves in complex media often depends on frequency in a linear way for both longitudinal and shear waves. This universal property occurs in media such as rocks, unconsolidated sediments, and human tissue. Absorption is due to relaxation processes and we argue that these processes are thermally activated. Unusual for ultrasonics and seismics, we can therefore express absorption as an integral over an activation energy landscape weighted by an energy distribution. The universal power-law property corresponds to the special case of a flat activation energy landscape. The derived distribution agrees with results in soft glassy and glassy media.
I Introduction
The amplitude of elastic waves undergoes attenuation which often follows a power-law in frequency, :
| (1) |
where is particle velocity and is distance. The two mechanisms for attenuation, , are viscoelastic absorption which leads to heating, and scattering of energy. This paper is only concerned with absorption which in complex media often increases linearly with frequency, i.e. . Examples from many applications will first be given.
In seismology, many nuclear-explosion and earthquake data sets in the range to 10 Hz appear to have a constant for shear waves [1]. Inverse Q is defined as , and if dispersion can be neglected, , it follows that . Therefore, constant-Q behavior is the same as linearly increasing absorption.
Constant-Q behavior is especially apparent after correction for bias due to an additive constant in the expression for , which may be due to geometrical spreading, (de-)focusing, or scattering, [1]. Similar results are reported for seismic reflection data from vertical wells [2] and constant-Q behavior in the frequency range up to about 100 Hz is also common for data from seismic surveys [3].
It is also recognized that is nearly frequency-independent over one to two decades of frequency in many solids, and for different wave modes, [4]. This property was noted for metals and nonmetals, for both compressional and shear waves, and for frequencies in the Hz, kHz, and MHz range.
Unconsolidated sub-bottom sediments represent a very different medium, but the same linearly increasing absorption of compressional waves is observed above about 2 kHz [5]. Below that frequency the exponent is closer to two. Even in this case the value for the exponent, , will depend on whether shear-wave mode conversion in the form of a constant term in the expression for is compensated for, [6].
One of the best studied fields is compressional waves in the MHz range in medical ultrasound, [7], [8]. A recent review says that an “early consensus emerged that a power law fit near 1 was adequate for absorption models of soft tissues” [9]. As in the case of seismology, care is needed in interpreting measurements as for instance defocusing due to phase aberrations may lead to an overestimation of absorption if not compensated for [10].
The medical ultrasound field has provided insight into the spatial scale where absorption takes place. Grinding liver tissue hardly changes the absorption, so it is apparent that the mechanisms operate ”on a level of organization smaller than that defined by cells, cell nuclei, and mitochondria”, i.e., size less than about 3 microns, [11]. Absorption in canned evaporated milk also follows a linear frequency law [12], indicating that casein micelles at the sub-micron size level play an important role. Similarly, absorption of compressional waves in blood in the 0.8-3 MHz range was due to the presence of proteins [13].
A related phenomenon is how cells or tissue react to shear excitation. The response often varies with , where the exponent is in the range 0.1 to 0.5, [14], [15]. According to results cited in the Supplement, this corresponds to an absorption that varies with and therefore in this case will fall in the range 1.1 to 1.5.
The property that the exponent is near unity over a wide range of materials is nearly universal, both for compressional and shear waves, as noted in e.g. [16]. The exponent may be larger than unity, but never above 2, the viscous case, and rarely below 1. The temperature range of interest is approximately 0 to 40∘ C.
This paper is concerned with viscoelastic absorption, but it should be mentioned that there are other absorption mechanisms which will not be discussed. This includes friction in cracks in rocks, fluid flow in micropores in consolidated sediments or bone, [17], and squirt flow in unconsolidated sediments, [18], as well as nonlinearity.
An early study of absorption in erythrocytes suggested that “chemical or structural relaxation processes are probably responsible for the attenuation” [19]. It has also been proposed that in polymer-like materials, thermal energy causes continuous change in the “interactions between macromolecules” [16]. In cell rheology, the theory of soft glassy materials has been shown to be applicable, [14].
Combining these observations, we notice that chemical and structural relaxation in e.g., seawater are thermally activated processes. Thermal activation over potential barriers of structural defects also plays an important role in e.g. glasses and rocks. This gives the motivation to transform the multiple relaxation formulations from the usual frequency and time domains into the energy domain. This will provide new insights for the case of elastic wave propagation in acoustics and seismics. Surprisingly, a simple uniform distribution of activation energies corresponds to the universal linearly increasing absorption.
II Background: Multiple relaxation
A relaxation process is characterized by a relaxation frequency, , or a relaxation time , and an absorption given by: . Attenuation increases with well below the relaxation frequency and is constant well above it. This expression can for instance be found from structural relaxation, [20], and from chemical relaxation, [21].
In a complex medium there are many elementary relaxation processes over a large spread of relaxation frequencies and absorption is:
| (2) |
where is a constant. The weighting in the relaxation integral has the form of a probability distribution function. The particular distribution given by will result in the power-law absorption of (1), [22, Sect. 3.241.2], [23]. This formulation does, however, not provide much insight to motivate why should follow this particular power-law relation.
The integral of (2) can be transformed to be over relaxation times, , by letting :
| (3) |
where the particular distribution will lead to the desired power-law absorption, [24]. This formulation may be easier to interpret as relaxation times may be related to length scales, , by means of the speed of propagation, . Cell biomechanics may offer some insights, as power-law behavior of the shear modulus over about five decades of frequency is well documented. However, there seems not to be enough cell components in a hierarchy from the largest to the smallest to account for the observed power-law behavior, [25, 14, 26]. There is therefore limited physical insight to gain even from the formulation of (3).
III Thermally activated relaxation
It is common in acoustics to be content with the descriptions of (2) and (3). The limitation, as noted, is that they do not offer much insight into why the relaxation processes are ”organized” such that the result is power-law characteristics.
A closer look at the common mechanisms for intrinsic absorption is therefore warranted. In acoustics, they are viscosity, molecular thermal relaxation, heat conduction in monatomic gases, structural relaxation, and chemical relaxation, [27, Chap. 8]. Viscous absorption and molecular thermal relaxation due to oxygen and nitrogen dominate in air, and the three first mechanisms therefore primarily characterize absorption in gases.
As we are interested in the properties of fluids and solids, structural and chemical relaxation are the two contributors of importance. In order to understand these processes better we therefore review the well-established model for seawater, as an example of a medium where structural and chemical relaxation dominate.
III.1 The Arrhenius law
Absorption in seawater is described as a sum of three discrete components. The first term is due to structural relaxation of H2O molecules. In distilled water a broken-down structure of clusters is dynamically changed by an incoming sound wave and relaxation takes place as clusters of different sizes interact. Based on a two-state energy model for H2O molecules, the Arrhenius law describes transition rates, [20]. Relaxation time is then related to activation energy, , as:
| (4) |
where is absolute temperature, is Boltzmann’s constant, and characterizes the smallest time scale probed.
The next two absorption terms in seawater are due to MgSO4 and B(OH)3 which both contribute two-state chemical equilibrium reactions. The common parametrization in e.g., underwater acoustics is expressed in temperature in Celcius rather than Kelvin, [29], obscuring the fact that these processes are also thermally activated and follow the Arrhenius equation, [21, 30].
Both structural and chemical relaxation, at least near room temperature, have activation energies given by the Arrhenius equation. This is a key insight that allows us to transform the previous relaxation integrals.
Equation (3) can now be transformed by using the Arrhenius law in combination with :
| (5) |
where is a normalized energy distribution function. We note that activation energy and its distribution function are physical parameters that lend themselves to interpretation much more than distributions of relaxation frequencies or relaxation times.
III.2 Energy distribution
By means of the Arrhenius equation one may transform between the frequency, time and energy relaxation integrals, (2), (3), and (5). the energy distribution may be written
| (6) |
In the case of the power-law absorption of interest here, we have
| (7) |
The most interesting case is the energy distribution corresponding to linearly increasing absorption, . Surprisingly, that corresponds to a flat activation energy distribution.
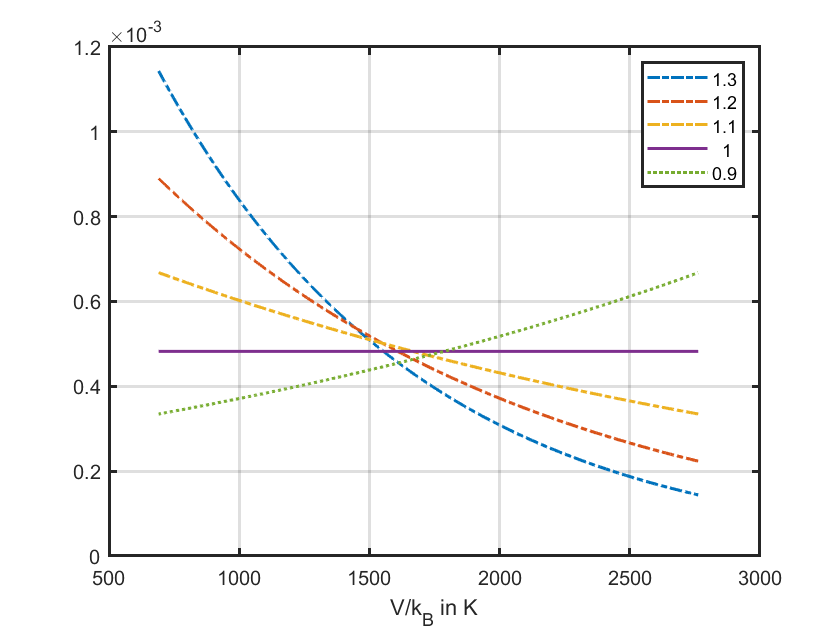
A general distribution can be further investigated by combining (7) with (4), giving:
| (8) |
This result is plotted in Fig. 1. The most apparent feature is the flat distribution for , as noted. In addition the case for is also interesting. It corresponds to an exponential energy distribution where lower energies are given more weight than higher energies.
III.3 The energy landscape
The energy landscape formulation is used in two fields of relevance to this paper, models for human tissue cells based on soft glassy media, and for structural glasses.
There is evidence that human tissue cells under the influence of shear may be modeled with soft glassy rheology [34], [14], [35]. The properties of soft glasses correspond to those of glasses at temperatures between the glass temperature and the melting point, . The cell’s mechanical properties are determined by the crowded interior of the cell. This is analogous to what takes place in a colloidal suspension and leads to the complex shear modulus following a weak power law over several frequency decades with a near constant power law exponent, similar to that of (S7). Cells are examples of a disordered metastable material which exists in a state far from thermodynamic equilibrium. The energy landscape is comprised of the binding energy between neighboring proteins. A deformation due to an incoming wave may cause a hop between energy wells where the deformation energy is taken from the wave, i.e. leading to heating and absorption of wave energy.
This is similar to what takes place in a glass even at temperatures below the glass temperature, . The main characteristic of glass is a non-crystalline, amorphous structure. A glass can be considered to be frozen in an energy basin with many local minima. The height of the barriers between them, and the energy difference between the minima will determine properties, [36]. Structural relaxation takes place due to perturbations of the landscape and this is the main cause of absorption. We are mainly concerned with normal temperatures (about 270 - 310 K), and then tunneling can be neglected and the classical model with the thermal activation rate of (4) describes the relaxation.
This describes what happens in structural glasses [32], but also rocks [37], where most minerals consist of crystalline grains, but with amorphous grain boundaries with structure similar to glasses. What are the common features of these materials which give them similar properties? The most important in our context is the presence of energy barriers with a wide energy distribution [14, 38]. This means that thermally activated relaxation will play an important role in sound absorption.
III.4 Sensitivity to energy distribution in the band-limited case
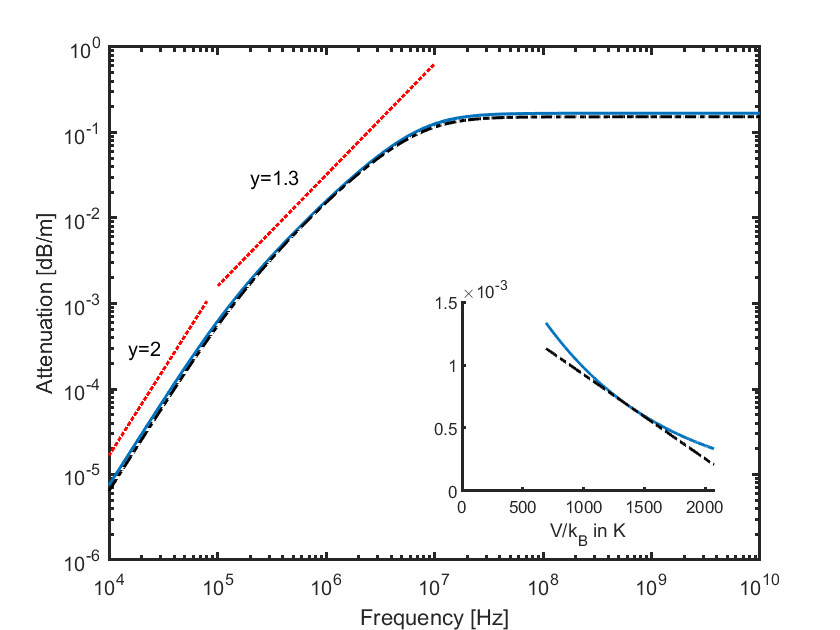
As is clear from the examples of the Introduction, the power-laws are only observed over a limited bandwidth. In [39] and [24] it is shown that (2) and (3) result in a good fit to (1) even when the range of integration is between a lower and an upper limit. This means that each component in the integral mainly affects frequencies in the vicinity of its relaxation frequency. Band limiting to a range of relaxation processes between and in (2), implies that the asymptotes of the power-law absorption will be
| (9) |
A high-frequency limit like that of (9) may in fact be required for physical reasons as a passive medium requires that the absorption should not increase faster than as approaches infinity, [40]. As noted, the low-frequency limit is relevant for modeling e.g., sub-bottom sediments, as is also elaborated on in [41]. The exponential relationship of the Arrhenius law also means that a limited range of relaxation frequencies corresponds to a relatively narrow range of activation energies.
In the band-limited case, the skewed distribution of (8) may be approximated by the first term in a Taylor series about a point in the middle of the energy range, . This point corresponds to a frequency and the linear approximation of the distribution is:
| (10) |
which is an acceptable approximation if the frequency range is not too large and the power-law exponent does not deviate too much from unity. See Fig. 2 for an example that demonstrates that when the power law of (1) is only given over two decades, the exact shape of the energy distribution is not critical. The difference between the absorption for the exact and the approximated case, are minor and most likely smaller than the measurement error in many applications. The figure also illustrates the asymptotic values given by (9).
IV Discussion
Glasses have a universal property at low temperatures, 0.1 to 10 K, where is found to be nearly independent of temperature T as well as frequency , [42], [43]. We have found here that the property that elastic wave absorption depends on frequency in a linear way around room temperature is a similar universal property which results from a flat activation energy distribution.
There are some related results in the fields of glass models and soft glassy models.
IV.1 Glasses
In [44] it is shown that in glasses, the distribution of elastic moduli, , of (S2) is proportional to the energy barrier distribution as in (7). The plots of the measured barrier distribution function for amorphous polystyrene below the glass transition temperature in Figs. 3 and 4 of [44] show a falling tendency with increasing energy, and resemble the curves of Fig. 1 for , although no explicit formula is given for the energy barrier distribution function in [44].
In that paper, Buchenau also models the time domain relaxation response as a stretched exponential or Kohlrausch function of order in the range 0.3 - 0.7, where corresponds to a falling energy barrier distribution. The link to the Kohlrausch function via the fractional Zener model for the medium is given in the Supplement and (S8) and (S9) where it is shown that .
IV.2 Soft glassy materials
An alternative way of deriving an energy distribution similar to (8) is found in the theory for soft glassy materials, [45], [46] where the medium was modeled as a Maxwell-Wiechert model as in Fig. (S1).
That theory also gives a material description in the form of a partial differential equation which expresses how regions rearrange to new positions, valid for low frequencies. The main variable is , the probability for finding an element in a trap of depth . The theory contains a constant which is an attempt frequency, and an activation factor on the same form as the Arrhenius equation. The theory is expressed in normalized units with a central parameter being the mean-field noise temperature . A glass transition occurs at and the material approaches the fluid state for . Another input is a prior distribution of traps which it is argued has an exponential tail, , [47].
The equilibrium distribution of energies above the glass transition is given by , and although the end result is not stated explicitly in [46, Sect. IV.A], it is an exponential distribution:
| (11) |
Since corresponds to , this expression is analogous to (8). In addition, it states that the parameter changes with temperature. New results are now appearing with ultrasound properties of tissue at low temperature that potentially could confirm this, [48].
Further it is demonstrated how this model leads to a dynamic modulus where both the real and the imaginary components are proportional to , as for the fractional Kelvin-Voigt model of (S7).
Thus the noise temperature and the fractional order have a simple relationship, . The soft glassy model therefore provides an interpretation of the fractional order, as well as for . The special case of concern in this article is found in the limit, as approaches one, i.e. the material approaches the glass temperature. It is also evident that the soft glassy model result of (11) for the energy distribution resembles our result (8) which we found in an independent way.
The results for glasses based on [44] and those for soft glassy media just discussed, are not fully consistent. On the one hand, the soft glassy model corresponds to above the glass transition temperature, , and approaches as is reached. On the other hand, the glass model which describes material properties below , allows for monotonically decreasing energy distributions corresponding to . This shows the need for a unified model that can describe properties both below and above in a consistent way, but the development of such a model is beyond the scope of this work.
V Conclusion
The property that elastic wave absorption depends on frequency in a linear way around room temperature is remarkable as it seems to be universal across applications as diverse as seismology, seismics, subbottom acoustics, and medical ultrasound.
Such absorption is the result of a large number of relaxation processes combined, expressed by a weighted multiple relaxation integral over frequency or over time. Only a particular weighting will model power-law absorption. It is however hard to argue physically why this particular weighting of the various contributions over relaxation frequency or relaxation time should occur. We have argued here based on properties of seawater as well as of glasses that the Arrhenius expression for activation energy is fundamental for these processes. This enables the transformation of the multiple relaxation formulation to an integral over energies in an energy landscape. The formulation derived here is not common in ultrasonics and seismics, but is found to be equivalent to an independently developed derivation in soft glassy rheology, and also agrees with measurements in glassy media.
The interesting case of linearly increasing absorption corresponds to a flat activation energy distribution, i.e., all energies are equally probable. It is still an open question why a flat energy distribution seems to indicate a form of equilibrium in many materials, while it is not the case in others like for instance the shear wave response in tissue.
Acknowledgements.
We want to thank Svein-Erik Måsøy and Kevin Parker for valuable discussions of the topic of this paper, and to Yuri Galperin, Sven Peter Näsholm and Ralph Sinkus for comments on an early version of the manuscript.References
- Morozov [2010] I. B. Morozov, On the causes of frequency-dependent apparent seismological Q, Pure Appl. Geophys. 167, 1131 (2010).
- Gurevich and Pevzner [2015] B. Gurevich and R. Pevzner, How frequency dependency of Q affects spectral ratio estimates, Geophys. 80, A39 (2015).
- Campbell [2009] K. W. Campbell, Estimates of shear-wave Q and for unconsolidated and semiconsolidated sediments in Eastern North America, Bull. Seismol. Soc. Am. 99, 2365 (2009).
- Knopoff [1964] L. Knopoff, Q, Rev. Geophys. 2, 625 (1964).
- Williams et al. [2002] K. L. Williams, D. R. Jackson, E. I. Thorsos, D. Tang, and S. G. Schock, Comparison of sound speed and attenuation measured in a sandy sediment to predictions based on the Biot theory of porous media, IEEE J. Oceanic Eng. 27, 413 (2002).
- Carey et al. [2008] W. M. Carey, A. D. Pierce, R. E. Evans, and J. D. Holmes, On the exponent in the power law for the attenuation at low frequencies in sandy sediments, J. Acoust. Soc. Am. 124, EL271 (2008).
- Wells [1975] P. Wells, Absorption and dispersion of ultrasound in biological tissue, Ultrasound. Med. Biol. 1, 369 (1975).
- Kadaba et al. [1980] M. P. Kadaba, P. K. Bhagat, and V. C. Wu, Attenuation and backscattering of ultrasound in freshly excised animal tissues, IEEE Trans. Biomed. Eng. 2, 76 (1980).
- Parker [2022] K. J. Parker, Power laws prevail in medical ultrasound, Phys. Med. & Biol. 67, 09TR02 (2022).
- Marcus and Carstensen [1975] P. W. Marcus and E. L. Carstensen, Problems with absorption measurements of inhomogeneous solids, J. Acoust. Soc. Am. 58, 1334 (1975).
- Pauly and Schwan [1971] H. Pauly and H. P. Schwan, Mechanism of absorption of ultrasound in liver tissue, J. Acoust. Soc. Am. 50, 692 (1971).
- Carstensen [1954] E. L. Carstensen, Measurement of dispersion of velocity of sound in liquids, J. Acoust. Soc. Am. 26, 858 (1954).
- Carstensen et al. [1953] E. L. Carstensen, K. Li, and H. P. Schwan, Determination of the acoustic properties of blood and its components, J. Acoust. Soc. Am. 25, 286 (1953).
- Kollmannsberger and Fabry [2009] P. Kollmannsberger and B. Fabry, Active soft glassy rheology of adherent cells, Soft Matter 5, 1771 (2009).
- Parker et al. [2019] K. Parker, T. Szabo, and S. Holm, Towards a consensus on rheological models for elastography in soft tissues, Phys Med & Biol 64, 215012 (2019).
- Szabo and Wu [2000] T. L. Szabo and J. Wu, A model for longitudinal and shear wave propagation in viscoelastic media, J. Acoust. Soc. Am. 107, 2437 (2000).
- Mézière et al. [2014] F. Mézière, M. Muller, E. Bossy, and A. Derode, Measurements of ultrasound velocity and attenuation in numerical anisotropic porous media compared to biot’s and multiple scattering models, Ultrasonics 54, 1146 (2014).
- Chotiros and Isakson [2014] N. P. Chotiros and M. J. Isakson, Shear wave attenuation and micro-fluidics in water-saturated sand and glass beads, J. Acoust. Soc. Am. 135, 3264 (2014).
- Kremkau et al. [1973] F. Kremkau, E. Carstensen, and W. Aldridge, Macromolecular interaction in the absorption of ultrasound in fixed erythrocytes, J. Acoust. Soc. Am. 53, 1448 (1973).
- Hall [1948] L. Hall, The origin of ultrasonic absorption in water, Phys. Rev. 73, 775 (1948).
- Verma [1959] G. Verma, Ultrasonic absorption due to chemical relaxation in electrolytes, Rev. Mod. Phys. 31, 1052 (1959).
- Gradshteyn and Ryzhik [2014] I. S. Gradshteyn and I. M. Ryzhik, Table of integrals, series, and products (Academic Press, 2014) fourth ed. by Y. V. Geronimus and M. Yu. Tseytlin, edited by A. Jeffrey.
- Näsholm and Holm [2011] S. P. Näsholm and S. Holm, Linking multiple relaxation, power-law attenuation, and fractional wave equations, J. Acoust. Soc. Am. 130, 3038 (2011).
- Pierce and Mast [2021] A. D. Pierce and T. D. Mast, Acoustic propagation in a medium with spatially distributed relaxation processes and a possible explanation of a frequency power law attenuation, J. Theor. Comp. Acoust. 29, 2150012 (2021).
- Fabry et al. [2001] B. Fabry, G. N. Maksym, J. P. Butler, M. Glogauer, D. Navajas, and J. J. Fredberg, Scaling the microrheology of living cells, Phys. Rev. Lett. 87, 148102 (2001).
- Kollmannsberger and Fabry [2011] P. Kollmannsberger and B. Fabry, Linear and nonlinear rheology of living cells, Ann. Rev. Mater. Res. 41, 75 (2011).
- Kinsler et al. [1999] L. E. Kinsler, A. R. Frey, A. B. Coppens, and J. V. Sanders, Fundamentals of acoustics (Wiley-VCH, New York, 1999) pp. 1–560, 4th Edition.
- Holm [2019] S. Holm, Waves with power-law attenuation (Springer and ASA Press, Switzerland, 2019) pp. 1–312.
- Ainslie and McColm [1998] M. Ainslie and J. G. McColm, A simplified formula for viscous and chemical absorption in sea water, J. Acoust. Soc. Am. 103, 1671 (1998).
- Schulkin and Marsh [1978] M. Schulkin and H. Marsh, Low-frequency sound absorption in the ocean, J. Acoust. Soc. Am. 63, 43 (1978).
- Hunklinger and Schickfus [1981] S. Hunklinger and M. v. Schickfus, Acoustic and dielectric properties of glasses at low temperatures, in Amorphous Solids (Springer, 1981) pp. 81–105.
- Phillips [1987] W. A. Phillips, Two-level states in glasses, Rep. Prog. Phys. 50, 1657 (1987).
- Galperin et al. [1989] Y. M. Galperin, V. Karpov, and V. Kozub, Localized states in glasses, Adv. Phys. 38, 669 (1989).
- Zhou et al. [2009] E. Zhou, X. Trepat, C. Park, G. Lenormand, M. Oliver, S. Mijailovich, C. Hardin, D. Weitz, J. Butler, and J. Fredberg, Universal behavior of the osmotically compressed cell and its analogy to the colloidal glass transition, Proc. Nat. Acad. Sci. 106, 10632 (2009).
- Khodadadi and Sokolov [2015] S. Khodadadi and A. Sokolov, Protein dynamics: from rattling in a cage to structural relaxation, Soft Matter 11, 4984 (2015).
- Buchenau et al. [2022] U. Buchenau, G. D’Angelo, G. Carini, X. Liu, and M. A. Ramos, Sound absorption in glasses, Rev. Phys. , 100078 (2022).
- Carcione et al. [2020] J. M. Carcione, B. Farina, F. Poletto, A. N. Qadrouh, and W. Cheng, Seismic attenuation in partially molten rocks, Phys. Earth Planet. Inter. 309, 106568 (2020).
- Carini et al. [2014] G. Carini, Jr., G. Carini, G. D’Angelo, D. Fioretto, and G. Tripodo, Identification of relaxing structural defects in densified B2O3 glasses, Phys. Rev. B 90, 140204(R) (2014).
- Näsholm [2013] S. P. Näsholm, Model-based discrete relaxation process representation of band-limited power-law attenuation, J. Acoust. Soc. Am. 133, 1742 (2013).
- Holm and Holm [2017] S. Holm and M. B. Holm, Restrictions on wave equations for passive media, J. Acoust. Soc. Am. 142, 10.1121/1.5006059 (2017).
- Holm et al. [2023] S. Holm, S. N. Chandrasekaran, and S. P. Näsholm, Adding a low frequency limit to fractional wave propagation models, Front. Phys. 11 (2023).
- Buchenau et al. [1992] U. Buchenau, Y. M. Galperin, V. L. Gurevich, D. A. Parshin, M. A. Ramos, and H. R. Schober, Interaction of soft modes and sound waves in glasses, Phys. Rev. B 46, 2798 (1992).
- Shukla [2022] P. Shukla, Universality of ultrasonic attenuation coefficient of amorphous systems at low temperatures, Sci. Rep. 12, 2662 (2022).
- Buchenau [2001] U. Buchenau, Mechanical relaxation in glasses and at the glass transition, Phys. Rev. B 63, 104203 (2001).
- Sollich et al. [1997] P. Sollich, F. Lequeux, P. Hébraud, and M. E. Cates, Rheology of soft glassy materials, Phys. Rev. Lett. 78, 2020 (1997).
- Sollich [1998] P. Sollich, Rheological constitutive equation for a model of soft glassy materials, Phys. Rev. E 58, 738 (1998).
- Bouchaud [1992] J.-P. Bouchaud, Weak ergodicity breaking and aging in disordered systems, Journal de Physique I 2, 1705 (1992).
- Liang et al. [2024] S. Liang, B. E. Treeby, and E. Martin, Review of the low-temperature acoustic properties of water, aqueous solutions, lipids, and soft biological tissues, IEEE Trans. Ultrason., Ferroelec. Freq. Contr. (2024).