GraCoRe: Benchmarking Graph Comprehension and Complex Reasoning in Large Language Models
Abstract
Evaluating the graph comprehension and reasoning abilities of Large Language Models (LLMs) is challenging and often incomplete. Existing benchmarks focus primarily on pure graph understanding, lacking a comprehensive evaluation across all graph types and detailed capability definitions. This paper presents GraCoRe, a benchmark for systematically assessing LLMs’ graph comprehension and reasoning. GraCoRe uses a three-tier hierarchical taxonomy to categorize and test models on pure graph and heterogeneous graphs, subdividing capabilities into 10 distinct areas tested through 19 tasks. Our benchmark includes 11 datasets with 5,140 graphs of varying complexity. We evaluated three closed-source and seven open-source LLMs, conducting thorough analyses from both ability and task perspectives. Key findings reveal that semantic enrichment enhances reasoning performance, node ordering impacts task success, and the ability to process longer texts does not necessarily improve graph comprehension or reasoning. GraCoRe is open-sourced at https://github.com/ZIKEYUAN/GraCoRe.
GraCoRe: Benchmarking Graph Comprehension and Complex Reasoning in Large Language Models
Zike Yuan1,2, Ming Liu1, Hui Wang2,*, Bing Qin1,*, 1Harbin Institute of Technology, Shenzhen, China, 2Peng Cheng Laboratory, Shenzhen, China
1 Introduction
Graph understanding and complex reasoning are critical capabilities of Large Language Models (LLMs) due to their wide-ranging applications in fields such as social network analysis, drug discovery, recommendation systems, and spatiotemporal predictionsBrown et al. (2020). Thus, the ability to understand and reason about graph-structured data is particularly essential for advancing Artificial General Intelligence (AGI)Zhao et al. (2023). Graph-structured data primarily includes homogeneous and heterogeneous graphs. Research on homogeneous graphs often focuses on graph-structure-specific issues, such as protein-protein interaction predictionRao et al. (2014).In contrast to homogeneous graphs, pure graphs are simpler and do not contain attribute information for nodes and edge, such as graph-theoretic problemsBorgatti and Everett (2006). For heterogeneous graphs, tasks often rely on their rich semantic information, such as those related to knowledge graph reasoning. However, the use of LLMs for parsing, understanding, and reasoning about graph-structured data remains a challenging area of study.
Firstly, the reasoning and comprehension capabilities of current large language models significantly deteriorate when handling complex graph-structured data with numerous nodes and edges. This degradation is partly due to the models’ difficulty in processing long textual inputs, especially when graph-structured data is described through lengthy texts. Long texts not only increase the computational burden but also introduce noise and redundant information, further diminishing the models’ ability to capture critical details. Secondly, textual descriptions of graph-structured data often involve complex entity relationships and abstract concepts, requiring models to both understand explicit information and infer implicit connections and relationships. Current research tends to rely on direct mappings from graph structure to answersWang et al. (2024), overlooking the potential to enhance the models’ deeper reasoning capabilities. Given the lack of systematic definitions and evaluation standards for the capabilities of large language models in graph understanding and reasoning, it is imperative to design a benchmark that extensively tests these abilities based on the models’ capabilities.
In previous research, several benchmarks have been proposed to evaluate the understanding and reasoning capabilities of LLMs on graphs. However, existing benchmarks for evaluating the graph understanding capabilities of LLMs exhibit several limitations. Firstly, there is the issue of limited generalization: current benchmarks predominantly test either pure graphs or heterogeneous graphs in isolation, failing to provide a unified and systematic evaluation across both graph structures. Additionally, there is a lack of clear definition regarding model capabilities: traditional benchmarks for LLMs on graphs are primarily task-driven, inadequately assessing the specific abilities of LLMs on graph data. Hence, there is a need to develop better benchmarks that evaluate LLMs’ capabilities more comprehensively and from an ability-based perspective, specifically focusing on graph-structured data understanding and reasoning. Lastly, there is insufficient variety in model types and task categories: current benchmarks neither offer a clear classification of task types nor test a wide range of models.
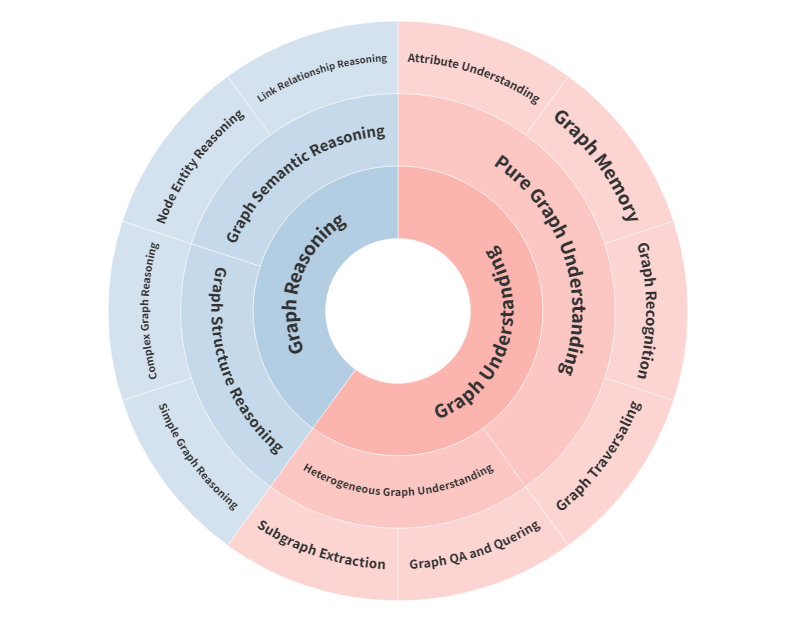
To address these challenges, we propose the GraCoRe benchmark, as shown in Figure 1, which aims to explore and evaluate the understanding and reasoning capabilities of mainstream LLMs. We have designed a three-tier hierarchical ability taxonomy that includes both capability-based and dataset-based categories. This taxonomy meticulously defines the model’s capabilities and ensures greater generalization in the testing range. Regarding model types and task divisions, our benchmark tests multiple existing closed-source and open-source models, and divides tasks into multiple dimensions based on model capabilities.
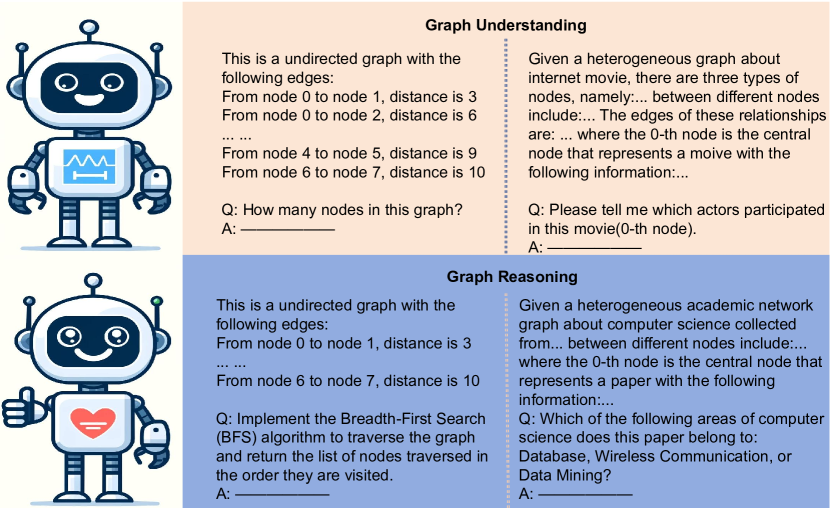
Figure 2 illustrates the overall framework of our ability taxonomy. The first layer outlines two progressive overall capabilities: graph understanding and graph reasoning. Graph understanding is the most fundamental ability, reflecting the model’s proficiency in comprehending the nodes, edges, and overall structure of the graph within the contextual data. Built upon this foundation, graph reasoning encompasses the model’s ability to utilize graph-structured data to infer implicit information. The second layer categorizes the capabilities of LLMs into four types based on different data types. In the third layer, these four categories are further divided into 10 distinct capabilities, which are ultimately tested through 19 tasks. This taxonomy provides evaluation results across three levels, from general to detailed, allowing for the identification of deficiencies in models at varying levels of granularity. For each task, we meticulously design specific prompts and construct them based on predefined rules, ultimately textualizing the structural information. GraCoRe comprises a total of 11 datasets, consisting of 5,140 graphs. We control the complexity of these graphs by adjusting factors such as graph size and network sparsity.
Finally, we conducted extensive experiments on GraCoRe to evaluate the graph understanding and reasoning abilities of large language models. We tested three closed-source LLMs and seven open-source LLMs. Our findings include the following:
-
•
We identified graph reasoning as a critical weakness in current LLMs. Most models cannot balance both graph understanding and reasoning, with GPT-4o being the most comprehensive model in both aspects.
-
•
LLMs perform better on graph reasoning tasks enriched with semantic information compared to tasks involving purely structural graph reasoning, indicating that textual information can enhance the graph reasoning abilities of LLMs.
-
•
Models exhibit high sensitivity to the ordering of nodes in textual graph data. An ordered naming of nodes can significantly improve model performance on graph tasks.
-
•
The capability of models to handle longer text inputs does not affect their performance in graph understanding and reasoning tasks, regardless of whether the graphs are complex with long textual descriptions or simple with short descriptions.
2 Related Work
LLMs for Graph Recent advancements in LLMs for graph tasks includes several notable contributions. Li et al. (2023) categorizes these tasks into three types: Enhancer, Predictor, and Alignment. Pan et al. provides a forward-looking roadmap for the unification of LLMs and Knowledge Graphs (KGs).Chai et al. (2023) proposes an end-to-end method for solving graph-related problems. Furthermore, Das et al. (2023) investigates methods to improve the zero-shot reasoning ability of LLMs over structured data in a unified manner. Yao et al. (2024) explores the graph generation capabilities of LLMs through systematic task designs and extensive experiments.
Benchmarks for LLMs on Graph Most benchmarks for evaluating LLMs on graph tasks are based on task testing. NLGraphWang et al. (2024) introduced a simple test dataset for eight graph tasks, while GPT4GraphGuo et al. (2023) tested LLM capabilities on semantic tasks. Liu and Wu (2023) assessed the capabilities of four LLMs in graph data analysis. Fatemi et al. (2023) proposed a method for describing graph data in text form. Perozzi et al. (2024) designed a hint method specifically for graph tasks. GraphInstructLuo et al. (2024) provided diverse processes and steps for graph data generation. HiGPTTang et al. (2024) proposed an evaluation method for heterogeneous graphs, and VisionGraphLi et al. (2024) assessed the capabilities of LLMs on image graphs.
| Task | Abbr. | Description |
| Node Number | NN | Calculate the total number of nodes in a graph. |
| Average Degree | AD | Calculate the average degree of the nodes in a graph. |
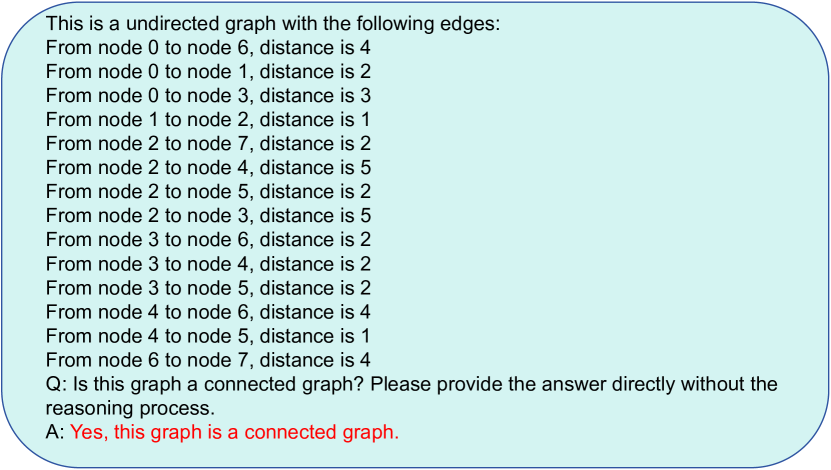
| Connectivity Test | CT | Determine if the graph is connected, meaning there is a path between any two nodes. |
| Matrix Similarity | MS | Evaluate the similarity between two adjacency matrices created from LLM and target graph. |
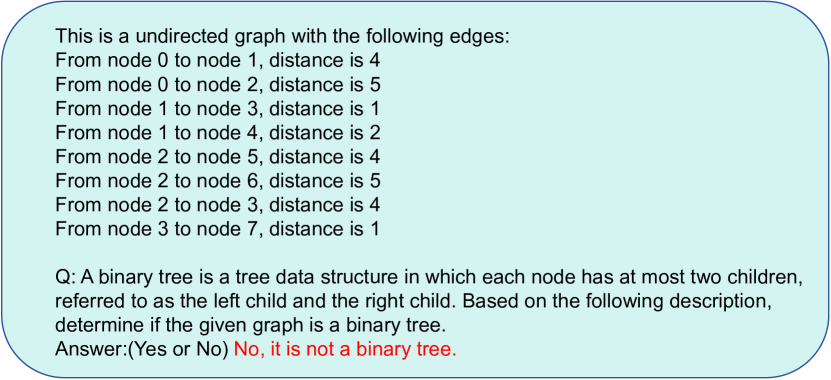
| Tree Recognition | TR | Identify if a graph is binary tree. |
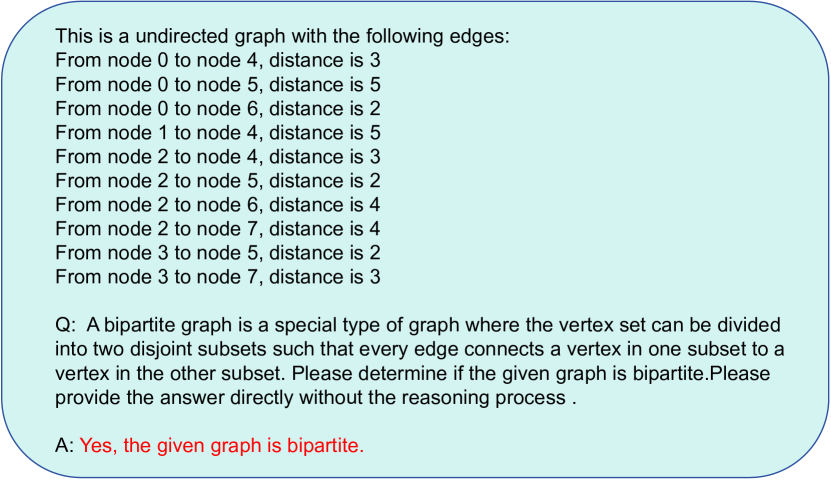
| Bipartite Recognition | BR | Identify if a graph is bipartite, meaning its nodes can be divided into two disjoint sets such that no two nodes within the same set are adjacent. |
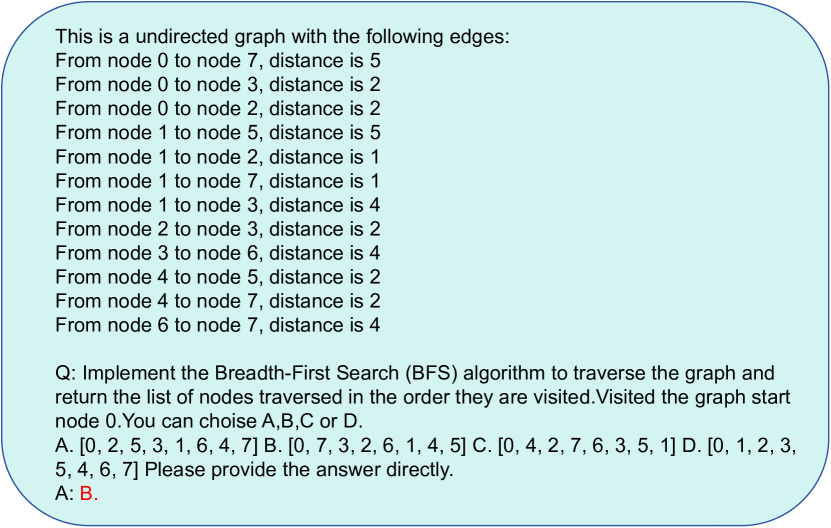
| Breadth First Search | BFS | Perform a breadth-first traversal starting from a given node. |
| Neighborhood Query | NQ | Query all nodes that are neighbors of a specified node. |
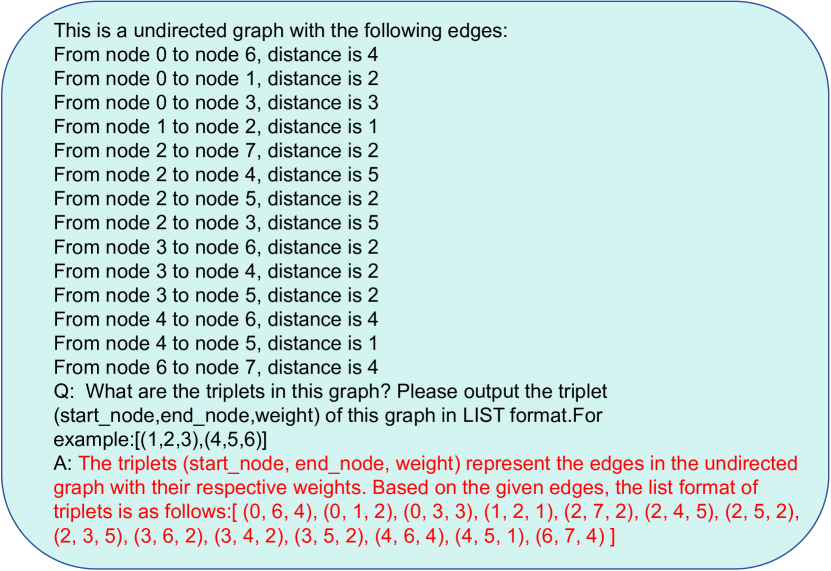
| Relationship Query | RQ | Query for specific relationships between nodes in the graph. |
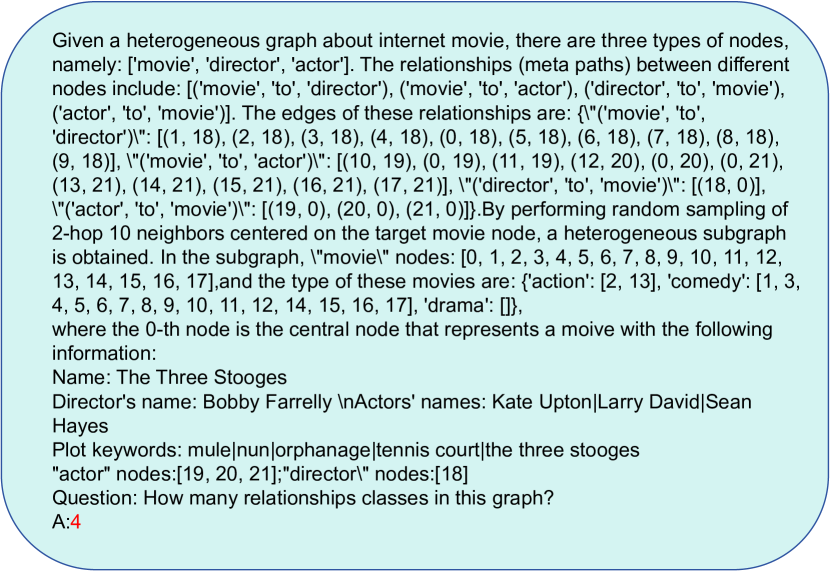
| Relation Number | RN | Count the number of relationship types in the graph. |
| Subgraph Extraction | SE | Extract a subgraph based on specified criteria or nodes. |
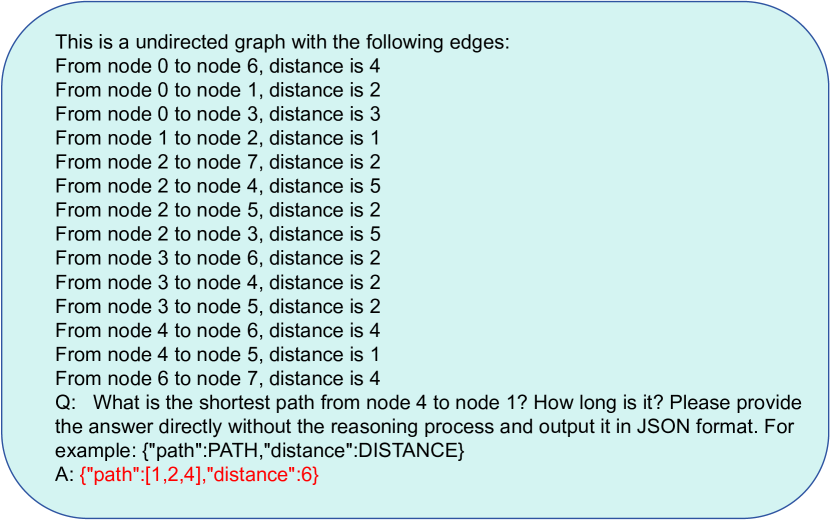
| Shortest Path | SP | Find the shortest path between two nodes in a graph. |
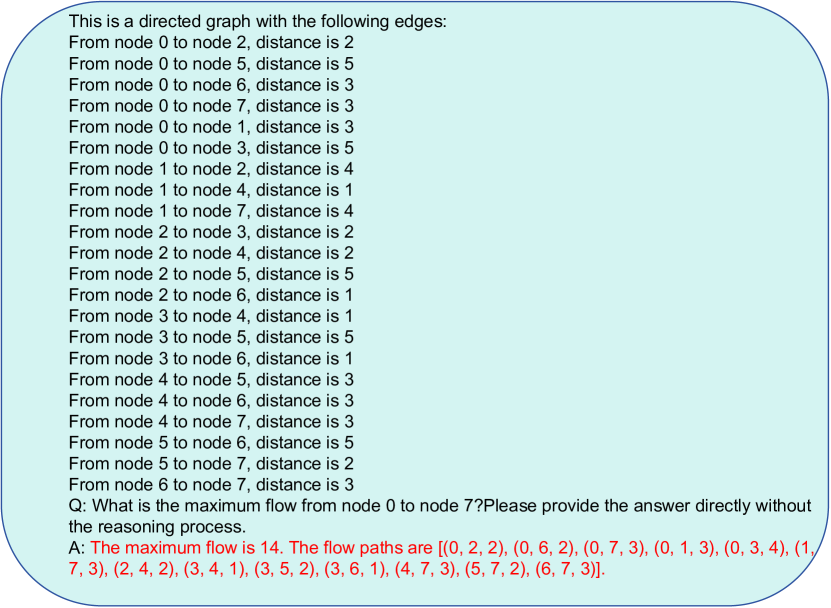
| Maximum Flow | MF | Calculate the maximum flow in a flow network. |
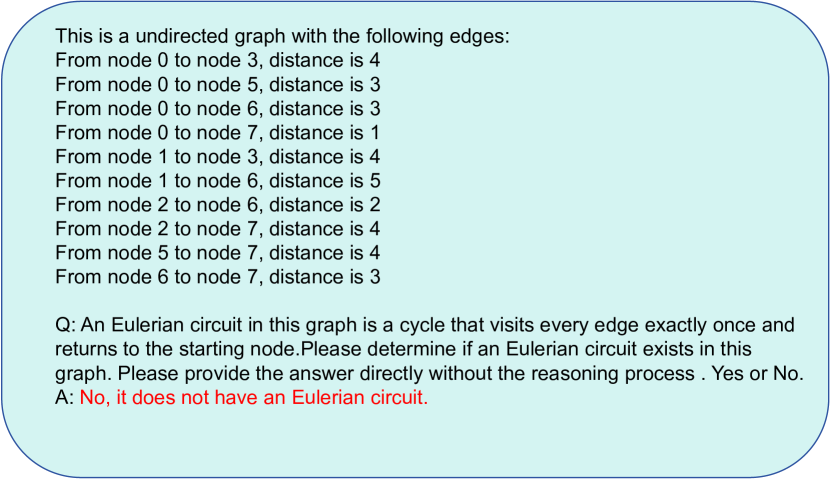
| Eulerian Path | EP | Determine if there is a path that visits every edge exactly once. |
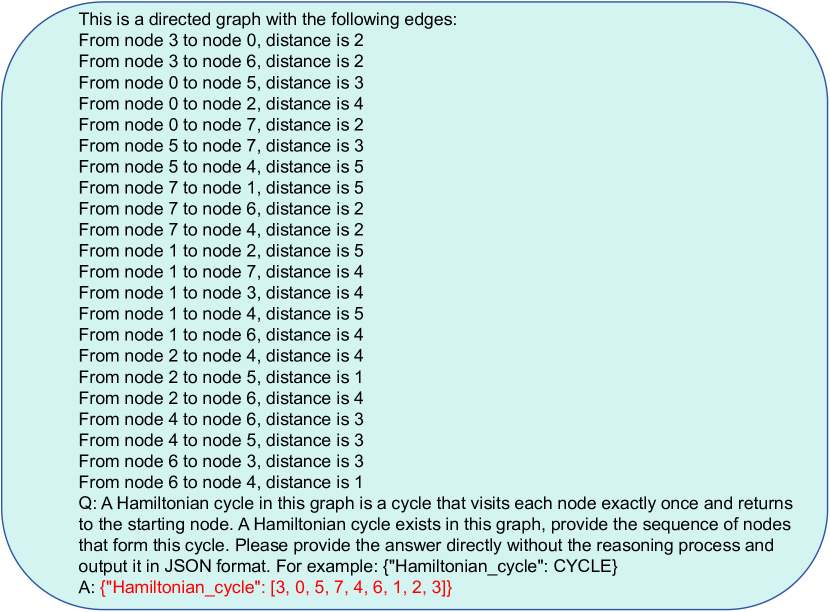
| Hamiltonian Cycle | HC | Determine if there is a cycle that visits every node exactly once and back start node. |
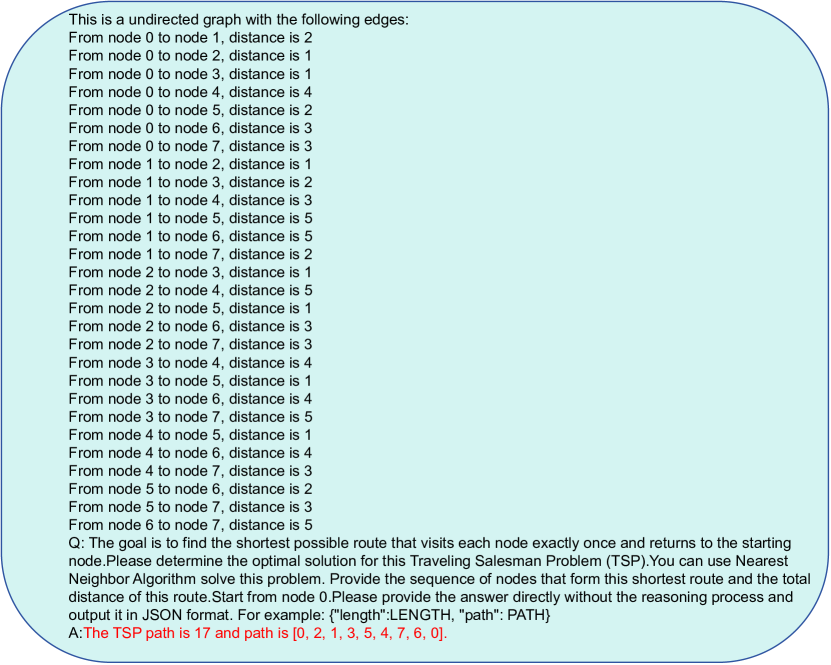
| Traveling Salesman Problem | TSP | Find the shortest possible route that visits each node exactly once and returns to the origin node. |
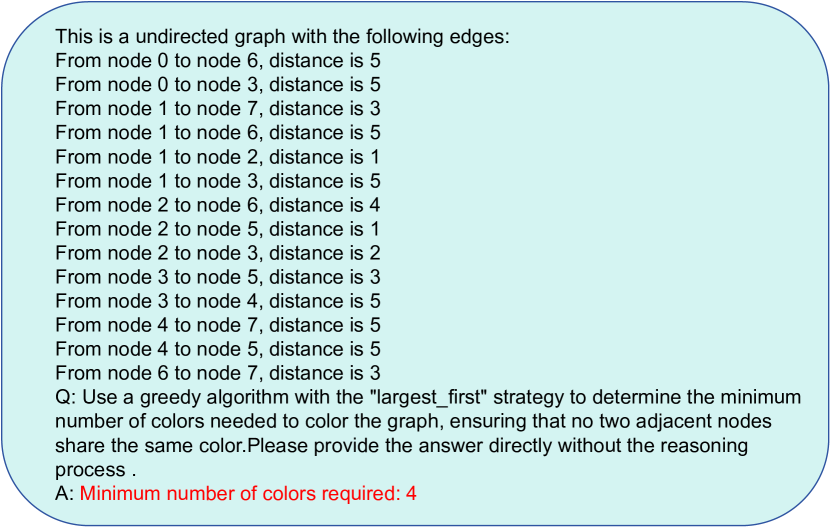
| Graph Coloring | GC | Assign colors to the nodes of the graph so that no two adjacent nodes share the same color. |
| Node Classification | NC | Classify nodes into predefined categories based on their attributes or graph structure. |
| Link Prediction | LP | Predict whether a link (edge) exists between two nodes in the graph. |
3 GraCoRe
This section begins by describing a three-tier hierarchical taxonomy for large language models (LLMs) on graph data. Next, we explain the methodology used to collect the dataset. Finally, we present an analysis of the dataset’s statistics.
3.1 Hierarchical Ability Taxonomy
After analyzing Bai et al. (2024) evaluation of the LLMs in the multi-round dialogue task, we have developed a hierarchical taxonomy for classifying LLMs capabilities on graphs, essential for their evaluation. The taxonomy is structured into three levels, encompassing 19 tasks within 10 sub-capabilities. Table 1 summarizes each task with a brief description. This section elaborates on the three levels and their corresponding tasks, with detailed examples provided in the Appendix A.
| Benchmark | Graph Type | #Graph | Average Node | Average Edge | #Node Type | #Edge Type | #Task |
| PureGra | Bipartite Graph | 460 | 18.52 | 48.9 | 1 | 1 | 5 |
| Tree Structure Graph | 460 | 19 | 18.49 | 1 | 1 | 5 | |
| Graph Traversal Graph | 460 | 19 | 52.61 | 1 | 1 | 5 | |
| Shortest Path Graph | 460 | 19 | 52.7 | 1 | 1 | 5 | |
| Max Flow Graph | 460 | 19 | 105.72 | 1 | 1 | 1 | |
| Graph Coloring | 460 | 19 | 52.7 | 1 | 1 | 1 | |
| Hamiltonian Graph | 460 | 19 | 71.7 | 1 | 1 | 1 | |
| TSP Graph | 460 | 19 | 193 | 1 | 1 | 1 | |
| Eulerian Graph | 460 | 19.48 | 104.43 | 1 | 1 | 1 | |
| HeterGra | IMDBText | 500 | 27.21 | 30.32 | 3 | 4 | 4 |
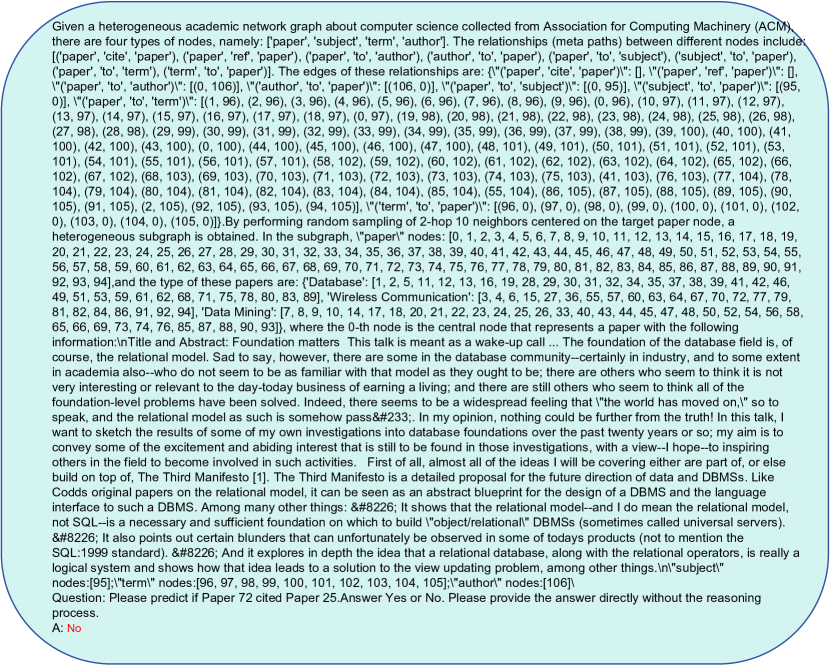
| ACMText | 500 | 157.64 | 170.92 | 4 | 8 | 2 | |
| GraCoRe | / | 5140 | / | / | / | / | 19 |
3.1.1 Graph understanding
Understanding graph structure necessitates large language models capable of accurately answering questions about the graph’s basic properties and reconstructing its structural information from extensive text descriptions. This involves two core capabilities:
Pure graph understanding: Pure graphs refer to graph data containing only structural information, representing the simplest form of graph dataJin et al. (2023). The structural information of such graphs can be encapsulated in an adjacency matrix. Consequently, research on pure graphs often emphasizes the structural information. Assessing the ability of large language models to understand pure graphs should thus focus on their capacity to comprehend structural information. To this end, I have identified four sub-capabilities:
-
•
Pure Graph Attribute Understanding: The most intuitive measure of understanding graph structure information is the correct comprehension of its basic attributes, such as the number of nodes, average degree, and performance on several sub-tasks related to node connectivity.
-
•
Pure Graph Memory: This requires the large language model to reconstruct the input graph structure data, testing its memory capacity. This is specifically evaluated by the similarity scoreLahitani et al. (2016) of the reconstructed matrix.
-
•
Pure Graph Recognition: For graph data with different structures, the model must be able to recognize and distinguish them. This study uses bipartite graphs and tree graphs to evaluate this capability.
-
•
Graph Traversal: Traversal is fundamental to solving many graph theory reasoning problems. The model’s performance in reasoning tasks is influenced by its traversal capability. This study primarily tests whether the model can traverse a graph using Breadth-First Search (BFS)Beamer et al. (2013).
Heterogeneous graph understanding: Unlike pure graphs, heterogeneous graphs often contain rich semantic information, with much of the data collected from real-world scenarios. Consequently, understanding heterogeneous graphs typically involves grasping their semantic information, whereas understanding their structural information is less critical. We have refined this into two sub-capabilities:
-
•
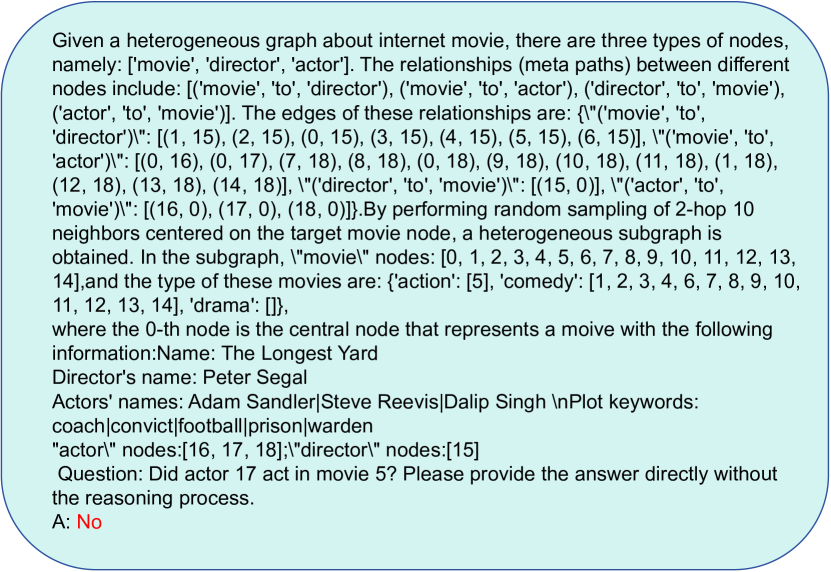
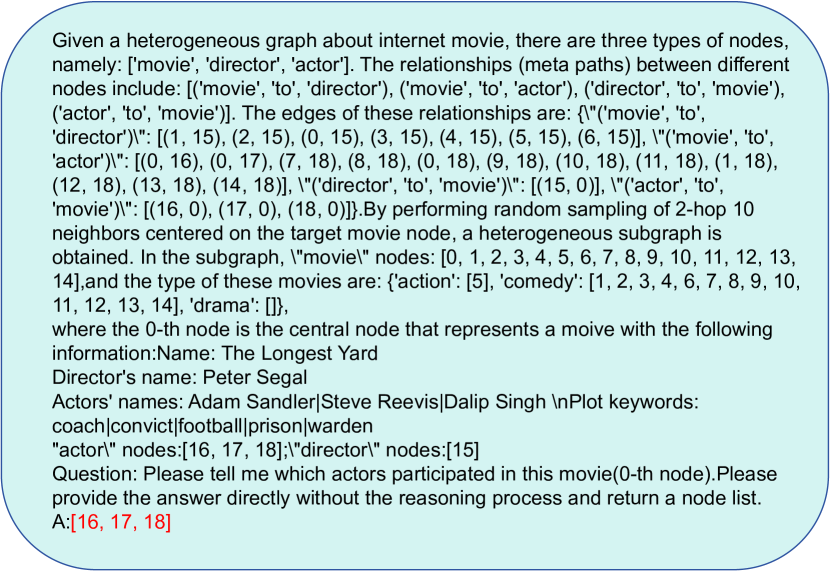
Graph QA and Querying: Given the rich semantic information in heterogeneous graphs, the ability of large language models to perform question-answering and querying is crucial. This capability includes three sub-tasks: querying neighbor nodes, answering questions about node relationships, and querying the number of relationships.
-
•
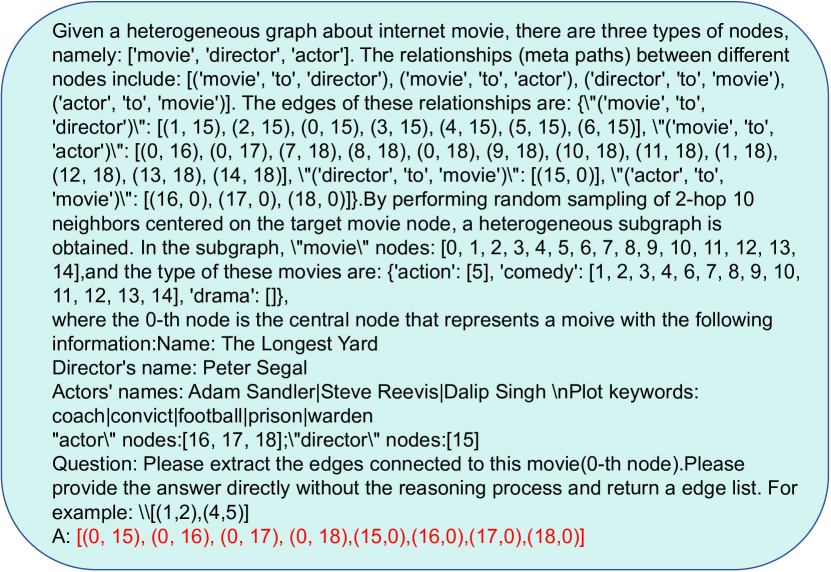
Subgraph Extraction: This pertains to the overall understanding of relationships and nodes within heterogeneous graphs, assessing the model’s ability to extract relevant subgraphs.
3.1.2 Graph reasoning
Based on the graph understanding capabilities of LLMs, their graph reasoning abilities are also worth exploring. This ability requires the model to infer hidden information from known graph data. It includes the following two core capabilities:
Graph structure reasoning: Graph structural information reasoning requires large language models to understand the nodes, edges, and their connections to infer the overall structural characteristics of the graph or the structural patterns of specific subgraphs. For example, the model should be able to identify cycles, paths, tree structures, and hierarchical structures within the graph, and use these structural features for further reasoning. Tasks related to structural reasoning are primarily focused on graph theory problems. We classify the complexity of these problems into two categories: Simple Graph Theory Problems Reasoning and Complex Graph Theory Problems Reasoning. The classification criterion is the time complexity of the corresponding algorithms. Simple graph theory problems are solvable in polynomial time, while complex graph theory problems are NP-complete, requiring significantly more time to solve. This classification tests the model’s capability in reasoning about graph theory problems. We have selected three representative problems for testing within each of these categories.
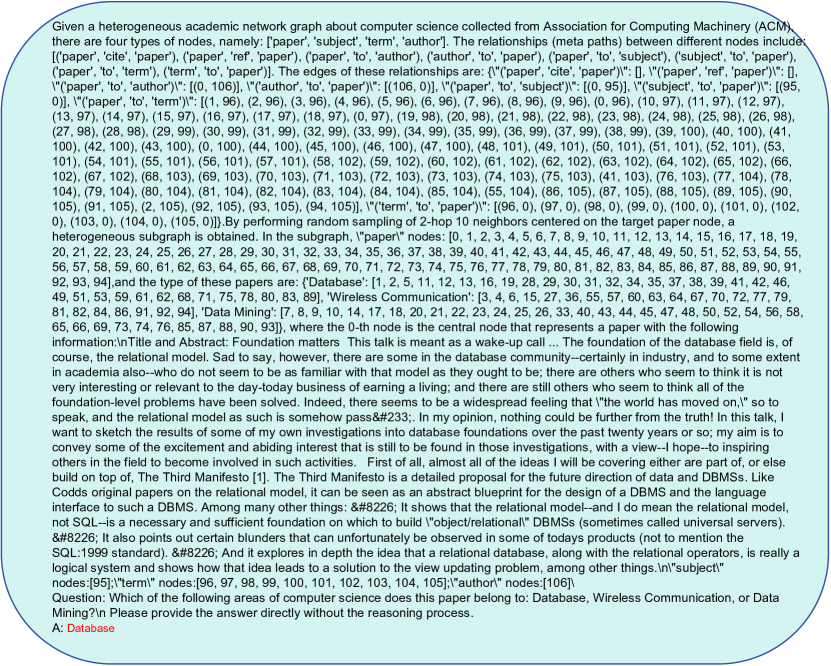
Graph semantic reasoning: Unlike structure-based reasoning, semantic information reasoning in graphs requires large language models to deeply understand the semantic meanings of nodes and edges, and to reason based on this semantic information. This involves modeling and reasoning about entities, relationships, and their interactions within the graph. Based on these tasks, we subdivide the semantic reasoning capabilities of large language models into Node Entity Reasoning and Link Relationship Reasoning. Corresponding tasks include node classification and link prediction. Previous studies have primarily addressed these two problems using graph neural networks (GNNs) such as GCNKipf and Welling (2016) and GraphSAGEHamilton et al. (2017). These methods typically require large structured graph data for training and cannot directly utilize graph data containing text information for inference. Consequently, investigating the use of large models for semantic reasoning is highly significant. This research will explore whether text enhancement impacts the performance of LLMs on these two tasks
3.2 Data Collection
We first divide the dataset into pure graphs and heterogeneous graphs to test the capabilities of large language models on these two types of datasets. For pure graphs, we customize unique data generation prompts based on the specific characteristics of each task, generating corresponding graph structure data using manually set rules. The scale of the graph is defined by the number of nodes and the sparsity of the network, ensuring that the generated data meets the specific needs of each task. For heterogeneous graph data, we use the ACMWang et al. (2019) and IMDBFu et al. (2020) datasets, converting them into text-based graph data. These are constructed according to a manually specified graph structure description framework, and unique prompts are designed for each task to build the dataset.
After generating the benchmark datasets, we also designed specific few-shot prompts for each task to test the model’s capabilities. These prompt datasets will be included in the benchmark data to provide additional testing options. Finally, we will provide a standard answer for each task and filter out graph data that does not meet the corresponding task requirements.
| Model | Pure Graph | Heterogeneous Graph | ||||||||||||||||||||
|
|
|
|
|
|
|||||||||||||||||
| NN | AD | CT | MS | TR | BR | BFS | NQ | RQ | RN | SE | ||||||||||||
| GPT-4o | 75.012 | 94.339 | 51.752 | 73.886 | 98.639 | 52.789 | 73.136 | 80.298 | 68.642 | 77.347 | 83.649 | |||||||||||
| GPT-4 | 74.898 | 82.494 | 70.146 | 73.82 | 75.85 | 32.023 | 72.455 | 89.205 | 68.39 | 80.095 | 84.717 | |||||||||||
| GPT-3.5 | 75.012 | 62.358 | 46.51 | 70.897 | 23.7 | 79.558 | 79.869 | 57.03 | 34.508 | 57.926 | 59.261 | |||||||||||
| Llama3-ins-8b | 69.065 | 32.597 | 32.881 | 56.348 | 69.277 | 30.239 | 79.718 | 39.398 | 67.886 | 73.499 | 44.663 | |||||||||||
| Llama2-7b-chat | 22.521 | 50.661 | 66.429 | 48.442 | 41.668 | 30.239 | 50.593 | 38.489 | 2.263 | 44.552 | 37.542 | |||||||||||
| Chatglm3-6b | 30.527 | 45.627 | 69.002 | 47.246 | 38.6 | 30.239 | 36.447 | 16.131 | 27.832 | 19.024 | 20.275 | |||||||||||
| Chatglm2-32k-7b | 18.69 | 27.563 | 22.492 | 7.851 | 48.241 | 100 | 16.249 | 64.211 | 27.832 | 19.024 | 31.312 | |||||||||||
| Vicuna-v1.5-16k | 40.933 | 38.372 | 0 | 47.446 | 29.397 | 52.14 | 30.698 | 46.851 | 66.123 | 68.003 | 38.343 | |||||||||||
| Qwen2-7b-ins | 68.322 | 14.238 | 71.289 | 65.582 | 50.432 | 62.037 | 37.885 | 53.849 | 67.886 | 23.849 | 76.707 | |||||||||||
| Vicuna-v1.5-7b | 24.523 | 51.253 | 69.002 | 7.984 | 23.7 | 30.239 | 22.452 | 14.041 | 68.138 | 36.185 | 23.034 | |||||||||||
| Model | Graph Structure Reasoning | Graph Semantic Reasoning | Average | Total Score | |||||||||||
|
|
|
|
||||||||||||
| SP | MF | EP | HC | TSP | GC | NC | LP | ||||||||
| GPT-4o | 99.268 | 41.714 | 81.963 | 61.792 | 80.692 | 58.327 | 86.743 | 79.702 | 1.01 | 1419.69 | |||||
| GPT-4 | 68.526 | 26.463 | 82.776 | 65.548 | 63.373 | 49.208 | 85.286 | 73.2 | 0.793 | 1318.473 | |||||
| GPT-3.5 | 39.607 | 32.563 | 80.845 | 82.338 | 48.218 | 76.353 | 75.344 | 62.262 | 0.419 | 1144.161 | |||||
| Llama3-ins-8b | 58.365 | 47.815 | 38.887 | 91.617 | 20.074 | 85.048 | 46.462 | 70.62 | 0.226 | 1054.461 | |||||
| Llama2-7b-chat | 50.55 | 81.369 | 23.444 | 29.095 | 24.404 | 65.75 | 35.835 | 43.583 | -0.347 | 787.429 | |||||
| Chatglm3-6b | 11.992 | 81.369 | 55.853 | 28.653 | 59.043 | 64.689 | 41.663 | 28.62 | -0.421 | 752.831 | |||||
| Chatglm2-32k-7b | 19.287 | 81.369 | 35.331 | 28.653 | 48.218 | 23.335 | 25.293 | 26.556 | -0.595 | 671.508 | |||||
| Vicuna-v1.5-16k | 43.776 | 20.362 | 24.257 | 28.653 | 20.074 | 8.49 | 15.694 | 42.551 | -0.616 | 662.165 | |||||
| Qwen2-7b-ins | 52.113 | 60.016 | 51.18 | 54.06 | 91.517 | 37.544 | 47.233 | 67.318 | 0.223 | 1053.057 | |||||
| Vicuna-v1.5-7b | 56.021 | 26.463 | 24.968 | 29.095 | 43.889 | 30.758 | 39.949 | 5.091 | -0.691 | 626.783 | |||||
3.3 Data Statistics
Table 2 shows several key statistics of our GraCoRe benchmark. We categorized the dataset based on graph structure into two main datasets: PureGra and HeterGra. Each main dataset contains multiple sub-datasets used for corresponding task testing. In total, there are 19 tasks with up to 5,140 graphs. Detailed statistics for each task can be found in the Appendix A.
For pure graph data, the datasets include graphs with 8 to 30 nodes, with 20 test graphs per dataset. This design is intended to assess the impact of graph complexity on the performance of large language models. For heterogeneous graph data, we divided them into IMDBText and ACMText datasets. The ACMText dataset is more complex and extensive, containing more semantic information than the IMDBText dataset. Therefore, the ACMText dataset is primarily used for complex reasoning tasks, including node classification and edge prediction.
GraCoRe is the first benchmark specifically focused on the fine-grained understanding and reasoning capabilities of large language models on graph data.
3.4 Evaluation
This thesis evaluates the output of large language models (LLMs) using exact match accuracy. We focus on various output types, including boolean values (e.g., graph recognition tasks), integers (e.g., path lengths), floating-point numbers (e.g., similarity and average degree), and lists of nodes (e.g., paths). For tasks with multiple possible solutions (e.g., BFS), we verify whether the output constitutes a valid answer.
Since the metrics of different GraCoRe tasks are incomparable and differently sensitive, less experienced audiences cannot easily compare and interpret results, which is also prevalent in recent LLM benchmarks like KolaYu et al. (2023). Therefore, we utilized standardized global scoresDyck et al. (2005) to evaluate the performance of LLMs on each task.
Given a task set and an evaluated model set , so represents the performance of model on task . Then the standardized score can be calculated as:
| (1) |
where (·) and (·) denote the mean and standard deviation.Next, we use the Min-Max scalingPatro and Sahu (2015) method to adjust the scores to the range of 0-100, making it easier to observe and compare the results. The final scores are presented as:
| (2) |
where the functions max () and min () correspond to the maximum and minimum of all scores.
4 Experiments
4.1 Experimental Setup
Based on the GraCoRe benchmark, we aim to investigate whether language models can understand and reason about graph structures through textual descriptions of graph data. Additionally, we explore whether designed prompts can enhance the models’ performance on graph-related tasks.
Models and Settings We evaluated a total of eight popular models on the GraCoRe benchmark, including three closed-source models and five open-source models. The closed-source models are: GPT-4o, GPT-4, and GPT-3.5Achiam et al. (2023). The open-source models are: LLama3-ins-8b, LLama2-7b-chatTouvron et al. (2023), Chatglm3-6b, Chatglm2-32k-7bDu et al. (2021), Vicuna-v1.5-7b, Vicuna-v1.5-16k-7bChiang et al. (2023) and Qwen2-7b-insBai et al. (2023). More details about these models can be found in the appendix.
4.2 Main Results
Task Dimensional Analysis Table 3 and Table 4 shows the performance of various large language models across 19 different tasks in our GraCoRe benchmark. Among all tasks, graph understanding tasks are generally less challenging for the models, while graph reasoning tasks are more difficult. This conclusion is reflected in the performance of each model. Additionally, closed-source models, such as those developed by OpenAI, consistently demonstrated superior performance. The GPT-4o model achieved the highest total score of 1419, ranking first. Among open-source models, Llama3-8b and Qwen2-7b-ins also performed exceptionally well, scoring 1054 and 1053 respectively, ranking fourth and fifth, just behind the OpenAI models. In contrast, Chatglm2-7b model performance was less satisfactory compared to other open-source models. Regarding task types, performance on reasoning tasks was not ideal, but this outcome was expected.
Additionally, the average -scores indicate a significant gap between open-source models and commercial closed-source models. Only the Llama3-8b and Qwen2-7b-ins models have -scores greater than 0, indicating performance above the average level. This suggests that the open-source community needs more collaboration to support and improve the latest open-source large language models. It is noteworthy that these two open-source models have graph understanding and reasoning capabilities approaching those of the GPT-3.5 model.
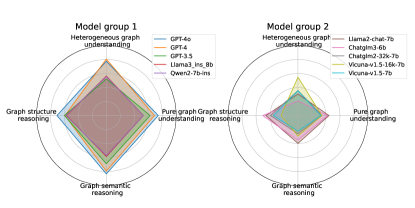
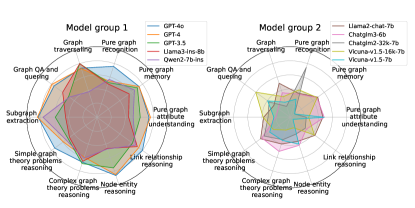
Ability Dimensional Analysis We further analyze Table 3 and Table 4 to evaluate the overall performance of the models from a capability perspective. We use radar charts to present the second and third layers of the three-tier taxonomy in a more intuitive manner. Left part of Figure 3 shows the performance of LLMs across four different capability dimensions at the second layer, where each dimension’s score is the average of its respective tasks. It can be observed that most models perform well in graph understanding and semantic reasoning but need improvement in structural reasoning tasks. For most open-source models, performance in heterogeneous graph understanding tasks is not very satisfactory.
Right part of Figure 3 provides a more granular view of LLMs’ performance across ten capability dimensions at the third layer. It is evident that the reasoning abilities of large language models in graph theory problems are not very strong, particularly in complex graph theory tasks. Furthermore, GPT-4 and GPT-4o exhibit robust and balanced graph processing capabilities, especially excelling in complex tasks. In contrast, other models show less balanced performance in graph processing. For instance, the Vicuna-v1.5-16k-7b model excels in understanding heterogeneous graph structures but performs poorly in other areas, suggesting that the rich semantic information may enhance the model’s graph processing capabilities.
Long-Text-Specific Models Since graph structure data described in text often consists of long texts, the ability of models to handle long texts is also worth noting. As shown in Table 3, models capable of processing long texts, such as Chatglm2-32k-7b and Vicuna-v1.5-16k-7b, performed poorly in graph processing tasks. Compared to other models, their performance was even lower. This suggests that despite being designed for long text input and output, these models still require further development and training to effectively enhance their graph processing capabilities.
4.3 Further Analysis
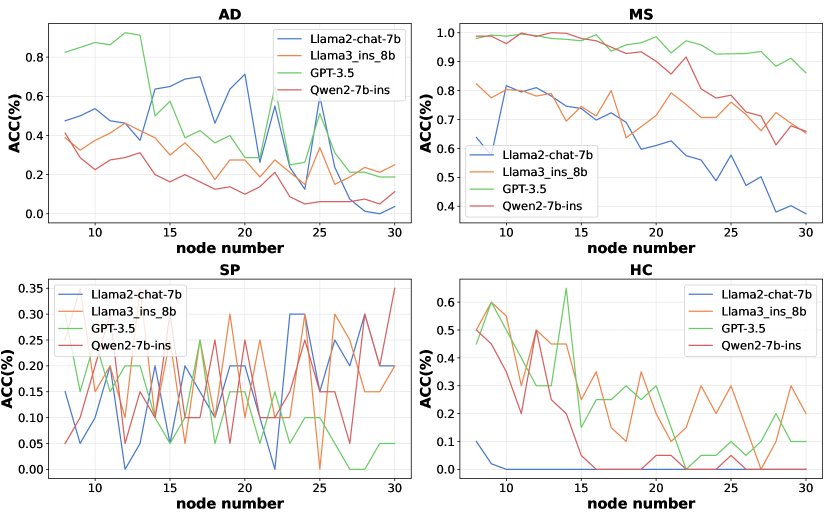
Effect of Graph Size Figure 4 illustrates the performance of the model across four tasks as the number of nodes increases. Specifically, we used two graph understanding tasks and two graph reasoning tasks to evaluate the model’s performance. The results indicate that as the number of nodes increases, the performance on each task decreases. In the graph understanding tasks, the impact is particularly significant on the average degree task. We hypothesize that the increase in nodes leads to a substantial rise in computational demands, resulting in decreased accuracy. In the graph reasoning tasks, we observed that for the shortest path problem, the performance of GPT-3.5 diminishes with an increasing number of nodes. However, for the other three open-source models, the node size appears to have minimal impact. This may be because the added nodes do not affect the search for the original path, though further experiments are needed to confirm this hypothesis.
Effect of Random Sort Since our data consists of randomly generated graphs with nodes named by numbers, the performance of node-related tasks may be affected by changes in node order. In this study, we examine the impact of text order on the understanding of graph structures by large language models by comparing random sorting with sequential sorting. The results in Table 5 indicate that the model’s performance under sequential sorting is often superior to that under random sorting, particularly in graph path reasoning tasks, where the impact is significant. This suggests that renaming nodes and ordering them sequentially can enhance model performance in path reasoning problems. However, it also highlights the model’s lack of training on graph data with random sorting.
Model NN ST BR SP HP GPT-3.5 sort 0.993 0.954 0.504 0.117 0.243 random 0.968 0.865 0.346 0.070 0.048 Qwen2-7b sort 0.876 0.874 0.396 0.165 0.115 random 0.773 0.885 0.374 0.159 0.000 Llama3-ins-6b sort 0.889 0.735 0.200 0.189 0.285 random 0.786 0.809 0.200 0.198 0.059
Effect of Text Enhancement
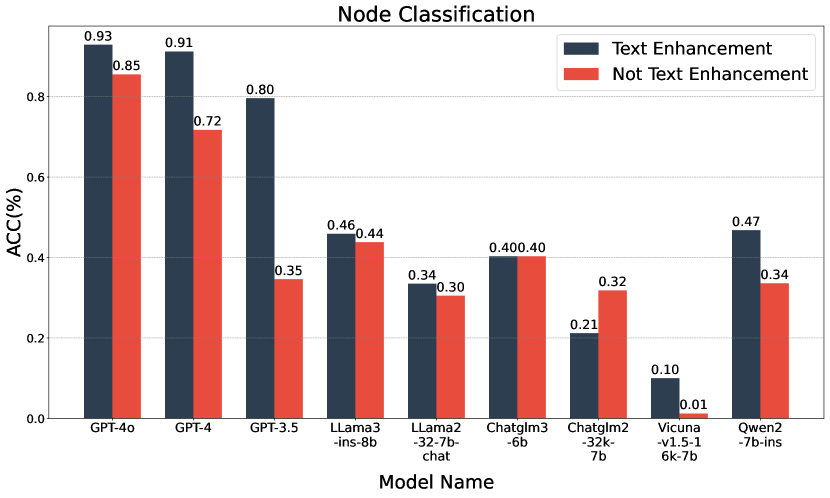
Heterogeneous graphs often contain rich semantic information, which typically aids models in understanding and reasoning about graph text information. If enhanced text information, such as paper titles and abstracts in the ACMText data is removed, can large language models perform reasoning based solely on the remaining structural information? Figure 5 compares the performance of different large language models on the node classification problem. The results indicate that large language models can reason about graphs without enhanced text information, particularly the GPT-4 and GPT-4o models, which maintain strong node prediction capabilities even without text information. However, for the GPT-3.5 model, the absence of text information significantly impacts performance. For other open-source models, the presence or absence of text information appears to have minimal impact.
5 Conclusion
This paper introduces GraCoRe, a benchmark designed to evaluate the capability of large language models (LLMs) in understanding and reasoning with graph-structured data. We develop a detailed, multi-level classification system to assess model performance on graph-based tasks. Utilizing GraCoRe, we evaluate 10 prominent LLMs, revealing significant deficiencies in their graph reasoning abilities. Extensive experimental results demonstrate the effectiveness of our benchmark in measuring the performance of LLMs on graph tasks.
6 Limitations
As LLMs continue to develop, the volume of training data and their capacity to represent graphs are likely to increase. Our current evaluation may not encompass all their capabilities, and some models might incorporate our data for training, potentially influencing the final evaluation outcomes. In the future, we aim to continually refine and update the GraCoRe benchmark to more effectively assess the graph understanding and reasoning abilities of emerging LLMs.
References
- Achiam et al. (2023) Josh Achiam, Steven Adler, Sandhini Agarwal, Lama Ahmad, Ilge Akkaya, Florencia Leoni Aleman, Diogo Almeida, Janko Altenschmidt, Sam Altman, Shyamal Anadkat, et al. 2023. Gpt-4 technical report. arXiv preprint arXiv:2303.08774.
- Bai et al. (2024) Ge Bai, Jie Liu, Xingyuan Bu, Yancheng He, Jiaheng Liu, Zhanhui Zhou, Zhuoran Lin, Wenbo Su, Tiezheng Ge, Bo Zheng, et al. 2024. Mt-bench-101: A fine-grained benchmark for evaluating large language models in multi-turn dialogues. arXiv preprint arXiv:2402.14762.
- Bai et al. (2023) Jinze Bai, Shuai Bai, Yunfei Chu, Zeyu Cui, Kai Dang, Xiaodong Deng, Yang Fan, Wenbin Ge, Yu Han, Fei Huang, et al. 2023. Qwen technical report. arXiv preprint arXiv:2309.16609.
- Beamer et al. (2013) Scott Beamer, Krste Asanović, and David Patterson. 2013. Direction-optimizing breadth-first search. Scientific Programming, 21(3-4):137–148.
- Borgatti and Everett (2006) Stephen P Borgatti and Martin G Everett. 2006. A graph-theoretic perspective on centrality. Social networks, 28(4):466–484.
- Brown et al. (2020) Tom Brown, Benjamin Mann, Nick Ryder, Melanie Subbiah, Jared D Kaplan, Prafulla Dhariwal, Arvind Neelakantan, Pranav Shyam, Girish Sastry, Amanda Askell, et al. 2020. Language models are few-shot learners. Advances in neural information processing systems, 33:1877–1901.
- Chai et al. (2023) Ziwei Chai, Tianjie Zhang, Liang Wu, Kaiqiao Han, Xiaohai Hu, Xuanwen Huang, and Yang Yang. 2023. Graphllm: Boosting graph reasoning ability of large language model. arXiv preprint arXiv:2310.05845.
- Chiang et al. (2023) Wei-Lin Chiang, Zhuohan Li, Zi Lin, Ying Sheng, Zhanghao Wu, Hao Zhang, Lianmin Zheng, Siyuan Zhuang, Yonghao Zhuang, Joseph E Gonzalez, et al. 2023. Vicuna: An open-source chatbot impressing gpt-4 with 90%* chatgpt quality, march 2023. URL https://lmsys. org/blog/2023-03-30-vicuna, 3(5).
- Das et al. (2023) Debarati Das, Ishaan Gupta, Jaideep Srivastava, and Dongyeop Kang. 2023. Which modality should i use–text, motif, or image?: Understanding graphs with large language models. arXiv preprint arXiv:2311.09862.
- Du et al. (2021) Zhengxiao Du, Yujie Qian, Xiao Liu, Ming Ding, Jiezhong Qiu, Zhilin Yang, and Jie Tang. 2021. Glm: General language model pretraining with autoregressive blank infilling. arXiv preprint arXiv:2103.10360.
- Dyck et al. (2005) Peter J Dyck, Christopher J Boes, Donald Mulder, Clark Millikan, Anthony J Windebank, P James B Dyck, and Raul Espinosa. 2005. History of standard scoring, notation, and summation of neuromuscular signs. a current survey and recommendation. Journal of the Peripheral Nervous System, 10(2):158–173.
- Fatemi et al. (2023) Bahare Fatemi, Jonathan Halcrow, and Bryan Perozzi. 2023. Talk like a graph: Encoding graphs for large language models. arXiv preprint arXiv:2310.04560.
- Fu et al. (2020) Xinyu Fu, Jiani Zhang, Ziqiao Meng, and Irwin King. 2020. Magnn: Metapath aggregated graph neural network for heterogeneous graph embedding. In Proceedings of the web conference 2020, pages 2331–2341.
- Guo et al. (2023) Jiayan Guo, Lun Du, Hengyu Liu, Mengyu Zhou, Xinyi He, and Shi Han. 2023. Gpt4graph: Can large language models understand graph structured data? an empirical evaluation and benchmarking. arXiv preprint arXiv:2305.15066.
- Hamilton et al. (2017) Will Hamilton, Zhitao Ying, and Jure Leskovec. 2017. Inductive representation learning on large graphs. Advances in neural information processing systems, 30.
- Jin et al. (2023) Bowen Jin, Gang Liu, Chi Han, Meng Jiang, Heng Ji, and Jiawei Han. 2023. Large language models on graphs: A comprehensive survey. arXiv preprint arXiv:2312.02783.
- Kipf and Welling (2016) Thomas N Kipf and Max Welling. 2016. Semi-supervised classification with graph convolutional networks. arXiv preprint arXiv:1609.02907.
- Lahitani et al. (2016) Alfirna Rizqi Lahitani, Adhistya Erna Permanasari, and Noor Akhmad Setiawan. 2016. Cosine similarity to determine similarity measure: Study case in online essay assessment. In 2016 4th International conference on cyber and IT service management, pages 1–6. IEEE.
- Li et al. (2023) Yuhan Li, Zhixun Li, Peisong Wang, Jia Li, Xiangguo Sun, Hong Cheng, and Jeffrey Xu Yu. 2023. A survey of graph meets large language model: Progress and future directions. arXiv preprint arXiv:2311.12399.
- Li et al. (2024) Yunxin Li, Baotian Hu, Haoyuan Shi, Wei Wang, Longyue Wang, and Min Zhang. 2024. Visiongraph: Leveraging large multimodal models for graph theory problems in visual context. arXiv preprint arXiv:2405.04950.
- Liu and Wu (2023) Chang Liu and Bo Wu. 2023. Evaluating large language models on graphs: Performance insights and comparative analysis. arXiv preprint arXiv:2308.11224.
- Luo et al. (2024) Zihan Luo, Xiran Song, Hong Huang, Jianxun Lian, Chenhao Zhang, Jinqi Jiang, Xing Xie, and Hai Jin. 2024. Graphinstruct: Empowering large language models with graph understanding and reasoning capability. arXiv preprint arXiv:2403.04483.
- (23) Shirui Pan, Linhao Luo, Yufei Wang, Chen Chen, Jiapu Wang, and Xindong Wu. Unifying large language models and knowledge graphs: A roadmap, 2023. arXiv preprint arXiv:2306.08302.
- Patro and Sahu (2015) SGOPAL Patro and Kishore Kumar Sahu. 2015. Normalization: A preprocessing stage. arXiv preprint arXiv:1503.06462.
- Perozzi et al. (2024) Bryan Perozzi, Bahare Fatemi, Dustin Zelle, Anton Tsitsulin, Mehran Kazemi, Rami Al-Rfou, and Jonathan Halcrow. 2024. Let your graph do the talking: Encoding structured data for llms. arXiv preprint arXiv:2402.05862.
- Rao et al. (2014) V Srinivasa Rao, K Srinivas, GN Sujini, and GN Sunand Kumar. 2014. Protein-protein interaction detection: methods and analysis. International journal of proteomics, 2014(1):147648.
- Tang et al. (2024) Jiabin Tang, Yuhao Yang, Wei Wei, Lei Shi, Long Xia, Dawei Yin, and Chao Huang. 2024. Higpt: Heterogeneous graph language model. arXiv preprint arXiv:2402.16024.
- Touvron et al. (2023) Hugo Touvron, Louis Martin, Kevin Stone, Peter Albert, Amjad Almahairi, Yasmine Babaei, Nikolay Bashlykov, Soumya Batra, Prajjwal Bhargava, Shruti Bhosale, et al. 2023. Llama 2: Open foundation and fine-tuned chat models. arXiv preprint arXiv:2307.09288.
- Wang et al. (2024) Heng Wang, Shangbin Feng, Tianxing He, Zhaoxuan Tan, Xiaochuang Han, and Yulia Tsvetkov. 2024. Can language models solve graph problems in natural language? Advances in Neural Information Processing Systems, 36.
- Wang et al. (2019) Xiao Wang, Houye Ji, Chuan Shi, Bai Wang, Yanfang Ye, Peng Cui, and Philip S Yu. 2019. Heterogeneous graph attention network. In The world wide web conference, pages 2022–2032.
- Yao et al. (2024) Yang Yao, Xin Wang, Zeyang Zhang, Yijian Qin, Ziwei Zhang, Xu Chu, Yuekui Yang, Wenwu Zhu, and Hong Mei. 2024. Exploring the potential of large language models in graph generation. arXiv preprint arXiv:2403.14358.
- Yu et al. (2023) Jifan Yu, Xiaozhi Wang, Shangqing Tu, Shulin Cao, Daniel Zhang-Li, Xin Lv, Hao Peng, Zijun Yao, Xiaohan Zhang, Hanming Li, et al. 2023. Kola: Carefully benchmarking world knowledge of large language models. arXiv preprint arXiv:2306.09296.
- Zhao et al. (2023) Wayne Xin Zhao, Kun Zhou, Junyi Li, Tianyi Tang, Xiaolei Wang, Yupeng Hou, Yingqian Min, Beichen Zhang, Junjie Zhang, Zican Dong, et al. 2023. A survey of large language models. arXiv preprint arXiv:2303.18223.
Appendix A Details on the Data Generation
Our dataset mainly includes two types of graph data, heterogeneous graph data and pure graph data. In addition, based on these two types of data, we set up 19 tasks to evaluate the large model, which includes a total of 11 datasets. This diversity ensures the comprehensiveness and stability of our data.
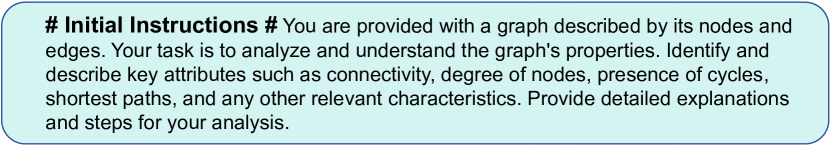
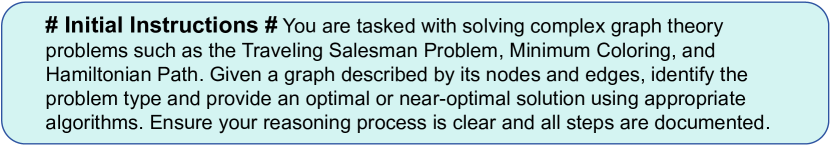
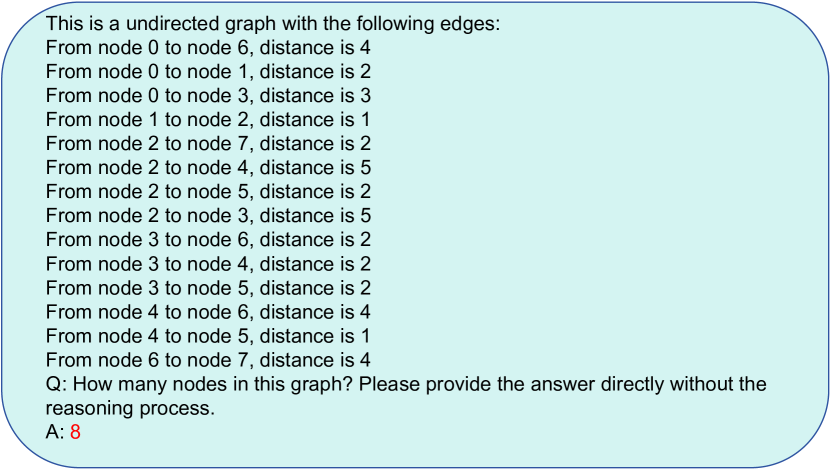
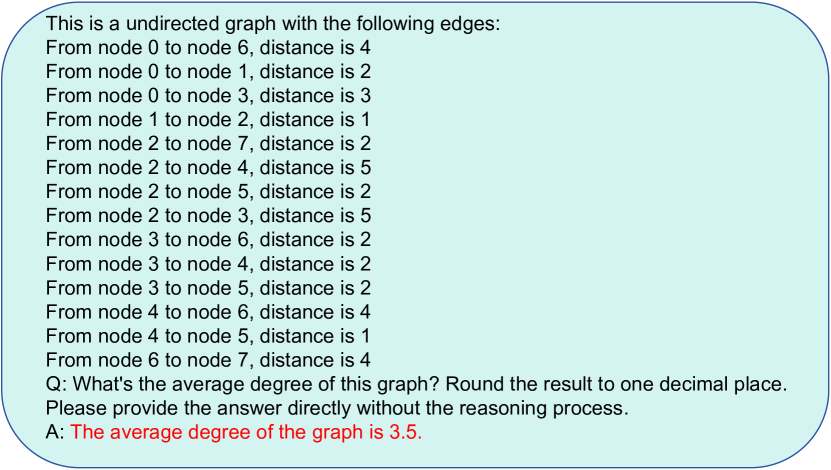
Figures 6 to 26 illustrate examples of prompts and graph data descriptions for each task. To ensure that the generated results align with our capabilities and task requirements, we concatenate the prompts for each task with the initial prompts