Development of Machine Learning Classifiers for Blood-based Diagnosis and Prognosis of Suspected Acute Infections and Sepsis
Abstract
We applied machine learning to the unmet medical need of rapid and accurate diagnosis and prognosis of acute infections and sepsis in emergency departments. Our solution consists of a Myrna™ Instrument and embedded TriVerity™ classifiers. The instrument measures abundances of 29 messenger RNAs in patient’s blood, subsequently used as features for machine learning. The classifiers convert the input features to an intuitive test report comprising the separate likelihoods of (1) a bacterial infection (2) a viral infection, and (3) severity (need for Intensive Care Unit-level care). In internal validation, the system achieved AUROC = 0.83 on the three-class disease diagnosis (bacterial, viral, or non-infected) and AUROC = 0.77 on binary prognosis of disease severity. The Myrna, TriVerity system was granted breakthrough device designation by the United States Food and Drug Administration (FDA). This engineering manuscript teaches the standard and novel machine learning methods used to translate an academic research concept to a clinical product aimed at improving patient care, and discusses lessons learned.
1 Introduction
New advances on research in applications of machine learning (ML) and artificial intelligence in medicine are published on a regular basis. However, there is lack of literature on translation of these innovations to clinical practice, in particular for tests based on molecular data. To fill the gap, we report on the development of classifiers for detecting type and severity of infections in patients who present in emergency departments (ED) with symptoms of acute infection and sepsis, an unmet medical need [1].
Current modalities for diagnosing infections mostly rely on detection and identification of pathogens. However, this is inadequate because in the majority of cases, pathogens are not found in blood or anywhere else in the body [2]. A more recent approach relies on response of the immune system to the infection (host response). This could provide diagnostic and prognostic information regardless of whether a pathogen is eventually identified.
From the ML perspective, diagnosing infections in the ED can be reduced to two classification problems: infection type classification (diagnosis) and illness severity classification (prognosis). The classifiers use gene expression (abundance of mRNAs) of cells from whole blood as input features. The diagnostic classifier estimates the probability of the patient having bacterial, viral or no infection (BVN), whereas the prognostic binary classifier estimates probability of severe outcome in the given time window (SEV).
We used clinical adjudication [3] as the ground truth for the BVN classifier, and 30-day survival as the ground truth for the SEV classifier. We used 29 mRNAs as input numerical features, measured using a variety of measurement platforms during training and validation, comprising both commercially-available (microarrays, RNA-Seq and molecular barcoding technology (NanoString), which are established technologies for measuring gene expression) and our in-development platform Myrna™, which uses a rapid method called Loop-Mediated Isothermal Amplification (LAMP). The LAMP experiments were performed using two approaches: 1. “benchtop LAMP”, which is not fully-automated and uses a commercially available instrument. It was utilized before TriVerity™ became available, and 2. “automated LAMP” using TriVerity.
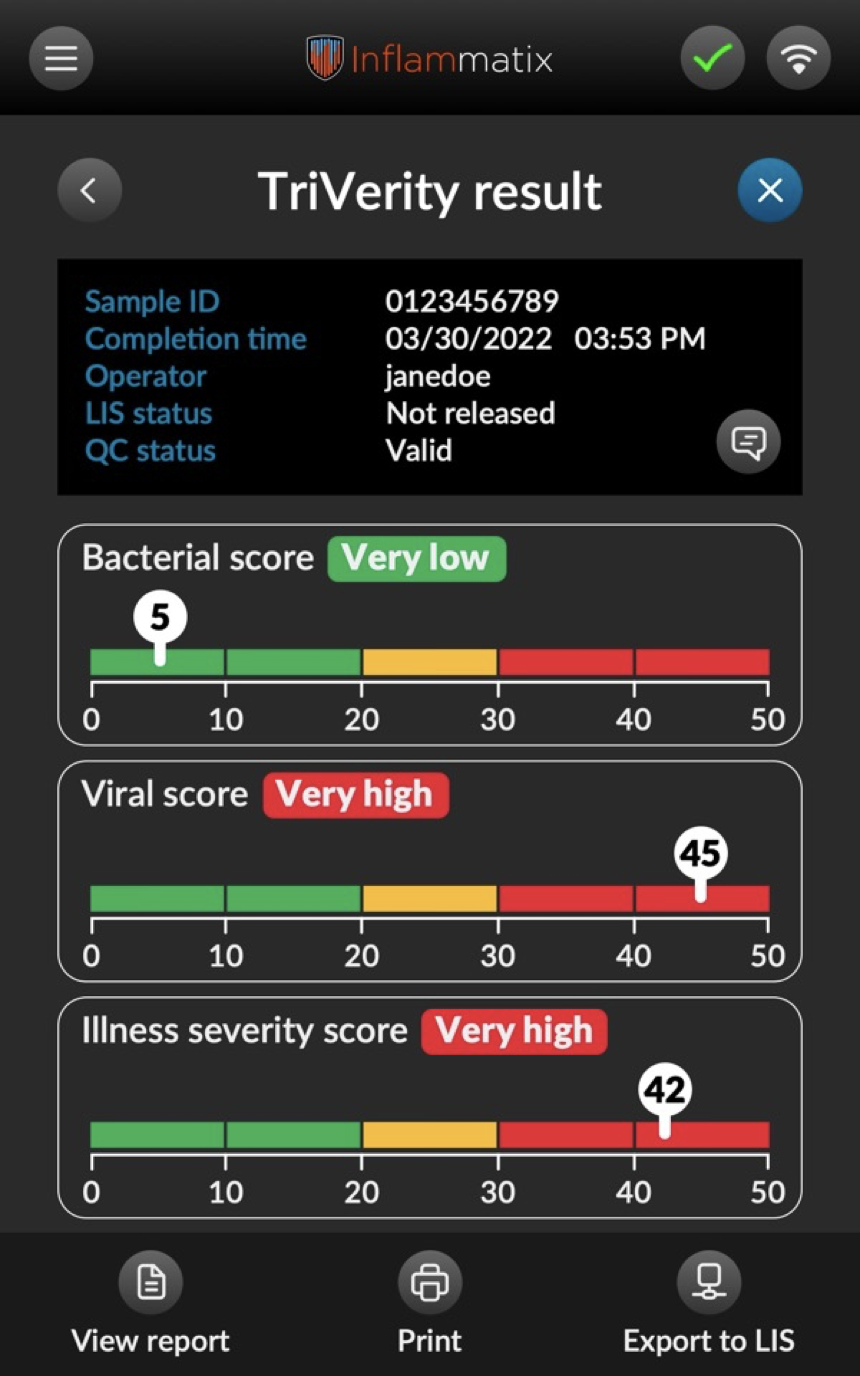
The final test produces three scores (Bacterial, Viral, Severity) based on underlying classifier probabilities. The probabilities are divided into five bands, corresponding to very low, low, moderate, high, and very high probabilities of the corresponding class. The probabilities and bands are further transformed to scores on 0-50 scale and presented to the user (Fig 1). The test report was developed using in-house expertise, feedback from ED and clinical laboratory physicians, FDA predicate device clearances, and additional market research.
The system software overview is described in Section 8.1.
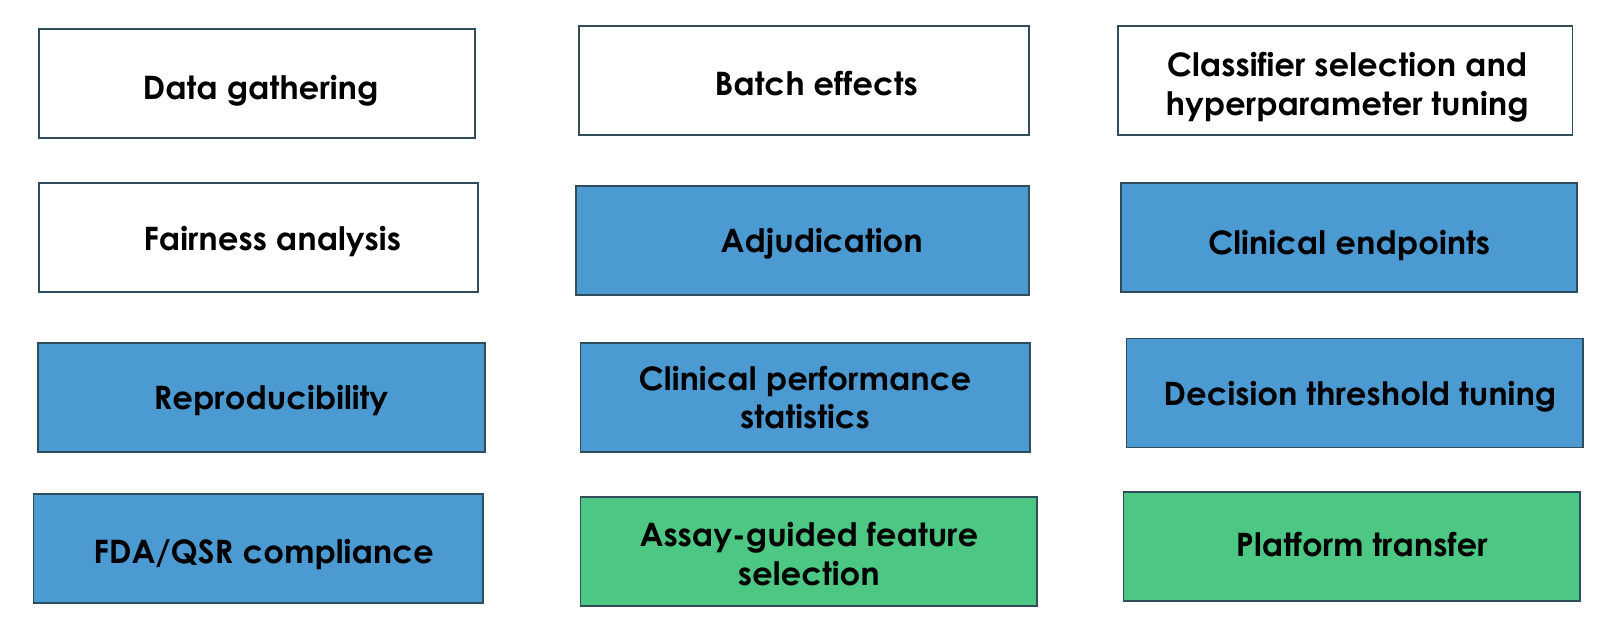
In this paper, we describe how the classifiers were developed and their performance characteristics. Inspired by [4], we show the key elements of the classifier development in Fig. 2. As in [4], we note that the classifier selection and tuning represent a modest fraction of the overall effort from academic prototype to product launch. The manuscript sections correspond to the elements shown, except where noted. Given the extensive validation of the 29-mRNA signature in academic prototypes [5, 6, 7], here we specifically emphasize activities specific to commercially usable point-of-care classifier development.
2 Development data and classifier development
First we describe the development data, with emphasis on properties that have significant impact on the ML methods: batch effects and platform transfer.
2.1 Data gathering and adjudication
The sources of development data were public (generated using microarrays, from GEO [8] and ArrayExpress [9]) and proprietary (generated using NanoString and qPCR) [10]. The approach to selecting the development data was guided by prior research on diagnosing infections using a molecular approach [6].
The development data was split into training and validation sets. The training set was used for hyperparameter tuning with cross-validation (CV), while the validation data was used for comparison of the tuned classifiers, and never for classifier training nor hyperparameter tuning (except exactly once to train the final locked classifiers). This approach reduces bias compared with CV [10].
The class labels (clinical truth) for the development data were derived from the public records for public data and from a clinical adjudication process for proprietary data. As such, the public data were inherently more noisy than the proprietary data, but also better representative of the heterogeneity in the real-world patient population. The proprietary data were from company-sponsored clinical studies, all with physician-adjudicated label assignment. The proprietary studies were approved by institutional review boards.
The detailed information about the development datasets is given in Section 8.2.
2.2 Batch effects
The blood samples used to generate data for the development were processed in different hospitals across independent studies and generated using different technical platforms, on biologically and clinically heterogenous patient populations (ED, intensive care units, different races and ethnicities, different disease severity). We used normalization to adjust different levels of gene expression, but the normalization does not correct for technology- and study-induced batch effects. To reduce their impact, we used validation and CV based on grouped approach.
To reduce the platform-induced batch effects while maintaining biological and clinical heterogeneity, we grouped the training and validation data by gene expression platform. The training data were almost exclusively () microarray data, whereas the validation data were assayed on NanoString (during development) or the target platform (for production classifiers). The goal was to ensure the robustness of the trained classifiers across a variety of platforms. The advantage of this robustness was that it allowed use of large amounts of publicly available datasets as they become available to further improve accuracy of our classifiers, while maintaining our ability to translate them to a point-of-care platform. The gap between the training and validation performance served as an indicator of the classifier’s robustness with respect to the gene expression platform.
To reduce the study-induced batch effects, we used grouped CV [11]. The grouped CV was used in the hyperparameter tuning to evaluate performance of candidate hyperparameter configurations (HC). In grouped CV, the folds were configured such that different folds contained disjoint sets of studies (in other words, all blood samples from a given study were assigned to the same grouped CV fold). Analogous to the approach used for platform-induced batch effects, HCs which exhibited poor performance on the left-out folds (usually including study batch effects) were automatically eliminated by the hyperparameter tuning algorithms.
2.3 Hyperparameter tuning, classifier selection and platform transfer
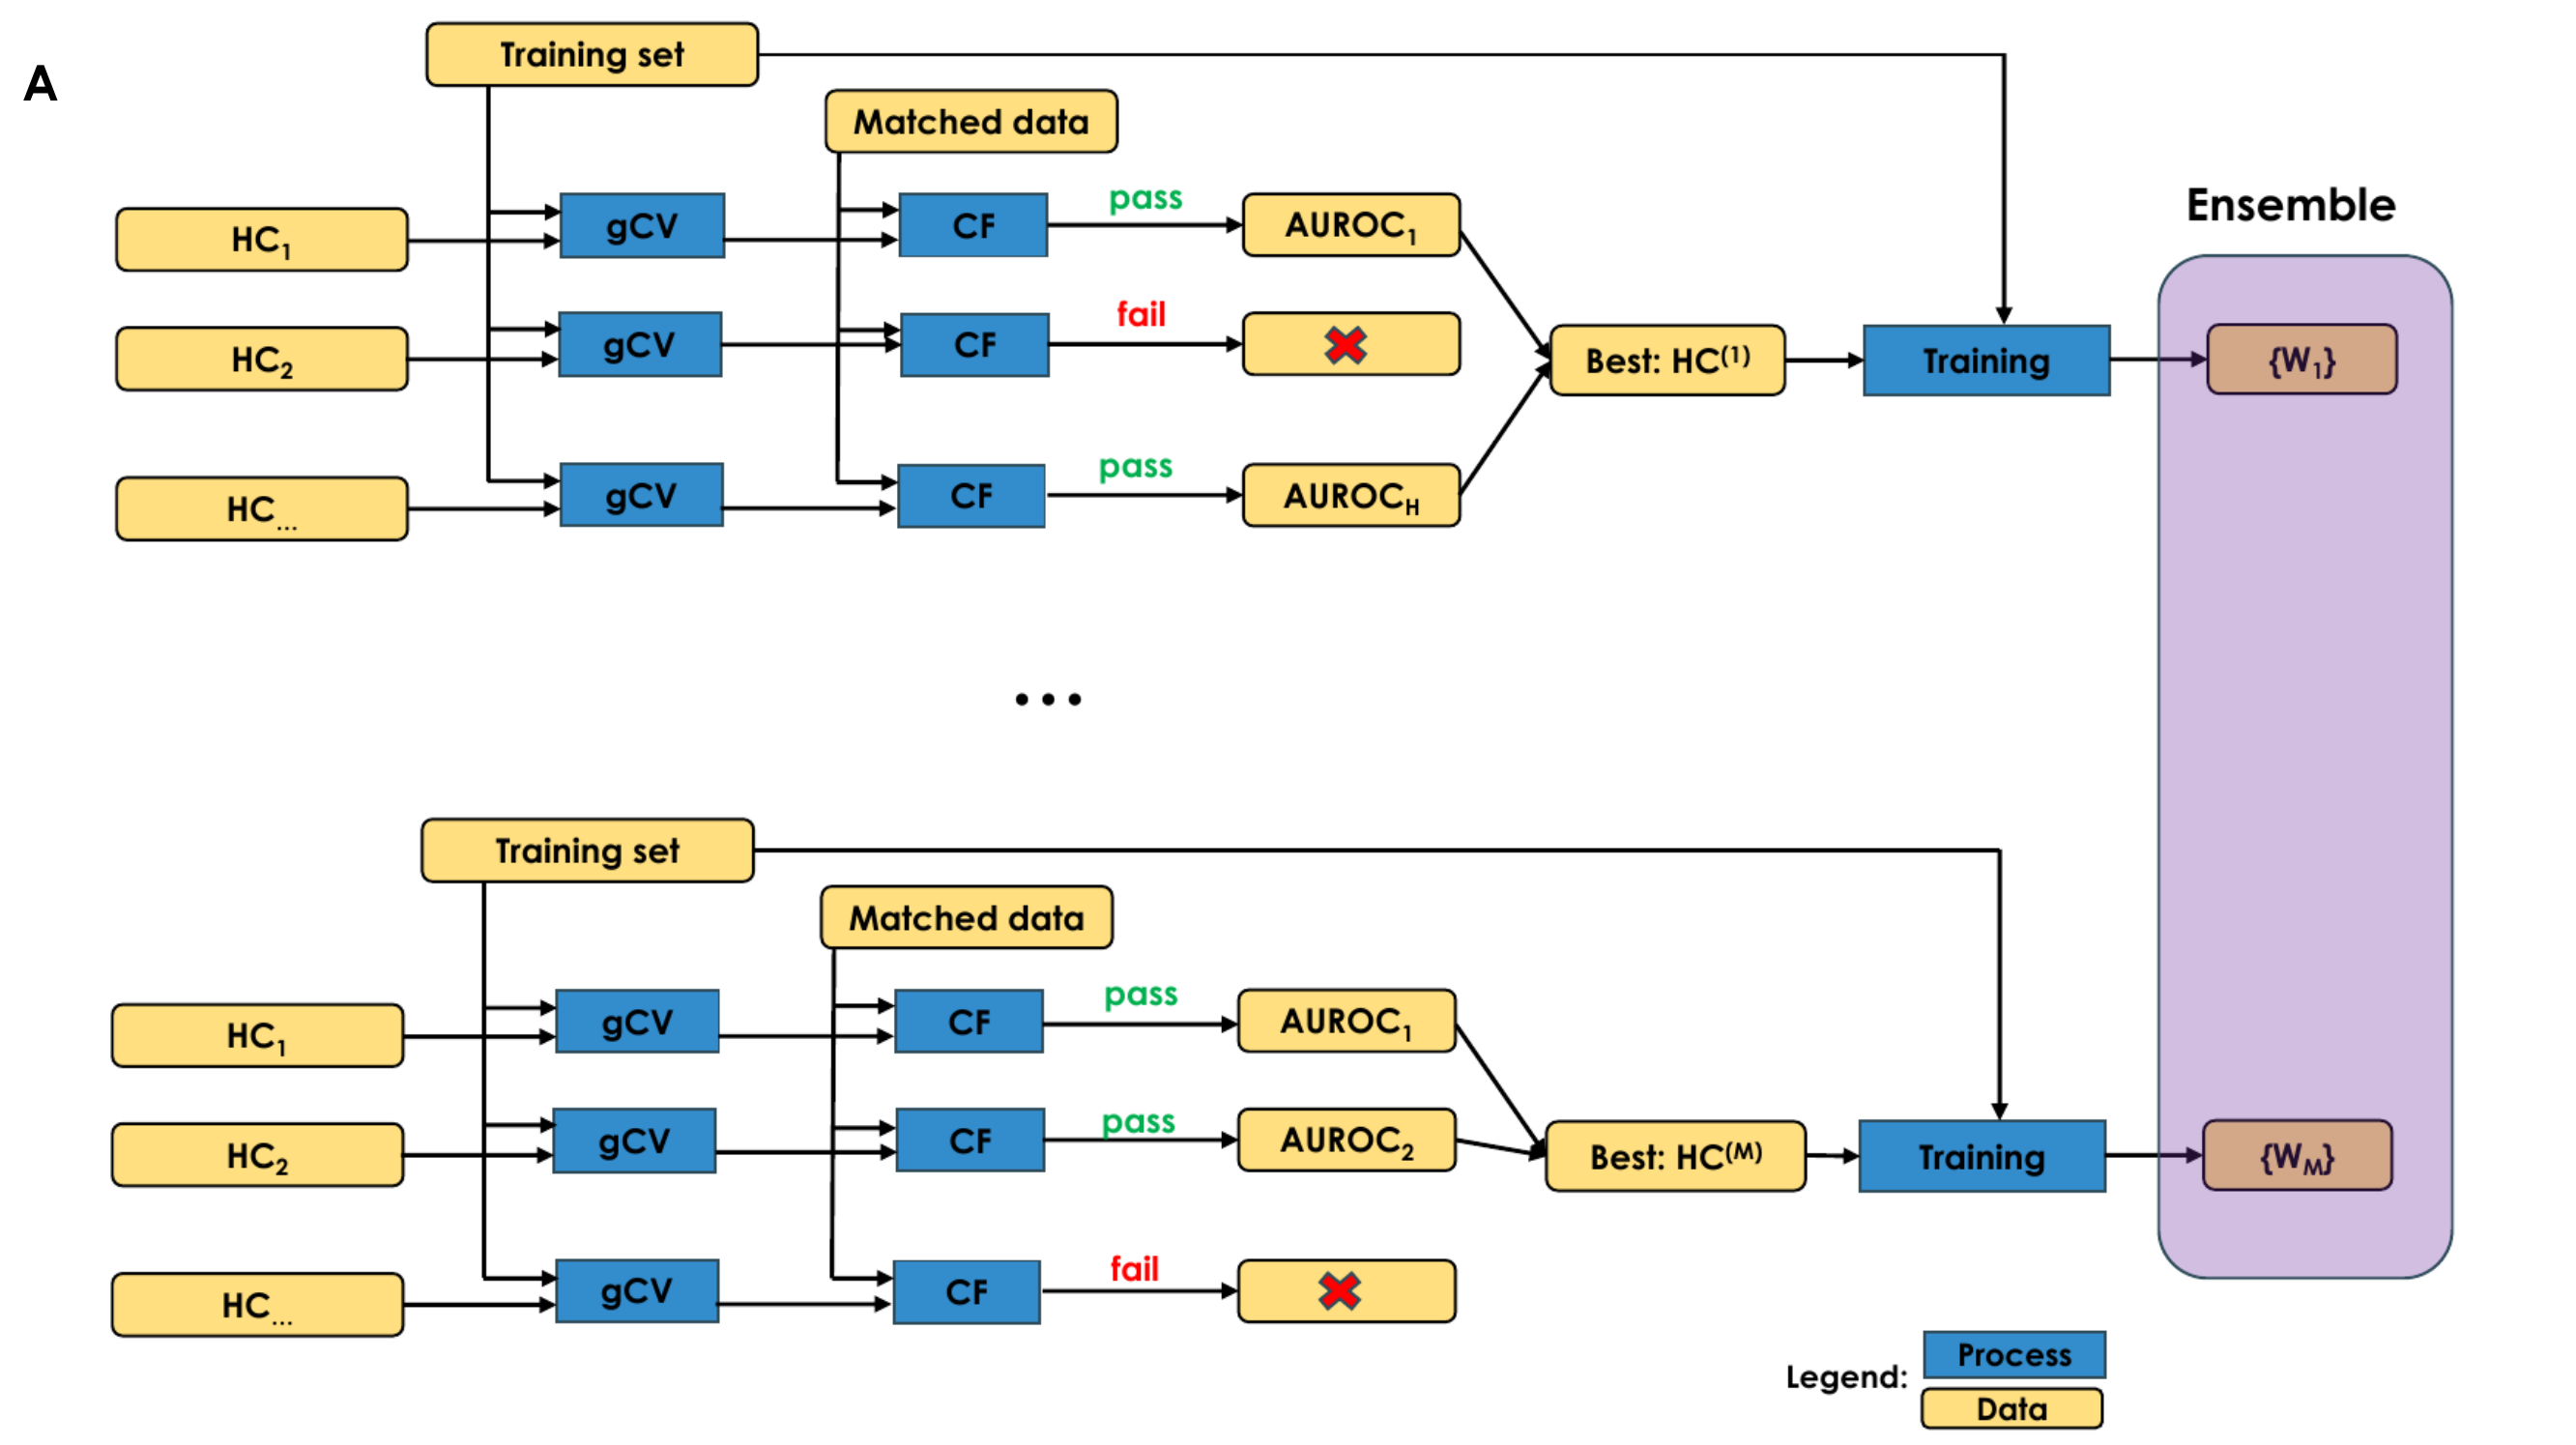
An overview of hyperparameter tuning is shown in Fig. 3.
A key requirement of our classifiers was platform transfer, defined as generalization from the mostly public expression data, which comprised the training set, to the target instrument. During most of the classifier development, the target instrument was not available because the device itself was being developed: the product development took about six years from conception to the design freeze (a timepoint at which device is considered finalized), whereas the instrument data first became available about six months prior to the design freeze. As a result, input features for the classifier training were measured using different, commercially available instruments (NanoString was used as a proxy for Myrna™ during the development). The platform transfer problem can be defined as ensuring that the classifiers developed on the available platforms would perform similarly on the target platform, once it becomes available. To enable the platform transfer, we developed a Concordance Filtering (CF) approach.
The platform transfer based on CF supports an efficient use of the heterogenous data. It is an enabling step for applying the classifiers developed on one or more platforms to a different or newly developed platform. The number of samples available on our target platform was relatively limited and deemed insufficient alone for training the classifiers that would generalize to a global population. The goals of the platform transfer were A) use all available data, on all platforms, for classifier training, and B) maximize performance and generalizability of the classifier on the target platform.
To develop an approach which satisfies the goals, we relied on the following ideas:
-
•
In early versions of the classifiers, optimize for adequate performance on the NanoString data as the highest-quality feature values available
-
•
Later, jointly optimize for high level of concordance (i.e., similar gene expression values measured across replicate samples) between NanoString and Myrna
-
•
Thus, tuning the classifiers to achieve good concordance between platforms can be performed using relatively small unlabeled sets of samples assayed on both platforms
The CF algorithm removes, during hyperparameter tuning, the classifiers which did not achieve adequate concordance between the replicate samples. The concordance was measured by the coefficient of determination () and/or Pearson correlation coefficient [PCC] between NanoString- and Myrna™-generated probabilities. In other words, during the tuning, we applied a classifier to the set of replicate NanoString/Myrna samples. If the concordance was below a fixed minimal value, the classifier was removed from the tuning process, regardless of clinical performance. For BVN, where there are three classes, the CF filtering step was based on the minimum PCC or for bacterial or viral class, which are of primary interest because they are reported to the user. For SEV, the CF filtering was based on the probability of the severe class.
Using this approach, we developed the instrument and classifiers in parallel, thereby significantly reducing the product development timelines and cost, and substantially boosting the number of samples available for training. The final tuning of the classifiers using Myrna data was done in the very last stages of the project and required a modest number of samples. Specifically, for the last versions of the classifiers we assayed a set of matching (replicate) blood samples on NanoString and Myrna™ for use in the CF.
2.4 Reproducibility
Reproducibility refers to an important safety property of diagnostic tests to generate clinically similar results using repeated measurements from the same patient (for example, multiple tubes from a single blood draw). It is conceptually similar to platform transfer except that the replicates come from repeated measurements on the same platform. Accordingly, we adopted the following approach: during CF, add Myrna replicates to the set of NanoString/Myrna replicates. That way, we ensured that the highly-ranked classifiers achieved high level of reproducibility within and across platforms.
2.5 Hyperparameter tuning: ensembling and loss
Our approach used ensembling. We evaluated several variants of ensembling to empirically find the best performing method. The hyperparameter tuning was repeated times independently, with different random seeds and otherwise identical configurations. The class probabilities were the averages of the output probabilities generated by the ensemble members.
The loss function used for ranking the HCs was Area Under Receiver Operating Characteristic (AUROC) for severity, and the multi-class generalization of AUROC [12] (mAUROC) for BVN classifier. Ideally, the candidate classifiers should be ranked using the performance statistics of the final product, such as sensitivity and specificity. However, the clinical statistics (Section 3) involve setting of decision thresholds, which is not amenable to full automation.
During CV, the mAUROC can be computed using averaging or pooling. In averaging, mAUROC is estimated for each fold, and the final mAUROC is the average across folds. In pooling, predicted probabilities for each fold are recorded, and the final mAUROC is computed by pooling the fold probabilities and estimating mAUROC using the pooled data. While averaging may be preferred [13, 14], in our case it was not an option because the majority of studies did not have patients in all three classes.
Based on expert judgment, we considered an increase in classification performance of 0.01 AUROC units to be clinically significant.
We used Optuna [15] to select candidate hyperparameter configurations (HC) from a search space of 1000. We chose a fixed value of five folds for all CV experiments.
2.6 Assay-guided feature selection
2.7 Classifier lock
The classifier lock is the setting of classifiers’ parameters (weights) to final optimized values for deployment in clinical care. A key practical decision was to choose between the following options:
-
1.
Pool the training and validation data and train the final classifier using the pooled dataset with hyperparameters found by hyperparameter tuning. In this case, training data is maximized, and includes the target platform data, but there is no data left to validate the locked classifiers.
-
2.
Lock the models trained on training data. The classifiers are validated using the validation set. However, the training data is reduced, and does not use the target platform.
We opted for pooling, based on the strong preference to incorporate the target platform in the training of the locked classifiers.
2.8 Fairness analysis
The performance of the development versions of the classifiers across race, age and sex subgroups was reported in [16]. The performance of the production classifiers will be published in a future manuscript, following the completion of the pivotal trials.
2.9 QSR/FDA compliance
The Myrna™ system and TriVerity™ Test, including the classifiers, are subject to the Quality Systems Regulation by the United States FDA. The regulation is codified in Title 21 of the Code of Federal Regulations (CFR) Part 820 [17] and is meant to ensure quality and safety of medical devices intended for human use. It is a complex topic outside of scope of this manuscript. Machine learning activities impacted by the Part 820 include documentation, personnel training, corrective and preventive actions, hazard analysis, statistical techniques and classifier updates.
3 Clinical performance statistics
The key test performance characteristics comprise likelihood ratios for individual test bands, band sensitivities and specificities, coverage and monotonicity.
For tests with two possible test results, positive and negative (binary tests), the positive diagnostic likelihood ratio (LR) is defined as the ratio of the probability of a positive test result in patients with the disease to the probability of a positive test result in patients without the disease. The negative diagnostic ratio is defined as the ratio of the probability of a negative test result in patients with the disease to the probability of a negative test result in patients without the disease [18]. The two LRs are the properties of a classifier and a decision threshold, and fully characterize the test performance. However, TriVerity has five possible test results (assigned bands, Fig 1). This impacts the definitions and interpretations of the standard performance statistics. The definition of the LRs in such cases is non-obvious because it is not apparent what constitutes positive and negative test results for the bands. For computing the LRs for band , we considered all samples assigned by the classifiers to band as predicted positive, and samples assigned outside the band as predicted negative. This permits an intuitive behavior of monotonically increasing likelihood ratios from band 1 to band 5 (an established desirable property of multi-band tests [19]). Given the above convention, the positive LRs become:
| (1) |
where are the number of samples with ground truth POS and NEG in band , respectively.
4 Decision threshold tuning
Decision thresholds help clinicians make diagnosis and treatment decisions. Each TriVerity output probability is split in five bands using four thresholds (Fig 1).
The decision threshold tuning required the specification of the threshold-tuning-set (TTS) and a decision tuning algorithm. The assumption is that the samples in TTS have been analyzed using a classifier, producing predictive probabilities. Subsequently, we tune decision thresholds using the TTS predicted probabilities and the combination of decision tuning algorithm and manual finetuning.
In problems with two classes and a binary test report, the threshold tuning is typically achieved by finding a clinically best trade-off between sensitivity and specificity, for example by expert judgment. However, TriVerity™ requires setting of 8 thresholds for BVN and 4 for SEV (Fig 1). To facilitate the threshold selection during model tuning, we introduced an algorithm called GAT (Genetic Algorithm for Thresholds, [20]). GAT is based on genetic (evolutionary) optimization as implemented in the DEAP python library [21]. Each individual (chromosome) in GAT is a set of the decision threshold values. GAT operates by maximizing a fitness function through evolutionary computation until the chromosome with the best fitness is found. GAT is applied to each test output (bacterial, viral, severity) independently. It is defined as follows:
Input: desired (target) values for LR1, LR5, coverage, and percent moderate
Output: best thresholds (4 values)
-
1.
The initial population for the evolutionary (genetic) algorithm is randomly generated. A set of chromosomes, each representing a potential solution to the problem, is created. The chromosome corresponding to a solution has four values, representing the four thresholds needed to split the probabilities into five bands.
-
2.
The fitness of each chromosome in the population is evaluated using a fitness function. The function assigns a fitness score to each chromosome based on how well it fits the desired criteria for LR1, LR5 and coverage. The coverage is only considered if the value is below the target value, so that coverage exceeding the target is not penalized.
-
3.
A new generation is created by selecting parents according to their fitness. Offspring are created using crossover and mutation operations. The individuals with the top 20% fitness are always kept in the population.
-
4.
Steps 2 and 3 are repeated for a given number of iterations.
The specification of TTS is, to the best of our knowledge, an unsolved problem. The problem is that, following classifier development, a separate dataset may be required to tune the decision thresholds, and that may not always be available. We considered the following options: A) using the same training data for threshold tuning and performance evaluation and B) setting aside a separate set of data exclusively for TTS. The approach A is a resubstitution approach, which may introduce optimistic bias. The approach B may not use the valuable data efficiently. We decided between the two approaches as follows:
-
•
Tune the thresholds using resubstitution and GAT algorithm. This produces thresholds
-
•
Estimate clinical performance using TTS probabilities and thresholds . is a set of relevant statistics such as LRs and coverage
-
•
Tune the thresholds using a reduced-bias approach (the reduction refers to bias in comparison with the resubstitution approach). This means using different set of data for threshold tuning vs. classifier performance assessment
-
•
Record the resulting clinical performance
-
•
If the difference between and is clinically insignificant, use the data-efficient resubstitution approach for decision thresholds tuning.
The algorithm requires reduced-bias threshold selection. To that end, we introduced the following algorithm for decision threshold CV:
-
•
Split TTS (i.e., probabilities) into folds. Each fold consists of learning set (LSET) and cross-validation set (CVSET)
-
•
For each (LSET, CVSET) pair:
-
–
Tune decision thresholds using GAT algorithm and LSET dataset
-
–
Assign the CVSET probabilities to different bands using the tuned thresholds
-
–
-
•
Compute the TTS clinical performance using the pooled band assignments
The threshold CV computes reduced-bias estimate of the clinical performance when thresholds are tuned using independent data. This estimate is then used to decide whether the data-efficient resubstitution method has acceptable bias. If the conclusion is positive, we can use the same dataset for threshold tuning and estimation of performance; otherwise, a separate TTS is needed.
The selection of thresholds during classifier development used GAT due to good performance, automation and high throughput; however, for the final classifier lock, the thresholds were manually finetuned, to achieve the best trade-off between different clinical performance statistics.
5 Results
The quality of input data and normalization approaches were critical to the development. The BVN mAUROC improved from under 0.7 in the early days of the development, which was not viable for launching the product, to 0.83, which provides favorable overall clinical performance. We hypothesize that the progress was achieved by increasing the quality and quantity of the public and proprietary data, and improving development methodology. The data increase qualitatively changed the type of top-ranked classifiers, which oscillated between multi-layer perceptron (MLP) and LOGR, until the introduction of platform transfer. At design freeze, the BVN development data comprised 4306 training and 679 validation samples, derived from 47 and 7 studies, respectively. The SEV development data comprised 2758 training and 723 validation samples, derived from 38 and 8 studies, respectively.
We periodically evaluated seven leading classification algorithms at different time points during the development. A late-stage snapshot is shown in Table 1. The winning classifier was LOGR for both BVN and SEV problems.
| Algorithm | CV mAUROC [95% CI] | Val. mAUROC [95% CI] | Concordance [95% CI] |
|---|---|---|---|
| MLP | 0.88 [0.88, 0.89] | 0.84 [0.81, 0.86] | 0.94 [0.93, 0.94] |
| LOGR | 0.89 [0.88, 0.89] | 0.84 [0.81, 0.86] | 0.93 [0.92, 0.94] |
| RBF | 0.87 [0.86, 0.88] | 0.83 [0.80, 0.86] | 0.95 [0.94, 0.96] |
| SVM | 0.87 [0.86, 0.87] | 0.83 [0.80, 0.86] | 0.92 [0.91, 0.93] |
| LGBM | 0.87 [0.86, 0.88] | 0.83 [0.80, 0.86] | 0.88 [0.86, 0.89] |
| XGB | 0.87 [0.86, 0.88] | 0.82 [0.78, 0.84] | 0.80 [0.78, 0.82] |
| GPC | 0.86 [0.85, 0.87] | 0.81 [0.77, 0.84] | 0.76 [0.73, 0.78] |
The greedy forward search did not yield a subset of genes which improved clinical or analytical performance for at least one of the classifiers (results not shown). Based on this observation, we decided to finalize the product using 29 genes.
The final results of TriVerity™ classifiers are shown in Table 2. Importantly, we found that for patients for which both BVN and SEV ground truths were available, 73% were assigned by the classifiers to at least one of the outer bands (1 or 5). This is clinically important because those diagnoses provide the most confidence in their result. In contrast, only 0.2% of the patients in the common set were assigned to band 3 for all three scores. This is important because the band 3 has LRs that are clinically uniformative.
| Band(s) | Statistic | Training Value [95% CI] | Val. Value [95% CI] |
|---|---|---|---|
| BVN mAUROC | 0.886 [0.877, 0.894] | 0.833 [0.806, 0.861] | |
| 1 | Bacterial LR | 0.09 [0.07, 0.11 ] | 0.08 [0.03, 0.14 ] |
| 5 | Bacterial LR | 7.1 [6.2, 8.2 ] | 7.6 [4.8, 15 ] |
| 1 | Bacterial PPA | 95 [94, 97 ] | 98 [96, 99 ] |
| 5 | Bacterial NPA | 93 [92, 94 ] | 95 [93, 98 ] |
| 1, 5 | Bacterial coverage | 60 [58, 61 ] | 35 [31, 39 ] |
| 3 | Bacterial moderate | 7.1 [6.3, 7.8 ] | 16 [13, 19 ] |
| 1 | Viral LR | 0.07 [0.05, 0.10 ] | 0.13 [0.05, 0.22 ] |
| 5 | Viral LR | 8.1 [7.3, 9.1 ] | 9.6 [7.0, 14 ] |
| 1 | Viral PPA | 97 [96, 98 ] | 95 [92, 98 ] |
| 5 | Viral NPA | 90 [89, 91 ] | 93 [91, 95 ] |
| 1, 5 | Viral coverage | 54 [53, 56 ] | 52 [48, 55 ] |
| 3 | Viral moderate | 13 [12, 14 ] | 15 [12, 18 ] |
| 1, 5 | BV coverage | 72 [71, 74 ] | 58 [54, 62 ] |
| SEV AUROC | 0.886 [0.866, 0.906] | 0.793 [0.738, 0.843] | |
| 1 | SEV LR | 0.04 [0.01, 0.09 ] | 0.16 [0.04, 0.33 ] |
| 5 | SEV LR | 7.3 [5.8, 9.0 ] | 8.9 [5.2, 16 ] |
| 1 | SEV PPA | 98 [95, 100 ] | 94 [89, 99 ] |
| 5 | SEV NPA | 93 [92, 94 ] | 97 [95, 98 ] |
| 5 | SEV coverage | 61 [59, 63 ] | 40 [36, 44 ] |
| 3 | SEV moderate | 6.5 [5.5, 7.4 ] | 15 [12, 17 ] |
We observed 0.886 BVN mAUROC in training and 0.833 in validation. We hypothesize that the principal causes of the gap are the major platform difference (BVN training is almost entirely microarray data, whereas validation is Myrna™ data) and significant differences in patient populations.
We observed 0.886 SEV AUROC in training and 0.793 in validation. Besides platform gap, the severity gap was due to inclusion of pediatric patients in severity training set. The rationale for this design choice is that removal of pediatric patients from training had limited to no impact on the validation results, and it may improve the performance in a future expanded indication for the test.
To estimate the impact of CF, we performed an ablation study in Section 8.4.
6 Discussion
We performed successful transfer of a research prototype of a clinical infectious disease diagnostic test to a design freeze product ready for independent verification and validation, across heterogenous data environment. The results suggest that the BVN and SEV ML classifiers perform adequately for clinical deployment [22]. Approximately three out of four patients are likely to receive at least one clinically highly informative score (bands 1 or 5), and almost none (0.2% in the validation set) are likely to receive an uninformative test report. Based on our assessment of the clinical utility and commercial potential of the validation results, we built and locked the production classifiers and initiated pivotal trials.
We found that concordance filtering significantly improved the quality of platform transfer for some classification algorithms (MLP). For others, like LOGR, it served as assurance that the winning classifier would meet the platform transfer requirements.
The validation performance showed that grouped CV effectively countered the platform and study batch effects. While the effects were not completely eliminated, they were nevertheless sufficiently attenuated to enable clinical application of the system.
The classifier comparison showed relatively small but clinically relevant differences in performance by AUROC. The gradient-boosting classifier (XGBoost and Light GBM), generally considered top choice for classification of tabular data, underperformed in our use case, both by classification performance and concordance among platforms. This is a somewhat surprising finding, potentially caused by strictly numeric type of the input features. We also observed consistent underperformance by Gaussian Process Classifier, which may be useful learning because this classifier is relatively rarely evaluated in ML manuscripts. These findings are under active investigations.
Arguably, our use of pooling the predicted probabilities across CV folds is biased. However, the clinical application and the composition of development data necessitated this approach. We found the resulting performance to be robust in validation set and across gene expression platforms.
Our work and manuscript have limitations. We presented development data; a prospective evaluation of the clinical validity is currently in progress. The clinical utility of TriVerity™ will be determined in prospective and randomized trials, currently in planning stages. The adjudicated ground truth for TriVerity development is imperfect and may affect the performance statistics reported here.
7 Conclusion
We presented the development of clinical classifiers for rapid diagnosis and prognosis of acute infections and sepsis in emergency departments based on blood draw. Internal evaluations suggest that the product is adequate for clinical use and commercial launch, pending clearance by the United States FDA.
References
- [1] W. Bauer, K. Kappert, N. Galtung, D. Lehmann, J. Wacker, H. K. Cheng, O. Liesenfeld, L. Buturovic, R. Luethy, T. E. Sweeney et al., “A novel 29-messenger rna host-response assay from whole blood accurately identifies bacterial and viral infections in patients presenting to the emergency department with suspected infections: a prospective observational study,” Critical care medicine, vol. 49, no. 10, pp. 1664–1673, 2021.
- [2] S. Jain, W. H. Self, R. G. Wunderink, S. Fakhran, R. Balk, A. M. Bramley, C. Reed, C. G. Grijalva, E. J. Anderson, D. M. Courtney et al., “Community-acquired pneumonia requiring hospitalization among us adults,” New England Journal of Medicine, vol. 373, no. 5, pp. 415–427, 2015.
- [3] N. N. Whitfield, C. A. Hogan, J. Chenoweth, J. Hansen, E. B. Hsu, R. Humphries, E. Mann, L. May, E. A. Michelson, R. Rothman et al., “A standardized protocol using clinical adjudication to define true infection status in patients presenting to the emergency department with suspected infections and/or sepsis.” Diagnostic Microbiology and Infectious Disease, p. 116382, 2024.
- [4] D. Sculley, G. Holt, D. Golovin, E. Davydov, T. Phillips, D. Ebner, V. Chaudhary, M. Young, J.-F. Crespo, and D. Dennison, “Hidden technical debt in machine learning systems,” Advances in neural information processing systems, vol. 28, 2015.
- [5] T. E. Sweeney, A. Shidham, H. R. Wong, and P. Khatri, “A comprehensive time-course–based multicohort analysis of sepsis and sterile inflammation reveals a robust diagnostic gene set,” Science translational medicine, vol. 7, no. 287, pp. 287ra71–287ra71, 2015.
- [6] T. E. Sweeney, H. R. Wong, and P. Khatri, “Robust classification of bacterial and viral infections via integrated host gene expression diagnostics,” Science translational medicine, vol. 8, no. 346, pp. 346ra91–346ra91, 2016.
- [7] T. E. Sweeney, T. M. Perumal, R. Henao, M. Nichols, J. A. Howrylak, A. M. Choi, J. F. Bermejo-Martin, R. Almansa, E. Tamayo, E. E. Davenport et al., “A community approach to mortality prediction in sepsis via gene expression analysis,” Nature communications, vol. 9, no. 1, p. 694, 2018.
- [8] T. Barrett, S. E. Wilhite, P. Ledoux, C. Evangelista, I. F. Kim, M. Tomashevsky, K. A. Marshall, K. H. Phillippy, P. M. Sherman, M. Holko, A. Yefanov, H. Lee, N. Zhang, C. L. Robertson, N. Serova, S. Davis, and A. Soboleva, “NCBI GEO: archive for functional genomics data sets—update,” Nucleic Acids Research, vol. 41, no. D1, pp. D991–D995, 11 2012. [Online]. Available: https://doi.org/10.1093/nar/gks1193
- [9] A. Brazma, H. Parkinson, U. Sarkans, M. Shojatalab, J. Vilo, N. Abeygunawardena, E. Holloway, M. Kapushesky, P. Kemmeren, G. G. Lara et al., “ArrayExpress—a public repository for microarray gene expression data at the EBI,” Nucleic acids research, vol. 31, no. 1, pp. 68–71, 2003.
- [10] M. B. Mayhew, L. Buturovic, R. Luethy, U. Midic, A. R. Moore, J. A. Roque, B. D. Shaller, T. Asuni, D. Rawling, M. Remmel et al., “A generalizable 29-mrna neural-network classifier for acute bacterial and viral infections,” Nature communications, vol. 11, no. 1, p. 1177, 2020.
- [11] scikit learn, “sklearn.model_selection.groupkfold,” https://scikit-learn.org/stable/modules/generated/sklearn.model_selection.GroupKFold.html, 2024, accessed: 2024-04-04.
- [12] D. J. Hand and R. J. Till, “A simple generalisation of the area under the roc curve for multiple class classification problems,” Machine learning, vol. 45, pp. 171–186, 2001.
- [13] B. J. Parker, S. Günter, and J. Bedo, “Stratification bias in low signal microarray studies,” BMC bioinformatics, vol. 8, pp. 1–16, 2007.
- [14] A. Airola, T. Pahikkala, W. Waegeman, B. De Baets, and T. Salakoski, “A comparison of auc estimators in small-sample studies,” in Machine learning in systems biology. PMLR, 2009, pp. 3–13.
- [15] T. Akiba, S. Sano, T. Yanase, T. Ohta, and M. Koyama, “Optuna: A next-generation hyperparameter optimization framework,” in Proceedings of the 25th ACM SIGKDD international conference on knowledge discovery & data mining, 2019, pp. 2623–2631.
- [16] M. B. Mayhew, U. Midic, K. Choi, P. Khatri, L. Buturovic, and T. E. Sweeney, “Towards equitable patient subgroup performance by gene-expression-based diagnostic classifiers of acute infection,” medRxiv, pp. 2022–04, 2022.
- [17] United States Food and Drug Administration, “Cfr - code of federal regulations title 21,” https://www.accessdata.fda.gov/scripts/cdrh/cfdocs/cfCFR/CFRSearch.cfm?CFRPart=820, 2023, accessed: 2024-05-15.
- [18] S. R. Hayden and M. D. Brown, “Likelihood ratio: a powerful tool for incorporating the results of a diagnostic test into clinical decision making,” Annals of emergency medicine, vol. 33, no. 5, pp. 575–580, 1999.
- [19] United States Food and Drug Administration, “SeptiCyte RAPID 510(k) Decision Summary,” https://www.accessdata.fda.gov/cdrh_docs/reviews/K203748.pdf, 2021, accessed: 2024-05-12.
- [20] R. Luethy and L. Buturovic, “Decision Threshold Optimization for Diagnostic Tests using a Genetic Algorithm,” https://inflammatix.com/decision-threshold-optimization-blog, 2023, accessed: 2024-05-01.
- [21] F.-A. Fortin, F.-M. De Rainville, M.-A. G. Gardner, M. Parizeau, and C. Gagné, “Deap: Evolutionary algorithms made easy,” The Journal of Machine Learning Research, vol. 13, no. 1, pp. 2171–2175, 2012.
- [22] J. Ducharme, W. H. Self, T. M. Osborn, N. A. Ledeboer, J. Romanowsky, T. E. Sweeney, O. Liesenfeld, and R. E. Rothman, “A multi-mrna host-response molecular blood test for the diagnosis and prognosis of acute infections and sepsis: proceedings from a clinical advisory panel,” Journal of personalized medicine, vol. 10, no. 4, p. 266, 2020.
- [23] Y. D. He, E. M. Wohlford, F. Uhle, L. Buturovic, O. Liesenfeld, and T. E. Sweeney, “The optimization and biological significance of a 29-host-immune-mrna panel for the diagnosis of acute infections and sepsis,” Journal of Personalized Medicine, vol. 11, no. 8, p. 735, 2021.
8 Technical Appendices
8.1 Software architecture
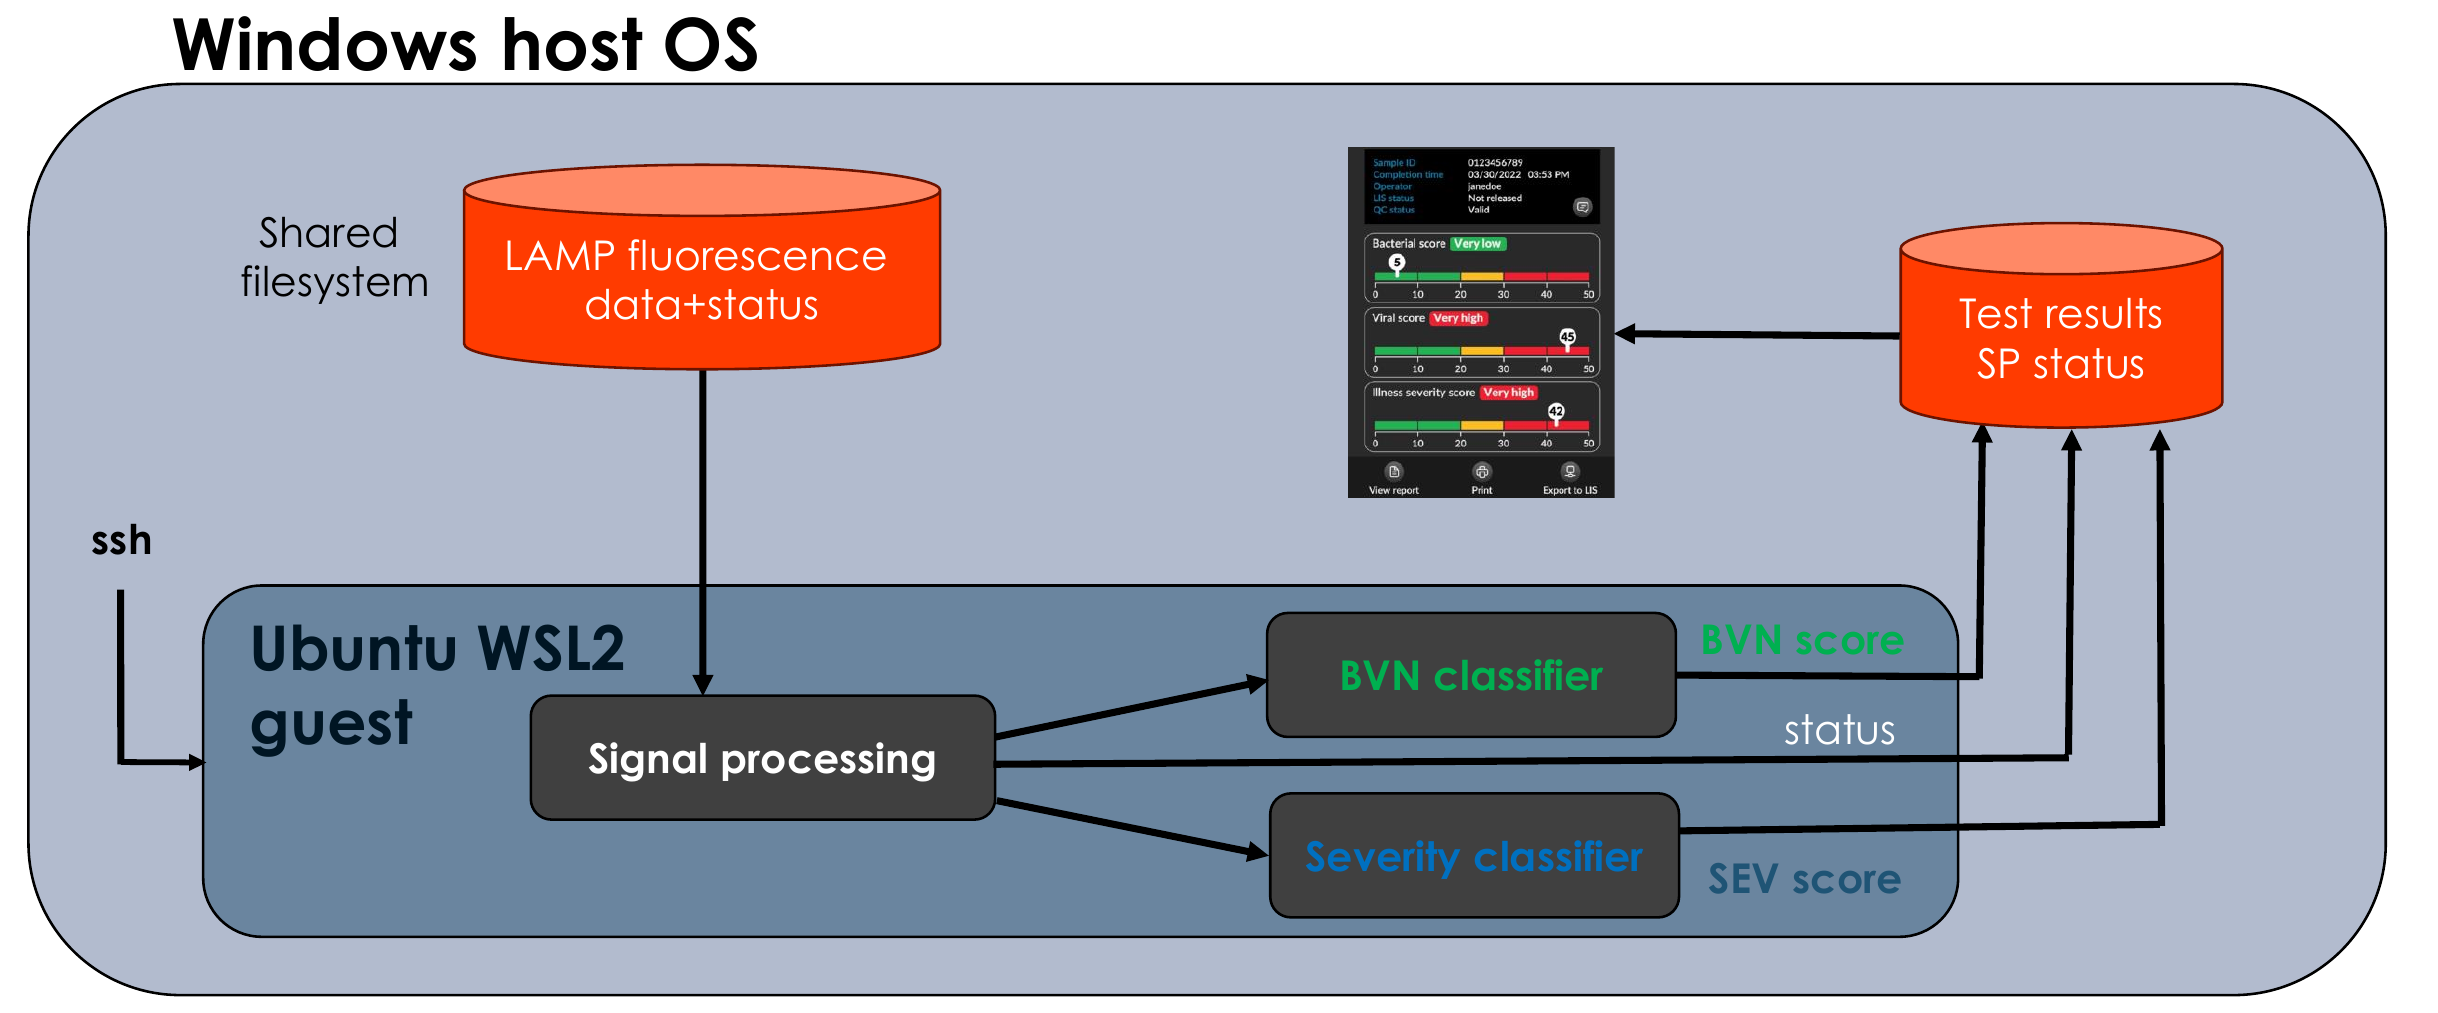
The Myrna™ device runs Windows OS. The software architecture, including classifiers, is shown in Fig. 4.
8.2 Datasets for training and validation
Development data are summarized in Tables 3 and 4. Healthy controls are not listed in the tables because the detailed demographic information was not available.
| Study | Author | Description | N | Age∗ | Male∗ | Platform | Country | Bacterial | Viral | Non-infected |
| EMEXP3589 | Almansa | Patients hospitalized with COPD exacerbation | 27 | Unk. | 16 (59) | Agilent | Spain | 4 (15) | 5 (19) | 18 (67) |
| EMTAB1548 | Almansa | Surgical patients with sepsis (EXPRESS) | 155 | 72.0 (IQR 61.0-78.0) | 95 (61) | Agilent | Spain | 82 (53) | 0 (0) | 73 (47) |
| EMTAB3162 | van den Ham | Patients with dengue | 21 | 20.0 (IQR 17.0-28.0) | 11 (52) | Affymetrix | Indonesia | 0 (0) | 21 (100) | 0 (0) |
| EMTAB5273 | Burnham | Sepsis due to faecal peritonitis or pneumonia | 129 | 66.0 (IQR 51.0-76.0) | 59 (46) | Illumina | United Kingdom | 119 (92) | 0 (0) | 10 (8) |
| EMTAB5274 | Burnham | Sepsis due to faecal peritonitis or pneumonia | 108 | 71.0 (IQR 62.75-77.0) | 69 (64) | Illumina | United Kingdom | 108 (100) | 0 (0) | 0 (0) |
| EMTAB5638 | Almansa | Ventilator-associated pneumonia in ICU | 17 | Unk. | 0 (0) | Agilent | Spain | 0 (0) | 0 (0) | 17 (100) |
| GSE42026 | Herberg | Severe H1N1/09 influenza or bacterial infection | 92 | 1.25 (IQR 0.38-4.0) | 33 (36) | Illumina | United Kingdom | 18 (20) | 41 (45) | 33 (36) |
| GSE42834 | Bloom | Bacterial pneumonia or sarcoidosis | 200 | Unk. | 32 (16) | Illumina | United Kingdom | 14 (7) | 0 (0) | 186 (93) |
| GSE47655 | Stone | Severe anaphylaxis in ED | 12 | Unk. | 0 (0) | Affymetrix | Australia | 0 (0) | 0 (0) | 12 (100) |
| GSE51808 | Kwissa | Patients with dengue | 37 | Unk. | 0 (0) | Affymetrix | Thailand | 0 (0) | 28 (76) | 9 (24) |
| GSE57065 | Cazalis | Septic shock | 53 | 62.0 (IQR 54.25-76.0) | 19 (36) | Affymetrix | France | 28 (53) | 0 (0) | 25 (47) |
| GSE57183 | Shenoi | Febrile children with SJIA | 14 | 3.6 (IQR 3.3-7.3) | 5 (36) | Illumina | United States of America | 0 (0) | 0 (0) | 14 (100) |
| GSE25504 | Smith | Neonatal sepsis | 39 | 0.0 (IQR 0.0-0.0) | 19 (49) | Affymetrix | United Kingdom | 29 (74) | 4 (10) | 6 (15) |
| GSE60244 | Suarez | Lower respiratory tract infections | 133 | 63.0 (IQR 50.0-77.0) | 37 (28) | Illumina | United States of America | 22 (17) | 71 (53) | 40 (30) |
| GSE61821 | Hoang | Influenza patients of varying severity | 48 | 40.0 (IQR 19.75-51.0) | 24 (50) | Illumina | Vietnam | 0 (0) | 48 (100) | 0 (0) |
| GSE63881 | Hoang | Pediatric patients with Kawasaki disease | 171 | 2.75 (IQR 1.42-4.25) | 102 (60) | Illumina | United States of America | 0 (0) | 0 (0) | 171 (100) |
| GSE64456 | Mahajan | Febrile infants with bacterial or viral infection in ED | 219 | 0.1 (IQR 0.06-0.13) | 106 (48) | Illumina | United States of America | 89 (41) | 111 (51) | 19 (9) |
| GSE65682 | Scicluna | Suspected but negative for CAP | 75 | 59.0 (IQR 48.0-67.0) | 22 (28) | Affymetrix | Netherlands | 0 (0) | 0 (0) | 75 (100) |
| GSE66099 | Sweeney | Pediatric ICU patients with sepsis, SIRS | 197 | 2.45 (IQR 1.0-5.88) | 94 (48) | Affymetrix | United States of America | 109 (55) | 11 (6) | 77 (39) |
| GSE67059 | Heinonen | Children with rhinovirus | 101 | 0.83 (IQR 0.3-1.29) | 53 (52) | Illumina | United States of America | 0 (0) | 80 (79) | 21 (21) |
| glueBuffyHCSS | Multiple authors | Trauma patients with or without infection | 372 | 32.0 (IQR 24.0-41.0) | 98 (26) | Affymetrix | United States of America | 47 (13) | 0 (0) | 325 (87) |
| GSE68310 | Zhai | Outpatients with acute respiratory viral infections | 347 | 20.96 (IQR 20.09-22.76) | 50 (14) | Illumina | United States of America | 0 (0) | 104 (30) | 243 (70) |
| GSE69528 | Khaenam | Sepsis, many cases from burkholderia | 138 | Unk. | 0 (0) | Illumina | Thailand | 83 (60) | 0 (0) | 55 (40) |
| GSE72810 | Herberg | Pediatric patients with bacterial or viral infection | 15 | 1.83 (IQR 0.88-3.29) | 8 (53) | Illumina | United Kingdom | 5 (33) | 10 (67) | 0 (0) |
| GSE73461 | Wright | Pediatric patients with bacterial or viral infection or other inflammatory diseases | 363 | 2.79 (IQR 0.92-8.81) | 165 (45) | Illumina | United Kingdom | 52 (14) | 94 (26) | 217 (60) |
| GSE77087 | de Steenhuijsen Piters | Infants with respiratory synctial virus | 59 | 0.45 (IQR 0.14-0.69) | 25 (42) | Illumina | United States of America | 0 (0) | 41 (69) | 18 (31) |
| GSE77791 | Plassais | Severe burn shock | 30 | 48.0 (IQR 40.25-55.0) | 21 (70) | Affymetrix | France | 0 (0) | 0 (0) | 30 (100) |
| GSE82050 | Tang | Moderate and severe influenza infection | 39 | 64.5 (IQR 48.5-74.25) | 13 (33) | Agilent | Germany | 0 (0) | 24 (62) | 15 (38) |
| GSE103842 | Rodriguez-Fernandez | Infants with respiratory synctial virus | 74 | 0.25 (IQR 0.17-0.44) | 39 (53) | Illumina | United States of America | 0 (0) | 62 (84) | 12 (16) |
| GSE111368 | Dunning | Influenza H1N1 and B | 33 | 38.0 (IQR 29.0-49.0) | 15 (45) | Illumina | United Kingdom | 0 (0) | 33 (100) | 0 (0) |
| GSE13015gpl6102 | Pankla | Sepsis, many cases from burkholderia | 55 | 54.0 (IQR 48.0-61.0) | 26 (47) | Illumina | Thailand | 45 (82) | 0 (0) | 10 (18) |
| GSE13015gpl6947 | Pankla | Sepsis, many cases from burkholderia | 20 | 49.0 (IQR 43.5-59.5) | 6 (30) | Illumina | Thailand | 15 (75) | 0 (0) | 5 (25) |
| GSE21802 | Bermejo-Martin | Pandemic H1N1 in ICU | 14 | Unk. | 0 (0) | Illumina | Unk. | 0 (0) | 10 (71) | 4 (28) |
| GSE22098 | Berry | Bacterial infection or other inflammatory conditions | 274 | 16.0 (IQR 11.0-26.0) | 59 (22) | Illumina | Unk. | 52 (19) | 0 (0) | 222 (81) |
| GSE27131 | Berdal | Severe H1N1 | 14 | 39.0 (IQR 35.75-44.75) | 10 (71) | Affymetrix | Norway | 0 (0) | 7 (50) | 7 (50) |
| GSE28750 | Sutherland | Sepsis or post-surgical SIRS | 21 | Unk. | 0 (0) | Affymetrix | Australia | 10 (48) | 0 (0) | 11 (52) |
| GSE28991 | Naim | Patients with suspected dengue | 11 | Unk. | 0 (0) | Illumina | Unk. | 0 (0) | 11 (100) | 0 (0) |
| GSE29385 | Naim | Febrile patients with viral infection, mostly influenza | 80 | 25.0 (IQR 22.0-40.0) | 48 (60) | Illumina | Unk. | 0 (0) | 80 (100) | 0 (0) |
| GSE30119 | Banchereau | Pediatric patients with community-acquired bacterial infection | 81 | 6.5 (IQR 1.92-11.0) | 34 (42) | Illumina | United States of America | 59 (73) | 0 (0) | 22 (27) |
| GSE32707 | Dolinay | Patients undergoing mechanical ventilation with sepsis or SIRS or neither | 44 | 56.0 (IQR 45.0-59.0) | 13 (30) | Illumina | United States of America | 0 (0) | 0 (0) | 44 (100) |
| GSE40012 | Parnell | Bacterial or influenza A pneumonia or SIRS | 54 | 59.0 (IQR 46.5-67.0) | 20 (37) | Illumina | Australia | 16 (30) | 8 (15) | 30 (56) |
| GSE40165 | Nguyen | Febrile children with dengue | 123 | 12.0 (IQR 10.0-14.0) | 85 (69) | Illumina | Vietnam | 0 (0) | 123 (100) | 0 (0) |
| GSE40396 | Hu | Febrile children with bacterial or viral infection | 52 | 0.92 (IQR 0.33-1.6) | 17 (33) | Illumina | United States of America | 8 (15) | 22 (42) | 22 (42) |
| GSE40586 | Lill | Community-acquired bacterial meningitis | 21 | 57.0 (IQR 53.0-70.5) | 0 (0) | Affymetrix | Estonia | 21 (100) | 0 (0) | 0 (0) |
| INF-02 | Liesenfeld | Patients with suspected infection/sepsis in ED | 59 | 39.0 (IQR 29.0-56.0) | 17 (28) | NanoString | USA/Greece | 24 (41) | 7 (12) | 28 (47) |
| INF-IIS-01 | Rogers | ICU patients with at least one risk factor for acute respiratory distress syndrome | 13 | 57.0 (IQR 42.0-72.0) | 10 (77) | NanoString | USA | 6 (46) | 1 (8) | 6 (46) |
| INF-IIS-03 | Liesenfeld | Patients with bacterial upper respiratory tract infections | 13 | 65.0 (IQR 37.0-85.0) | 8 (62) | NanoString | Greece | 5 (38) | 8 (62) | 0 (0) |
| INF-IIS-04 | Giamarellos-Bourboulis | ED and hospitalized sepsis patients | 3 | 72.0 (IQR 70.5-74.0) | 2 (67) | NanoString | Greece | 3 (100) | 0 (0) | 0 (0) |
| INF-IIS-10 | Iglesias | Sepsis or septic shock patients admitted to ICU | 6 | 64.5 (IQR 60.25-71.0) | 3 (50) | NanoString | USA | 6 (100) | 0 (0) | 0 (0) |
| INF-IIS-11 | Bauer | Patients with suspected infection/sepsis in ED | 25 | 77.0 (IQR 65.0-86.0) | 14 (56) | NanoString | Germany | 16 (64) | 5 (20) | 4 (16) |
| INF-IIS-21 | Almansa | Patients with suspected severe respiratory infection | 5 | 81.0 (IQR 77.0-82.0) | 5 (100) | NanoString | Spain | 0 (0) | 5 (100) | 0 (0) |
| Study | Author | Description | N | Age∗ | Male∗ | Platform | Country | 30-day Mortality | Survival |
| EMEXP3589 | Almansa | Patients hospitalized with COPD exacerbation | 27 | Unk. | 16 (59) | Agilent | Spain | 0 (0) | 27 (100) |
| EMTAB1548 | Almansa | Surgical patients with sepsis (EXPRESS) | 140 | 72.0 (IQR 61.0-78.0) | 95 (68) | Agilent | Spain | 12 (9) | 128 (91) |
| EMTAB3162 | van den Ham | Patients with dengue | 21 | 20.0 (IQR 17.0-28.0) | 11 (52) | Affymetrix | Indonesia | 0 (0) | 21 (100) |
| GSE42026 | Herberg | Severe H1N1/09 influenza or bacterial infection | 59 | 1.25 (IQR 0.38-4.0) | 33 (56) | Illumina | United Kingdom | 0 (0) | 59 (100) |
| GSE47655 | Stone | Severe anaphylaxis in ED | 6 | Unk. | 0 (0) | Affymetrix | Australia | 0 (0) | 6 (100) |
| GSE51808 | Kwissa | Patients with dengue | 28 | Unk. | 0 (0) | Affymetrix | Thailand | 0 (0) | 28 (100) |
| GSE54514 | Parnell | Sepsis patients in ICU | 19 | Unk. | 0 (0) | Illumina | Unk. | 4 (21) | 15 (79) |
| GSE57183 | Shenoi | Febrile children with SJIA | 11 | 3.6 (IQR 3.3-7.3) | 5 (45) | Illumina | United States of America | 0 (0) | 11 (100) |
| GSE25504 | Smith | Neonatal sepsis | 33 | 0.0 (IQR 0.0-0.0) | 19 (57) | Affymetrix | United Kingdom | 2 (6) | 31 (94) |
| GSE60244 | Suarez | Lower respiratory tract infections | 118 | 63.0 (IQR 50.0-77.0) | 37 (31) | Illumina | United States of America | 0 (0) | 118 (100) |
| GSE63881 | Hoang | Pediatric patients with Kawasaki disease | 171 | 2.75 (IQR 1.42-4.25) | 102 (60) | Illumina | United States of America | 0 (0) | 171 (100) |
| GSE64456 | Mahajan | Febrile infants with bacterial or viral infection in ED | 200 | 0.1 (IQR 0.06-0.13) | 106 (53) | Illumina | United States of America | 0 (0) | 200 (100) |
| GSE65682 | Scicluna | Suspected but negative for CAP | 106 | Unk. | 0 (0) | Affymetrix | Unk. | 23 (22) | 83 (78) |
| GSE66099 | Sweeney | Pediatric ICU patients with sepsis, SIRS | 229 | 2.45 (IQR 1.0-5.88) | 94 (41) | Affymetrix | United States of America | 28 (12) | 201 (88) |
| GSE67059 | Heinonen | Children with rhinovirus | 80 | 0.83 (IQR 0.3-1.29) | 53 (66) | Illumina | United States of America | 0 (0) | 80 (100) |
| GSE68310 | Zhai | Outpatients with acute respiratory viral infections | 104 | 20.96 (IQR 20.09-22.76) | 50 (48) | Illumina | United States of America | 0 (0) | 104 (100) |
| GSE72810 | Herberg | Pediatric patients with bacterial or viral infection | 72 | 1.83 (IQR 0.88-3.29) | 8 (11) | Illumina | United Kingdom | 0 (0) | 72 (100) |
| GSE73461 | Wright | Pediatric patients with bacterial or viral infection or other inflammatory diseases | 404 | 2.79 (IQR 0.92-8.81) | 165 (41) | Illumina | United Kingdom | 0 (0) | 404 (100) |
| GSE77087 | de Steenhuijsen Piters | Infants with respiratory synctial virus | 41 | 0.45 (IQR 0.14-0.69) | 25 (61) | Illumina | United States of America | 0 (0) | 41 (100) |
| GSE82050 | Tang | Moderate and severe influenza infection | 24 | 64.5 (IQR 48.5-74.25) | 13 (54) | Agilent | Germany | 0 (0) | 24 (100) |
| GSE95233 | Venet | Septic shock | 51 | 66.0 (IQR 53.5-73.5) | 31 (61) | Affymetrix | France | 17 (33) | 34 (67) |
| GSE103842 | Rodriguez-Fernandez | Infants with respiratory synctial virus | 62 | 0.25 (IQR 0.17-0.44) | 39 (63) | Illumina | United States of America | 0 (0) | 62 (100) |
| GSE13015gpl6102 | Pankla | Sepsis, many cases from burkholderia | 55 | 54.0 (IQR 48.0-61.0) | 26 (47) | Illumina | Thailand | 15 (27) | 40 (73) |
| GSE13015gpl6947 | Pankla | Sepsis, many cases from burkholderia | 15 | 49.0 (IQR 43.5-59.5) | 6 (40) | Illumina | Thailand | 7 (47) | 8 (53) |
| GSE22098 | Berry | Bacterial infection or other inflammatory conditions | 193 | 16.0 (IQR 11.0-26.0) | 59 (31) | Illumina | Unk. | 0 (0) | 193 (100) |
| GSE27131 | Berdal | Severe H1N1 | 7 | 38.0 (IQR 33.0-50.0) | 6 (86) | Affymetrix | Norway | 2 (28) | 5 (71) |
| GSE28991 | Naim | Patients with suspected dengue | 11 | Unk. | 0 (0) | Illumina | Unk. | 0 (0) | 11 (100) |
| GSE30119 | Banchereau | Pediatric patients with community-acquired bacterial infection | 59 | 6.5 (IQR 1.92-11.0) | 34 (57) | Illumina | United States of America | 0 (0) | 59 (100) |
| GSE32707 | Dolinay | Patients undergoing mechanical ventilation with sepsis or SIRS or neither | 69 | 56.0 (IQR 45.0-59.0) | 13 (19) | Illumina | United States of America | 25 (36) | 44 (64) |
| GSE40012 | Parnell | Bacterial or influenza A pneumonia or SIRS | 39 | 59.0 (IQR 46.5-67.0) | 20 (51) | Illumina | Australia | 5 (13) | 34 (87) |
| GSE40165 | Nguyen | Febrile children with dengue | 123 | 12.0 (IQR 10.0-14.0) | 85 (69) | Illumina | Vietnam | 0 (0) | 123 (100) |
| GSE40396 | Hu | Febrile children with bacterial or viral infection | 30 | 0.92 (IQR 0.33-1.6) | 17 (56) | Illumina | United States of America | 0 (0) | 30 (100) |
| GSE40586 | Lill | Community-acquired bacterial meningitis | 21 | 57.0 (IQR 53.0-70.5) | 0 (0) | Affymetrix | Estonia | 2 (10) | 19 (90) |
| INF-02 | Liesenfeld | Patients with suspected infection/sepsis in ED | 61 | 41.0 (IQR 29.0-57.0) | 18 (30) | NanoString | USA/Greece | 2 (3) | 59 (97) |
| INF-IIS-01 | Rogers | ICU patients with at least one risk factor for acute respiratory distress syndrome | 11 | 57.0 (IQR 39.5-81.5) | 10 (91) | NanoString | USA | 5 (45) | 6 (55) |
| INF-IIS-03 | Liesenfeld | Patients with bacterial upper respiratory tract infections | 19 | 77.0 (IQR 51.5-85.0) | 12 (63) | NanoString | Greece | 9 (47) | 10 (53) |
| INF-IIS-04 | Giamarellos-Bourboulis | ED and hospitalized sepsis patients | 3 | 72.0 (IQR 70.5-74.0) | 2 (67) | NanoString | Greece | 1 (33) | 2 (67) |
| INF-IIS-10 | Iglesias | Sepsis or septic shock patients admitted to ICU | 6 | 64.5 (IQR 60.25-71.0) | 3 (50) | NanoString | USA | 1 (17) | 5 (83) |
| INF-IIS-11 | Bauer | Patients with suspected infection/sepsis in ED | 25 | 77.0 (IQR 65.0-86.0) | 14 (56) | NanoString | Germany | 4 (16) | 21 (84) |
| INF-IIS-21 | Almansa | Patients with suspected severe respiratory infection | 5 | 81.0 (IQR 77.0-82.0) | 5 (100) | NanoString | Spain | 0 (0) | 5 (100) |
8.3 Feature selection
Feature selection is illustrated in Fig. 5. It was assay-guided in the sense that all selected features must have exhibited acceptable amplification by LAMP.
-
1.
The “benchtop LAMP” experiments revealed lack of amplification of 10 genes, which were replaced by 10 genes with a good trade-off between the LAMP amplification and clinical performance [23].
-
2.
Subsequent experiments on the target platform revealed lack of amplification of additional 11 genes, due to differences between the benchtop and Myrna™ amplification. The non-amplified genes were replaced with genes which had good trade-off between Myrna amplification and clinical performance using the process shown in Fig. 5. Briefly, we started with a new sorted list of predictive and prognostic genes identified using midplex-genome-wide search for biological signal. We then went down the list and synthesized Myrna primers (chemicals used to detect mRNA), where possible. The highest ranked gene with amplified primer replaced the highest ranked gene without the amplification in the existing signature. The ranking was based on a heuristic function comprising Shapley value for the gene and concordance with the NanoString platform. The procedure was repeated until all non-amplified genes were replaced.
-
3.
Following the transfer of the gene set to Myrna, we attempted reduction of the signature size using a greedy forward search.
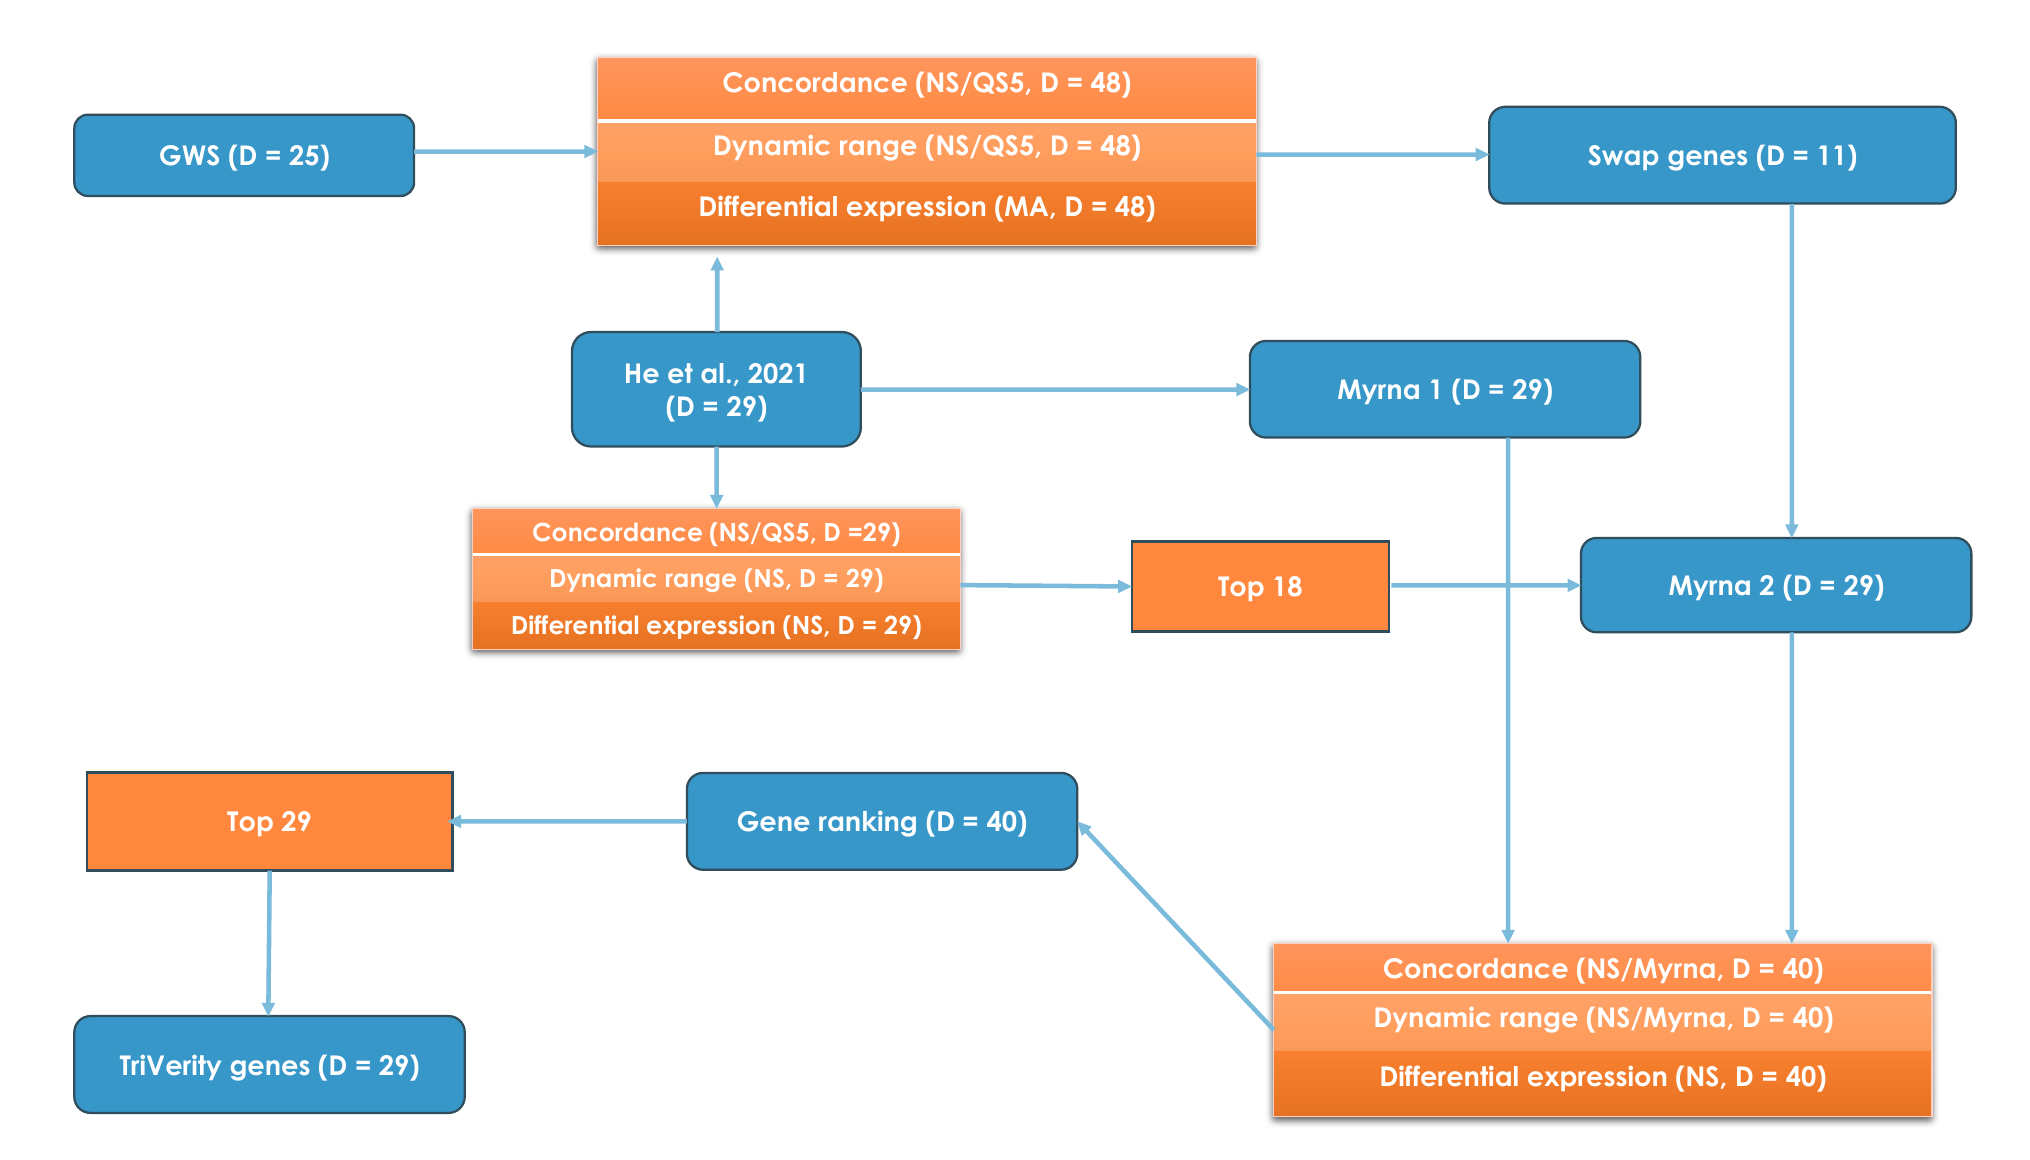
The final set of genes chosen by the feature selection process is shown in Fig. 6.
8.4 Concordance Filtering ablation
To estimate the impact of CF, we performed an ablation study by evaluating performance of the leading classifiers (MLP and LOGR) with and without the CF. Table 5 shows that CF significantly improves the PCC for MLP classifier, without loss of accuracy.
| Algorithm | Statistic | With CF | Without CF |
|---|---|---|---|
| LOGR | CV mAUROC | 0.886 | 0.885 |
| LOGR | Validation mAUROC | 0.834 | 0.833 |
| LOGR | Bacterial PCC | 0.938 | 0.939 |
| LOGR | Viral PCC | 0.962 | 0.963 |
| MLP | CV mAUROC | 0.895 | 0.897 |
| MLP | Validation mAUROC | 0.832 | 0.834 |
| MLP | Bacterial PCC | 0.942 | 0.891 |
| MLP | Viral PCC | 0.960 | 0.940 |