Carbon and Iron Deficiencies in Quiescent Galaxies at from JWST-SUSPENSE:
Implications for the Formation Histories of Massive Galaxies
Abstract
We present the stellar metallicities and multi-element abundances (C, Mg, Si, Ca, Ti, Cr, and Fe) of 15 massive (log ) quiescent galaxies at , derived from ultradeep JWST-SUSPENSE spectra. Compared to quiescent galaxies at , these galaxies exhibit a deficiency of 0.25 dex in [C/H], 0.16 dex in [Fe/H], and 0.07 dex in [Mg/H], implying rapid formation and quenching before significant enrichment from asymptotic giant branch stars and Type Ia supernovae. Additionally, we find that galaxies that form at higher redshift have higher [Mg/Fe] and lower [Fe/H] and [Mg/H], irrespective of their observed redshift. The evolution in [Fe/H] and [C/H] is therefore primarily explained by lower redshift samples naturally including galaxies with longer star-formation timescales. On the other hand, the lower [Mg/H] can be explained by galaxies forming at earlier epochs expelling larger gas reservoirs during their quenching phase. Consequently, the mass-metallicity relation, primarily reflecting [Mg/H], is also lower at compared to the lower redshift relation, though the slopes are similar. Finally, we compare our results to standard stellar population modeling approaches employing solar abundance patterns and non-parametric star-formation histories (using Prospector). Our SSP-equivalent ages agree with the mass-weighted ages from Prospector, while the metallicities disagree significantly. Nonetheless, the metallicities better reflect [Fe/H] than total [Z/H]. We also find that star-formation timescales inferred from elemental abundances are significantly shorter than those from Prospector, and we discuss the resulting implications for the early formation of massive galaxies.
1 Introduction
The chemical makeup of a galaxy is intimately linked to its past star formation, the amount of gas and stars it accretes, and the gas that is expelled through outflows. Consequently, the metal content of galaxies reflects fundamental physical processes that influence their evolution, such as star formation efficiency, feedback from massive stars and active galactic nuclei (AGN), and previous merger events. By characterizing how the metallicities of galaxies evolve across redshifts, we can obtain direct insights into the processes shaping galaxy growth throughout cosmic time.
In the nearby universe, galaxies display a tight correlation between their stellar mass and metallicity, known as the mass-metallicity relation (MZR; e.g., Lequeux et al., 1979; Tremonti et al., 2004; Gallazzi et al., 2005; Kirby et al., 2013). For star-forming galaxies, the gas-phase MZR has been routinely studied out to mostly using strong-line indicators (e.g., Maiolino et al., 2008; Zahid et al., 2013; Sanders et al., 2020, 2021; Papovich et al., 2022; Shapley et al., 2023) and has recently been confirmed up to with the advent of JWST (Langeroodi et al., 2023; Nakajima et al., 2023; Curti et al., 2024). Quiescent galaxies, however, lack the strong emission lines needed for gas-phase measurements, so we instead rely on faint absorption lines originating from stellar atmospheres. At higher redshifts, measuring stellar metallicity becomes increasingly challenging as key absorption features shift to near-infrared (NIR) wavelengths, where ground-based spectroscopic observations are severely hindered by skylines. As a result, the MZR of quiescent galaxies has only been systematically studied up to , showing little evolution since (Choi et al., 2014; Gallazzi et al., 2014; Barone et al., 2022; Beverage et al., 2023).
Beyond , the picture is much less clear. Currently, there are only a handful of stellar metallicity measurements of quiescent galaxies at based on absorption lines, mostly relying on methods such as spectral stacking (Onodera et al., 2015; Carnall et al., 2022), observations of rare lensed massive galaxies (Jafariyazani et al., 2020; Man et al., 2021; Zhuang et al., 2023; Akhshik et al., 2023; Jafariyazani et al., 2024), low-resolution spectroscopy (Morishita et al., 2018; Estrada-Carpenter et al., 2019; Akhshik et al., 2023), or utilizing extreme integration times on the most efficient ground-based telescopes (Kriek et al., 2016, 2019, 2024; Beverage et al., 2024). Despite the small samples at these redshifts, there is a growing consensus that massive quiescent galaxies at exhibit significantly lower [Fe/H] compared to their present-day counterparts (e.g., Kriek et al., 2019; Zhuang et al., 2023; Beverage et al., 2024). There are, however, a couple of conflicting findings, with two studies reporting exceptionally high metallicities comparable to the most metal-rich galaxies at (Lonoce et al., 2015; Jafariyazani et al., 2020). These contrasting results may not be surprising, given that the uncertainties in individual measurements remain high, and the methods vary significantly between studies (e.g., Lonoce et al., 2015; Onodera et al., 2015; Kriek et al., 2016; Estrada-Carpenter et al., 2019; Saracco et al., 2023).
Understanding the metallicities of distant quiescent galaxies is crucial, as it holds significant implications for the enrichment, star-formation timescales, quenching, and assembly of galaxies across cosmic time. Specifically, the multi-element abundance patterns provide direct insight into the star-formation histories (SFHs) of galaxies. Such insight is largely owed to the diverse enrichment timescales of the elements. elements (e.g., O and Mg) are instantaneously released by core-collapse supernovae (CC SNe). C and N are released approximately equally by CC SNe and by the winds of low-mass asymptotic giant branch (AGB) stars which only contribute after a characteristic delay-time of Myr (e.g. Cristallo et al., 2011, 2015; Maiolino & Mannucci, 2019; Johnson et al., 2023). Fe-peak elements are enriched by both CC and the explosions of intermediate-mass stars (Type Ia SNe; Ia SNe), which occur only after a longer delay (of Gyr Maoz et al., 2010).
To fully exploit chemical compositions for understanding the formation histories of massive galaxies, we need a larger sample of massive quiescent galaxies at with deep spectra covering multiple absorption features. Such observations are now finally possible with JWST. To that end, we have conducted the JWST-SUSPENSE program, an ultradeep rest-frame optical spectroscopic NIRSpec/MSA survey of 20 massive quiescent galaxies at (Slob et al., 2024).
In this paper, we present the metallicities and multi-element abundances of distant quiescent galaxies at from the JWST-SUSPENSE survey. In Section 2 we describe the observations and elemental abundance analysis, in Section 3 we present the abundance results, in Section 4 we present the MZR at , and in Section 5 we discuss the implications of the results on star-formation timescales, the assembly of massive galaxies, and star-formation quenching. In Section 5 we also compare the full-spectrum modeling results to those from Prospector and discuss the implications of this comparison on the early formation of massive galaxies. In Section 6, we present a summary. Throughout this Paper, we assume a Kroupa (2001) IMF, solar abundances from Asplund (2009), and a flat CDM cosmology with and .
| ID | Age | [Fe/H] | [Mg/H] | [C/H] | [Ca/H] | [Ti/H] | [Cr/H] | [Si/H] | |||
|---|---|---|---|---|---|---|---|---|---|---|---|
| () | (km s-1) | (Gyr) | |||||||||
| 127345 | 1.168 | 10.7 | – | ||||||||
| 130040 | 1.170 | 11.2 | |||||||||
| 127154 | 1.205 | 10.7 | – | ||||||||
| 129982 | 1.249 | 11.2 | – | ||||||||
| 127108 | 1.335 | 10.2 | – | ||||||||
| 129197 | 1.474 | 10.5 | – | – | – | – | – | – | – | ||
| 129149 | 1.579 | 11.0 | – | ||||||||
| 128041 | 1.760 | 10.7 | |||||||||
| 127700 | 2.013 | 10.9 | – | – | – | – | |||||
| 129133 | 2.139 | 11.1 | – | ||||||||
| 129133 | 2.139 | 11.1 | – | ||||||||
| 127941 | 2.141 | 10.8 | – | ||||||||
| 128036 | 2.196 | 10.9 | – | ||||||||
| 128913 | 2.285 | 10.9 | – | – | – | – | – | – | – | ||
| 130725 | 2.692 | 11.1 | – | – | – | – | – | ||||
| 129966∗ | 2.923 | 10.9 | – | – | – | – | – | – | – |
2 Observations & Analysis
All galaxies in this study are drawn from the JWST-SUSPENSE Program (ID:2110) which obtained ultra-deep (16.4 hr) NIRSpec-MSA/G140M-F100LP observations of a sample of 20 massive quiescent galaxies at (Slob et al., 2024). Primary targets were initially identified using the UltraVISTA K-band selected DR3 catalog (Muzzin et al., 2013a) and selected to be quiescent using the criterion from Muzzin et al. (2013b). The targets represent the general population of quiescent galaxies at , encompassing the full quiescent range in space at these redshifts, and are all confirmed to have quiescent stellar populations (see Slob et al., 2024).
The spectroscopic observations cover wavelengths from to m, corresponding to a typical rest-frame range of approximately to Å. Most objects have coverage of the Mgb line, several prominent Fe features, and multiple Balmer lines. The stellar masses and star-formation rates were derived by Slob et al. (2024) by fitting the spectra and photometry simultaneously with Prospector (Leja et al., 2019a; Johnson et al., 2021) assuming a Chabrier (2003) IMF. They consider two non-parametric SFH models; a fixed-bin model (Leja et al., 2019a) and a post-starburst model (Suess et al., 2022). For more details on target selection, observing strategy, data reduction, redshift determination, and stellar population properties we refer to Slob et al. (2024).
We measure the individual elemental abundances and stellar population ages using a custom full-spectrum fitting code alf111https://github.com/alizabeverage/alfalpha based on the alf fitting code presented in Conroy et al. (2018). The Conroy et al. (2018) models were developed to measure the elemental abundance patterns of old ( 1 Gyr) stellar populations. They combine metallicity-dependent MIST isochrones (Choi et al., 2016), empirical MILES and IRTF spectral libraries (Sanchez-Blazquez et al., 2006; Villaume et al., 2017), and synthetic metallicity- and age-dependent elemental response spectra for 19 elements.
The models assume a single burst of star formation and a Kroupa (2001) IMF. We fit for a total of 20 free parameters; velocity offset, velocity dispersion, single SSP-equivalent stellar population age, isochrone metallicity, 10 individual elemental abundances (Fe, C, N, Mg, Na, Si, Ca, Ti, Cr), Balmer emission line flux, the emission line velocity and broadening, a shift in the effective temperature of the fiducial isochrones (), and an instrumental jitter term to account for under/overestimation of the uncertainties. The abundance ratios of the other nine elements are fixed to solar ([X/Fe] = 0) following results of the mock-recovery test presented in Beverage et al. (2023). We use the dynesty dynamic nested sampling package (Speagle, 2020) to sample the posterior distributions of the 20 parameters.
Before fitting, we smooth the models to the instrumental resolution of the observations. We derive the instrumental resolution as a function of wavelength in the raw spectral frames using the msafit (De Graaff et al., 2024), which takes into account the position and morphology of the galaxies compared to the MSA. The resulting 2D spectra are then rectified using the JWST NIRSpec reduction pipeline in a similar way as the actual data. We find that the wavelength dependence of the instrumental resolution is consistent with the online pre-launch estimates from JDox, but typically a factor of 1.3 better, corresponding to a resolution of . For each galaxy, we derive this factor and assume the corrected JDox curve when fitting. See Slob et al. (2024) for more details on this procedure.
During the fitting procedure, the spectral continuum is removed from the observations by fitting an Chebyshev polynomial to the ratio of the data to the model. We note that the results are robust to decisions regarding the order of the polynomial. Where available, we fit the wavelength regions Å, Å, Å, and Å (each with their own normalized continuum). We mask the NaD absorption feature, the [OIII] lines where present, and the H+[NII] complex. We also exclude wavelengths Å due to the dominant TiO absorption in the spectrum, as these broad features are typically over-fitted by the continuum polynomial.
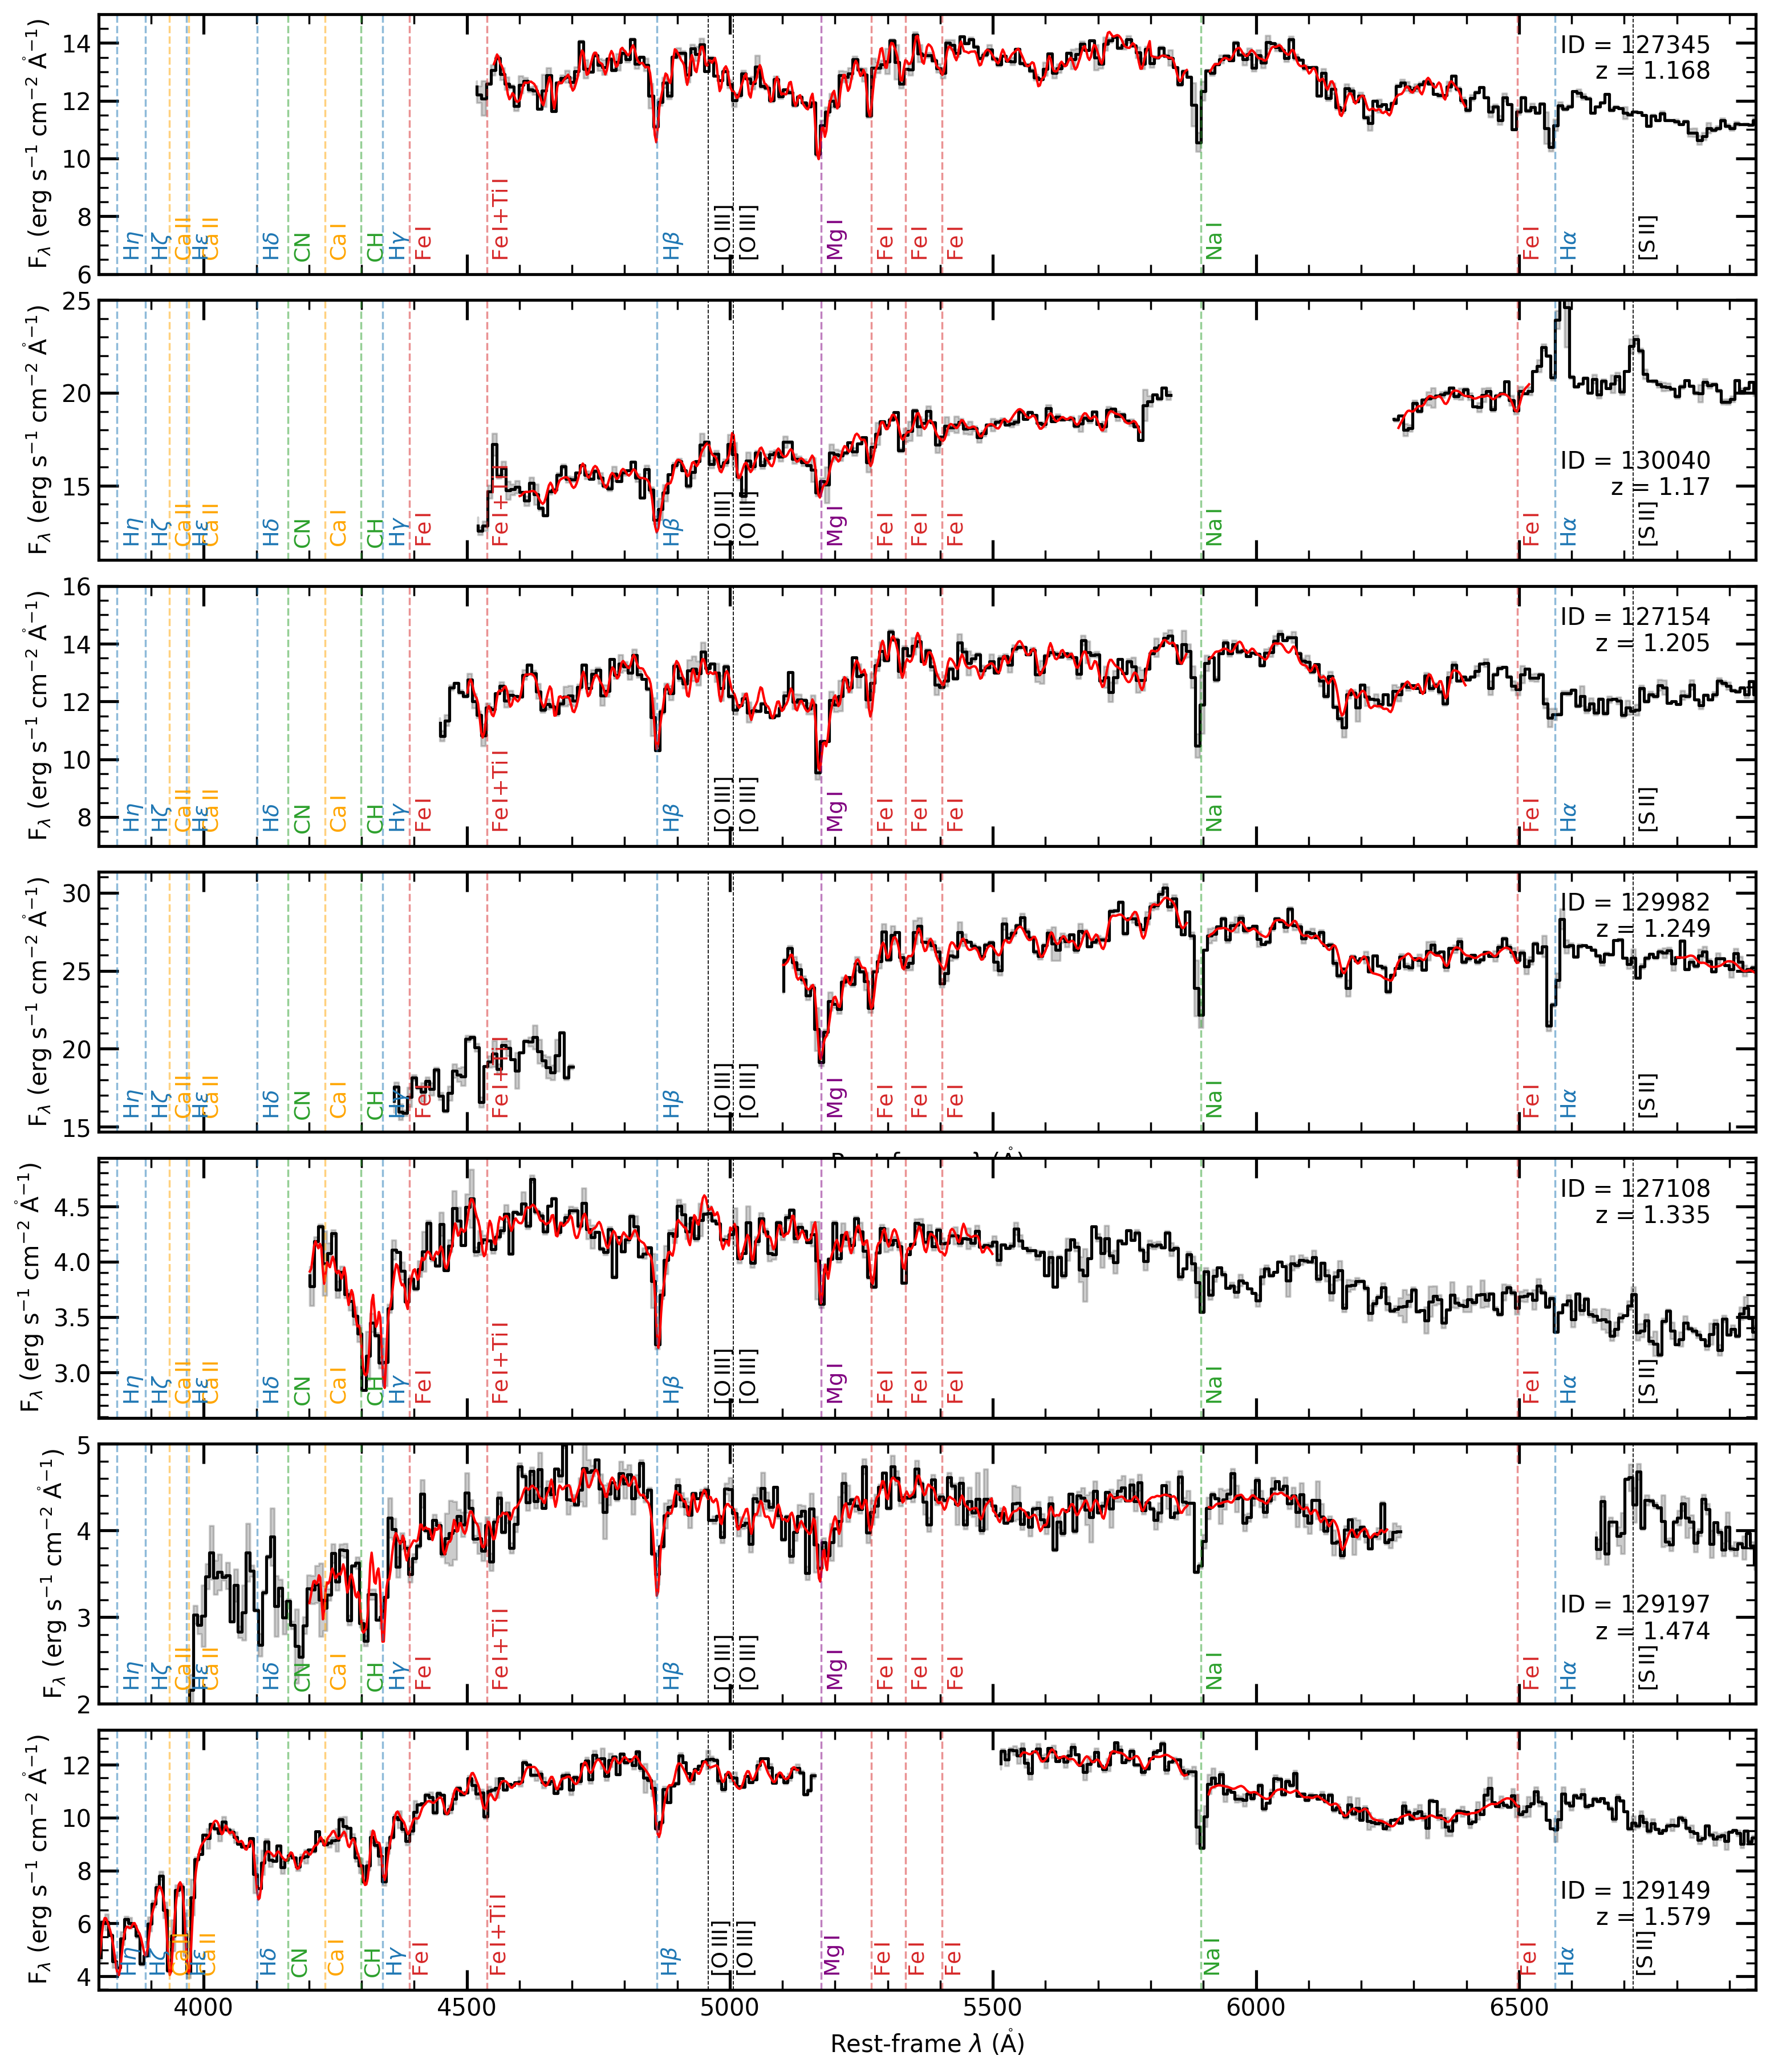
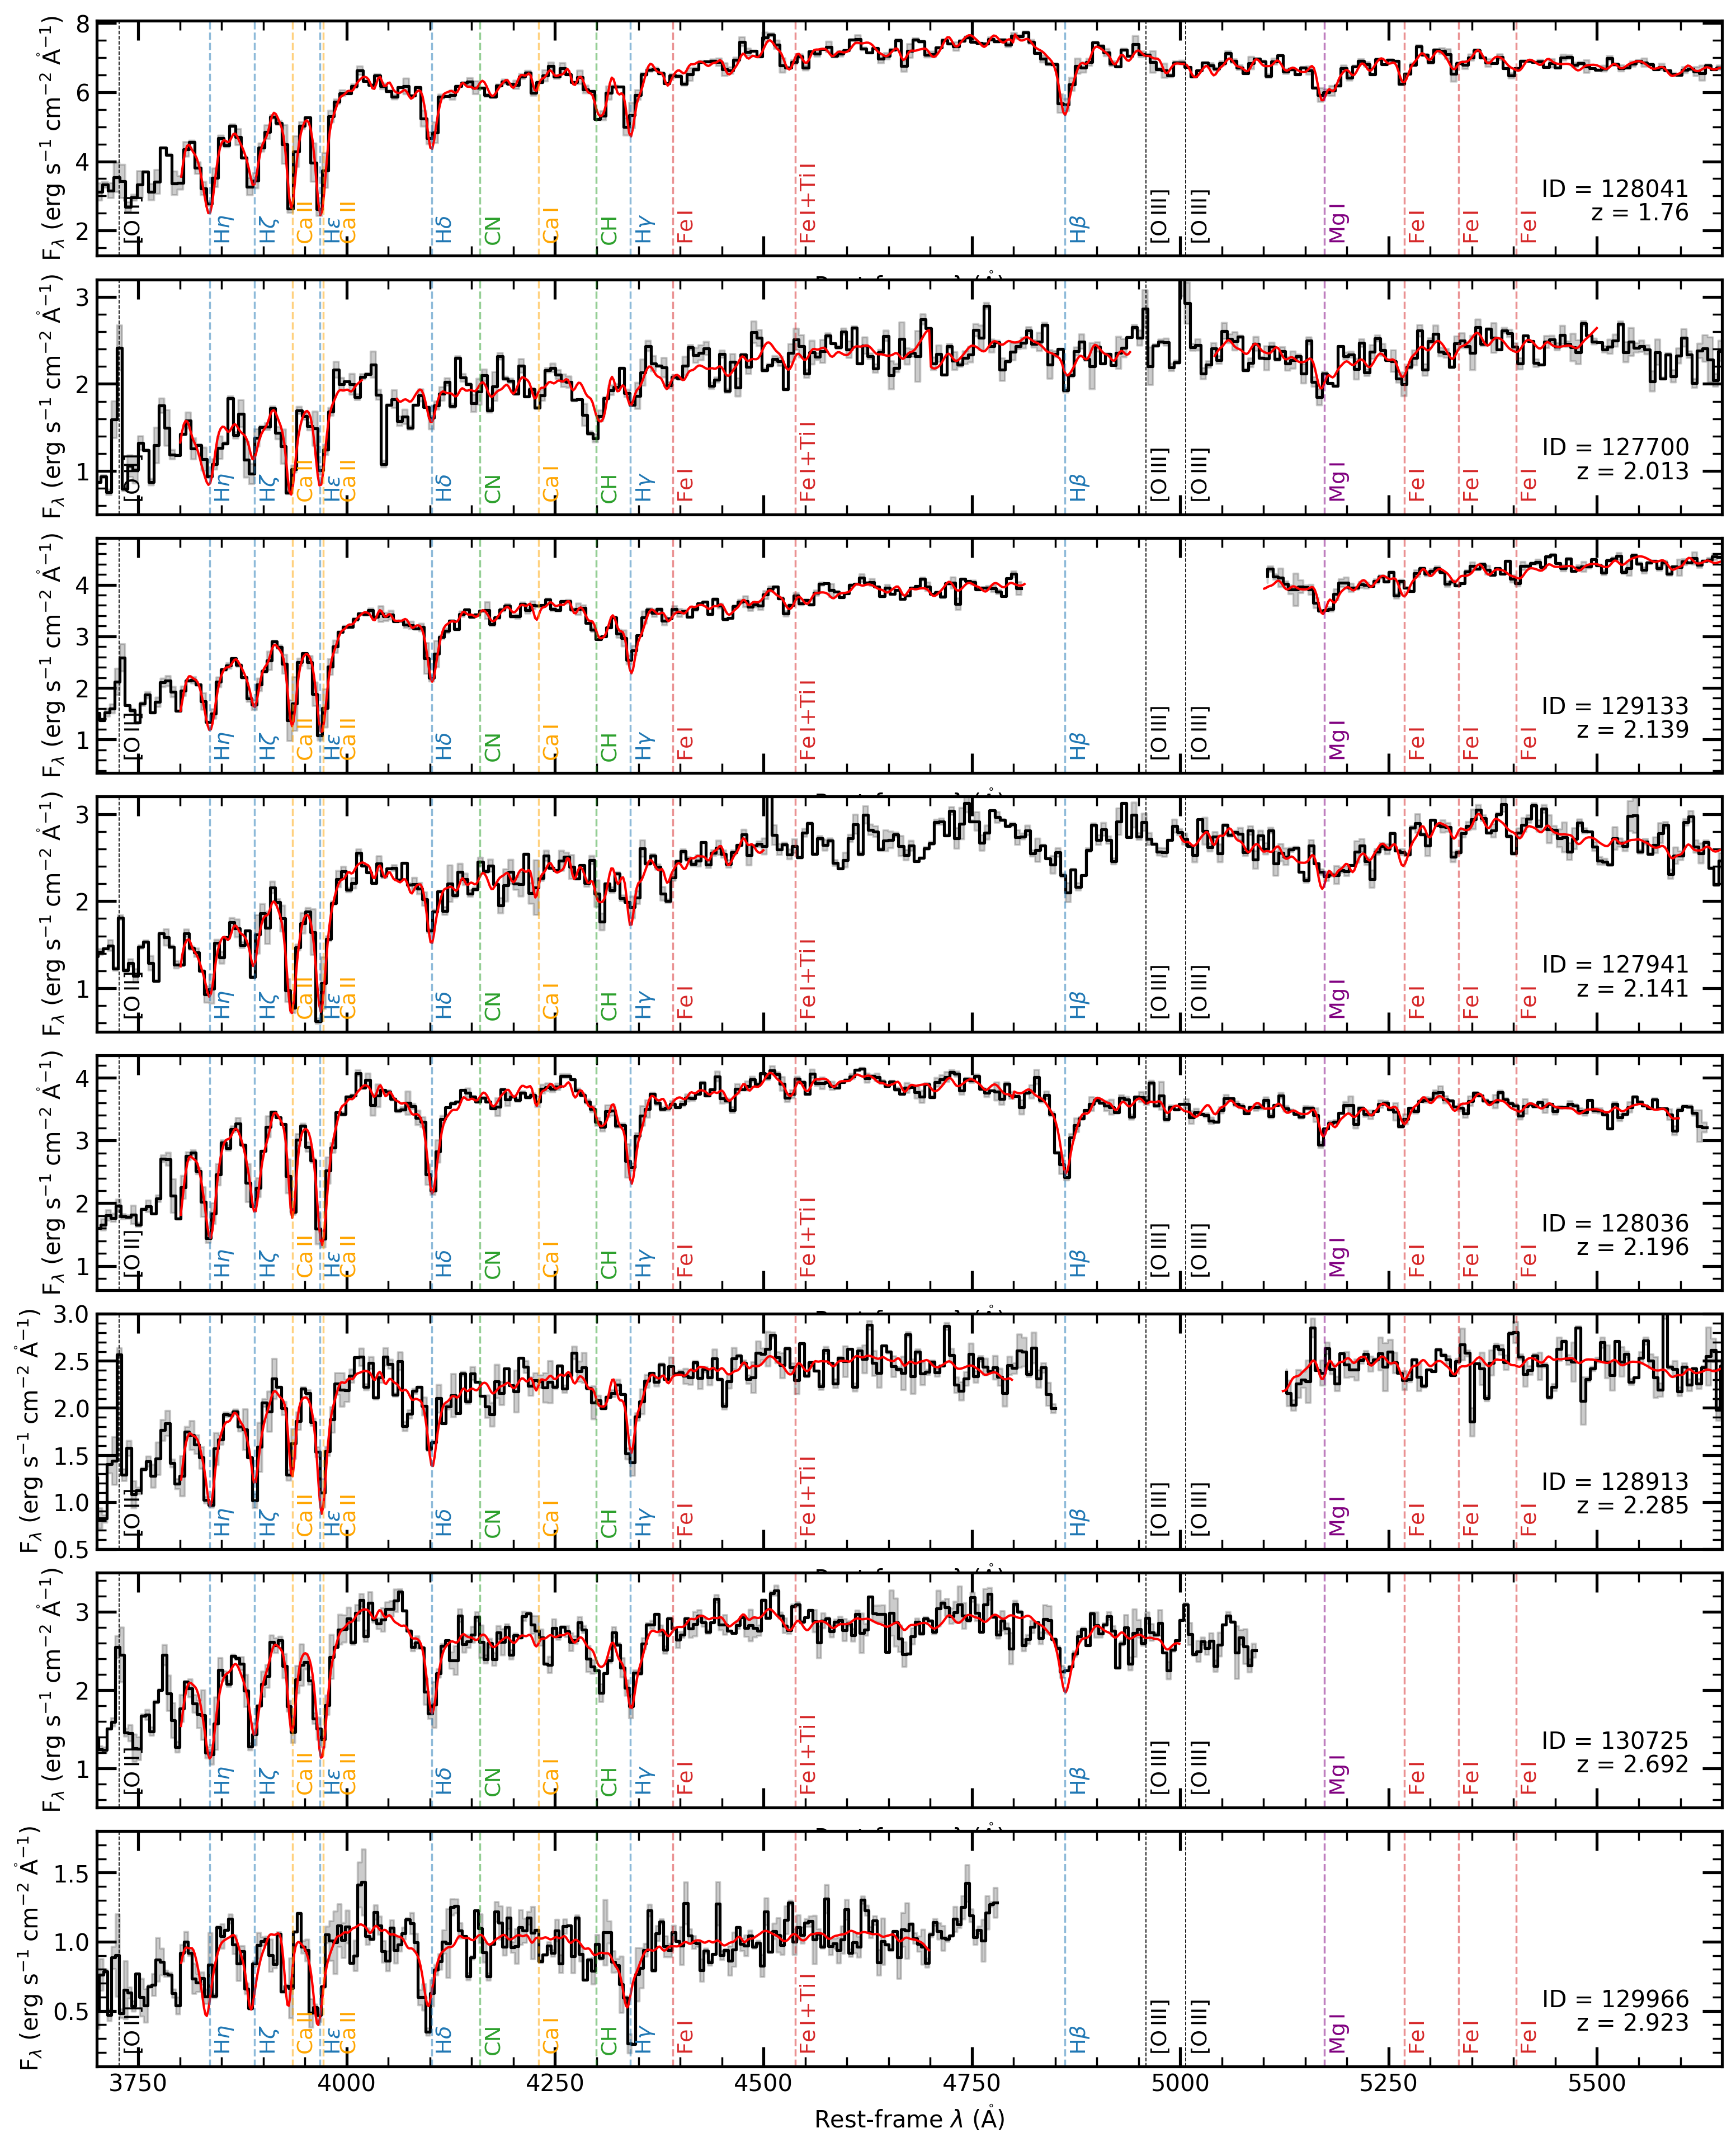
After fitting all 20 galaxies, we visually inspect the best-fit model, the normalizing polynomial, and the corresponding corner plots. We remove five galaxies; two because they have low S/N (15 per rest-frame Å; 130183, 130934), one because it is lacking wavelength coverage of key absorption features (130208), and two because of strong emission lines likely associated with AGN (130647, 128452). We also re-fit 127941, masking the H region, which was poorly fit due to spectral contamination. Object 127108 is also re-fit, masking the region Å due to the lack of clear features. Finally, for each object, we inspect the posteriors of all 10 fitted elements and determine which elements can be constrained by requiring their posterior to be Gaussian and not run against the prior limits (0.5 and 0.5 dex). Figure 1 shows the quiescent SUSPENSE spectra at and corresponding best-fit alf models. We present the stellar population properties and elemental abundance results in Table 1. The elements flagged as “poorly constrained” during the visual inspection are omitted from Table 1. We also omit the abundances of 129966 because the best-fit age is below the lowest age in the stellar population models (1 Gyr).
3 The multi-elemental abundances of distant quiescent galaxies
In this section, we present the multi-element abundances of the massive quiescent galaxies at from the JWST-SUSPENSE program. For each SUSPENSE galaxy, we only consider the elements that have well-behaved normal posterior distributions. Among the ten fitted elements, C, Mg, and Fe have the most galaxies with well-constrained measurements, likely due to their prominent absorption features, such as CH (G4300), Mgb, Fe5270, Fe5335, and Fe5406.
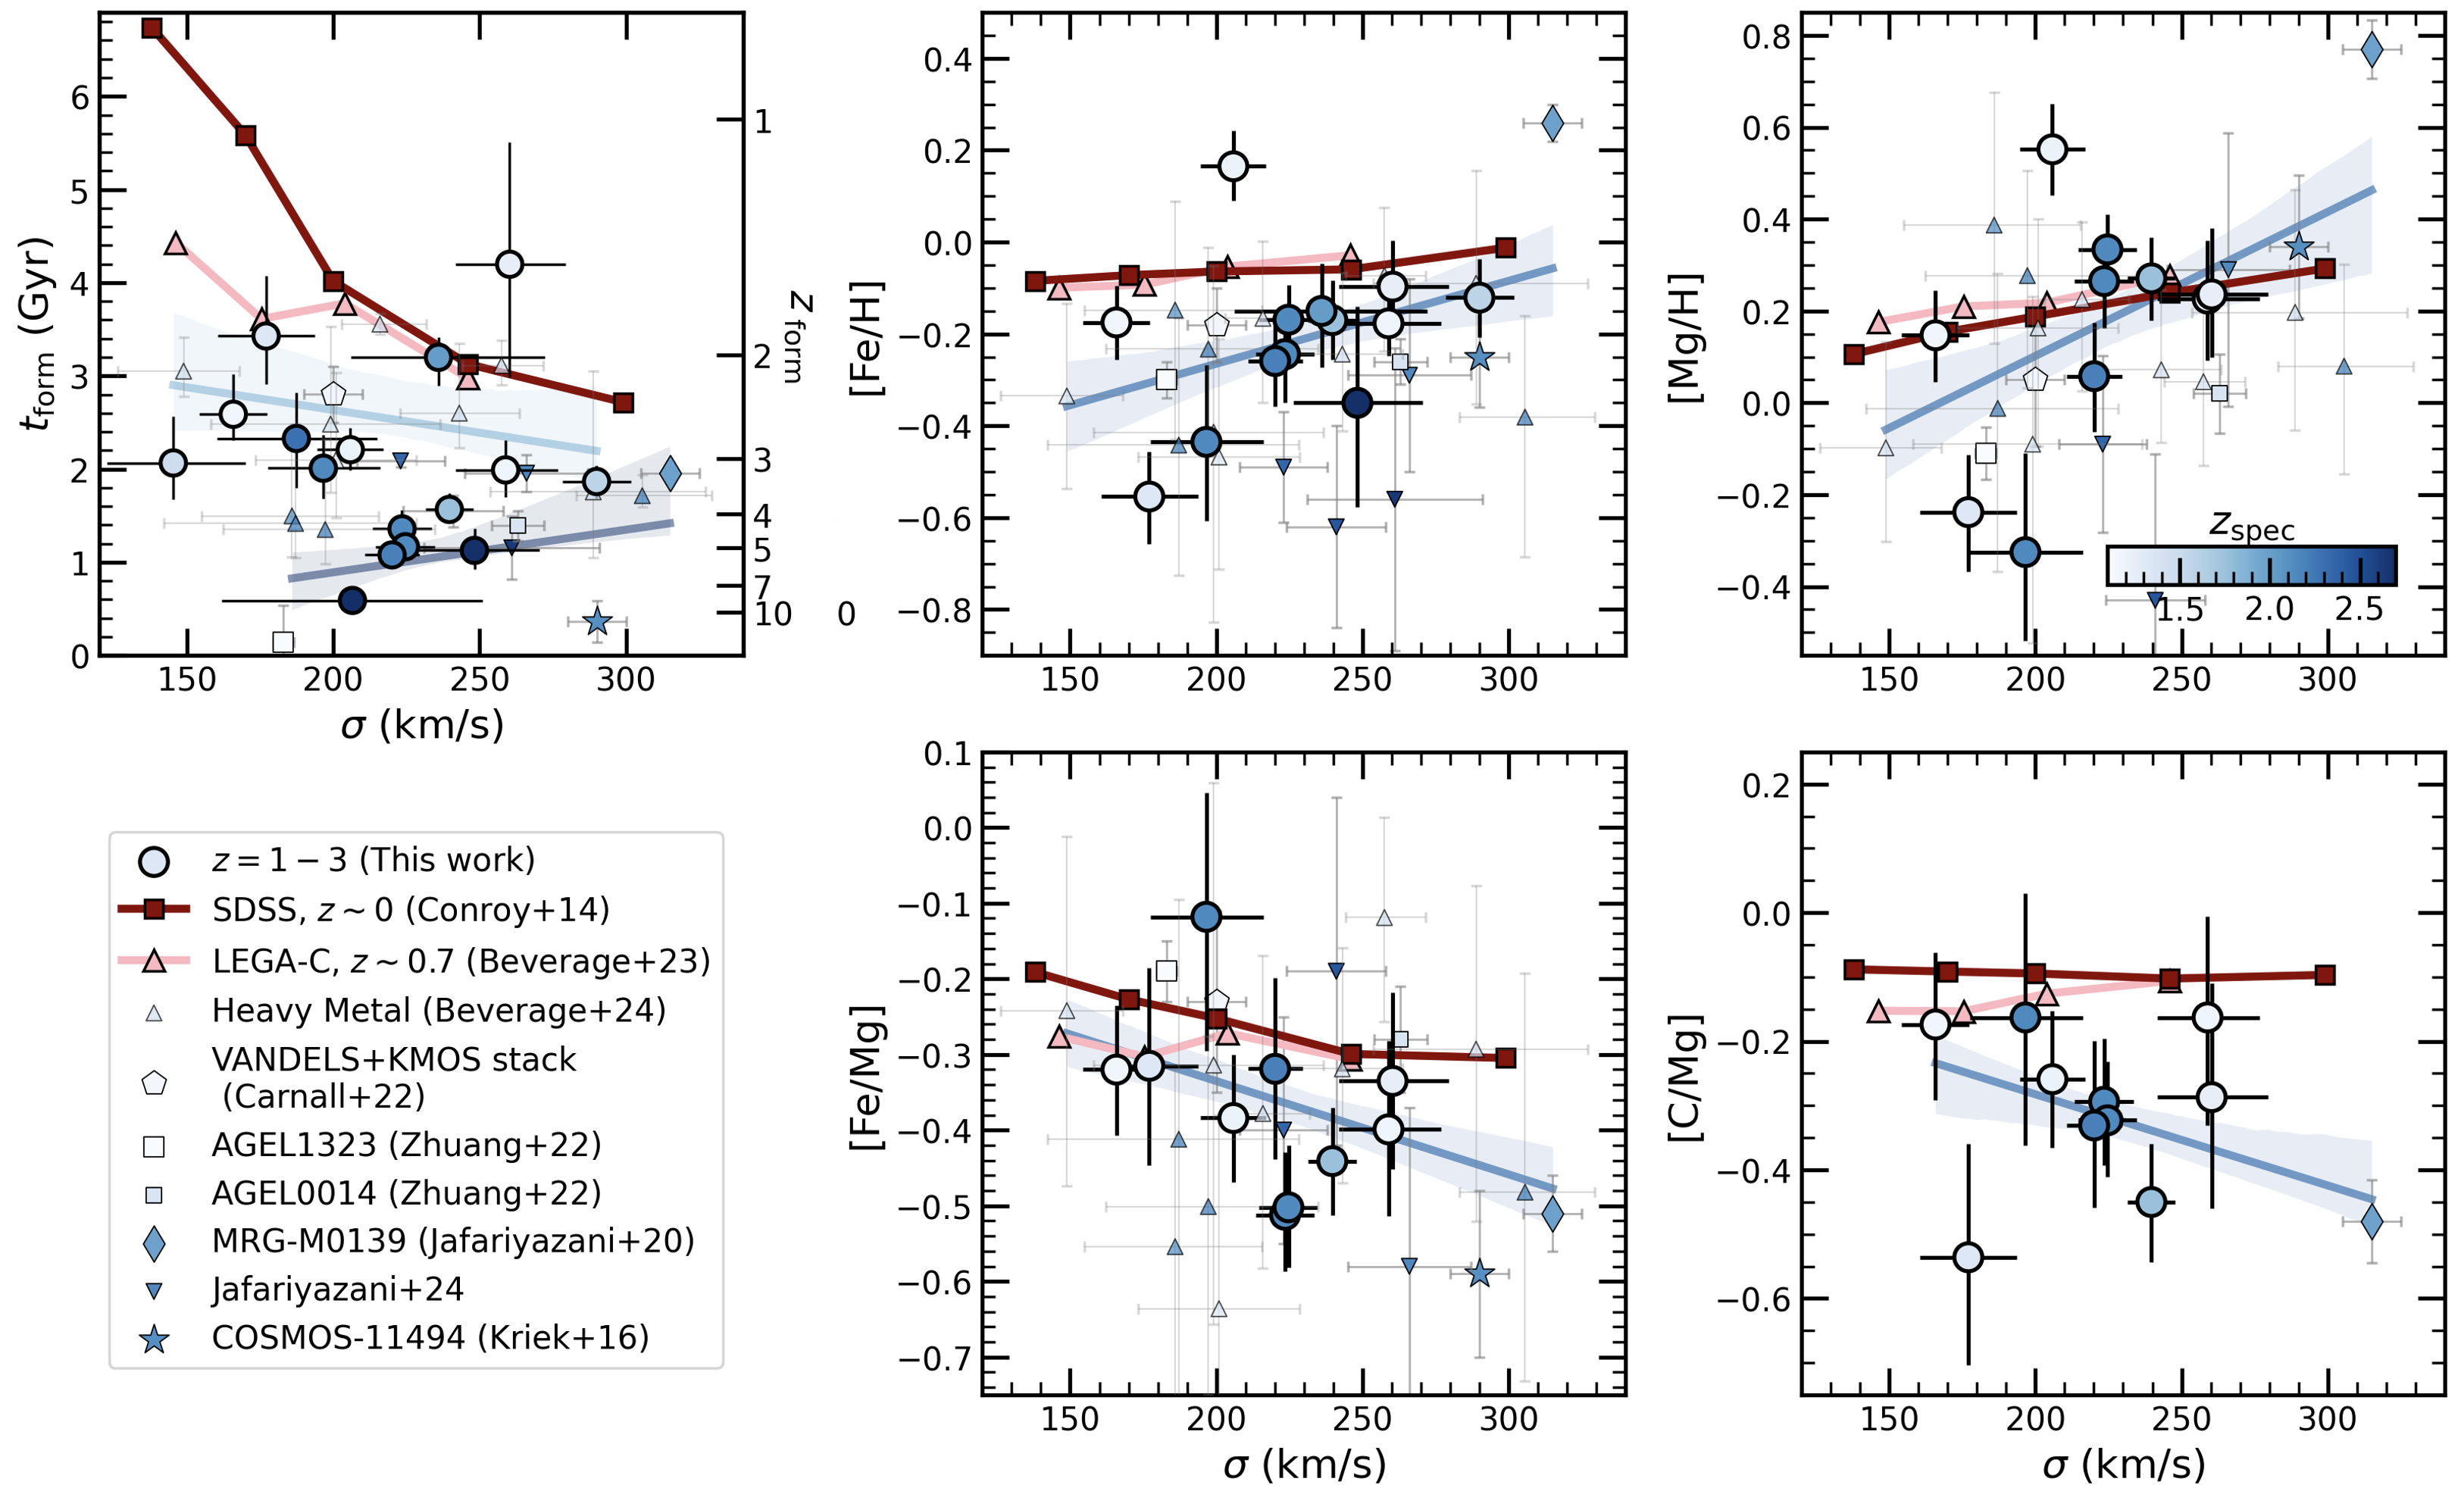
In Figure 2, we present the formation time (), [Fe/H], [Mg/H], [Fe/Mg], and [C/Mg] as a function of line-of-sight velocity dispersion (circles). Here, we adopt Mg as the reference element instead of Fe (i.e., [X/Mg]) because it is mostly produced by CC SNe and thus a simpler tracer of chemical enrichment (see e.g., Weinberg et al., 2019). The formation time is calculated using the stellar ages from Table 1, corrected for the age of the universe at the observed redshift. The points are colored by their spectroscopic redshifts. We also include the results of stacked quiescent galaxies at from SDSS (red squares) and from LEGA-C (pink triangles Beverage et al., 2023). The stacked SDSS spectra and corresponding elemental abundance results were first presented in Conroy et al. (2014) and later re-fit by Beverage et al. (2023) to reflect updates in the stellar population models (see Conroy et al., 2018). We note that the SDSS fiber and the LEGA-C and SUSPENSE slits all cover similar physical radii (3 – 4 kpc). However, since galaxies were smaller in the past, the SUSPENSE and LEGA-C slits cover 1 – 1.2 , while SDSS covers only 0.4 – 0.8 .
In Figure 2, we also include all available elemental abundance measurements in the literature at . We only include measurements that use the same full-spectrum fitting method, and thus are comparable to the SUSPENSE results. We do not include grism or prism results because they rely heavily on the shape of the continuum and are therefore highly susceptible to an age-metallicity degeneracy. We also exclude abundances derived from Lick indices because, at these redshifts, the individual absorption features are faint and easily contaminated by NIR skylines. We color all points by their spectroscopic redshifts.
In each panel of Figure 2, we show the results from a linear regression fit to all available points at , where the shaded confidence intervals are determined by bootstrap resampling. We fit two relations to the formation times, one at (light blue) and another at (dark blue). During the fitting process, we set a lower limit of 0.1 dex on the uncertainties of the elemental abundance, to prevent single high S/N measurements from dominating the fit and to account for possible systematic uncertainties.
In the top left panel of Figure 2, we find that the formation redshifts of the SUSPENSE galaxies range from to . No clear trends are observed between and formation time at . However, there is a clear trend with observed redshift, where typical galaxies at formed earlier than those at lower redshifts, as expected. This redshift trend is also evident within the sample, with the best-fit relation for being lower than that for . A similar trend has been shown by Beverage et al. (2023) and will be discussed in detail in Section 5.2
In the next panel, we show that quiescent galaxies at have [Fe/H] ranging from 0.6 to 0.3, with typical values of 0.22. We find a trend between and [Fe/H], with a statistically significant slope (2 certainty). The slope of the line is steeper than what is found at lower redshifts, and the normalization is 0.16 dex lower. Thus, we confirm earlier results that quiescent galaxies at are Fe-deficient (Kriek et al., 2016, 2019; Morishita et al., 2018; Zhuang et al., 2023; Beverage et al., 2024; Jafariyazani et al., 2024). In the next panel, we find that [Mg/H] varies from 0.3 to 0.6, with a typical value of [Mg/H]. Unlike [Fe/H], the slope of the [Mg/H] relation agrees with the results at and and the normalization is only slightly lower (0.07 dex).
In the bottom left panel of Figure 2 we find [Fe/Mg] ranging from to 0.10, with a typical value of 0.35. The best-fit -[Fe/Mg] relation has a negative slope, in agreement with lower redshift results, however, the relation is offset to lower [Fe/Mg] by 0.1 dex. This low [Fe/Mg] is consistent with the other results at similar redshifts in this figure (Kriek et al., 2016; Beverage et al., 2024; Jafariyazani et al., 2020, 2024).
In the bottom right panel, we show [C/Mg]. We highlight that these are the first measurements of C abundances for a sample of distant quiescent galaxies and that only one other [C/Mg] measurement at these redshifts is available in the literature (Jafariyazani et al., 2020). We find [C/Mg] ranges from to , with a typical value of , in good agreement with Jafariyazani et al. (2020). The best-fit trend with is still highly uncertain given that there are only 10 C measurements at this redshift but it is clear that the SUSPENSE galaxies have dex lower [C/Mg] than the and samples (3 certainty). Given that the average [Mg/H] is similar (to within 0.07 dex) across the redshift samples, the low [C/Mg] and [Fe/Mg] are caused by deficiencies in C and Fe.
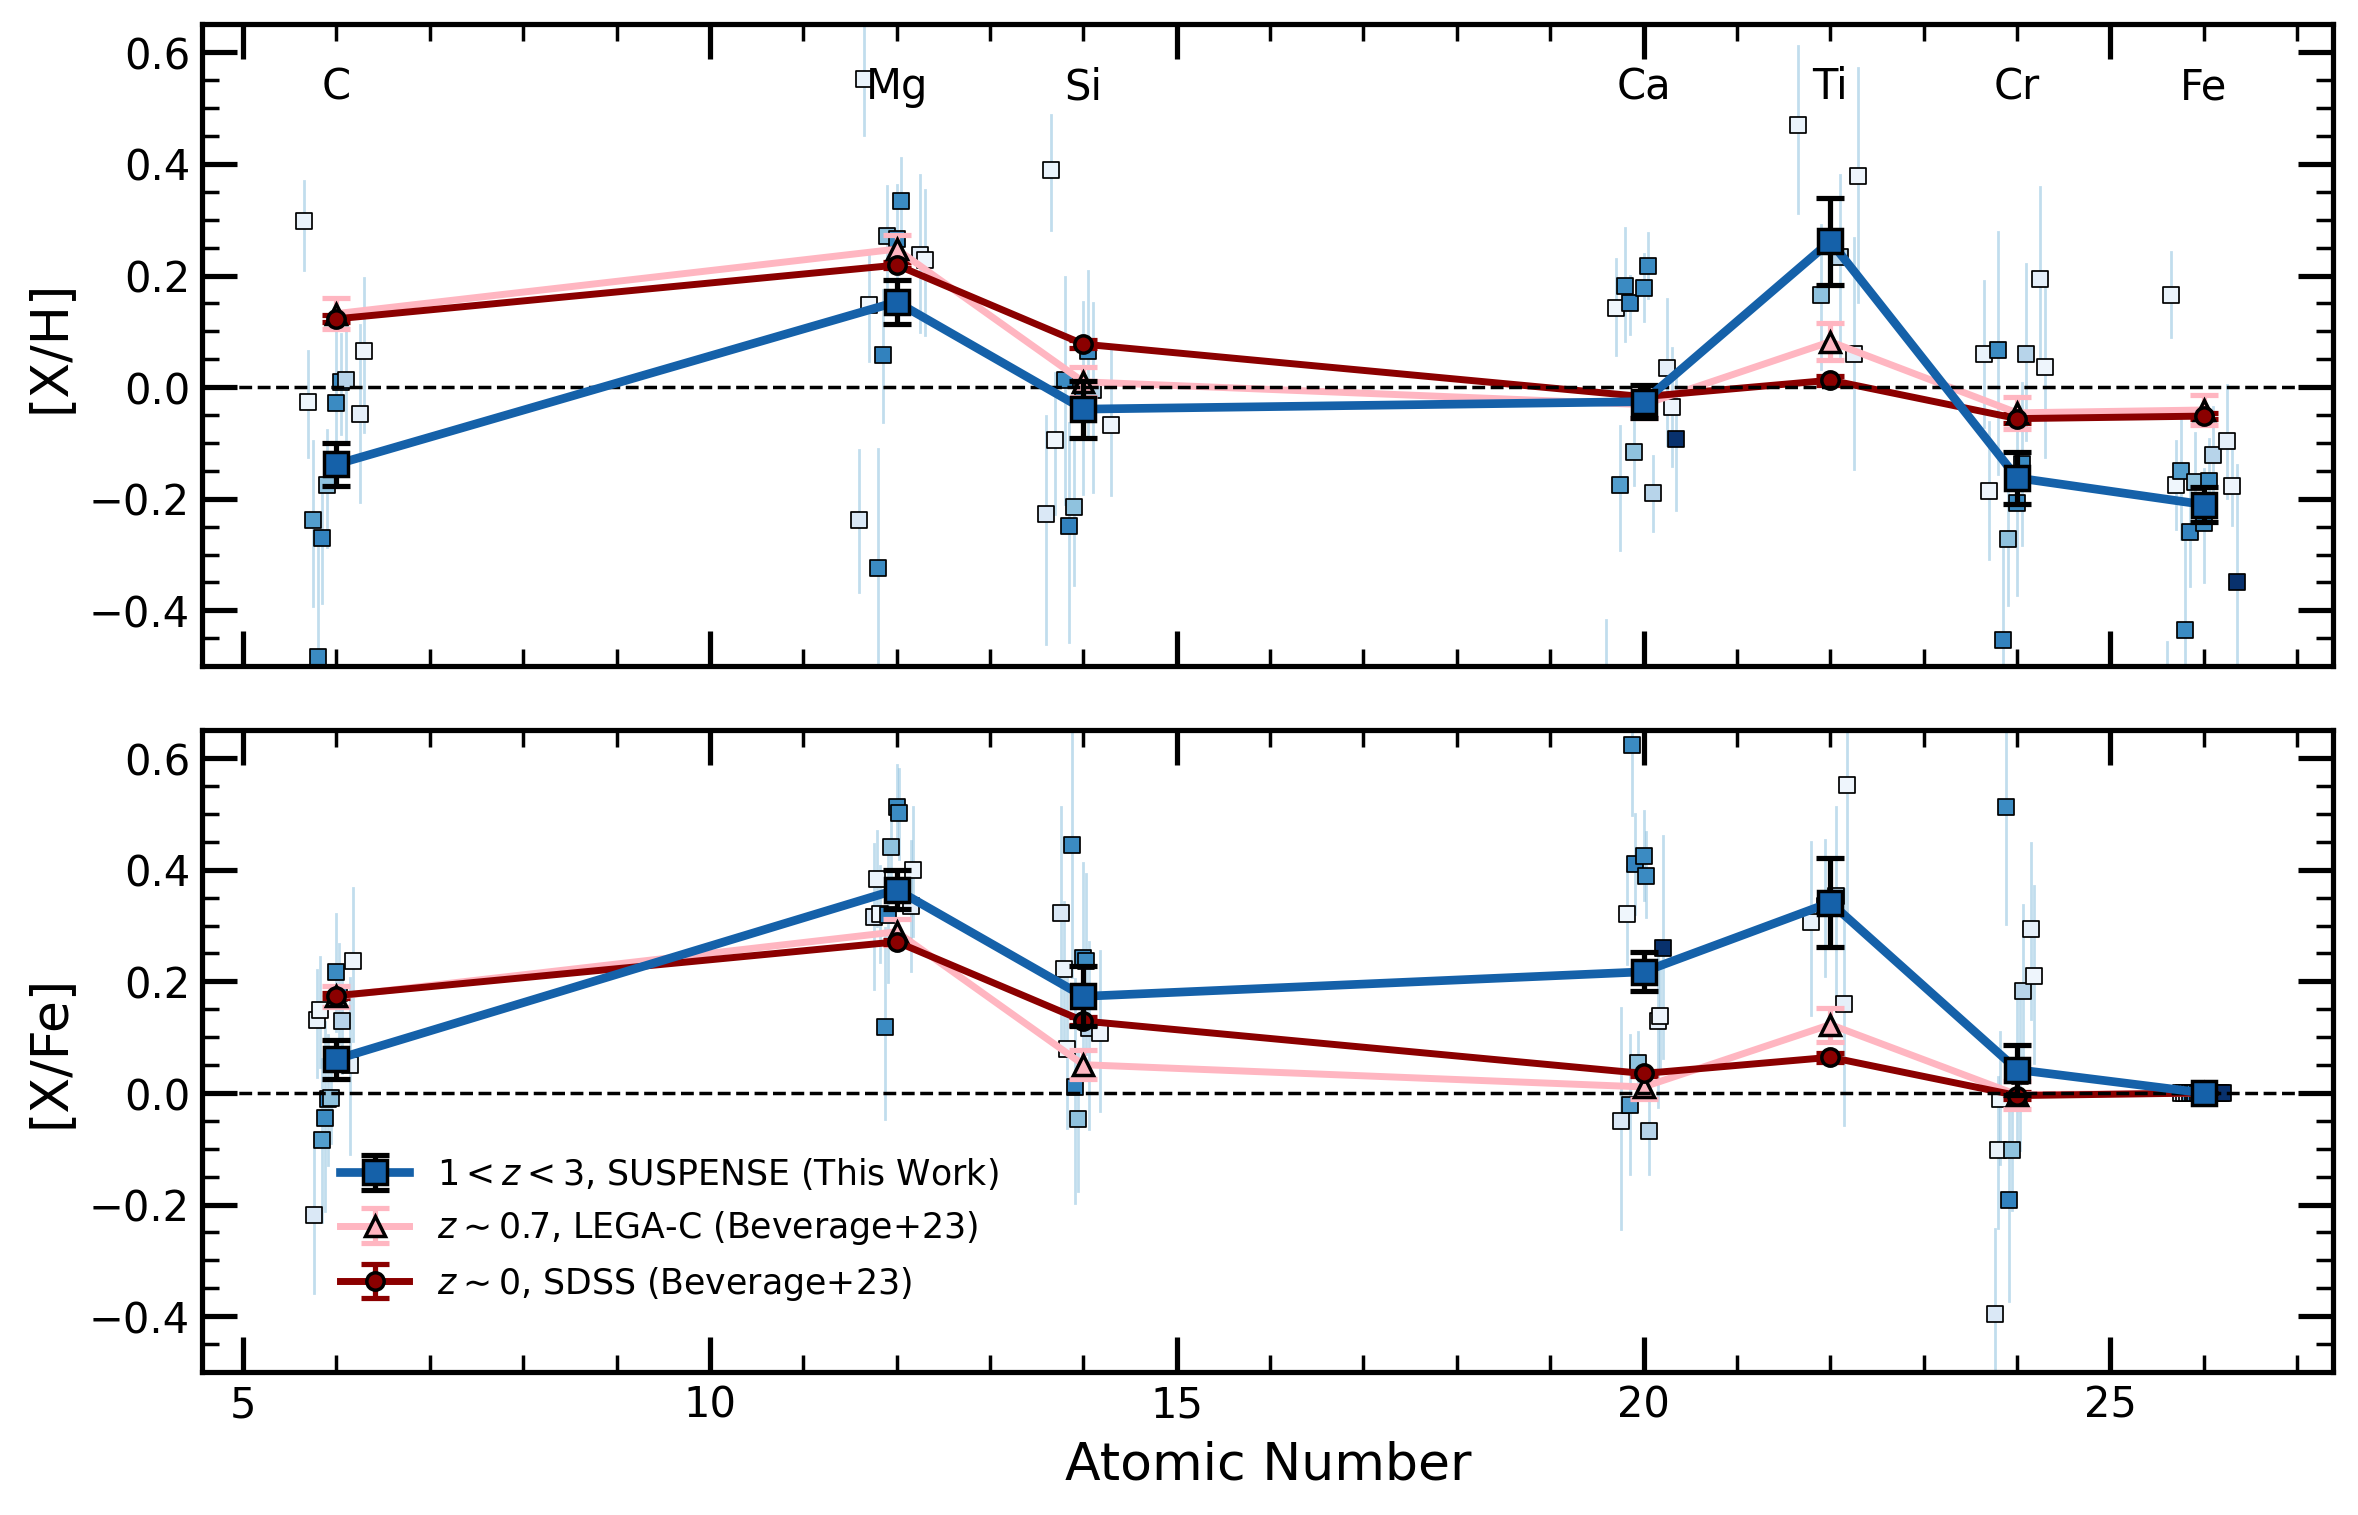
Next, we present the elemental abundance patterns of the SUSPENSE galaxies in Figure 3. We show both the average absolute abundances [X/H] (top panel) and the abundance ratios ([X/Fe], bottom panel). We only include elements for which we have at least five constrained individual measurements; namely C, Mg, Si, Ca, Ti, and Cr, and Fe. The small blue squares represent the individual abundances from SUSPENSE, while the large squares depict the mean of these measurements. The black error bars are calculated by perturbing the abundances of each data point based on their uncertainties and then determining the standard deviation of the resulting mean abundance values. Figure 3 also includes the abundance patterns of (red circles) and quiescent galaxies (pink triangles) from Beverage et al. (2023). These [] results represent the average of thousands [hundreds] of quiescent galaxies from the same velocity dispersion range as the SUSPENSE galaxies (200 – 300 km -1).
In the top panel of Figure 3, we find that distant quiescent galaxies in SUSPENSE have significantly lower [C/H] and [Fe/H] ( certainty) and slightly lower [Mg/H] (1.5) than the galaxies. Specifically, [C/H], [Fe/H], and [Mg/H] are lower by 0.25, 0.16, and 0.07 dex, respectively, than at . Therefore, the [Mg/Fe] enhancement observed in the bottom panel is primarily driven by a deficiency in Fe. Moving on to the other elements, we find that Ca has a similar behavior as Mg, with a mostly constant [Ca/H] across the three redshift regimes, but with enhanced [Ca/Fe] at higher redshift. Ti is unique because the absolute abundance [Ti/H] and abundance ratio [Ti/Fe] increase with increasing redshift. We highlight that high Ti abundances present a long-standing problem in chemical evolution modeling (e.g., Kobayashi et al., 2020). [Cr/H] on the other hand behaves more like Fe and C, with [Cr/H] being lower at . This result is unsurprising given that Cr is typically considered an Fe-peak element. Si shows no significant evolution in either [X/H] or [X/Fe]. Thus, Si behaves more similarly to Mg and Ca. However, the abundance uncertainties on Ti, Si, and Cr are quite large. We note that these abundance results are roughly consistent with the only other existing abundance pattern at , observed in a lensed quiescent galaxy by Jafariyazani et al. (2020). In Section 5.1, we explore the implications of these abundance patterns in the context of chemical enrichment histories.
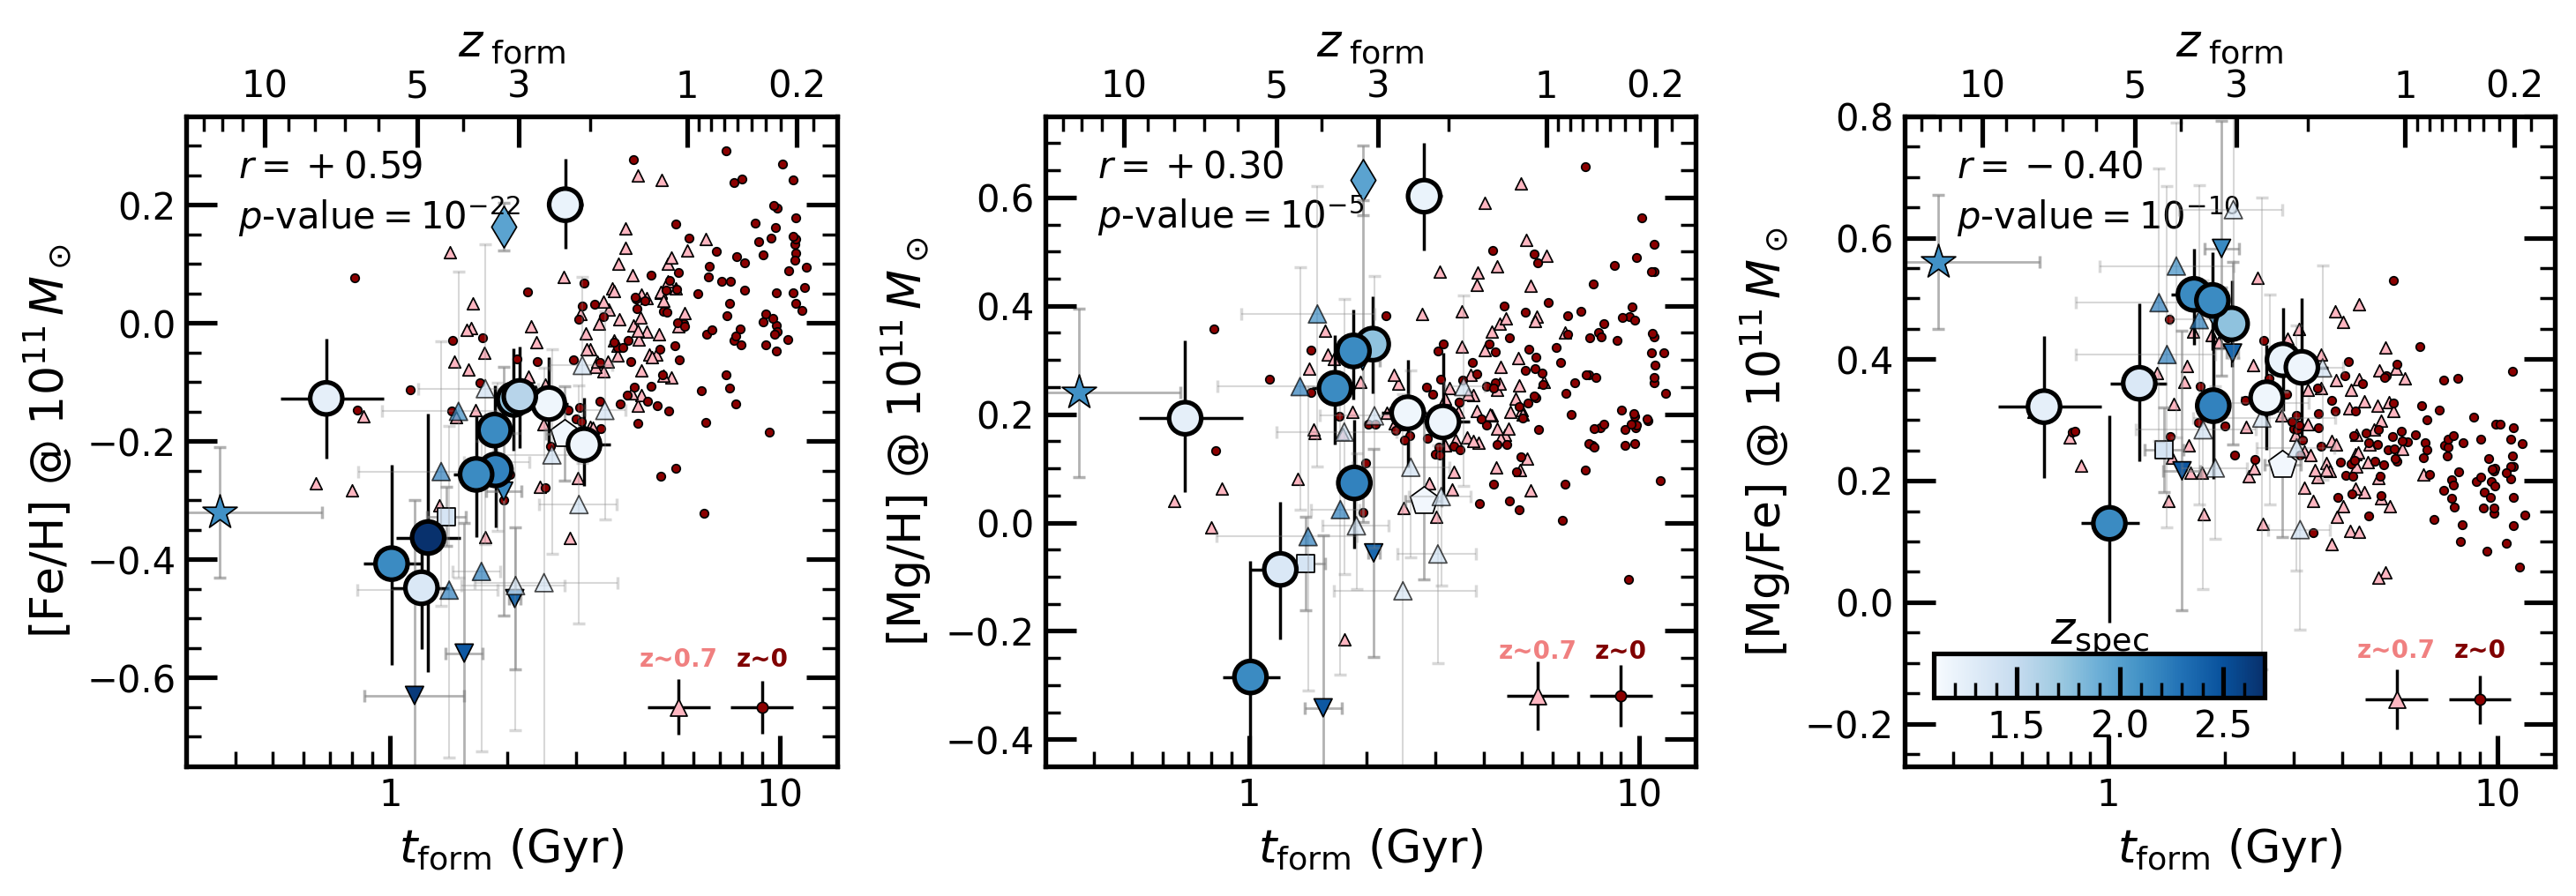
Finally, in Figure 4, we show [Fe/H], [Mg/H], and [Mg/Fe] as a function of formation time, as in Zhuang et al. (2023). In addition to the SUSPENSE sample (blue circles, colored by spectroscopic redshift), we include individual results from massive quiescent galaxies in the SDSS survey from Zhuang et al. (2023, red circles) and LEGA-C from Beverage et al. (2023, pink triangles). In each panel of Figure 4, we remove the first-order dependence on stellar mass by subtracting the SDSS abundance relations from Zhuang et al. (2023) from all galaxies and then scaling them to the value of the abundance relations at . We utilize the Pearson correlation coefficient to assess the degree of correlation between the parameters in Figure 4. We include all points in Figure 4 (at all redshifts) when computing the degree of correlation. The resulting Pearson coefficients and corresponding -values are listed in the top left of each panel. Correlations with -values are considered significant.
At fixed stellar mass, the formation time and [Fe/H] have a significant positive correlation (), with galaxies forming at earlier times having lower Fe enrichment. [Mg/H] shows a moderate positive correlation (), with galaxies forming earlier having slightly lower Mg enrichment. Finally, there is a negative correlation () between [Mg/Fe] and formation time, indicating galaxies that form earlier have slightly higher [Mg/Fe]. These correlations are primarily driven by the large quantity and dynamic range in of abundance measurements and thus agree with the results presented in Zhuang et al. (2023). Therefore, it is striking that the correlations found at lower redshifts are mostly consistent with the data, in the sense that the oldest galaxies at have similar abundance patterns as those at . In Section 5.2, we discuss the implications of these results on the assembly of massive galaxies.
4 The Stellar Mass-Metallicity Relation at
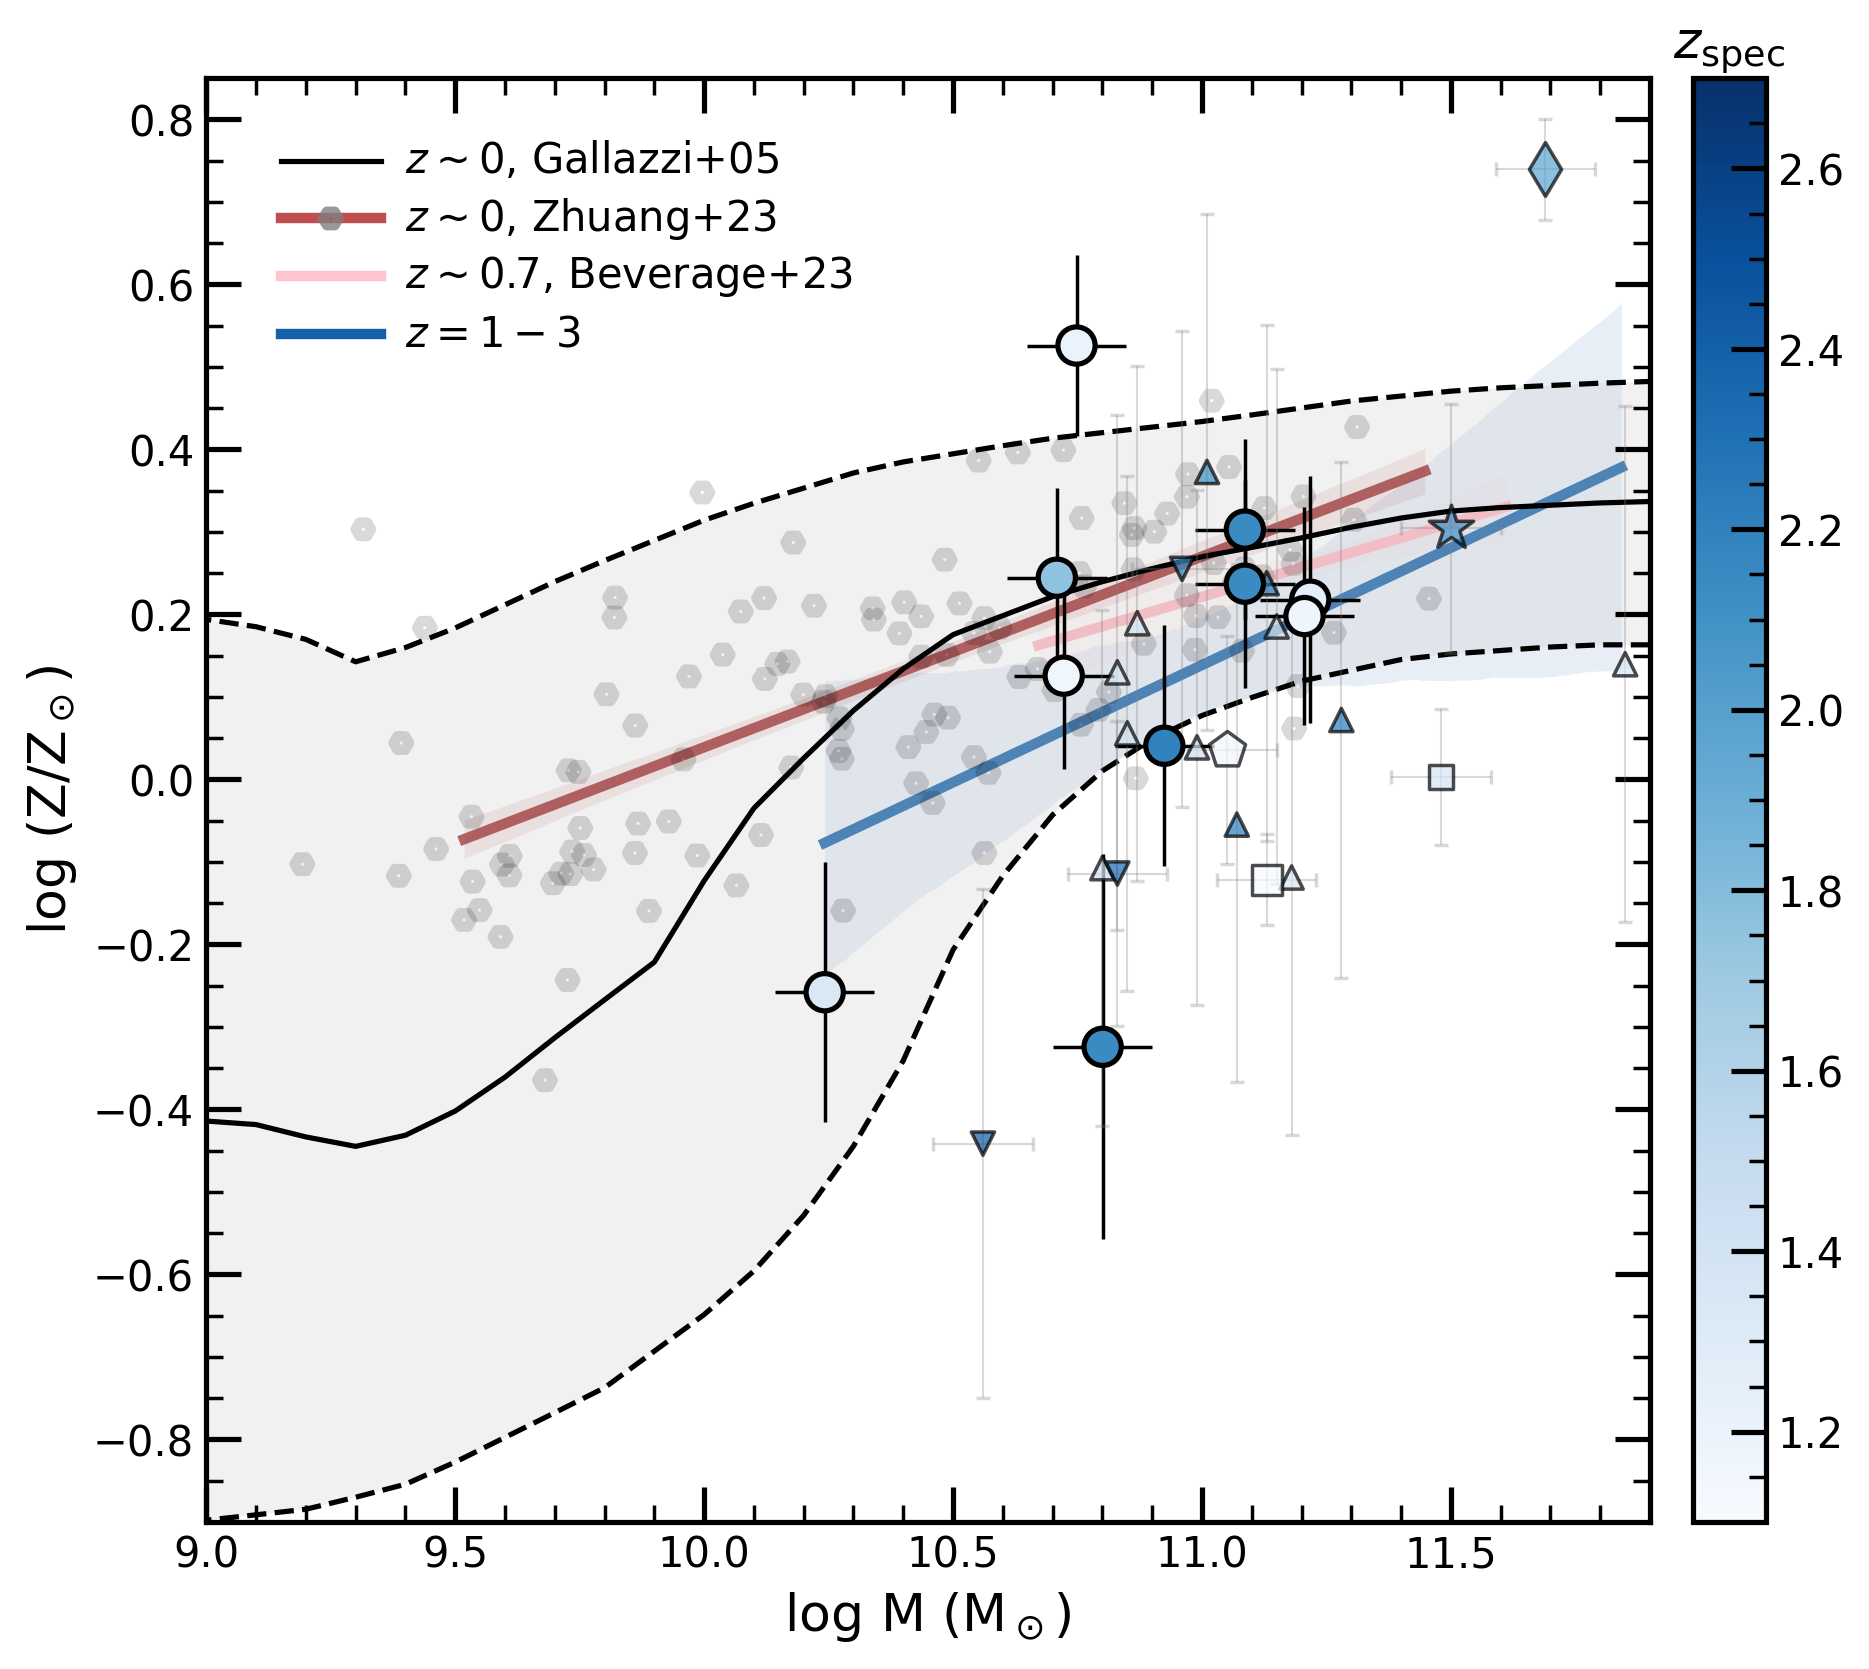
In this section, we present the stellar mass-metallicity relation of quiescent galaxies at . In Figure 5, we show the stellar metallicities of the JWST-SUSPENSE quiescent galaxies as a function of their stellar mass (circles). We compute these metallicities following the calibration [Fe/H][Mg/Fe] from Thomas et al. (2003). As in Figure 2, we include all existing measurements of stellar metallicities derived from full-spectrum fitting at derived using the same full-spectrum fitting method and underlying models. For comparison, we also include the MZR and corresponding 1 scatter from Gallazzi et al. (2005, black line and gray shaded region). Additionally, we show individual measurements for a subsample of these SDSS galaxies from Zhuang et al. (2023, gray hexagons). The Gallazzi et al. (2005) relation was measured using a different method than Zhuang et al. (2023), with different stellar population models, and assuming a different solar abundance pattern. Therefore, we calibrate the Gallazzi et al. (2005) MZR to match the normalization of the Zhuang et al. (2023) measurements by applying a shift of +0.16 dex.
We fit a mass-metallicity relation to all available measurements with a linear regression. The confidence intervals are determined by bootstrap resampling. As before, during the fitting process, we set the lower limit on the error of the metallicity to 0.1 dex so that high S/N measurements do not dominate the fit. We use the same fitting method to re-determine the MZR at (red line) and (pink line) for the Zhuang et al. (2023) and Beverage et al. (2023) samples, respectively. We emphasize again that the individual metallicity measurements at and were made using the same full-spectrum modeling method as the sample.
The best-fit stellar MZRs at each redshift interval correspond to the following relations:
We find the same positive slope (to within error) at all three redshifts. We note that the slope uncertainty is highly uncertain at due to the small sample size and the narrow range of stellar masses. The normalization, however, shows subtle but significant evolution since , with the MZR increasing by 0.15 dex between and .
The small evolution in the MZR is not surprising given that it is dominated by the abundance (70 per cent by mass) and that we find evolution in [Mg/H] (i.e., Figure 3). Even though distant quiescent galaxies are Fe deficient, Fe-peak elements only contribute 10 per cent by mass to the total metallicity. Therefore, the observed offset in the MZR to lower is almost entirely driven by evolution in Mg abundances. We note that the evolution of the MZR is slightly higher than that reported for [Mg/H] in Figure 3 (0.15 vs 0.07 dex). This difference is solely due to Figure 3 only including the 9 [Mg/H] measurements from JWST-SUSPENSE, whereas the MZR measurement uses all [Mg/H] reported in the literature.
Other studies based on Lick indices instead point to a redshift-invariant MZR, with galaxies at having super-solar (Lonoce et al., 2015; Onodera et al., 2015). However, these conclusions are based on individual measurements or a single stacked spectrum, and therefore they carry large uncertainties. Similarly, Estrada-Carpenter et al. (2019) report a redshift-invariant MZR, with stellar metallicities derived from low-resolution spectroscopy. In section 5.4, we compare these methods and demonstrate that metallicities derived from spectrophotometric fitting primarily reflect [Fe/H]. Given the Fe deficiencies found in this work, it is notable that Estrada-Carpenter et al. (2019) find no evolution in the MZR.
5 Discussion & Implications
5.1 Star-formation timescales
In this work, we present the first abundance pattern study (including Fe, C, Mg, Si, Ca, Ti) based on a sample of quiescent galaxies. Jafariyazani et al. (2020) had previously measured an abundance pattern at , but only for a single lensed system, whereas Beverage et al. (2024) measured only the Mg and Fe abundances of a larger sample of quiescent galaxies at and . In this section, we discuss the implication of multi-element abundance results on the star-formation histories of distant quiescent galaxies.
A key observation from Figure 3 was that massive queiscent galaxies at are deficient in Fe and C, whereas Mg, Si, Ca, and Ti have higher abundances. When considering the full ISM enrichment over a stellar population’s lifetime, Fe is forged approximately equally in CC and SNe Ia, whereas C is enriched approximately equally by CC SNe and low-mass AGB stars. The other elements, Mg, Si, Ca, and Ti, are all primarily elements, produced in CC SNe. These processes enrich over a diverse set of timescales; exploding massive stars (CC SNe) eject elements almost instantaneously after the commencement of star formation, swiftly incorporating them into subsequent stellar generations. Alternatively, low- to intermediate-mass stars enrich the ISM on a delayed timescale due to their longer lifespans. One mechanism is via SNe Ia, which typically eject Fe-peak elements (e.g., Cr and Fe) only after a time delay of Gyr. The other mechanism is via AGB stars, which have even shorter delay times than SNe Ia, enriching primarily C (and N) as early as 50 Myr but with a typical delay of Myr (e.g., Cristallo et al., 2011, 2015; Maiolino & Mannucci, 2019; Johnson et al., 2023). Thus, galaxies that stop forming stars before significant AGB and SNe Ia contributions have very low Fe-peak and CN stellar abundances, but still high abundances.
Considering the different enrichment timescales, our low C and Fe abundance results imply that the SUSPENSE galaxies formed most of their stellar mass before significant AGB and Ia SNe enrichment, corresponding to a timescale of Gyr. Such an extreme star-formation timescale would translate to an SFR of , putting these galaxies among the most vigorous star-forming galaxies in the Universe (e.g., Riechers et al., 2013; Decarli et al., 2017; Gullberg et al., 2019; Liao et al., 2024).
Deriving a more exact star-formation timescale from galaxy abundance patterns will require detailed chemical evolution modeling, a task we leave for a future study. Nonetheless, we note that these extreme star-formation timescales are at odds with the results from spectrophotometric fitting using the non-parametric star-formation histories of the SUSPENSE galaxies Slob et al. (2024). In Sections 5.4 and 5.5 we discuss the implications of these differences.
5.2 The assembly of massive galaxies over cosmic time
Our elemental abundance patterns imply that galaxies at on average formed earlier (Section 3) and over shorter timescales (Section 5.1) compared to galaxies with similar velocity dispersions at and . The most straightforward explanation for this observed increase is that galaxies in the quiescent sample at are among the earliest quenchers in the population; galaxies that form over longer timescales quench and join the quiescent galaxy population at later times. Thus, by , the SUSPENSE sample represents only the extreme tail of the distribution. This explanation is akin to the “progenitor bias” scenario (i.e., van Dokkum & Franx, 2001) used, for example, to explain the size growth of quiescent galaxies over time (e.g., Khochfar & Silk, 2006; van Dokkum et al., 2010; Carollo et al., 2013; Poggianti et al., 2013).
This progenitor bias scenario is reinforced by Figure 4, where we find a negative correlation between formation time and [Mg/Fe], irrespective of the observed redshift of the galaxies. Thus, the evolution in C and Fe is mostly due to the lower redshift samples naturally including galaxies with earlier formation times and shorter star-formation timescales.
A closer look at Figure 4, however, reveals that progenitor bias alone may not be able to explain the observations. If the galaxies passively evolve over the past 10 billion years, without merging or experiencing late-time star formation, then the trends with formation time at and should exactly overlap at the earliest epochs. Instead, we find very few SDSS galaxies at these early formation times and we find that the samples exhibit slightly lower [Fe/H] and [Mg/H], and higher [Mg/Fe] than the lower redshift samples. This offset was first identified by Zhuang et al. (2023) using a small sample of objects at , and later confirmed by Beverage et al. (2024) with a larger sample.
One way to explain the lack of chemically extreme galaxies at is late-time star formation episodes. If the star-formation material is pre-enriched with SN Ia products by previous epochs of star formation, then the newly formed stars would be younger, more metal-rich, and more /Fe enhanced, pushing them along the abundance trends of Figure 4 towards younger ages (later formation times). Major mergers between galaxies with different star-formation histories would also shift galaxies upward along the formation time sequence. In contrast, minor mergers tend to decrease not only [Fe/H] but also [Mg/H] levels. However, due to aperture effects, interpreting the impact of minor mergers is more complicated because they are preferentially accreted to the outskirts of galaxies. Therefore, minor mergers likely have minimal influence on the observed abundance patterns. Larger sample sizes at and with careful consideration of stellar mass completeness is required to clarify the relative importance of progenitor bias, mergers, and late-time star formation.
5.3 Galaxy quenching
A key finding from Figure 4 is galaxies that form at earlier epochs have lower [Mg/H]. Unlike the correlation with [Fe/H], this result cannot be explained using star-formation timescales, because [Mg/H] instead reflects instantaneous enrichment by CC SNe.
One possible explanation for galaxies with earlier formation times having slightly lower [Mg/H] is that they expel larger gas reservoirs during the quenching phase. Beverage et al. (2021) proposed this model to explain a similar trend in the LEGA-C sample. They used a leaky box model with exponentially declining inflow rates and SNe-driven outflows, with analytical solutions from Spitoni et al. (2017). In their models, galaxies with smooth star-formation histories that quench via slow gas depletion end up with high stellar [Mg/H] by , regardless of their star-formation history.
The implementation of rapid gas expulsion after two -folding times (akin to AGN-driven feedback), successfully keeps the stellar [Mg/H] low. In these models, galaxies that quenched at higher SFR and thus expel larger gas reservoirs, have lower [Mg/H] and earlier formation times. Thus, the observed correlation between [Mg/H] and may indicate more efficient gas expulsion at higher redshift. These more efficient outflows in combination with progenitor bias, in turn, can explain the increase in [Mg/H] and the MZR over cosmic time.
This result, in combination with the extreme SFRs inferred from the C and Fe deficiencies, is consistent with quasar-driven quenching resulting from rapid gas inflows. Indeed, evidence of ejective AGN outflows has been found in galaxies that rapidly quenched after , indicated by pronounced blueshifted Na I D and other ISM absorption lines (e.g., Maltby et al., 2019; Kubo et al., 2022; Belli et al., 2023; D’Eugenio et al., 2023; Davies et al., 2024; Park et al., 2024). Future chemical evolution modeling will help determine the mass-loading factors and star-formation timescales required to reproduce the trends with .
5.4 SPS fitting
In this section, we compare measurements derived in this work with those obtained using a more standard stellar population modeling approach, which employs solar abundance patterns and non-parametric star-formation histories. Slob et al. (2024) present stellar population parameters for the SUSPENSE galaxies using the Prospector code (Leja et al., 2019a; Johnson et al., 2021). Prospector utilizes the the Flexible Stellar Population Synthesis (FSPS; Conroy et al., 2009; Conroy & Gunn, 2010) library, the MILES spectral library, and the MIST isochrones, assuming a Chabrier (2003) IMF. The fitting process incorporates both JWST spectroscopy and UltraVISTA DR3 photometry. For more details, see Slob et al. (2024).
There are a few key differences between this standard modeling approach and the method used in this work. Firstly, Prospector and similar codes, such as Bagpipes (Carnall et al., 2018), Cigale (Burgarella et al., 2005), and Magphys (da Cunha et al., 2008), assume a solar-scaled abundance pattern (and sometimes ) and the star-formation history (SFH) is a free parameter. Secondly, when fitting both the photometry and spectra, the code heavily relies on the galaxy continuum shape and consequently struggles to reproduce individual absorption features. In contrast, our full-spectrum modeling assumes a variable abundance pattern, a single burst of star formation, and relies solely on the stellar absorption features.
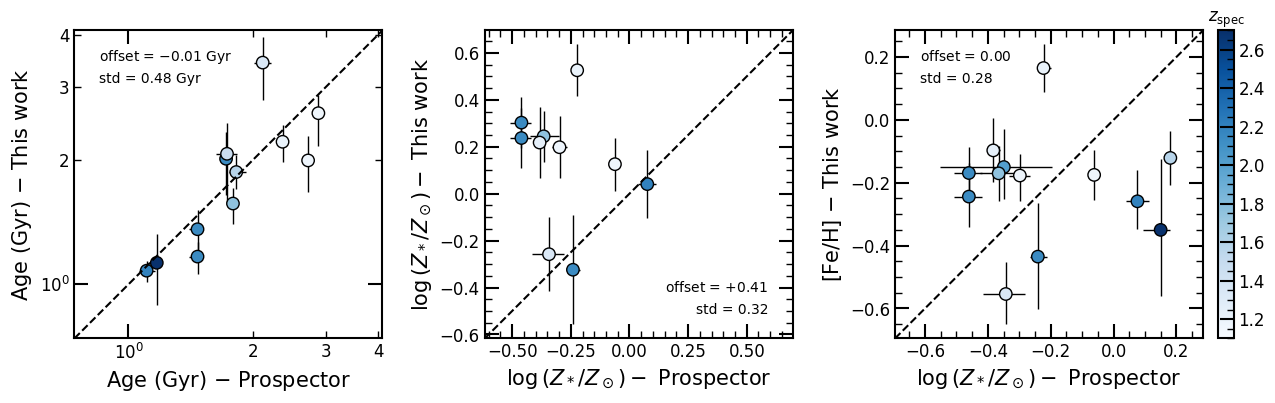
In Figure 6, we compare our best-fit ages and metallicities to those from Prospector. The points are colored by their spectroscopic redshift, and the dashed black lines represent the one-to-one line. The left panel shows stellar ages, where Prospector provides mass-weighted estimates and our full-spectrum fitting gives SSP-equivalent ages. Despite different assumptions in star-formation history (extended non-parametric vs. single age), the two sets of stellar ages agree remarkably well. This result may not be surprising, as all of the galaxies in our sample have been quiescent for at least Gyr. At these older ages, these stellar populations are less susceptible to the outshining problem, wherein the youngest stars with low dominate the continuum.
Next, we examine stellar metallicities in the middle panel of Figure 6, comparing . As a reminder, the total metallicities from this work were computed using a combination of the best-fit [Mg/Fe] and [Fe/H]. We find poor agreement between our total metallicities and those from Prospector, with significant scatter (std = 0.32 dex) and a systematic offset of 0.41 dex towards lower values in the Prospector measurements. When we compare the Prospector metallicities instead to [Fe/H], the systematic offset disappears. However, the large scatter around the one-to-one line remains. Additionally, the uncertainties on the Prospector measurements are significantly underestimated.
The reason the Prospector aligns better with [Fe/H] rather than the total stellar metallicity is that Mg has less impact on the spectral shape compared to Fe (e.g., Choi et al., 2019; Leja et al., 2019c). As discussed in Section 4, despite Fe’s significant contribution to the absorption features in galaxies, it contributes only a small fraction to the total metal content. This effect is even more pronounced in light of the Fe-deficiencies found for the sample. The reason that the Prospector metallicities disagree with this work and have significantly underestimated uncertainties is that the photometry and spectra are fit simultaneously, which means the subtle (but informative) differences in the absorption features carry little weight in the fitting and are not well reproduced. Furthermore, the ingredients of stellar population models still hold their own uncertainties (e.g., implementation of evolved stellar stages), which can result in template mismatches. We investigated whether the dust-age- degeneracy drives the scatter in measurements but found no indication that this is the case.
Therefore, caution is needed when interpreting or assuming metallicities derived from codes using a solar abundance pattern and that put large weight into the shape of the continuum. Such measurements often carry underestimated uncertainty, and, on average, are more likely to reflect the Fe abundance, which is a biased indicator of total metallicity.
Finally, we compare the best-fit SFHs from Prospector to those inferred from the elemental abundances. The typical star-formation timescales from Prospector, which we define as 222where corresponds to the age of the universe at which percent of the stellar mass has been formed, is 1.2 Gyr, a factor of 6 longer than that predicted by the C and Fe deficiencies (200 Myr). These shorter star-formation timescales have direct implications for the build-up of massive galaxies, as discussed in the next section.
5.5 The early formation of massive galaxies
The short star-formation timescales inferred from the abundance patterns may have broader implications for the formation of massive galaxies in the early universe. Recently, JWST identified a population of quiescent and extremely massive galaxies at (Antwi-Danso et al., 2023; de Graaff et al., 2024; Glazebrook et al., 2024; Stawinski et al., 2024; Carnall et al., 2024). The SFHs of these galaxies, derived using Prospector and similar fitting codes, indicate that they begin to accumulate their stellar mass at very early epochs (). It has been suggested that this early stellar mass growth may be in conflict with the predictions of CDM, even when assuming a maximum (100%) baryon-to-star conversion efficiency, highlighting the “impossibly early galaxy problem” (e.g., Steinhardt et al., 2016).
One way to explain this tension is that the SFHs derived from standard modeling techniques are biased towards more extended SFHs. Most of the non-parametric SFHs were intentionally designed to include an early build-up of stellar mass, to solve inconsistencies with lower redshift galaxy evolution studies (Leja et al., 2019a, b; Carnall et al., 2019, 2024). Therefore, these models may not apply to the galaxy population. Carnall et al. (2024) fitted an instantaneous burst of star formation to three massive quiescent galaxies at . In this test, the best-fit stellar ages were consistent with the original fits; however, the initial buildup of stellar mass was delayed. These results show that these early massive galaxies could be explained within the CDM framework by simply shortening the assumed SFHs.
Our elemental abudance results indeed show that standard stellar population modeling codes overestimate the duration of the star-forming phase. Thus, assuming that quiescent galaxies at will have similarly short star formation timescales, the early mass buildup in these massive galaxies may be less problematic than found by earlier studies. As elemental abundance studies will be prohibitively difficult at , our elemental abundance pattern may help set more informative priors on the SFHs in stellar population modeling codes.
6 Summary
In this Paper, we present the stellar metallicities and multi-element abundances (C, Mg, Si, Ca, Ti, Cr, and Fe) of 15 massive quiescent galaxies at from the JWST-SUSPENSE program. The ultradeep (16 hour) NIRSpec/MSA spectra were modeled using the custom full-spectrum fitting code alf, a Python implementation of alf (Conroy et al., 2018), which has been made publicly available.
Compared to the and population of massive quiescent galaxies, those at have 0.25 dex lower [C/H], 0.16 dex lower [Fe/H], and 0.07 dex lower [Mg/H]. The quiescent MZR at is also lower by dex, but the slope of the relation remains constant over time. The C and Fe deficiencies indicate that distant quiescent galaxies form over shorter star-formation timescales than today’s quiescent galaxy population, quenching before significant enrichment by AGB stars and SNe Ia. Such rapid star-formation timescales ( Gyr) correspond to extreme star-formation rates of at , putting these galaxies among the most vigorous star-forming galaxies in the Universe.
We also find correlations between galaxy formation time and [Fe/H], [Mg/H], and [Mg/Fe], such that galaxies that form at earlier times have abundances consistent with shorter star-formation timescales (i.e., higher [Mg/Fe] and lower [Fe/H]). These trends had previously been found within the and populations (Zhuang et al., 2023; Beverage et al., 2023), however, using the results, we show that the same trends extend to higher redshift and earlier formation times. This result suggests that the observed evolution in [C/H] and [Fe/H] over cosmic time is driven by lower redshift samples naturally including galaxies that formed over longer timescales. In other words, the quiescent galaxies represent the extreme tail of today’s massive quiescent galaxy population. Interestingly, the sample lacks the chemically extreme galaxies at , indicating mergers and/or late-time star formation likely contribute to the evolution in the elemental abundances. Larger sample sizes and careful consideration of completeness are required to clarify this picture.
Additionally, we confirm the marginal correlation between [Mg/H] and formation time, suggested by previous results with smaller sample sizes and larger measurement uncertainties (Zhuang et al., 2023; Beverage et al., 2024). Given that Mg is a tracer of instantaneous metal enrichment and not the star-formation timescale, this marginal trend may imply that galaxies that form at earlier times expel larger gas reservoirs during the quenching phase, as suggested previously by Beverage et al. (2021). Combined with the extreme SFRs inferred from the C and Fe deficiencies, this interpretation is consistent with quenching by AGN-driven outflows. In the future, we will use chemical evolution modeling to measure the mass-loading factors and star-formation timescales required to reproduce the trends with .
Next, we compare our stellar ages and metallicities to results from the spectrophotometric modeling code Prospector, which assumes a solar-scaled elemental abundance pattern and a non-parametric SFH. The stellar ages agree remarkably well, but the stellar metallicities disagree significantly. Furthermore, the Prospector metallicities carry vastly underestimated uncertainties. However, despite the large scatter, the Prospector metallicities are in better agreement with [Fe/H], not the total metal content [Z/H]. We attribute this result to solar-scaled models being more sensitive to [Fe/H] because of the strong impact of Fe on the stellar spectrum. Thus, although Fe only contributes approximately 10 per cent by mass to the total metal content of quiescent galaxies, its abundance significantly impacts the optical stellar spectrum. In light of the observed Fe deficiencies and underestimated measurement uncertainties, we therefore emphasize caution when interpreting or assuming metallicities from modeling codes that adopt solar abundance patterns.
Finally, we find that the star-formation timescales indicated by the extreme elemental abundance patterns of distant quiescent galaxies are significantly shorter than those predicted by standard spectrophotometric modeling codes. This discrepancy confirms that the SFHs from these codes may be overly biased towards extended and early stellar mass buildup when applied to distant quiescent galaxies (e.g., Carnall et al., 2019; Leja et al., 2019a, b). Addressing this bias could help mitigate the possible tension with CDM for quiescent galaxies at (see also Carnall et al., 2024). As elemental abundance measurements become prohibitively challenging at , these findings demonstrate how our elemental abundance patterns can provide more informative priors on the SFHs in stellar population modeling codes.
In this Paper, we demonstrate the power of JWST for studying the multi-element abundances of distant quiescent galaxies. In the future, we will combine this expanding multi-element dataset at with chemical evolution modeling, to uncover a more detailed picture of the star-formation histories, quenching, and assembly of massive quiescent galaxies over cosmic time.
This work is based on observations made with the NASA/ESA/CSA James Webb Space Telescope. The data were obtained from the Mikulski Archive for Space Telescopes at the Space Telescope Science Institute, which is operated by the Association of Universities for Research in Astronomy, Inc., under NASA contract NAS 5-03127 for JWST. These observations are associated with program JWST-GO-2110. Support for program JWST-GO-2110 was provided by NASA through a grant from the Space Telescope Science Institute, which is operated by the Association of Universities for Research in Astronomy, Inc., under NASA contract NAS 5-03127. AGB is supported by the National Science Foundation Graduate Research Fellowship Program under grant Nos. DGE 1752814 and DGE 2146752 and by the H2H8 Association and Leids Kerkhoven-Bosscha Fonds. MK acknowledges funding from the Dutch Research Council (NWO) through the award of the Vici grant VI.C.222.047 (project 2010007169). CC acknowledges support from NSF Award 1908748.
The JWST data presented in this article were obtained from the Mikulski Archive for Space Telescopes (MAST) at the Space Telescope Science Institute. The specific observations analyzed can be accessed via https://doi.org/10.17909/6wjp-qb35 (catalog doi: 10.17909/6wjp-qb35)
References
- Akhshik et al. (2023) Akhshik, M., Whitaker, K. E., Leja, J., et al. 2023, The Astrophysical Journal, 943, 179, doi: 10.3847/1538-4357/aca677
- Antwi-Danso et al. (2023) Antwi-Danso, J., Papovich, C., Esdaile, J., et al. 2023, The FENIKS Survey: Spectroscopic Confirmation of Massive Quiescent Galaxies at z ~ 3-5, arXiv. http://arxiv.org/abs/2307.09590
- Asplund (2009) Asplund, M. 2009, Annual Review of Astronomy and Astrophysics, 47, 481
- Barone et al. (2022) Barone, T. M., D’Eugenio, F., Scott, N., et al. 2022, Monthly Notices of the Royal Astronomical Society, 512, 3828, doi: 10.1093/mnras/stac705
- Belli et al. (2023) Belli, S., Park, M., Davies, R. L., et al. 2023, doi: 10.48550/ARXIV.2308.05795
- Beverage et al. (2021) Beverage, A. G., Kriek, M., Conroy, C., et al. 2021, The Astrophysical Journal Letters, 917, L1, doi: 10.3847/2041-8213/ac12cd
- Beverage et al. (2023) —. 2023, The Astrophysical Journal, 948, 140, doi: 10.3847/1538-4357/acc176
- Beverage et al. (2024) Beverage, A. G., Kriek, M., Suess, K. A., et al. 2024, The Astrophysical Journal, 966, 234, doi: 10.3847/1538-4357/ad372d
- Burgarella et al. (2005) Burgarella, D., Buat, V., & Iglesias-Páramo, J. 2005, Monthly Notices of the Royal Astronomical Society, 360, 1413, doi: 10.1111/j.1365-2966.2005.09131.x
- Carnall et al. (2019) Carnall, A. C., Leja, J., Johnson, B. D., et al. 2019, The Astrophysical Journal, 873, 44, doi: 10.3847/1538-4357/ab04a2
- Carnall et al. (2018) Carnall, A. C., McLure, R. J., Dunlop, J. S., & Davé, R. 2018, Monthly Notices of the Royal Astronomical Society, 480, 4379, doi: 10.1093/mnras/sty2169
- Carnall et al. (2022) Carnall, A. C., McLure, R. J., Dunlop, J. S., et al. 2022, The Astrophysical Journal, 929, 131, doi: 10.3847/1538-4357/ac5b62
- Carnall et al. (2024) Carnall, A. C., Cullen, F., McLure, R. J., et al. 2024, doi: 10.48550/ARXIV.2405.02242
- Carollo et al. (2013) Carollo, C. M., Bschorr, T. J., Renzini, A., et al. 2013, The Astrophysical Journal, 773, 112, doi: 10.1088/0004-637X/773/2/112
- Chabrier (2003) Chabrier, G. 2003, Publications of the Astronomical Society of the Pacific, 115, 763, doi: 10.1086/376392
- Choi et al. (2019) Choi, J., Conroy, C., & Johnson, B. D. 2019, The Astrophysical Journal, 872, 136, doi: 10.3847/1538-4357/aaff67
- Choi et al. (2014) Choi, J., Conroy, C., Moustakas, J., et al. 2014, The Astrophysical Journal, 792, 95, doi: 10.1088/0004-637X/792/2/95
- Choi et al. (2016) Choi, J., Dotter, A., Conroy, C., et al. 2016, The Astrophysical Journal, 823, 102, doi: 10.3847/0004-637X/823/2/102
- Conroy et al. (2014) Conroy, C., Graves, G. J., & van Dokkum, P. G. 2014, The Astrophysical Journal, 780, 33, doi: 10.1088/0004-637X/780/1/33
- Conroy & Gunn (2010) Conroy, C., & Gunn, J. E. 2010, The Astrophysical Journal, 712, 833, doi: 10.1088/0004-637X/712/2/833
- Conroy et al. (2009) Conroy, C., Gunn, J. E., & White, M. 2009, The Astrophysical Journal, 699, 486, doi: 10.1088/0004-637X/699/1/486
- Conroy & van Dokkum (2012) Conroy, C., & van Dokkum, P. 2012, The Astrophysical Journal, 747, 69, doi: 10.1088/0004-637X/747/1/69
- Conroy et al. (2018) Conroy, C., Villaume, A., van Dokkum, P., & Lind, K. 2018, The Astrophysical Journal, 854, 139, doi: 10.3847/1538-4357/aaab49
- Cristallo et al. (2015) Cristallo, S., Straniero, O., Piersanti, L., & Gobrecht, D. 2015, The Astrophysical Journal Supplement Series, 219, 40, doi: 10.1088/0067-0049/219/2/40
- Cristallo et al. (2011) Cristallo, S., Piersanti, L., Straniero, O., et al. 2011, The Astrophysical Journal Supplement Series, 197, 17, doi: 10.1088/0067-0049/197/2/17
- Curti et al. (2024) Curti, M., Maiolino, R., Curtis-Lake, E., et al. 2024, Astronomy & Astrophysics, 684, A75, doi: 10.1051/0004-6361/202346698
- da Cunha et al. (2008) da Cunha, E., Charlot, S., & Elbaz, D. 2008, Monthly Notices of the Royal Astronomical Society, 388, 1595, doi: 10.1111/j.1365-2966.2008.13535.x
- Davies et al. (2024) Davies, R. L., Belli, S., Park, M., et al. 2024, Monthly Notices of the Royal Astronomical Society, 528, 4976, doi: 10.1093/mnras/stae327
- De Graaff et al. (2024) De Graaff, A., Rix, H.-W., Carniani, S., et al. 2024, Astronomy & Astrophysics, 684, A87, doi: 10.1051/0004-6361/202347755
- de Graaff et al. (2024) de Graaff, A., Setton, D. J., Brammer, G., et al. 2024, doi: 10.48550/ARXIV.2404.05683
- Decarli et al. (2017) Decarli, R., Walter, F., Venemans, B. P., et al. 2017, Nature, 545, 457, doi: 10.1038/nature22358
- D’Eugenio et al. (2023) D’Eugenio, F., Perez-Gonzalez, P., Maiolino, R., et al. 2023, doi: 10.48550/ARXIV.2308.06317
- Estrada-Carpenter et al. (2019) Estrada-Carpenter, V., Papovich, C., Momcheva, I., et al. 2019, The Astrophysical Journal, 870, 133, doi: 10.3847/1538-4357/aaf22e
- Gallazzi et al. (2014) Gallazzi, A., Bell, E. F., Zibetti, S., Brinchmann, J., & Kelson, D. D. 2014, The Astrophysical Journal, 788, 72, doi: 10.1088/0004-637X/788/1/72
- Gallazzi et al. (2005) Gallazzi, A., Charlot, S., Brinchmann, J., White, S. D. M., & Tremonti, C. A. 2005, Monthly Notices of the Royal Astronomical Society, 362, 41, doi: 10.1111/j.1365-2966.2005.09321.x
- Glazebrook et al. (2024) Glazebrook, K., Nanayakkara, T., Schreiber, C., et al. 2024, Nature, 628, 277, doi: 10.1038/s41586-024-07191-9
- Gullberg et al. (2019) Gullberg, B., Smail, I., Swinbank, A. M., et al. 2019, Monthly Notices of the Royal Astronomical Society, 490, 4956, doi: 10.1093/mnras/stz2835
- Jafariyazani et al. (2024) Jafariyazani, M., Newman, A. B., Mobasher, B., et al. 2024, doi: 10.48550/ARXIV.2406.03549
- Jafariyazani et al. (2020) —. 2020, The Astrophysical Journal, 897, L42, doi: 10.3847/2041-8213/aba11c
- Johnson et al. (2021) Johnson, B. D., Leja, J., Conroy, C., & Speagle, J. S. 2021, The Astrophysical Journal Supplement Series, 254, 22, doi: 10.3847/1538-4365/abef67
- Johnson et al. (2023) Johnson, J. W., Weinberg, D. H., Vincenzo, F., Bird, J. C., & Griffith, E. J. 2023, Monthly Notices of the Royal Astronomical Society, 520, 782, doi: 10.1093/mnras/stad057
- Khochfar & Silk (2006) Khochfar, S., & Silk, J. 2006, The Astrophysical Journal, 648, L21, doi: 10.1086/507768
- Kirby et al. (2013) Kirby, E. N., Cohen, J. G., Guhathakurta, P., et al. 2013, The Astrophysical Journal, 779, 102, doi: 10.1088/0004-637X/779/2/102
- Kobayashi et al. (2020) Kobayashi, C., Karakas, A. I., & Lugaro, M. 2020, The Astrophysical Journal, 900, 179, doi: 10.3847/1538-4357/abae65
- Kriek et al. (2016) Kriek, M., Conroy, C., van Dokkum, P. G., et al. 2016, Nature, 540, 248, doi: 10.1038/nature20570
- Kriek et al. (2019) Kriek, M., Price, S. H., Conroy, C., et al. 2019, The Astrophysical Journal, 880, L31, doi: 10.3847/2041-8213/ab2e75
- Kriek et al. (2024) Kriek, M., Beverage, A. G., Price, S. H., et al. 2024, The Astrophysical Journal, 966, 36, doi: 10.3847/1538-4357/ad2df9
- Kroupa (2001) Kroupa, P. 2001, Monthly Notices of the Royal Astronomical Society, 322, 231, doi: 10.1046/j.1365-8711.2001.04022.x
- Kubo et al. (2022) Kubo, M., Umehata, H., Matsuda, Y., et al. 2022, ApJ, 935, 89, doi: 10.3847/1538-4357/ac7f2d
- Langeroodi et al. (2023) Langeroodi, D., Hjorth, J., Chen, W., et al. 2023, The Astrophysical Journal, 957, 39, doi: 10.3847/1538-4357/acdbc1
- Leja et al. (2019a) Leja, J., Carnall, A. C., Johnson, B. D., Conroy, C., & Speagle, J. S. 2019a, The Astrophysical Journal, 876, 3, doi: 10.3847/1538-4357/ab133c
- Leja et al. (2019b) Leja, J., Tacchella, S., & Conroy, C. 2019b, The Astrophysical Journal, 880, L9, doi: 10.3847/2041-8213/ab2f8c
- Leja et al. (2019c) Leja, J., Johnson, B. D., Conroy, C., et al. 2019c, The Astrophysical Journal, 877, 140, doi: 10.3847/1538-4357/ab1d5a
- Lequeux et al. (1979) Lequeux, J., Peimbert, M., Reyo, J., Serrano, A., & Torres-Peimbert, S. 1979, Astronomy & Astrophysics, 500, 145. http://articles.adsabs.harvard.edu/pdf/1979A%26A....80..155L
- Liao et al. (2024) Liao, C.-L., Chen, C.-C., Wang, W.-H., et al. 2024, The Astrophysical Journal, 961, 226, doi: 10.3847/1538-4357/ad148c
- Lonoce et al. (2015) Lonoce, I., Longhetti, M., Maraston, C., et al. 2015, Monthly Notices of the Royal Astronomical Society, 454, 3912, doi: 10.1093/mnras/stv2150
- Maiolino & Mannucci (2019) Maiolino, R., & Mannucci, F. 2019, The Astronomy and Astrophysics Review, 27, 3, doi: 10.1007/s00159-018-0112-2
- Maiolino et al. (2008) Maiolino, R., Nagao, T., Grazian, A., et al. 2008, Astronomy & Astrophysics, 488, 463, doi: 10.1051/0004-6361:200809678
- Maltby et al. (2019) Maltby, D. T., Almaini, O., McLure, R. J., et al. 2019, Monthly Notices of the Royal Astronomical Society, 489, 1139, doi: 10.1093/mnras/stz2211
- Man et al. (2021) Man, A. W. S., Zabl, J., Brammer, G. B., et al. 2021, The Astrophysical Journal, 919, 20, doi: 10.3847/1538-4357/ac0ae3
- Maoz et al. (2010) Maoz, D., Sharon, K., & Avishay Gal-Yam. 2010, The Astrophysical Journal, 722, 1879, doi: 10.1088/0004-637X/722/2/1879
- Morishita et al. (2018) Morishita, T., Abramson, L. E., Treu, T., et al. 2018, The Astrophysical Journal, 856, L4, doi: 10.3847/2041-8213/aab493
- Muzzin et al. (2013a) Muzzin, A., Marchesini, D., Stefanon, M., et al. 2013a, The Astrophysical Journal Supplement Series, 206, 8, doi: 10.1088/0067-0049/206/1/8
- Muzzin et al. (2013b) —. 2013b, The Astrophysical Journal, 777, 18, doi: 10.1088/0004-637X/777/1/18
- Nakajima et al. (2023) Nakajima, K., Ouchi, M., Isobe, Y., et al. 2023, The Astrophysical Journal Supplement Series, 269, 33, doi: 10.3847/1538-4365/acd556
- Onodera et al. (2015) Onodera, M., Carollo, C. M., Renzini, A., et al. 2015, The Astrophysical Journal, 808, 161, doi: 10.1088/0004-637X/808/2/161
- Papovich et al. (2022) Papovich, C., Simons, R. C., Estrada-Carpenter, V., et al. 2022, The Astrophysical Journal, 937, 22, doi: 10.3847/1538-4357/ac8058
- Park et al. (2024) Park, M., Belli, S., Conroy, C., et al. 2024, doi: 10.48550/ARXIV.2404.17945
- Poggianti et al. (2013) Poggianti, B. M., Moretti, A., Calvi, R., et al. 2013, The Astrophysical Journal, 777, 125, doi: 10.1088/0004-637X/777/2/125
- Riechers et al. (2013) Riechers, D. A., Bradford, C. M., Clements, D. L., et al. 2013, Nature, 496, 329, doi: 10.1038/nature12050
- Sanchez-Blazquez et al. (2006) Sanchez-Blazquez, P., Peletier, R. F., Jimenez-Vicente, J., et al. 2006, Monthly Notices of the Royal Astronomical Society, 371, 703, doi: 10.1111/j.1365-2966.2006.10699.x
- Sanders et al. (2020) Sanders, R. L., Shapley, A. E., Reddy, N. A., et al. 2020, Monthly Notices of the Royal Astronomical Society, 491, 1427, doi: 10.1093/mnras/stz3032
- Sanders et al. (2021) Sanders, R. L., Shapley, A. E., Jones, T., et al. 2021, The Astrophysical Journal, 914, 19, doi: 10.3847/1538-4357/abf4c1
- Saracco et al. (2023) Saracco, P., Barbera, F. L., De Propris, R., et al. 2023, Monthly Notices of the Royal Astronomical Society, 520, 3027, doi: 10.1093/mnras/stad241
- Shapley et al. (2023) Shapley, A. E., Reddy, N. A., Sanders, R. L., Topping, M. W., & Brammer, G. B. 2023, The Astrophysical Journal Letters, 950, L1, doi: 10.3847/2041-8213/acd939
- Slob et al. (2024) Slob, M., Kriek, M., Beverage, A. G., et al. 2024, The JWST-SUSPENSE Ultradeep Spectroscopic Program: Survey Overview and Star-Formation Histories of Quiescent Galaxies at 1 < z < 3, arXiv. http://arxiv.org/abs/2404.12432
- Speagle (2020) Speagle, J. S. 2020, Monthly Notices of the Royal Astronomical Society, 493, 3132, doi: 10.1093/mnras/staa278
- Spitoni et al. (2017) Spitoni, E., Vincenzo, F., & Matteucci, F. 2017, Astronomy & Astrophysics, 599, A6, doi: 10.1051/0004-6361/201629745
- Stawinski et al. (2024) Stawinski, S. M. U., Cooper, M. C., Forrest, B., et al. 2024, doi: 10.48550/ARXIV.2404.16036
- Steinhardt et al. (2016) Steinhardt, C. L., Capak, P., Masters, D., & Speagle, J. S. 2016, The Astrophysical Journal, 824, 21, doi: 10.3847/0004-637X/824/1/21
- Suess et al. (2022) Suess, K. A., Kriek, M., Bezanson, R., et al. 2022, The Astrophysical Journal, 926, 89, doi: 10.3847/1538-4357/ac404a
- Thomas et al. (2003) Thomas, D., Maraston, C., & Bender, R. 2003, Monthly Notices of the Royal Astronomical Society, 339, 897, doi: 10.1046/j.1365-8711.2003.06248.x
- Tremonti et al. (2004) Tremonti, C. A., Heckman, T. M., Kauffmann, G., et al. 2004, The Astrophysical Journal, 613, 898, doi: 10.1086/423264
- van Dokkum & Franx (2001) van Dokkum, P. G., & Franx, M. 2001, The Astrophysical Journal, 553, 90, doi: 10.1086/320645
- van Dokkum et al. (2010) van Dokkum, P. G., Whitaker, K. E., Brammer, G., et al. 2010, The Astrophysical Journal, 709, 1018, doi: 10.1088/0004-637X/709/2/1018
- Villaume et al. (2017) Villaume, A., Conroy, C., Johnson, B., et al. 2017, The Astrophysical Journal Supplement Series, 230, 23, doi: 10.3847/1538-4365/aa72ed
- Weinberg et al. (2019) Weinberg, D. H., Holtzman, J. A., Hasselquist, S., et al. 2019, The Astrophysical Journal, 874, 102, doi: 10.3847/1538-4357/ab07c7
- Zahid et al. (2013) Zahid, H. J., Geller, M. J., Kewley, L. J., et al. 2013, The Astrophysical Journal, 771, L19, doi: 10.1088/2041-8205/771/2/L19
- Zhuang et al. (2023) Zhuang, Z., Leethochawalit, N., Kirby, E. N., et al. 2023, The Astrophysical Journal, 948, 132, doi: 10.3847/1538-4357/acc79b