reprint, superscriptaddress, amsmath, amssymb, aps, prl, floatfix revtex4-2
Emerging supersolidity from a polariton condensate in a photonic crystal waveguide
Abstract
A supersolid is a counter-intuitive phase of matter where its constituent particles are arranged into a crystalline structure, yet they are free to flow without friction. This requires the particles to share a global macroscopic phase while being able to reduce their total energy by spontaneous, spatial self-organisation. This exotic state of matter has been achieved in different systems using Bose-Einstein condensates coupled to cavities, possessing spin-orbit coupling, or dipolar interactions. Here we provide experimental evidence of a new implementation of the supersolid phase in a novel non-equilibrium context based on exciton-polaritons condensed in a topologically non-trivial, bound-in-the-continuum state with exceptionally low losses. We measure the density modulation of the polaritonic state indicating the breaking of translational symmetry with a remarkable precision of a few parts in a thousand. Direct access to the phase of the wavefunction allows us to additionally measure the local coherence of the superfluid component. We demonstrate the potential of our synthetic photonic material to host phonon dynamics and a multimode excitation spectrum.
The existence of a supersolid phase of matter, combining a crystalline structure with superfluid properties, was speculated more than 50 years ago PhysRev.106.161, 1969JETP...29.1107A, PhysRevLett.25.1543, 1971JETP...32.1191K, THOULESS1969403, GROSS195857 however only recently there have been convincing experimental evidence, mainly using ultracold atomic Bose-Einstein condensates (BECs) coupled to electromagnetic fields. There, various guises of the supersolid were created using atoms coupled to high-finesse cavities leonard.nature.2017, gopalakrishnan.nphys.2009, guo.nature.2021, with large magnetic dipole moments tanzi.nature.2019, tanzi.science.2021, PhysRevLett.122.130405, PhysRevX.9.021012, bottcher.prx.2019, klaus.nphys.2022, guo.nature.2019, bottcher.prx.2019, and spin-orbit-coupled, two-component systems showing stripe phases li.nature.2017, putra.PhysRevLett.124.053605.
At the mean field level, supersolidity can be interpreted as two-mode condensation; after condensation in the first, a second mode becomes energetically available by tuning of interactions or an external electromagnetic field and can then be dynamically populated. In a single-mode BEC, the U(1) symmetry related to its phase is broken at the condensation phase transition, giving rise to superfluidity in the system. The mean field wavefunction has momentum, giving a constant density in space. Supersolidity arises, in most cases, as an additional, macroscopic occupation of one (or more) finite-momentum modes of the system leading to breaking of translational symmetry. The occupation is preceded by the presence of a roton-like minimum in the excitation spectrum that can be dynamically populated when its energy is tuned to be equal to that of the stationary ground state chomaz.nphys.2018, PhysRevA.90.063624, PhysRevLett.114.105301. The new mean field wavefunction acquires therefore density modulations with a given length scale and a macroscopic phase relation, giving rise to an extra U(1) symmetry breaking. A change in the relative phase of the two condensates corresponds to a rigid translation of the density pattern associated to a Goldstone mode of the system wouters.goldstone.PhysRevA.76.043807. A gapped Higgs mode is also present, corresponding to a change in the amplitude of the density modulation leonard.science.aan2608.
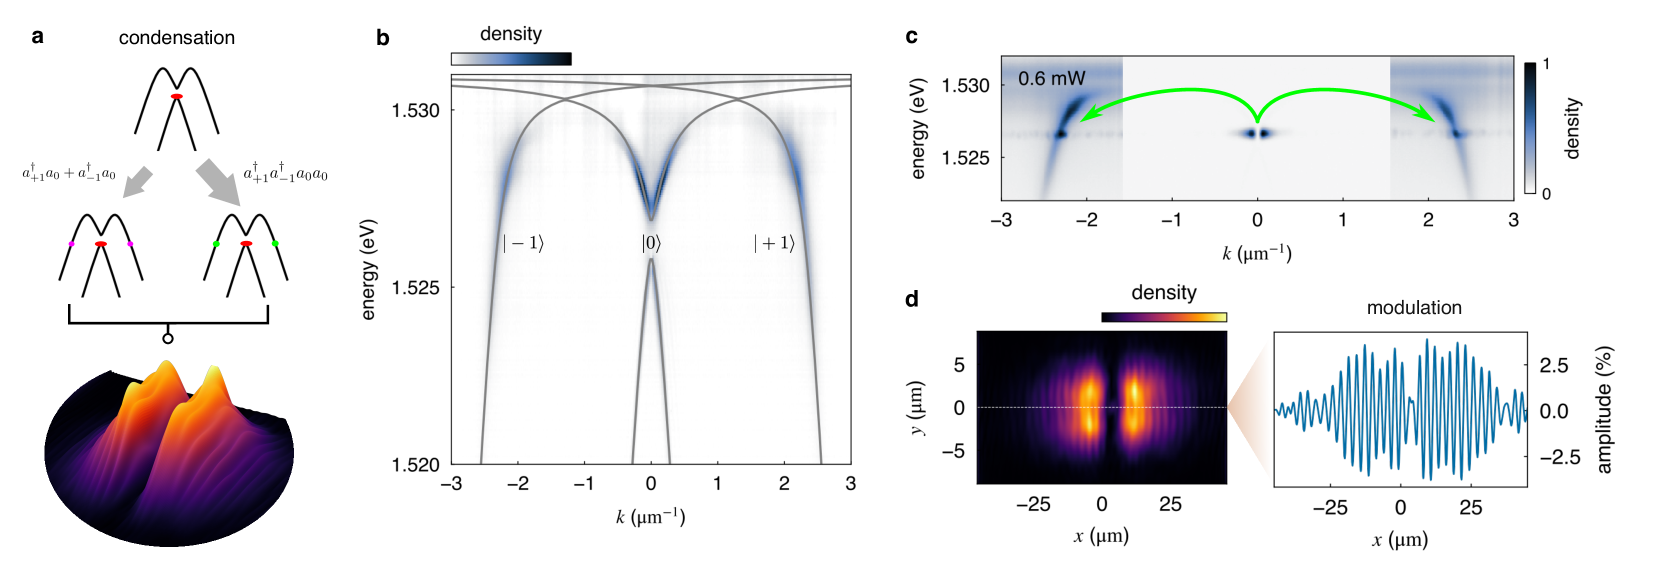
However, despite all the progress in understanding the physics of the supersolid phase, most current realisations are limited to ultracold atomic systems. Here we demonstrate a new photonic platform that can give rise to a supersolid phase in a novel driven-dissipative context and is poised to open new directions for the study of these intriguing phases of matter. We use a BEC of polaritons, i.e., strongly coupled light-matter excitations, formed in a sub-wavelength, patterned waveguide that gives rise to a condensate at a saddle point of the dispersion ardizzonePolaritonBoseEinstein2022, kasprzak_boseeinstein_2006, carusotto_quantum_2013, amo_superfluidity_2009, sanvitto_all-optical_2011. Under some mode-folding conditions and exciton-photon detuning, the photonic crystal waveguide shows two extra modes symmetrically distributed in with respect to the BEC at , with the same polarisation. This allows for the formation of energy-degenerate, optical parametric oscillation (OPO) between the condensate and the adjacent modes, which can be described in terms of polariton-polariton interactions arising from a nonlinearity. Parametric processes are commonplace in nonlinear photonics and can exhibit pattern formation close to threshold in multimode systems pattern.formation.PhysRevLett.83.5278, ardizzone2013.scientific.reports. However, differently from our results, they are usually induced resonantly which imposes the coherence of the pump laser on the wavefunction whittaker_polariton_2017, romanelli_four_2007, lewandowski_polarization_2016. Recently, the onset of a non-resonantly-driven, energy-degenerate parametric scattering was demonstrated in different systems wu_nonlinear_2021, sawicki_polariton_2021, PhysRevB.87.155302, doi:10.1021/acs.nanolett.1c04800, PhysRevB.107.L060303, PhysRevLett.108.166401 showing how these scattering processes are ubiquitous; however, no proof of coherence nor pattern formation was reported. Here, instead, we used a -point, symmetry protected, bound-in-the-continuum (BiC) state formed at the lower branch of the anticrossing ardizzonePolaritonBoseEinstein2022, gianfrateReconfigurableQuantumFluid2024, which led to a few crucial advantages: (1) a vanishing linewidth due to the supression of losses on the photonic component, which reduces both the condensation threshold and the incoherently scattered background, and does not overwhelm the emission from other modes in the system, (2) a negative effective mass, which makes the component self-localised, and (3) absence of accessible lower-energy extrema in the dispersion where particles can accumulate; as such, the OPO is adequately described by a three-branch iso-energetic model. These striking properties of the BiC render the small density modulation of the BEC clearly visible.
I Formation of the density modulation
We prepared a polariton BEC, using off-resonant, pulsed excitation, at the lower branch of an anticrossing formed by folding the propagating modes of the one-dimensional waveguide to using a sub-wavelength, etched grating. The corresponding wavevector sets the size of the irreducible Brillouin zone, which is much larger than all other characteristic length scales of the system, and lies outside our numerical aperture (see Methods). Aside from the BiC, which corresponds to the anti-crossing of the left- and right-propagating TE0 modes, the waveguide supports also TE1 modes with the mode spacing determined by the planar waveguide thickness and index contrast, which are responsible for the formation of the modulation. The off-resonant pumping predominantly populates the BiC due to its negative effective mass riminucciPolaritonCondensationGapConfined2023, nigro.PhysRevB.108.085305. It is important to note that the TE1 modes are populated by some incoherent population relaxing from the exciton reservoir, however they can also become macroscopically populated via linear and in particular nonlinear coupling with the TE0 (Fig. 1a).
The mode-spacing sets the natural unit of length for our system to be , so we can write the four basis states as for , where the sign labels the propagation direction of the relevant photonic dispersion branch. The TE0 modes are coupled with a Rabi frequency of \qty1.5meV, and the BiC corresponds to the lowest energy adiabatic state that has zero group velocity, with an energy . We will from now on limit the description to the three states to simplify notation. The single-particle dispersion shown in Fig. 1b is measured below threshold since the formation of the BEC dominates the luminescence above threshold and renders the rest of the dispersion scarcely visible. The BEC is visible in the dispersion at the -point, slightly blueshifted from the bare dispersion due to intrinsic polariton-polariton interactions, Fig. 1c ardizzonePolaritonBoseEinstein2022. The excitonic Hopfield coefficient at the BiC energy is estimated to be 0.54 for and 0.4 for , due to their different mode structure that leads to them coupling to the exciton with different Rabi frequencies.
We will assume, in what follows, no linear coupling between TE0 and TE1 modes. i.e. the off-diagonal element in the hamiltonian (see SI). When the population of becomes large enough, parametric scattering driven by a four-polariton interaction term of the form , where are bosonic operators, results in emission of polariton pairs that populate the states at finite momentum according to energy and momentum conservation criteria. The and states are commonly referred to as pump, signal, and idler modes in optical parametric processes. Since the interaction term is invariant to the transformation , with wouters.PhysRevA.76.043807, it has U(1) symmetry which is spontaneously broken at OPO threshold. At the same time the OPO breaks translational symmetry, due to it being energy-degenerate, which leads to the appearance of a density modulation on top of the condensate carusotto.PhysRevB.72.125335.
Thanks to the small radiative coupling of the BiC with the far field, the luminescence of the BEC is strongly suppressed at , showing the characteristic two-lobe structure with a phase jump between them (Fig. 1d). This is essentially due to the co- and counter-propagating TE0 modes being out of phase at as they Bragg scatter from the grating; the propagation into the far field leads to the characteristic nodal line at the centre of the BEC. The density modulation, indicating the translational symmetry breaking of the supersolid, is visible atop both lobes of the BEC, which are extended in reciprocal space and outside the laser spot in coordinate space. Its amplitude is shown in Fig. 1e to be 2.6%. The modulation pattern extends over lattices sites, where is the effective waist of the BEC. The presence of the modulation on top of the BEC is a clear sign of crystallisation: the observation of a periodic pattern, similar to the formation of crystals, despite the system otherwise still being in the superfluid regime.
The density in Fig. 1d is the integrated emission over approximately pulses exciting the sample at a rate of \qty80MHz, much slower than the lifetime of the BEC (of the order of a few hundred picoseconds); as such, each measurement is an average of multiple independent BEC implementations. The dynamical behaviour of the optical parametric process near- and above-threshold can be simply described by a multibranch Hamiltonian involving three modes PhysRevB.87.155302, langbein.PhysRevB.70.205301, ciuti.PhysRevB.63.041303. The single-mode solution becomes unstable with increasing power and a three-mode solution becomes the ground state of the system dunnett.PhysRevB.98.165307, PhysRevB.87.155302.
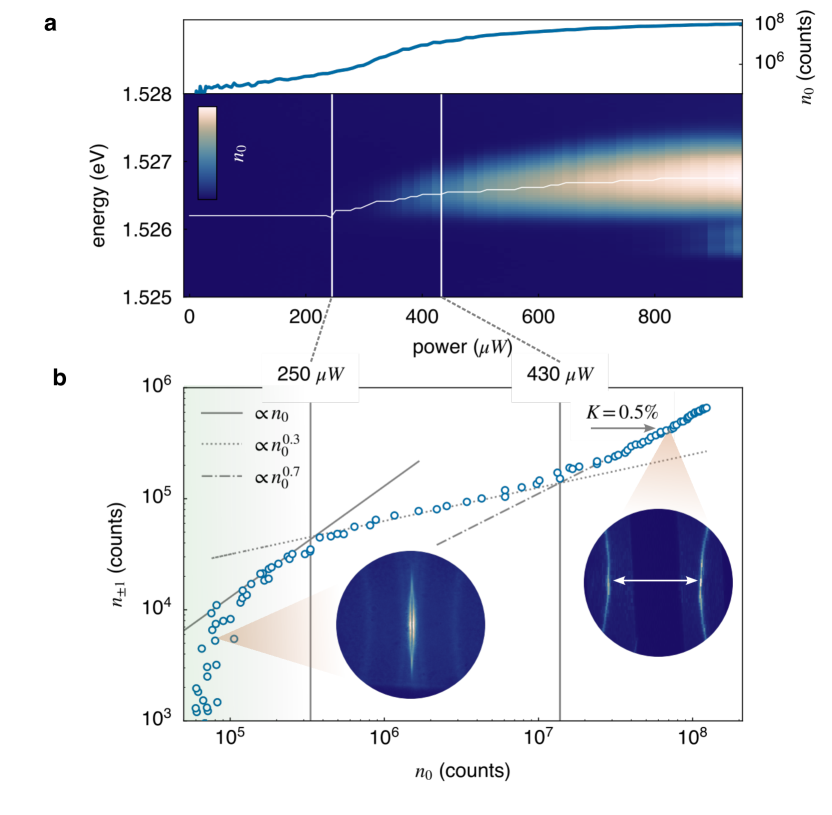
Figure 2a shows that condensation takes place at around \qty0.3mW of pump power. The luminescence and linewidth of the BEC dramatically increase above threshold due to the pulsed excitation. Since our system is trapped, it supports multiple confined modes; the first excited mode enters in the gap around \qty0.8mW, and can be clearly seen in Fig. 2a at lower energies than the main, blueshifted BEC riminucciPolaritonCondensationGapConfined2023. Figure 2b shows the growth of the densities versus , showing approximate linear growth below BEC threshold. This suggests that at low excitation power, the emission is dominated by incoherent photoluminescence coming from the exciton reservoir. The mode is populated much more efficiently and starts to experience sublinear growth above threshold. At roughly \qty430μW, the efficiency of the scattering process increases indicating that nonlinear scattering is taking place. In this region the states, that are uniformly populated in reciprocal space for low pump powers, become structured showing conjugate scattered pairs (see insets of Fig. 2b) and the density modulation becomes even more evident in coordinate space.
Our ability to observe the density modulation comes from the small linear coupling present in the system. Since the states are not empty when the OPO process establishes, but are populated by the exciton reservoir or via Rayleigh scattering, even a small amount of linear coupling contributes towards fixing the phase of the density modulation and as such renders it visible in time-integrated emission. The linear coupling is equivalent to including two-operator exchange terms of the form in the hamiltonian, which make it not invariant under the phase transformation discussed above; formally the OPO tends to break the U(1) symmetry in a non fully spontaneous manner because of this. Well above the OPO threshold the nonlinear scattering dominates and a degree of phase freedom is recovered. To show this we consider the ratio , which is effectively the Bragg signal corresponding to a given modulation amplitude, and scales as , where is the structure factor for a sinusoidal modulation. For our observed density modulation, this gives an expected Bragg signal of 0.02%, more than an order of magnitude smaller than the measured 0.5%. Moreover, we note that (1) the phase of the modulation varies in the transverse direction by about a rotation, as seen in Fig. 1d, and (2) the average phase in continuous-wave excitation fluctuates predominantly at the density maxima (see discussion in SI). These observations indicate underlying phase fluctuations related to the OPO that are averaged out during an integrated measurement and effectively reduce the visibility of the density modulation. Analogous effects exist in atomic supersolids, where the phase of the modulation is fixed by the presence of an external trapping potential, yet small phase variations could still be observed, e.g. in dipolar supersolids PhysRevLett.122.130405. We note the linear coupling term alone does not fix the phase of the modulation as discussed for spin-orbit-coupled systems li.yun.PhysRevLett.108.225301, geier.PhysRevLett.130.156001. Such effects are inherent in finite-size systems, however they have not prevented the observation of well-behaved collective excitation spectra tanzi.nature.2019, tanzi.science.2021. Importantly, our system can recover full phase freedom in a much simpler manner, i.e. by engineering the dispersion so that .
II Local and global coherence
Having shown the behaviour of the populations undergoing parametric scattering, it is interesting to see how the diagonal and off-diagonal phase coherence is established. We use interferometric measurements to fully capture the microscopic, spatial coherence of the system, which serves as a direct proof that the fragile local and long-range order of the solid and superfluid parts is preserved. The strength of using an all-optical system in this regard is in the ease of access to the first-order spatial correlator, , due to our ability to measure the full wavefunction of the BEC using off-axis holography (see Methods). Direct, local measurements of the first-order coherence show the wavefunction to be fully coherent above threshold with a modulated coherence amplitude locally correlated with the emerging supersolid crystalline structure. The superfluid character of our bulk BEC on the BiC state has already been characterised through the observation of a linear Bogoliubov excitation spectrum nina_collective_2023, and as such, here we take the observed increase in the coherence length (Fig. 3a) to be indicative of an increased superfluid fraction.
Figure 3a shows the increase with power of normalised to its maximum. Below threshold only the the zero-time-space auto-correlator has appreciable amplitude. At \qty∼250μW, the onset of polariton condensation, the coherence length starts increasing at a rate of \qty133μm/mW. The fast spatial oscillations that appear in have an amplitude of 1.5% and are in phase with the density modulations, showing how coherence locally drops in regions of lower density of the crystalline solid PhysRevLett.25.1543 (see Fig. 3a).

The emergence of the global, diagonal and off-diagonal long-range order can be quantified by measuring at , where is the spatial Fourier transform along and the quantity in the brackets is the output of the interferometer (see SI). The magnitude of the component is a measure of the amplitude of the density modulation arising from the phase coherence between the three BEC components. Similarly, the component corresponding to the wavevector of the interferogram fringes, , captures the phase coherence of the component. We denote these quantities as and respectively. The relative increase of against , above threshold pump power, (see Fig. 3b) is similar to the behaviour of against shown in Fig. 2b. Below the condensation threshold, is largely dominated by noise since the crystalline pattern has not formed yet, then it slowly rises up to the OPO threshold where it begins to increase sharply. In absence of linear coupling this would indicate a two-step breaking of the superfluid U(1) and translational symmetries; in our case the density modulation increasing is a clear signature that the OPO process is established.
III Non-rigidity of the modulation
An important aspect of the study of quantum many-body systems is understanding their collective excitations; they dictate the dynamics of the system and its response to external perturbations. In order to be able to observe and manipulate the collective modes, the quantum system needs to be allowed to spontaneously break the relevant symmetry during a phase transition, without external or intrinsic factors that influence this choice. For example, in single-mode, high-finesse cavity realisations of the supersolid phase the wavelength of the modulation is fixed by the wavelength of the relevant cavity mode, implying that the phononic branch corresponding to the Goldstone mode cannot be observed leonard.science.aan2608. In such systems, excitations at finite are suppressed due to the infinite range of the coupling. This means that the global translation mode at exists, but the local compression/dilation motion of the fringes occurring at finite is not observable; such phonon dynamics can be captured with multimode cavities or in stripe phases of spin-orbit-coupled systems, as well as dipolar systems due to the translational invariance of the interactions in those systems guo.nature.2021, li.nature.2017, geier.PhysRevLett.130.156001. In our case, the symmetry breaking results from short range polariton-polariton interactions, we therefore expect similar behaviour to the latter systems.
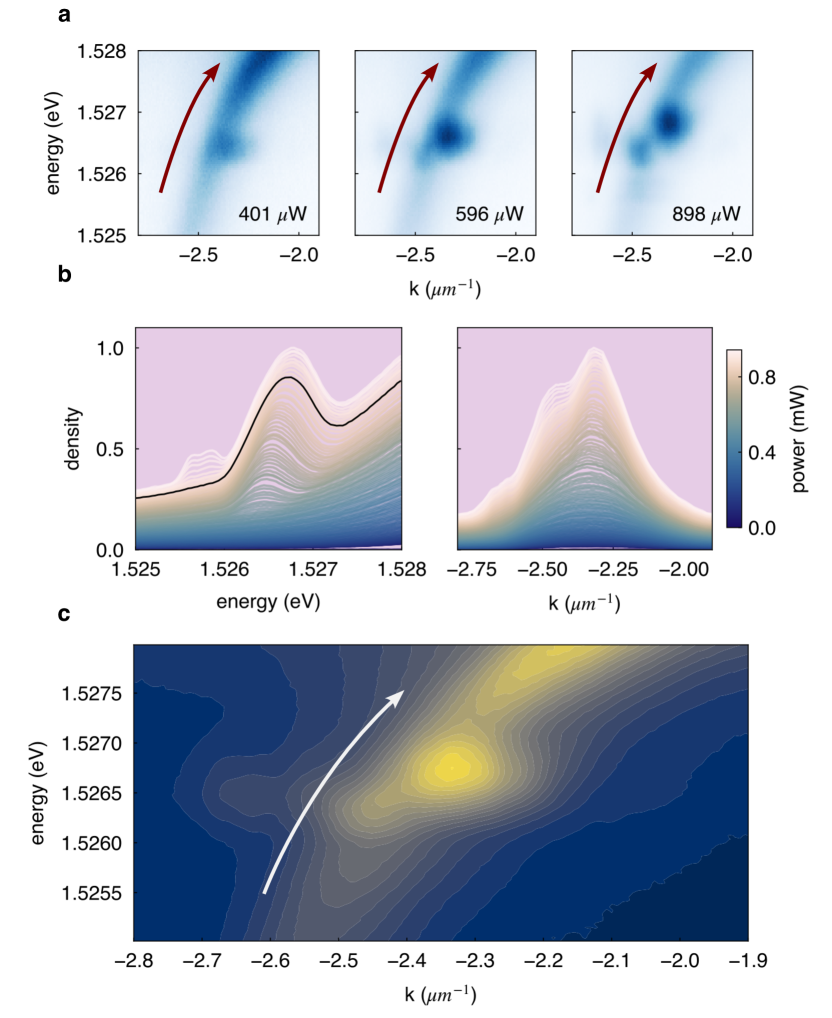
The parametric scattering process is constrained to occur on the available modes where the density of states is different from zero. This fixes the wavenumber of to . However the value of depends on polariton-polariton interactions and their resulting blueshift. As the interactions blueshift the energy of the BEC, and since OPO is a iso-energetic process, the energy of has to shift as well, and this is done by shifting their wavevector inwards. This shift is nonlinear due to the strong-coupling of the photonic modes to the exciton, which leads to an increased curvature at energies closer to the exciton resonance. The energy of , associated with the breaking of translational symmetry, increases by 0.35 meV as the pump power increases (Fig. 4a); the linewidth of the TE1 mode is about \qty500μeV. For the same range of pump powers shifts by \qty0.04\microm^-1 (Fig. 4b, c). As such, the wavevector of the density modulation is not fixed, but depends on both the single-particle and manybody parameters of the system, reminiscent of a non-rigid, roton-like behaviour.
IV Discussion and outlook
We demonstrated evidence of a supersolid state of matter in a polaritonic system which is a novel and flexible platform for the investigation of the physics of supersolid systems. To place our work more generally in the context of supersolids, as observed mainly in ultracold atomic systems, we experimentally addressed its characteristics in coordinate and reciprocal space, its diagonal and off-diagonal long range order, and its interaction-dependent behaviour. Our supersolid state is formed using an iso-energetic OPO process to spontaneously break the translation symmetry of a non-resonant polaritonic superfluid. We stress that this is a novel mechanismg for the creation of a supersolid, particular of the driven-dissipatve context of non-equilibrium polariton systems, and not simply a photonic analogue of mechanisms demonstrated in atomic platforms. The analysis of the parametrically scattered light indicates that the system condenses at a given threshold and OPO activates at higher powers. Theoretically, we also expect the existence of two dictinct transition points.
By exploiting the richness of engineering opportunities in these photonic crystal systems it is possible to eliminate completely the linear coupling between the modes, for example using TE- and TM-polarised modes. This will enable us to observe full phase freedom of the density modulation either in single-shot experiments or higher-order coherence functions carusotto.PhysRevB.72.125335, folling.spatial.coherence.nature.2005. Near and above threshold the statistics of the emitted light changes to bunched leading to an increase in density-density correlations that are peaked at threshold, similar to a resonantly pumped OPO ardizzone_bunching_2012. A spatially dependent will show signatures of density modulation since it is only sensitive to how polaritons at relative distances are correlated.
Since the spacing of the crystalline modulation is not rigid but influenced by short range polariton interactions, the low-lying excitation spectrum of the supersolid should reveal the two phononic Goldstone branches resulting from the symmetries involved. The observation of such spectrum is a natural next step in the investigation of the supersolid properties. As a further development of this research, increasing the dimensionality of the system, we expect additional breaking of discrete rotational symmetries to occur, as well as the proliferation and dynamics of stochastic vortices pomeau.PhysRevLett.72.2426. Moving beyond parametric scattering, similar effects have been suggested utilising coupling to indirect excitons to engineer long-range, dipolar interactions that can lead to crystallisation under compression boning.PhysRevB.84.075130, or using Bose-Fermi mixtures where excitons are coupled to an electron gas PhysRevLett.108.060401.
V Methods
Sample. The sample used in these experiments is an AlGaAs waweguide grown with molecular beam epitaxy. It has twelve 20 nm embedded GaAs quantum wells with a heavy hole excitonic transition at \qty1531.1(0.1)\milli. The propagating modes are folded within the lightcone by inscribing a unidirectional grating within the structure with a lattice parameter corresponding to a wavevector translation of . The energy momentum dispersion therefore consists of two counterpropagating TE0 modes forming an anticrossing at , \qty2.4meV blue detuned with respect to the excitonic transition and a couple of symmetric TE1 modes located at from the TE0 modes. The filling factor of such grating is 76% in order to spatially overlap the two and ensure the coupling described by the term in the Supplemental information responsible of the opening of the BiC gap. Due to the confinement, the strong coupling regime with a Rabi frequency of 5.6 and 4.2 meV is achieved between the excitonic transition and the propagating TE0 and TE1 modes respectively. The fabrication details of the grating etching can be found in riminucci_nanostructured_2022.
Laser excitation scheme. The sample is held in an attoDRY closed loop helium cryostat at a temperature \qty≈4 in order to avoid exciton ionisation. The waveguide is non-resonantly excited in reflection configuration using an \qty80MHz repetition rate, \qty100 tunable laser. The polarisation is chosen to be parallel to the grating corrugation direction, and the energy is set at \qty1.61\milli. The excitation beam is focused into a \qty3.90(0.03)\micro spot through a NA = 0.68 aspheric objective, at the centre of the etched structure.
Interferometric measurements. The photoluminescence collected by the objective is sent into a Michelson interferometer through the detection line. In one of the two arms the image is centro-symmetrically flipped along and using a backreflector and the coordinate-space photoluminescence distribution re-focused onto the spectrometer slits through the same optical path. The total magnification of the line, sample-to-camera, is approximately 72.6. The two arms are synchronised and balanced, optimising the visibility of the interference pattern of the excitation laser reflected from the sample surface.
Reciprocal space measurements For the reciprocal space images, a similar detection line is used, but the interferometer is bypassed. A 4f-system collects the reciprocal plane and focuses it onto the monochromator slits, resulting in a total magnification of the objective back focal plane equal to 1.66.
Coherence calculation. The two-point correlator , where are the fields from the two interferometer arms, is proportional to the visibility of the interferometric fringes, where () is the upper (lower) envelope of the interferogram; we omit the dependence for brevity. We calculate by first extracting the and components of the interferogram by appropriate filtering in the reciprocal space and then using the Hilbert transform to calculate the envelope of the ac component; the visibility is then simply the envelope over the component. For slight imbalance or not full reflection symmetry between the two images, needs to be rescaled by , where are the intensities in each arm of the interferometer, to give a correctly normalised . We forgo this normalisation since small misalignments of the order of in the overlap of the two images distorts the density modulation. This does not significantly alter the form of since in our case this prefactor is .
Acknowledgements. We acknowledge fruitful discussions with V. Ardizzone, M. Pieczarka, and A. Recati. We are thankful to G. Lerario for his valuable feedback on the manuscript. This project was funded by the Italian Ministry of University (MUR) PRIN project “Interacting Photons in Polariton Circuits” – INPhoPOL (grant 2017P9FJBS); the project “Hardware implementation of a polariton neural network for neuromorphic computing” – Joint Bilateral Agreement CNR-RFBR (Russian Foundation for Basic Research) – Triennal Program 2021–2023; the MAECI project “Novel photonic platform for neuromorphic computing”, Joint Bilateral Project Italia - Polonia 2022-2023; the PNRR MUR project: “National Quantum Science and Technology Institute” - NQSTI (PE0000023) co-funded by the European Union - NextGeneration EU; the Apulia Region, project “Progetto Tecnopolo per la Medicina di precisione”, Tecnomed 2 (grant number: Deliberazione della Giunta Regionale n. 2117 del 21/11/2018); the PRIN project “QNoRM: A quantum neuromorphic recognition machine of quantum states” - (grant 20229J8Z4P). This research has been cofunded by the European Union - NextGeneration EU, “Integrated infrastructure initiative in Photonic and Quantum Sciences” - I-PHOQS [IR0000016, ID D2B8D520, CUP B53C22001750006]. IC acknowledges funding from the Provincia Autonoma di Trento, partly via the Q@TN initiative. This research is funded in part by the Gordon and Betty Moore Foundation’s EPiQS Initiative, grant GBMF9615 to L.P., and by the National Science Foundation MRSEC grant DMR 2011750 to Princeton University. Work at the Molecular Foundry is supported by the Office of Science, Office of Basic Energy Sciences, of the U.S. Department of Energy under Contract No. DE-AC02-05CH11231. We thank Scott Dhuey for assistance with electron beam lithography and Paolo Cazzato for the technical support.
Competing interests. The authors declare no competing interests.
Data Availability. The data of this study is available from the corresponding author upon reasonable request.
Author contributions. DT and ML conceived the experiment and convinced DS to go ahead with it. AG took the data and together with DT performed the analysis. DT, AG and ML wrote the manuscript. DN, DG, and IC provided theoretical support. FR processed the sample; growth was performed by KB and LP. DS supervised the work, discussed the data, and tirelessly explained to DT how polariton OPOs should behave. DT tried to use the best photonics language he could muster but in the end had to use kets. All authors contributed to discussions and editing of the manuscript.
References
Supplementary Information
I Dispersion of the waveguide
The particle-number-conserving part of the system Hamiltonian can be written as a matrix
| (S1) |
which is represented on the basis comprising the four TE0 and TE1 co- and counter-propagating modes and the exciton which couples independently to left- and right-propagating modes of different momenta. Here we take the energy of the bare exciton resonance as a reference, i.e., we set it to zero. The linear dispersions of the modes , where , , act as effective detunings that are identical up to a translation in ; is the photonic detuning, the photonic group velocity, and the (plus) minus sign is for (right) left-propagating modes. The photonic modes are coupled with Rabi frequencies , that depend on the mode overlap with the etched grating, and then couple to the degenerate exciton mode with Rabi frequencies , with due to the different mode distributions of and . The block structure of the Hamiltonian makes it straightforward to identify the contributing parts. The photonic part of the BiC can be described with a matrix and is analogous to a spin- system (top left block). The counter and co-propagating TE1 modes exist at the same energy as the TE0 modes and define the period of the supersolid (bottom right block).
The BiC state can be simply described as a dissipative spin- system
| (S2) |
with eigenvalues . The near-zero linewidth of the BiC stems from the fact that at one of the eigenvalues is purely real (and corresponds to the BiC state) while the other one has twice the dissipation .
II Resonant excitation of propagating modes
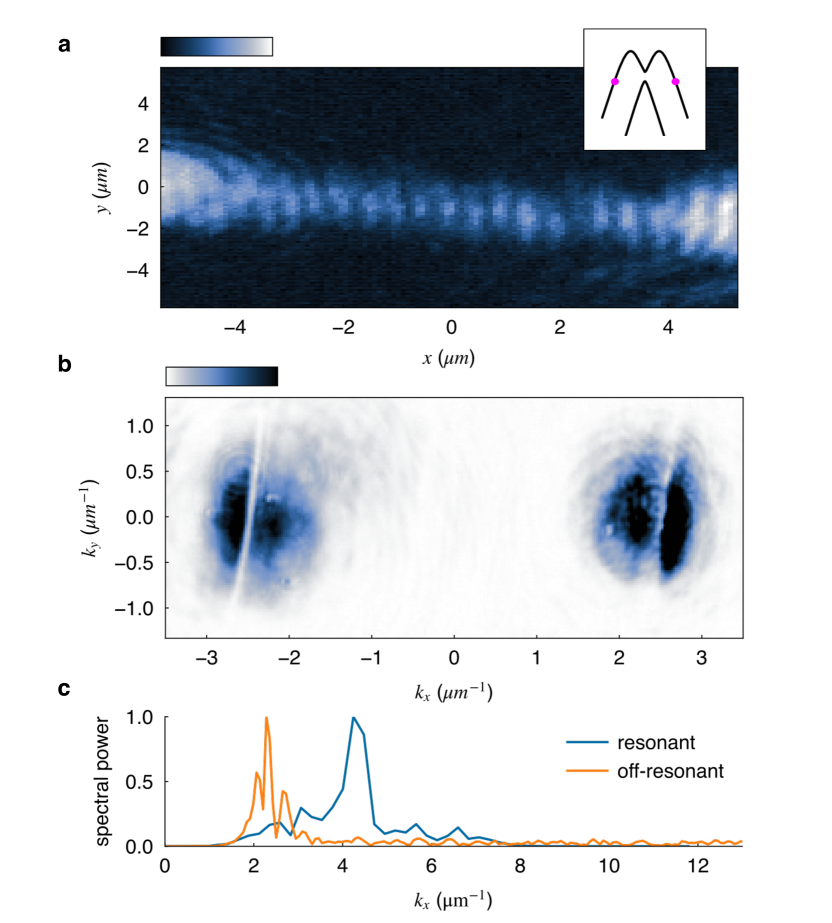
By resonantly exciting the TE±1 modes at the energy of the BiC we effectively isolate the “solid” part of our polaritonic supersolid and measure its characteristics. The interference that arises from the diffracted peaks has . Note that this in contrast with results discussed in the main text. Indeed, since in the present case the total emitted field is the superposition of two plane-wave contributions counter propagating, without any signal coming from TE0, the field intensity is , resulting in a peak in the emitted spectrum. To avoid interference coming directly from the laser we use two distinct excitation spots for at a distance of approximately \qty10μm and measure the interference of the propagating modes. Figure S1a shows the polariton density in coordinate space normalised to the density of the individual laser beams; the interference in the region between the spots is evident. Both lasers enter at (see Fig. S1b) and due to the negative group velocity propagate towards . Notice that the fringes do not have an apparent curvature which is characteristic of the phase fluctuations due to the spontaneous symmetry breaking of the supersolid. Moreover, the Fourier transform has a single well-defined peak since the gaussian beams have a slowly-varying spatial structure. Interference between the BiC and on the other hand, shows multiple peaks around corresponding to the two BiC lobes (see Fig. S1c).
III Linear coupling and finite size effects
Since we are imaging an ensemble average of many supersolid realisations it might seem surprising that we observe the breaking of translational symmetry in the first place. Should this phase transition be truly spontaneous, the phase of the density modulation would average to a uniform distribution in and significantly reduce the visibility of the fringes. As explained in the main text, the observed residual modulation is due to a symmetry breaking term resulting from the linear coupling of the modes in our system so we would not recover full phase freedom even at the thermodynamic limit unless . We note that in the thermodynamic limit of very large pump power, the nonlinear coupling scales more favourably with than the linear coupling and our system converges to an ideal supersolid. For vanishing linear coupling, the next-order, finite-size effects are the trapping potential from the laser and the negative effective mass riminucciPolaritonCondensationGapConfined2023, and the length of the waveguide. The length of the waveguides in this work is \qty300μm which is comparable to the propagation length of the BEC and as such it reaches the edges. However, we did not observe any differences using \qty1mm-long waveguides with tapered edges that should minimise reflections, which means that such standing waves do not appear in our system.
III.1 Spatial phase shift
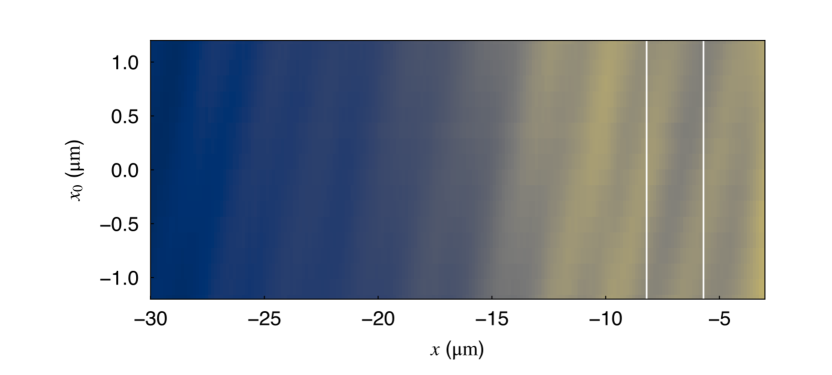
When scattering from a moving grating the scattered orders pick up a phase factor , where is the diffraction order, the grating wavevector, and the position of the grating with respect to an arbitrary origin wise.PhysRevLett.95.013901. In our case the origin is defined by the relative position of the laser spot and the grating. Figure S2 shows the density modulation changing with the centre position of the excitation spot along the waveguide axis. The density modulation of our BEC can be considered as two plane waves impinging onto the grating. If there is relative translation of the grating or the laser spot the modulation acquires a phase shift proportional to . In our case, these small spatial fluctuations are negligible since for a rigid translation of , much smaller than the extent of the BEC, the phase winds over 2.
III.2 Transverse phase fluctuations
A degree of phase freedom can be inferred by the transverse phase variations of the density modulation. The two-dimensional density distribution is proportional to , where and are the transverse amplitude and phase of the density modulation. Figure S3a shows the reciprocal amplitude and phase of a typical BEC realisation. When the peak maxima that define the periodicity of the crystal are at as expected. Fluctuations increase for larger values of as the density drops. Compare this with Fig. S1 where are excited resonantly and the interference pattern does not show any transverse variation.
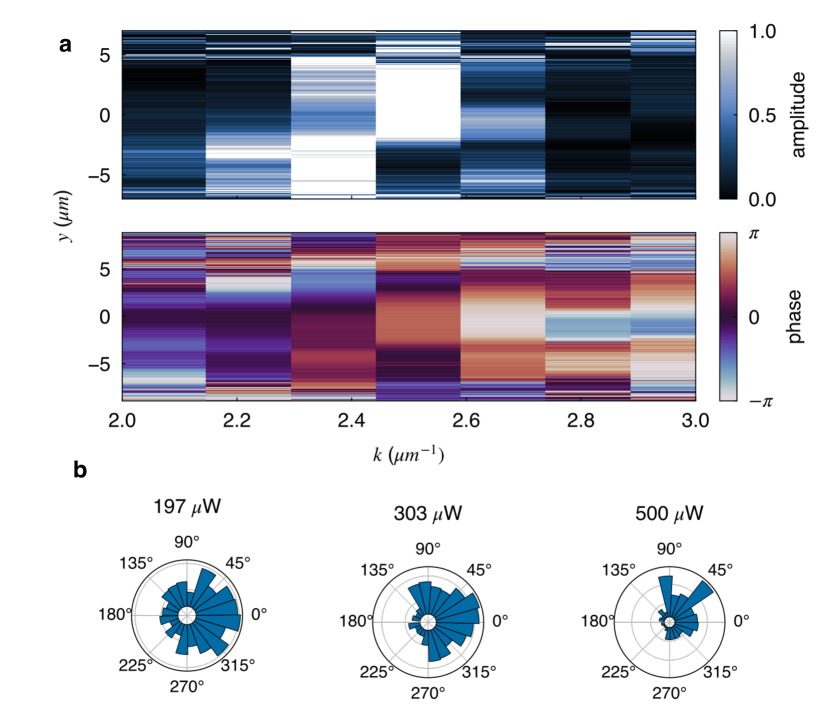
The transverse phase of the crystal structure measured at is uniformly distributed in Fig. S3b for low powers (left panel) when the system is still largely incoherent. The distribution narrows with increasing pump power till it is mostly distributed over the first quadrant at \qty500μW (right panel). Critical fluctuations at lower densities, close to threshold, likely scramble the U(1) phase which is then pinned at higher densities.
III.3 Average phase fluctuations
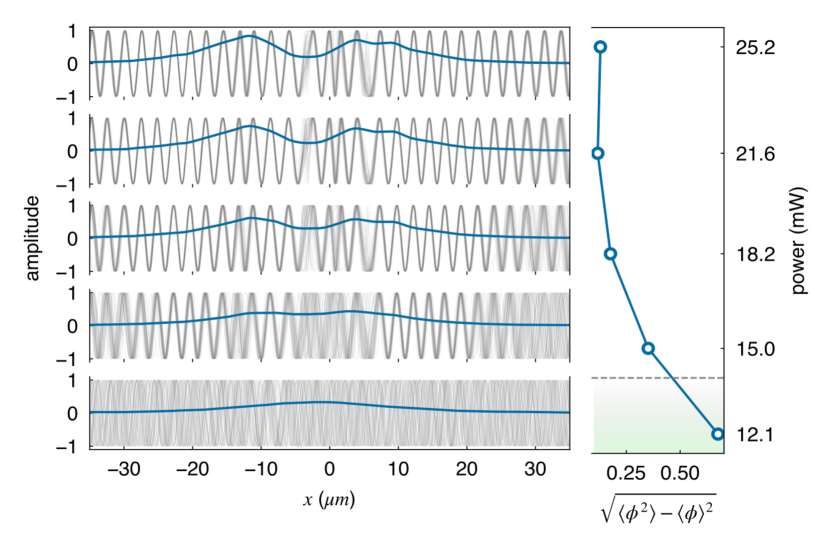
Here, we switched to continuous pumping in order to avoid averaging from the pulsed laser as described in the main text. Figure S4 shows 50 BEC realisations for powers around the condensation threshold which in this case is around \qty14mW. Below this threshold the phase of the modulation is completely random since the system is still incoherent, and its standard deviation is about 0.7. The standard deviation is measured only in the region of \qty5μm to \qty10μm to avoid artefacts of fluctuations coming from near-zero density. The standard deviation reduces monotonically till about the threshold power and saturates or slightly decreases again, indicating that the phase is yet to be fully fixed in the high density regions. This measurement is not sensitive to pointing fluctuations of the laser beam since it shows local phase fluctuations only.
IV Holographic imaging
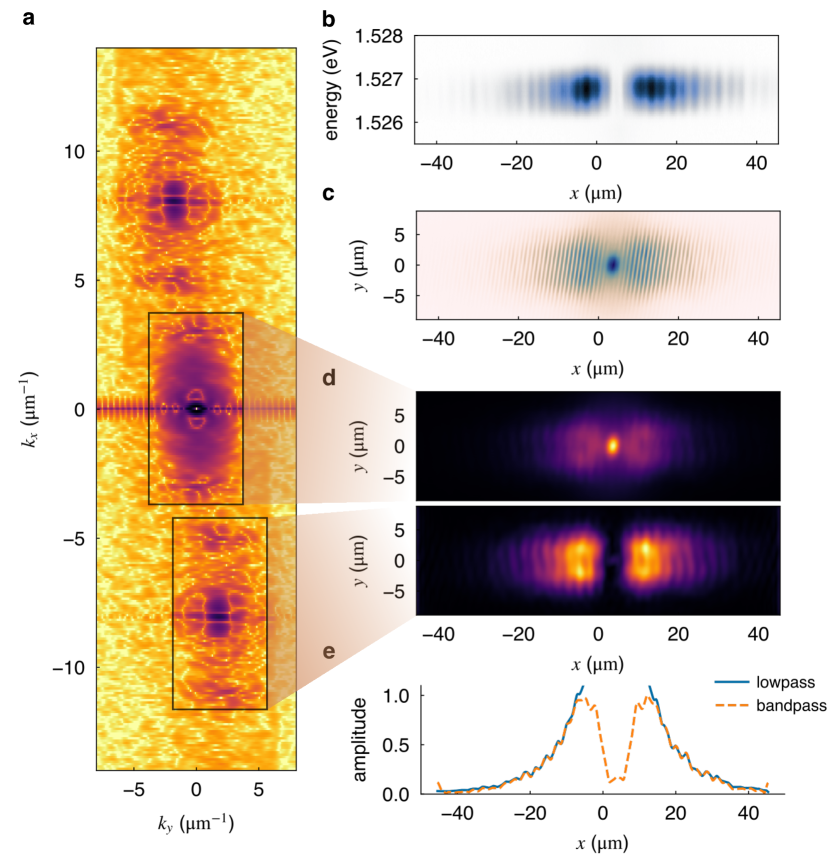
The small excitation spot creates a hot exciton reservoir underneath it that also emits photolumiscence covering the BiC notch at (see Fig. S5c and d). This feature does not exist in energy-resolved measurements, as shown in Fig. S5a. By taking advantage of interferometric techniques we can remove it also in energy-averaged measurements and recreate a realistic representation of the density in coordinate space. The reciprocal-space representation of the interferogram (Fig. S5a) shows, apart from the low-lying wavevectors, a strong peak at which corresponds to the fringe spacing from the interferometer. The visible sidebands on the fringe spacing are at and arise from the beating of the density modulation with the interferometer fringes. The fringe spacing has been chosen to be so that the lowest sideband at is above all the low-lying wavevectors. Using a bandpass filter before transforming back to coordinate space allows us to selectively eliminate the incoherent central spot while otherwise leaving the density unaffected (see Fig. S5d and e).