MnRhBi3: A Cleavable Antiferromagnetic Metal
Abstract
Cleavable metallic antiferromagnets may be of use for low-dissipation spintronic devices; however, few are currently known. Here we present orthorhombic MnRhBi3 as one such compound and present a thorough study of its physical properties. Exfoliation is demonstrated experimentally, and the cleavage energy and electronic structure are examined by density functional theory calculations. It is concluded that MnRhBi3 is a van der Waals layered material that cleaves easily between neighboring Bi layers, and that the Bi atoms have lone pairs extending into the van der Waals gaps. A series of four phase transitions are observed below room temperature, and neutron diffraction shows that at least two of the transitions involve the formation of antiferromagnetic order. Anomalous thermal expansion points to a crystallographic phase transition and/or strong magnetoelastic coupling. This work reveals a complex phase evolution in MnRhBi3 and establishes this cleavable antiferromagnetic metal as an interesting material for studying the interplay of structure, magnetism, and transport in the bulk and ultrathin limits as well as the role of lone pair electrons in interface chemistry and proximity effects in van der Waals heterostructures.
keywords:
Van der Waals materials, two dimensional materials, lone pairs, cleavable, antiferromagnet, intermetallic, phase transitions.Neutron Scattering Division, Oak Ridge National Laboratory, Oak Ridge, TN 37831, USA \alsoaffiliationDepartment of Materials Science and Engineering, University of Washington, Seattle, Washington 98195, United States
Since the initial demonstrations of magnetic order in the atomically thin limit in samples exfoliated from bulk crystals 1, 2, 3, 4, cleavable, van der Waals layered magnetic materials and their behaviors have emerged as important areas of research engaging the condensed matter physics, chemistry, and materials science communities 5, 6, 7, 8, 9. The experimental virtue of cleavable magnetic materials is that single or few layer specimens can be obtained in a relatively straightforward way and investigated by themselves, incorporated into devices, and stacked with other materials to realize new properties and functionalities. 10, 11, 12 The stacking degrees of freedom of single or few layers give rise to a plethora of exotic phenomena that are intensively investigated recently for their unique electronic, magnetic, and optical properties 13, 14, 15. This variability in stacking allows for the manipulation of the interlayer interactions that can dramatically affect physics and phenomena.
One of the areas that has been heavily influenced by the rise of cleavable magnetic materials is antiferromagnetic spintronics, which may provide new ways to realize the next generation of low dissipation devices 16, 17, 18, 19. Currently, much work in the field is focused on insulating examples 20, 21, 6, 9, 22. However, metals may offer unique advantages with their electrical conductivity coupled with magnetism 23. For example, the electrical conductivity in metals allows for the direct manipulation of spin currents through electric fields. Such spin manipulation, a fundamental aspect of spintronics, is more challenging in antiferromagnetic insulators.
Among the various 2D van der Waals antiferromagnets, few metallic systems have been identified. These include rare earth tritellurides, which have been extensively studied for their incommensurate charge density wave characteristics, diverse antiferromagnetic ground states, superconductivity under high pressure, and exceptionally high mobility.24, 25, 26, 27 Others are found in the FenGeTe2 family, where the partial substitution of Fe with Co switches the materials from ferromagnetic to antiferromagnetic, 28, 29, 30, 31 and CeSiI, which also brings heavy fermion physics into play.32, 33 A challenge for the field is then to design and discover additional cleavable metallic antiferromagnets.
Here, a study of the magnetism, electrical transport, and cleavage of MnRhBi3 is reported. Discovered in 2018, MnRhBi3 is a relatively unexplored layered compound with van der Waals-like gaps between buckled Bi layers.34, 35 The structure is shown in Figure 1 and will be discussed in more detail below. In this work, a growth procedure for MnRhBi3 crystals was developed, producing crystals with typical mass of 2-3 mg. Powder neutron diffraction and measurements of the thermodynamic, magnetic and transport properties in polycrystalline and single crystal samples show that MnRhBi3 is a metallic antiferromagnet with a complex phase evolution below room temperature showing four transitions involving the magnetism and/or crystal structure. Density functional theory (DFT) calculation of the cleavage energy and experimental exfoliation show that MnRhBi3 crystals cleave easily, and electron localization function calculations show Bi lone pairs extend into the van der Waals gaps. With the interesting structural and physical properties presented here and the many promising avenues for further exploration, MnRhBi3 provides an exciting new platform to study the interplay of structure, magnetism, and dimensionality in a metallic antiferromagnet.
1 Results and Discussion
1.1 Crystal structure and cleavage of MnRhBi3
Rietveld refinement of neutron powder diffraction (NPD) data, indexing of x-ray powder diffraction data, and single crystal x-ray diffraction data, show that the polycrystalline and single crystal MnRhBi3 samples have the orthorhombic () crystal structure reported previously in Refs. 34, 35. The lattice parameters from Rietveld refinement of powder x-ray diffraction data collected at room temperature are listed in Table 1 and are similar to those reported in Ref. 35. Single crystal diffraction revealed twinning that precluded high quality structural refinement. Therefore, the NPD-determined structure, refined using data collected at 100 K, is used to discuss the structure here. The refined structural parameters are compiled in Table 1, and the data and fit are shown in the Supporting Information. The lattice parameters show the expected thermal contraction when compared to the room temperature lattice parameters noted above.
| 293 K | 100 K | DFT | |
|---|---|---|---|
| a (Å) | 8.849(1) | 8.8398(2) | 8.855 |
| b (Å) | 13.6739(7) | 13.6528(6) | 13.775 |
| c (Å) | 4.1295(5) | 4.11582(11) | 4.144 |
| y-Bi1 | 0.3377(4) | 0.3363 | |
| x-Bi2 | 0.1943(3) | 0.1982 | |
| y-Bi2 | 0.1244(2) | 0.1238 | |
| x-Rh1 | 0.3012(6) | 0.3041 |
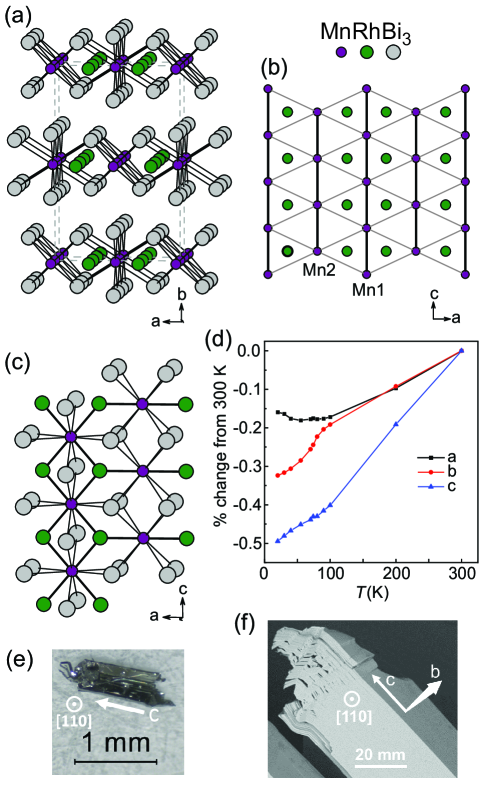
Figures 1a-c show the layered crystal structure of MnRhBi3. The layers are stacked along the crystallographic b-axis. The structure of an individual layer is illustrated in Figure 1b and 1c. Each contains a flat Mn-Rh plane between the Bi layers. This plane contains a distorted triangular lattice of Mn with two inequivalent Mn sites, with chains of each type running along the c direction. The intrachain Mn-Mn distance is 4.12 Å, and the shortest interchain Mn-Mn distance is 4.88 Å. The shortest interatomic distances within the structure are between Mn and Rh atoms, at 2.71 Å (4) for Mn1-Rh and 2.66 Å (2) for Mn2-Rh. This is close to the Mn-Rh distance found in binary intermetallics.36, 35 Figure 1c shows the coordination around the Mn sites. The coordination environments are quite different, but both have high coordination numbers if Rh and Bi bonds are considered. Each Mn is surrounded by eight Bi atoms with none closer than 3.0 Å. Rhodium is coordinated by three Mn atoms in the ac plane at the distances noted above, and by six Bi atoms at 2.83 Å, three above and three below the plane.
The anisotropy of the crystal structure is reflected in the growth habit of single crystals. Crystals grow in a needle-like morphology along the c-axis, which is the direction of the Mn-Mn chains (see Figure 1). In some cases the needles are grown together into a plate-like structure as shown in Figure 1e. The flat surface of these plates was confirmed by x-ray diffraction to be the (110) plane. This is unusual given the crystal structure (the layers are stacked along the b-axis), and the reason for this growth habit is unclear. Inspection of a crystal pressed into carbon tape for scanning electron microscopy better reveals the layered nature of the material. Figure 1f shows the flat [110] growth facet, along with the cleavage planes perpendicular to the b-axis.
The crystal structure suggests that the MnRhBi3 should cleave between planes of Bi atoms. The closest contact between Bi atoms in neighboring slabs, across the van der Waals-like gap, is 3.57 Å. In Bi metal, which is considered vdW layered, the interlayer distance across the gap is 3.53 Å at room temperature (3.44 Å at 78 K).37 This suggests that MnRhBi3 should cleave easily perpendicular to its b axis. To examine this further, cleavage energy calculations were performed using DFT as described in the Methods section and the Supporting Information. The calculated energy for cleaving between the Bi layers is 0.56 J/m2. This is a relatively low value, and can be compared to calculated values for other van der Waals layered compounds, in the same units: graphite (0.43) 38, \ceMoS2 (0.27)38, \ceCrGeTe3 and \ceCrSiTe3 (0.35-0.38)39, \ceCrCl3 and \ceCrI3 (0.3)40, 41, 113 or 226 type transition metal chalcophosphates (0.350.55) 42, and \ceCrTe3 (0.5) 43. Thus, it is reasonable to consider MnRhBi3 a van der Waals layered material.
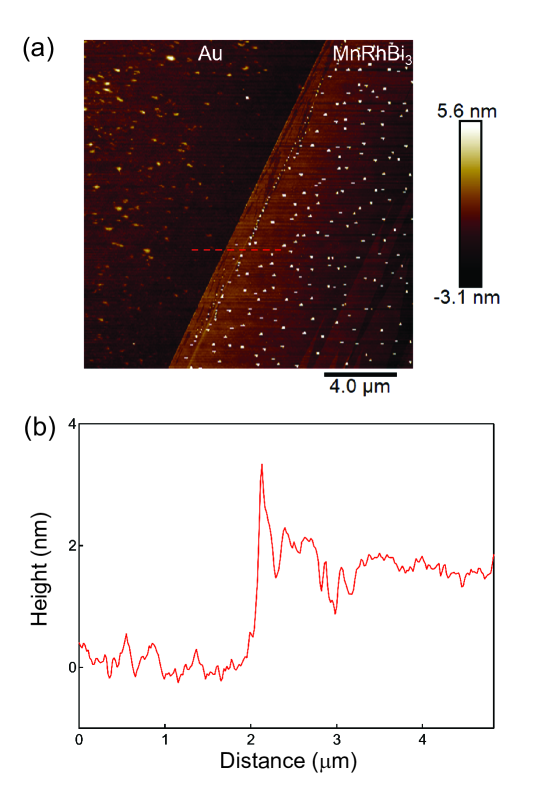
Mechanical exfoliation of MnRhBi3 was explored as described in the Methods section. Exfoliation on Si/\ceSiO2 substrates produced flakes with lateral dimensions of tens of m and thicknesses down to 20-30 nm that are suitable for device fabrication. These were used for electrical transport measurements discussed below. While the characterization of ultrathin flakes is ongoing and not the focus of the present work, an example of a 2 nm thick sample exfoliated onto gold 44 is shown in the Supporting Information. The identification of MnRhBi3 as a cleavable, van der Waals layered material based on its structure, growth habit, and calculated cleavage energy is experimentally confirmed by this exfoliation behavior.
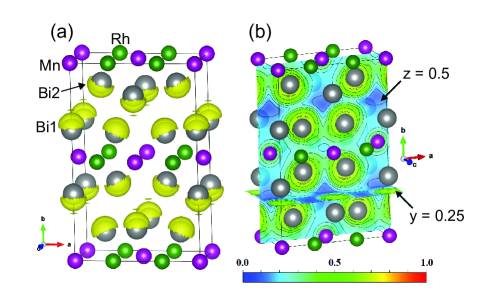
In most van der Waals layered compounds, including those with cleavage energies listed above, the van der Waals gap separates layers of closed-shell anions (divalent chalcogens or monovalent halides in those cases) that reside at the top and bottom surfaces of each structural slab. In the intermetallic compound MnRhBi3 the situation is different, since the gap is between Bi layers and formal valences cannot easily be assigned. This is reminiscent of layered Zintl phases that have van der Waals gaps separating layers of Sn 45, 46, 47. In addition, Bi is known to have stereoactive lone pairs associated with asymmetric coordination environments in some materials 48. Since the van der Waals gap provides a one-sided coordination environment, it is natural to consider the relationship between this gap and Bi lone pairs. This was explored by electron localization function (ELF) calculations 49. The results are shown in Figure 2, where ELF isosurfaces and planar contour plots are overlaid with the crystal structure. The asymmetric electron density around Bi is apparent. The regions of high density, associated with the Bi lone pairs, are indeed directed into the van der Waals gaps, which are at y = 0.25 and 0.75. The z = 0.5 plane contains the shortest cross-gap Bi-Bi contact in the structure, which is between atoms at the Bi2 positions. The contour plot at this plane clearly shows a minimum in electron density between the Bi2 atoms on each side of the gap, and the lone pairs are rotated slightly to avoid one another. Thus, MnRhBi3 may be expected to have dangling lone pairs at its surface. It would be interesting to understand how this might affect the surface chemistry and physics of cleaved MnRhBi3 crystals. The lone pairs may influence surface reconstruction, catalytic properties, and quantum mechanical proximity effects, all of which are worthy of further study.
The temperature evolution of the crystal structures gives information about phase transitions that may be crystallographically driven or couple strongly to the lattice. Lattice parameters of MnRhBi3 determined from powder x-ray diffraction data collected between 20 and 300 K are shown in Figure 1d. While the room temperature structure described above accounts for the diffraction data well over the entire temperature range, anomalous temperature dependence is seen in all three lattice parameters upon cooling below about 80 K. This indicates the presence of a phase transition that couples to the lattice, but not strongly enough to break the symmetry of the crystal structure within the sensitivity of our x-ray and neutron diffraction measurements.
1.2 Neutron diffraction and magnetic order
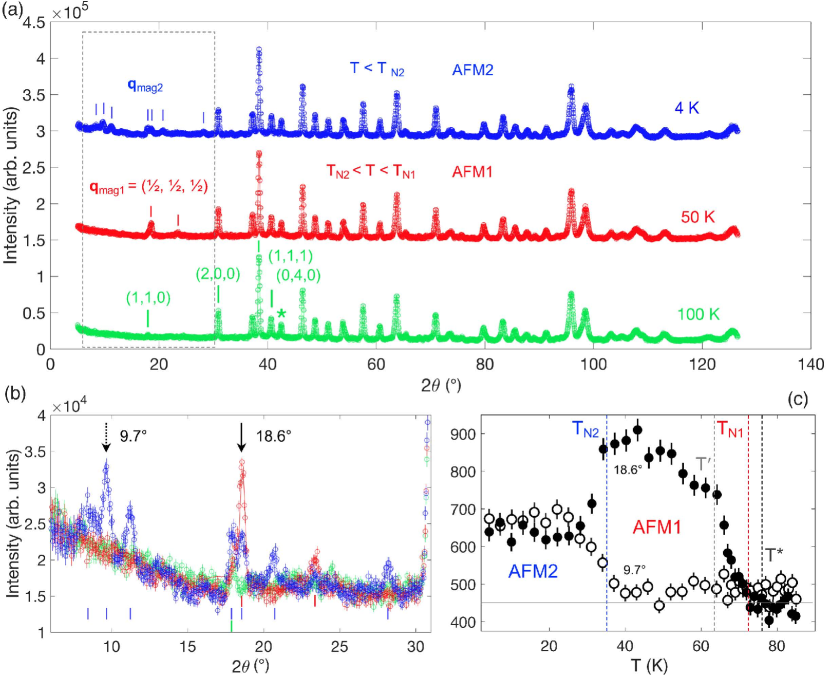
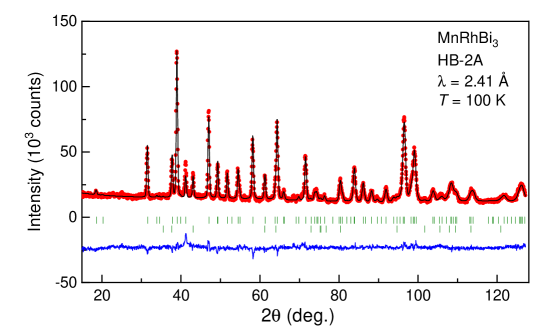
Data from neutron diffraction measurements collected at 100, 50, and 4 K using powders ground from single crystals are shown in Figure 3 (a-b). Markers at 100 K label several high symmetry nuclear Bragg reflections in Figure 3 (a). The asterisk near 41° marks a nuclear peak attributed to residual Bi from the crystal growth flux. At 50 K, magnetic Bragg reflections appear at low (low Q) and can be indexed with a reduced wave vector with respect to the orthorhombic unit cell. Diffraction data collected at a base temperature of 4 K contain additional magnetic reflections not indexed by . These magnetic reflections not indexed by the nuclear unit cell indicate antiferromagnetic (AFM) order.
Figure 3(b) shows a zoomed view of the reflections for , which are all resolution limited. Figure 3(c) shows the diffraction intensity versus temperature collected at the two magnetic Bragg peaks marked in Figure 3b. The magnetic Bragg reflection intensity is proportional to the square of the magnetic order parameter and tracks the onset and evolution of a new magnetic phase. The onset of intensity at associated with indicates a Néel temperature of 72 K, which is denoted as TN1. AFM1 denotes the magnetic phase just below this temperature. Below TN2 = 35 K, the peak at 9.7°, not indexed by , appears. The magnetic phase below TN2 if referred to as AFM2, and the data collected at 4 K show several magnetic Bragg peaks associated with this phase. In the AFM2 state, some magnetic intensity remains at Bragg positions associated with AFM1. There are two possible explanations for this observation: the AFM2 state below may involve the coexistence of the propagation vector with an additional propagation vector; or, alternatively, a single phase with a unique magnetic propagation vector may account for all the magnetic peaks below TN2. However, no commensurate wave vector can index all of the reflections observed in AFM2. Note that other temperatures marked on Figure 3c (T′ and T*) are defined from physical property measurements discussed below.
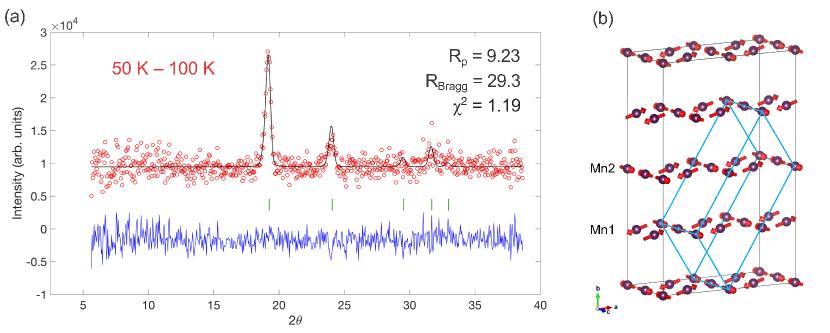
Rietveld refinements using the Fullprof Suite 51 were performed for the AFM1 phase. The magnetic contribution to the diffraction was isolated by subtracting the data collected in the paramagnetic state (100 K) from the data collected at 50 K. Fitting was performed in the range [Figure4a] since no magnetic signal could be resolved above the background at higher angles.
Representational analysis performed using SARAh 52 for space group and propagation vector yielded two possible irreducible representations, and (see Supporting Information). constrains the Mn1 moments to the ab plane and the moments on Mn2 site to lie along c, while in , this relationship is swapped. The fit using [Figure4a] gave agreement factors R, R, and , which are defined as the profile R-factor, the magnetic Bragg R-factor, and reduced chi-squared, respectively. The magnetic unit cell, outlined in blue in Figure 4b, is monoclinic with magnetic space group (12.64) and cell parameters a = 16.33 Å, b = 8.26 Å, c = 4.16 Å, , , and (see Supporting Information). Refinements using produced the same diffraction pattern and agreement factors, since the two magnetic unit cells are related by a translation of , leaving the square of the magnetic structure factor invariant. The unpolarized neutron diffraction data cannot distinguish between the two magnetic configurations nor a linear combination of the two irreducible representations.
Figure 4b shows the magnetic structure solution in the conventional magnetic cell where the paramagnetic structure is doubled along each of the three crystallographic directions. Mn2 sites form antiferromagnetic chains with ordered moments of directed along the c-axis. The moments on the Mn1 site lie in the ab plane, tilted at 16(5)° from the -axis, with a refined value of . This noncoplanar model is favored based on the present analysis; however, constraining the Mn1 moments to lie along the a-axis describes the data nearly as well.
1.3 Physical properties of MnRhBi3 single crystals
The temperature and magnetic field dependence of the physical properties of MnRhBi3 including effects of the magnetic phase transitions at TN1 and TN2 were examined using transport, magnetization, and heat capacity measurements. Because of the growth habit and the easy cleavage described above, the mm-scale crystals used for these measurements are best considered as composites of multiple plate-like ribbons that are nearly crystallographically aligned.
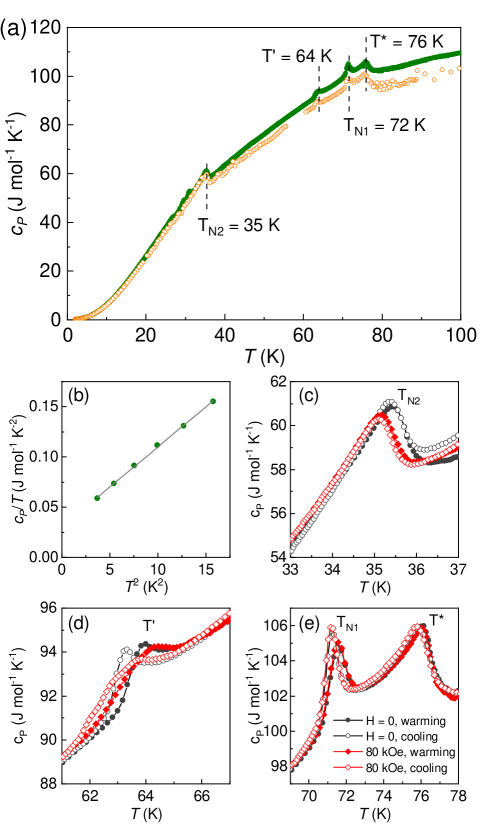
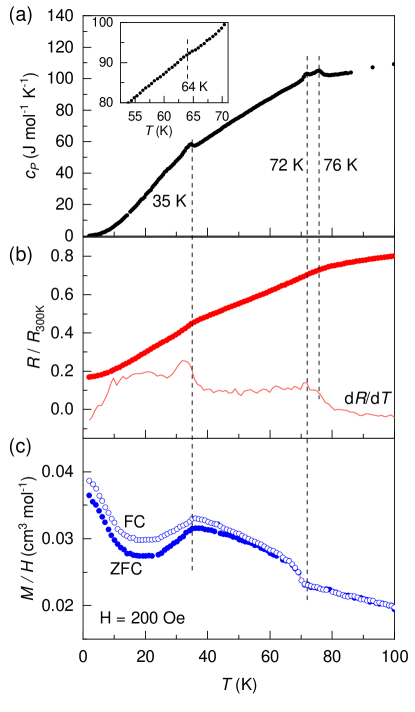
Results of heat capacity measurements on MnRhBi3 crystals are shown in Figure 5a, which includes data from two samples. Note that mol is used here to denote moles of formula units, equivalent to five moles of atoms or one mole of Mn. Figure 5b shows the low temperature data plotted as vs . Assuming the temperature is far enough below the magnetic ordering transitions such that the heat capacity is due only to free carriers and phonons, the linear fit gives a Sommerfeld coefficient of 30 mJ/mol/K2 and a Debye temperature of 107 K.
In both samples, four clear anomalies in the heat capacity are observed. This includes anomalies at both TN1 = 72 K and TN2 = 35 K identified above as antiferromagnetic transitions by neutron diffraction. Additional anomalies are detected just above TN1 at T* = 76 K and below TN1 at T′ = 64 K. This indicates the presence of four phase transitions in MnRhBi3 below room temperature. The higher temperature features coincide with the onset of the anomalous thermal contraction noted above and shown in Figure 1. Thus, it is reasonable to tentatively ascribe a structural nature to the transition at T*, although no change in symmetry is detected from the present data between room temperature and 4 K.
The heat capacity near each phase transition is examined more closely in Figure 5c-e, where results for both heating and cooling in both zero and 80 kOe applied fields are shown. The anomaly at T* shows no response to magnetic field, and only a barely detectable thermal hysteresis of about 0.2 K. The transition at TN1 is significantly sharper but shows a similar behavior; no effect of the field and a thermal hysteresis of about 0.3 K are seen. The largest effects are seen at the T′ transition, with a thermal hysteresis of about 0.6 K. The magnetic field strongly broadens this transition, particularly toward lower temperatures. At TN2, no thermal hysteresis is detected and a slight suppression in temperature by 0.3 K is seen in the magnetic field.
Based on the thermal hysteresis, on the transition at T′ is likely to have significant first-order character. This transition also has the most pronounced response to magnetic field. The suppression by the field, also seen to a smaller degree for TN2, is consistent with an antiferromagnetic character. The broadening is unusual and its origin is unclear.
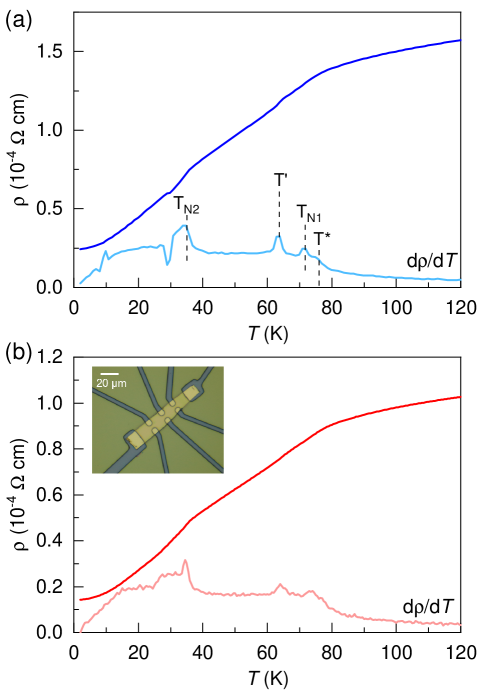
The electrical resistivity of a bulk, as-grown crystal MnRhBi3 is shown in Figure 6a. The resistivity of an exfoliated sample of thickness 660 nm in shown in Figure 6b. Similar behavior was seen in transport data from a 27 nm thick sample. The electrical resistivity of the bulk crystal and the thin flake are similar and increase with temperature indicating metal-like behavior. The bulk and exfoliated samples have residual resistivity ratios () of 8.0 and 8.7, respectively.
Several anomalies are observed in both datasets, and these are highlighted in the temperature derivative curves plotted in Figure 6. There is a clear peak in d/dT at TN1, with a shoulder seen at T*. Peaks are also seen at T′ and TN2. There is also notable structure in the derivative just below the TN2, which can also be seen in the heat capacity data in Figure 5a.
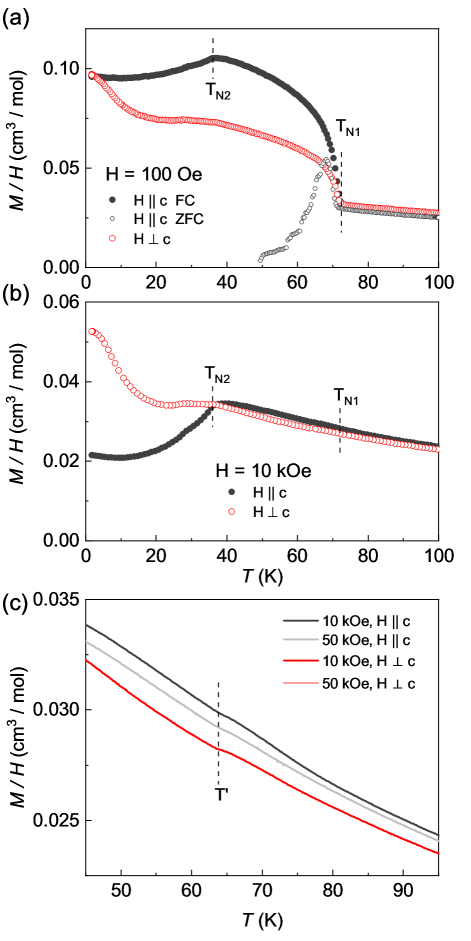
The temperature dependence of the magnetic susceptibility () of MnRhBi3 is summarized in Figure 7. The figure includes data from two orientations of the crystals. For the field is along the needlelike growth direction and parallel to the Mn chains. corresponds to in the plane of the platelike crystals, that is, perpendicular to both the c-axis and the [110] direction. In the low field magnetization data (Figure 7a) the two antiferromagnetic transitions identified by neutron diffraction appear prominently. Upon cooling, at TN1 the magnetization displays a sharp increase although the value remains small. This is characteristic of a transition into a canted antiferromagnetic state with a small uncompensated moment. Neutron diffraction shows that both Mn sites develop ordered moments at this tempeature. At TN2 the magnetization displays a cusp, reminiscent of an antiferromagnetic transition. Since this occurs below TN1, this can be attributed to a spin reorientation in the ordered state. A strong divergence between field cooled (FC) and zero-field cooled (ZFC) data is seen in Figure 7a. This onsets just below TN1, and is consistent with the interpretation of a transition into a canted AFM state, where upon cooling in zero (or near zero) field domains can be frozen in and on warming persist up to close to the transition temperature. No notable difference was seen between field-cooled warming and cooling data at 100 Oe. The fact that the fully compensated AFM1 model fits the 50 K neutron diffraction data well (Figure 4) indicates the canting in this state is small.
At the intermediate field of 10 kOe (Figure 7b), only the TN2 feature is clearly observed. Magnetic anomalies associated with the other transitions are difficult to detect. Figure 7c shows, over a narrow temperature range, the magnetic susceptibility measured at 10 and 50 kOe. A subtle but visible kink at T′ is noted and it does not change significantly between 10 and 50 kOe. This is likely masked in the low field data (Figure 7a) by the rapid change in M(T) through this temperature. In addition, a very subtle slope change may be noted in the 72-76 K range (Figure 7c), but this cannot be associated with either TN1 or T* with any confidence.
If indeed there is no magnetic signature of the phase transition at T* = 76 K, it may be reasonable to ascribe to it a primarily structural nature. However, since no symmetry change is indicated based on the present data, the details of such a transition remain unclear and further study is warranted. It is likely that this material has substantial magnetoelastic coupling and that may prove to be an interesting direction to explore. Indeed, the heat capacity behavior and likely magneto-structural nature of the transitions at T* and TN1 bring to mind the LaFeAsO-family of parent phases of the Fe-based superconductors, in which spin-lattice interactions produce a nematic phase and coupled magnetic and crystallographic phase transitions.53, 54, 55 Further work to carefully monitor the structure through the phase transitions in MnRhBi3 is needed. Note that the structure is orthorhombic at room temperature, so structural distortions along a, b, or c are all allowed without breaking any symmetry (see Figure 1d).
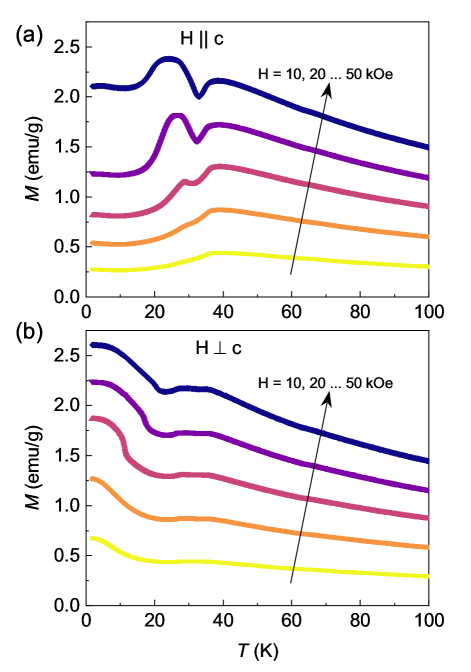
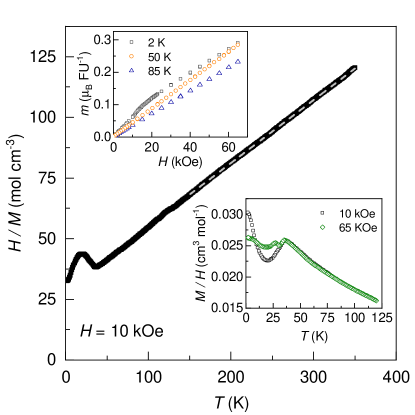
As pointed out above, at intermediate and higher field the magnetic response is primarily constrained to temperatures below TN2. A series of () curves collected upon cooling in fields from 10 to 50 kOe are shown in Figure 8. Data are shown for two orientations of the field. The kink at TN2 remains present over the entire field range, but the behavior at lower temperature evolves strongly. In particular, a local maximum in emerges near 24 K for with associated features appearing in the data. This behavior likely points to a complex magnetic ground state and competing magnetic interactions.
It is interesting to consider the interplay of Mn and Rh magnetism as a possible origin of the complicated phase evolution of MnRhBi3. However, neutron diffraction at 50 K suggests that any ordered moment on Rh is very small in the AFM1 state. DFT calculations performed using a simple antiferromagnetic structure gives a moment on Rh consistent with zero (0.02). Thus, from the present data it is not possible to identify what role Rh may play in the phase evolution of MnRhBi3.
The magnetic susceptibility measured at 10 kOe along three orthogonal directions was averaged and used for Curie Weiss fitting. Using data between 100 and 300 K, the fitting gives an effective moment of 5.9 per formula unit and a Weiss temperature of -94 K. Similar values were obtained for a polycrystalline sample (see Supporting Information). The effective moment is close to the spin only value expected for Mn2+ with a electronic configuration. The Weiss temperature indicates dominantly antiferromagnetic interactions, which is consistent with the observed magnetic order.
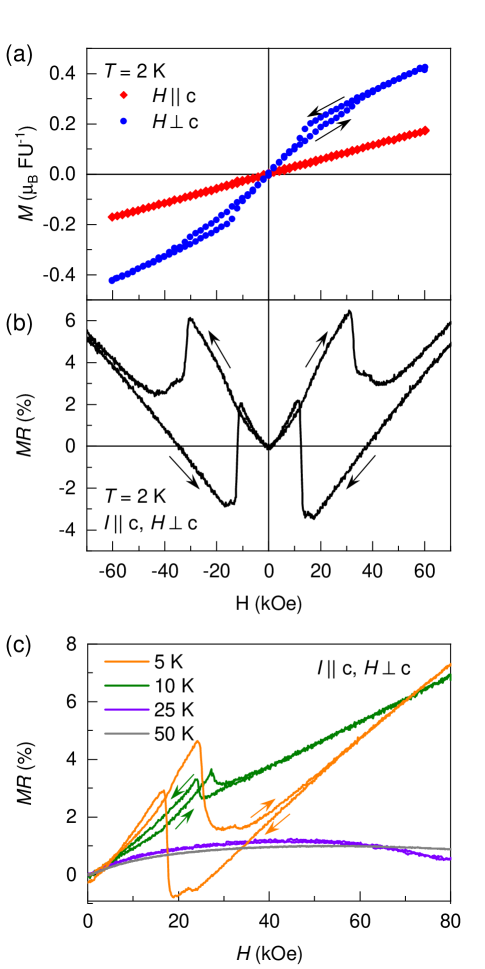
Isothermal magnetization curves measured at 2 K are shown in Figure 9a. No magnetic saturation is observed up to 60 kOe, typical of an antiferromagnetic state. With the field along the c-axis, the magnetization is linear between -60 and 60 kOe, while a field induced transition is apparent when the field is applied perpendicular to c. Recall the direction used here is in the plane of the platelike crystals, perpendicular to the [110] direction. For a simple collinear antiferromagnet, one expects to observe linear when the field is applied perpendicular to the spin direction, and a lower susceptibility at low fields followed by a spin-flop or spin-flip when the field is applied along the spin direction. These expectations are not borne out in the behavior seen in Figure 9a. In addition, the measured moment at the highest field used in the present study reaches only about 0.4 per Mn, much lower than any expected saturation moment. Thus, higher field measurements will be needed to draw any conclusions from the isothermal magnetization curves. Neutron diffraction shows that the magnetic structure is complex and likely incommensurate at low temperature, further complicating the behavior.
There is field-hysteretic behavior in for at 2 K. Upon increasing field, a slight increase in is observed near 32 kOe. The associated decrease in upon reducing the field begins near 15 kOe. Although these features in are subtle, they are pronounced in the magnetoresistance (). This is shown in Figure 9b. The critical fields in the field-hysteresis loop in agree with those identified in . The field dependence and hysteresis are strong enough to cause a sign change in , from positive to negative, upon decreasing field before it returns to its low field behavior at the lower critical field. At 2 K this starts near 15 kOe and completes sharply near 12 kOe. The measured magnetoresistance is significant but not particularly large; at 2 K it reaches a value of 10% at 120 kOe.
The sharp changes and hysteretic behavior of MR seen at 2 K persist to higher temperatures, and this is shown in Figure 9c. The magnitude of the changes at the critical fields and the degree of hysteresis are reduced as temperature increases, and they vanish between 10 and 25 K. At 25 and 50 K no field induced transitions are seen, and is limited to about 1% and shows concave down field dependence over the field range studied here.
2 Summary and Conclusions
Analysis of the crystal structure, calculation of cleavage energy, and demonstration of exfoliation establishes MnRhBi3 as a van der Waals layered material. Interestingly, the van der Waals gap in this compound resides between neighboring layers of Bi atoms, and the Bi atoms have lone pairs extending into the gap. This may provide new avenues for studies of how electronic properties of the cleavage surface affect interactions and proximity effects in heterostructures. Electrical resistivity measurements show that MnRhBi3 is metallic, as expected based on the chemical formula, and neutron diffraction measurements show that it adopts a complex and incommensurate antiferromagnetic ground state. Thus, MnRhBi3 is a somewhat rare example of a cleavable antiferromagnetic metal, a class of compounds expected to have uses in spintronics. In addition to these key behaviors, this compound displays a complex series of temperature and field induced phase transitions with magnetic, electronic, and structural character.
The phase transition at T* = 76 K is detected in heat capacity and resistivity but not in magnetization, suggesting it may have a structural origin. At TN1 = 72 K, neutron diffraction reveals that antiferromagnetic order with propagation vector () emerges. This transition is observed in heat capacity, resistivity, and magnetization as well. These measurements also reveal a transition at T′ = 64 K. The heat capacity anomaly at this transition responds most strongly to magnetic field, broadening toward lower temperatures when the field is applied. The nature of this transition is yet unclear, but it must have some magnetic character. Note that the magnetic structure determination reported here was measured at 50 K, below both TN1 and T′. Finally, at TN2 = 35 K addition magnetic Bragg peaks emerge, indicating a transition into the incommensurate antiferromagnetic AFM2 ground state, with signatures again seen in heat capacity, resistivity, and magnetization. Magnetization and magnetoresistance measurements suggest that the magnetic structure below TN2 evolves in a complex way with applied magnetic field.
This work provides the basic understanding of MnRhBi3 needed to motivate and inform future studies of this unique material and its potential scientific or technological applications. Several promising directions for further work are identified. Continued crystallographic research should explore magnetoelastic coupling, strain effects, and the structural response at each phase transition. Future work on its physics should be aimed at identifying the magnetic ground state at low temperature, and understanding the roles of spin-orbit coupling on the heavy elements, magnetism on Rh, and lone pair electrons on Bi. Finally, further studies of exfoliated samples are needed, and some are underway, to understand the behavior of this cleavable antiferromagnetic metal in the ultrathin limit.
3 Methods
3.1 Synthesis
Polycrystalline MnRhBi3 was synthesized by a long term annealing of the premelted stoichiometric mixture of the elements as reported by Kainzbauer et al.34 MnRhBi3 single crystals were grown out of Bi flux. The starting materials are elemental Mn pieces (Alfa, 99.99%), Rh powder (Alfa, 99.9%), and Bi shots (Alfa, 99.999%). Mn pieces were first cleaned by subliming away residual oxides after washing with diluted HCl. All starting materials were put in a 2 ml Canfield-crucible-set 56 at the molar ratio of Mn:Rh:Bi = 1:1:10 and then sealed in a fused silica ampoule under vacuum. The sealed ampoule was heated to 900C in 6 hours, homogenized for 16 hours, furnace cooled to 500C, and then slowly cooled to 350C over a week. At 350C, the Bi flux was decanted from the MnRhBi3 single crystals.
3.2 Experimental measurements and characterization of powders and crystals
X-ray powder diffraction measurements were performed on a PANalytical X’Pert Pro MPD with a Cu-Kα,1 incident-beam monochromator for phase identification determination of the lattice parameters. Low temperature diffraction data were collected using an Oxford PheniX closed cycle cryostat. The refinement of all powder diffraction patterns in this work was performed using FullProf. Polycrystalline samples were nearly single phase, with only a few percent of Bi or \ceMn5Rh6Bi18 as secondary phases.
Elemental analysis was carried out on as-grown crystals using a Hitachi-TM3000 microscope equipped with a Bruker Quantax 70 EDS system. The average measured atomic ratio was Mn:Rh:Bi = 21:23:56. This is close to the expected ratio of 1:1:3 considering the semiquantitative nature of the technique and the significant overlap between Rh-L and Bi-M lines.
Neutron powder diffraction was performed on the HB-2A beamline at the High Flux Isotope Reactor (HFIR) at Oak Ridge National Laboratory (ORNL). Approximately 0.3 g of crystals were ground into a fine powder, placed into a vanadium sample can 3 mm in diameter to reduce the absorption effect of Rh. Diffraction patterns were collected from 100 K down to a base temperate of 4 K, with collimator settings open-open-12’, and a Ge(113) monochromator provided an incident wavelength of Å. The patterns were collected over a Q-range of Å Å with count times of 8 hours per scan.
Magnetization, heat capacity, and transport properties were measured using standard practices with commercial cryostats from Quantum Design: Magnetic Property Measurement Systems (MPMS-XL and MPMS3) and Physical Property Measurement Systems (PPMS).
3.3 Density functional theory calculations
All theoretical studies were conducted using density functional theory (DFT) with the projector augmented plane-wave (PAW) method, as implemented in VASP version 6.3.2 57, 58. PAW potentials for Mn (3p64s23d5), Rh (4d85s1), and Bi (5d106s26p3) were employed. All calculations were performed with an energy cutoff set at 800 eV, and Monkhorst-Pack k-point grids of 428 for the bulk structure and 418 for the slab structure. Ionic positions were relaxed until forces on each atom were reduced below 10 meV/Å, achieving a total energy convergence criterion of 10-6 eV. To accurately capture the van der Waals (vdW) interactions within the MnRhBi3 structure, the van der Waals density functional (vdW-DF) 59, 60 with the optB86b exchange functional was employed 61. The crystal structure of the bulk and slab MnRhBi3 models are shown in the Supporting Information. The vdW-DF-optB86b relaxed lattice constants are = 8.755 Å, = 13.775 Å, and = 4.144 Å. The distance between Bi-Bi layers () is 3.60 Å, indicating the separation between these layers within the structure, and are in good agreement with the experimental interlayer distance.
3.4 Exfoliation and characterization of exfoliated samples
Samples were exfoliated with standard scotch tape techniques on Si substrates covered with 285 nm thick thermally grown \ceSiO2. Before exfoliation Si/\ceSiO2 substrates were treated with \ceO2 plasma for 10 minutes at the RF power of 90 W. Optical microscopy was used to identify flakes suitable for device fabrication and selected flakes were investigated using atomic force microscopy. Suitable thin flakes were then covered with PMMA (Polymethylmethacrylate) and standard electron beam lithography, thermal evaporation of Cr/Au stack and liftoff were used to fabricate devices, an example of one of such devices is shown in Figure 6b. To protect thin flakes of MnRhBi3 from possible degradation we performed all fabrication and characterization inside an Ar-filled glovebox. Before performing transport measurements, samples were covered with another layer of PMMA for protection. 62
Transport measurements were performed with standard lock-in techniques using the Physical Property Measurement System (PPMS, Quantum Design, 2 K – 300 K, 9 T). Currents in the range of 1 – 400 A depending on the sample thickness and dimensions were applied to the drain and source electrodes of samples in the shape of Hall bars. We used lock-in amplifiers (Stanford Research Systems SR830 and SR860) to source current and low-noise current amplifiers (DL 1210) and low-noise voltage amplifiers (Stanford Research Systems SR560) in tandem with lock-in amplifiers to measure current and voltage. All measurements used low frequencies (between 9.999 Hz and 17.777 Hz)
Atomic force measurements on exfoliated flakes were performed inside an Ar-filled glovebox using Bruker Dimension Icon AFM after exfoliation and before further device fabrication. The peak force mode available in Bruker Icon was mainly used, while contact and tapping AFM modes provided consistent results.
4 Supporting Information
Rietveld fit to neutron powder diffraction data at 100 K, representation analysis results and magnetic space group, properties of polycrystalline MnRhBi3, exfoliation of ultrathin samples, electronic structure and cleavage energy calculations (PDF).
5 Acknowledgments
Work was primarily supported by the U.S. Department of Energy, Office of Science, Basic Energy Sciences, Division of Materials Sciences and Engineering at Oak Ridge National Laboratory. This research used resources at the High Flux Isotope Reactor, a U.S. DOE Office of Science User Facility operated by the Oak Ridge National Laboratory. For exfoliation and transport measurements on exfoliated flakes, D.O. acknowledges the KU Research Go Award (1004170) and KU Startup Funding and X.X. acknowledges support from DOE BES (DE-SC0012509).
6 Supporting Information for
MnRhBi3: A Cleavable Antiferromagnetic Metal
6.1 Rietveld refinement of neutron powder diffraction data
Figure 10 shows the Rietveld refinement of data collected at 100 K giving the crystal structure parameters listed in the main text. Agreement factors are Rp = 5.24, Rwp = 6.65, = 2.27.
6.2 Magnetic structure: Representation analysis and magnetic space group.
Representation analysis results from SARAh 52 for space group and propagation vector are listed in Table 2. Magnetic space group information is given in Table 3.
| IR | BV | Atom | BV components | |||||
| 1 | 4 | 0 | 0 | 0 | 0 | 0 | ||
| 2 | 0 | 0 | 4 | 0 | 0 | 0 | ||
| 1 | 0 | 4 | 0 | 0 | 0 | 0 | ||
| 1 | 0 | 0 | 4 | 0 | 0 | 0 | ||
| 2 | 4 | 0 | 0 | 0 | 0 | 0 | ||
| 2 | 0 | 4 | 0 | 0 | 0 | 0 | ||
| Compound | MnRhBi3 |
|---|---|
| Parent space group | Cmmm (N. 65) |
| Propagation vector(s) | (½, ½, ½ ) |
| Transformation from parent | (2a,2b,2c;0,0,0) |
| basis to the one used | |
| MSG symbol | Ca2/m |
| MSG number | 12.64 |
| Transformation from basis used | (1/2a+1/2b,c,1/4a-1/4b;0,0,0) |
| to standard setting of MSG | |
| Magnetic point group | 2/m1 (5.2.13) |
| Unit cell parameters (Å) | a=17.68 a=90º |
| b=27.31 b =90º | |
| c=8.23 g =90º | |
| MSG symmetry operations | x,y,z,+1 |
| -x,-y,z,+1 | |
| -x,-y,-z,+1 | |
| x,y,-z,+1 | |
| MSG symmetry centering operations | x,y,z,+1 |
| x,y+1/2,z+1/2,+1 | |
| x+1/4,y+1/4,z+1/2,+1 | |
| x+1/4,y+3/4,z,+1 | |
| x+1/2,y,z+1/2,+1 | |
| x+1/2,y+1/2,z,+1 | |
| x+3/4,y+1/4,z,+1 | |
| x+3/4,y+3/4,z+1/2,+1 | |
| x,y,z+1/2,-1 | |
| x,y+1/2,z,-1 | |
| x+1/4,y+1/4,z,-1 | |
| x+1/4,y+3/4,z+1/2,-1 | |
| x+1/2,y,z,-1 | |
| x+1/2,y+1/2,z+1/2,-1 | |
| x+3/4,y+1/4,z+1/2,-1 | |
| x+3/4,y+3/4,z,-1 | |
| Positions of magnetic atoms | Mn1 Mn 0.25000 0.00000 0.25000 |
| Mn2 Mn 0.00000 0.00000 0.00000 | |
| Positions of non-magnetic atoms | Bi1 Bi 0.00000 0.16890 0.00000 |
| Bi21 Bi 0.09715 0.06220 0.25000 | |
| Bi22 Bi 0.90285 0.06220 0.25000 | |
| Mn1 Mn 0.25000 0.00000 0.25000 | |
| Mn2 Mn 0.00000 0.00000 0.00000 | |
| Rh1 Rh 0.15060 0.00000 0.00000 |
6.3 Physical properties of polycrystalline samples
Heat capacity, resistivity, and magnetization measurements were performed on polycrystalline pellets made from MnRhBi3 powders for comparison with the single crystal results. The results are summarized in Fig. 11. The phase transitions at T*, TN1, and TN2 can be clearly seen in one or more of the measured properties, manifested as anomalies that are very similar to those seen in the single crystal data. In the polycrystalline samples, T′ is difficult to detect, but the indication of a feature near 64 K may be just visible in the heat capacity as shown in the inset of Fig. 11a.
The magnetic behavior of the polycrystalline material at higher magnetic fields is shown in Fig. 12. At low temperature, field induced transitions similar to those seen in the single crystals are apparent in the two insets. The main panel shows a Curie Weiss fit to data collected at 10 kOe between 150 and 350 K. The fitted effective moment and Weiss temperature are 5.5 and -113 K, respectively. These values are similar to those determined from the average single crystal magnetic susceptibility given in the main text (5.9 and -94 K).
6.4 Exfoliation of ultrathin specimens
To realize ultrathin flakes of MnRhBi3, exfoliation was performed on Si/\ceSiO2 substrates covered with a 2 nm layer of Cr or Ti followed by a 3 nm layer of Au. This process 44 allowed achieving few nm thick flakes of MnRhBi3. An example is shown in Figure 13, with atomic force microscopy data showing a thickness of 2 nm. Since the layer spacing is b/2 = 0.68 nm, the measured thickness corresponds to three MnRhBi3 layers or 1.5 conventional unit cells (see main text Figure 1).
6.5 Electronic structure
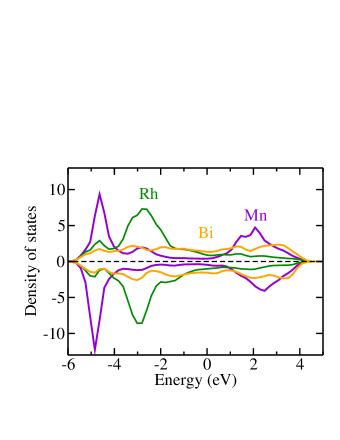
The vdW-DF-optB86b optimized structures were used to compare the energies of different magnetic phases. Since the experimental magnetic ground state is complex (likely non-collinear and incommensurate), a simple AFM model was constructed and compared to FM ordering. The AFM model used has Mn spins that are antiparallel to nearest Mn atoms both in-plane and out-of-plane. It was found to be 0.5 meV/f.u. lower in energy than the FM state. Calculated magnetic moments are 4.4 /Mn, 0.17 /Rh and 0.18 /Bi. The calculated density of states, depicted in Fig. 14, exhibits the expected metallic behavior for the antiferromagnetic phases. At the Fermi level, the contribution from Bi is the most significant, followed by Rh, with Mn contributing the least.
6.6 Cleavage energy calculations
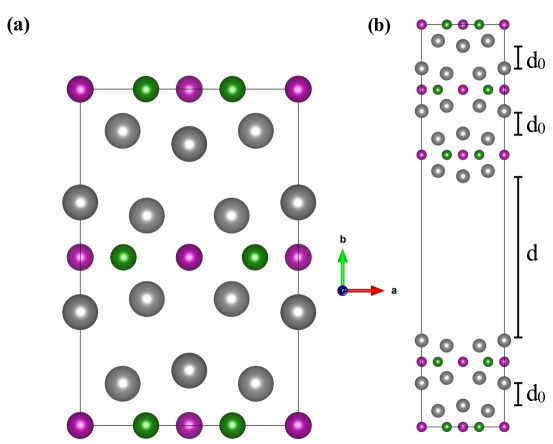
The cleavage energy () is crucial for understanding the material’s structural integrity and interlayer bonding characteristics. To calculate the energy required to separate the layers, a vacuum space of 18 Å was introduced to minimize interactions between the top and bottom of the slab in the slab structural model (see Fig. 15 (b)). The cleavage energy, , was computed as:
| (1) |
Here, is the energy of the bulk system, and is the energy of the optimized slab configuration after relaxing the atomic positions. and represent the number of atoms in the bulk and slab, respectively, and denotes the area of the top of the slab. The calculated of MnRhBi3 is 0.56 J/m2.
References
- Lee et al. 2016 Lee, J.-U.; Lee, S.; Ryoo, J. H.; Kang, S.; Kim, T. Y.; Kim, P.; Park, C.-H.; Park, J.-G.; Cheong, H. Ising-type magnetic ordering in atomically thin FePS3. Nano Lett. 2016, 16, 7433–7438
- Wang et al. 2016 Wang, X.; Du, K.; Liu, Y. Y. F.; Hu, P.; Zhang, J.; Zhang, Q.; Owen, M. H. S.; Lu, X.; Gan, C. K.; Sengupta, P.; others Raman spectroscopy of atomically thin two-dimensional magnetic iron phosphorus trisulfide (FePS3) crystals. 2D Mater. 2016, 3, 031009
- Gong et al. 2017 Gong, C.; Li, L.; Li, Z.; Ji, H.; Stern, A.; Xia, Y.; Cao, T.; Bao, W.; Wang, C.; Wang, Y.; others Discovery of intrinsic ferromagnetism in two-dimensional van der Waals crystals. Nature 2017, 546, 265–269
- Huang et al. 2017 Huang, B.; Clark, G.; Navarro-Moratalla, E.; Klein, D. R.; Cheng, R.; Seyler, K. L.; Zhong, D.; Schmidgall, E.; McGuire, M. A.; Cobden, D. H.; others Layer-dependent ferromagnetism in a van der Waals crystal down to the monolayer limit. Nature 2017, 546, 270–273
- Duong et al. 2017 Duong, D. L.; Yun, S. J.; Lee, Y. H. van der Waals layered materials: opportunities and challenges. ACS Nano 2017, 11, 11803–11830
- Burch et al. 2018 Burch, K. S.; Mandrus, D.; Park, J.-G. Magnetism in two-dimensional van der Waals materials. Nature 2018, 563, 47–52
- Huang et al. 2020 Huang, B.; McGuire, M. A.; May, A. F.; Xiao, D.; Jarillo-Herrero, P.; Xu, X. Emergent phenomena and proximity effects in two-dimensional magnets and heterostructures. Nat. Mater. 2020, 19, 1276–1289
- McGuire 2020 McGuire, M. A. Cleavable magnetic materials from van der Waals layered transition metal halides and chalcogenides. J. Appl. Phys. 2020, 128
- Wang et al. 2022 Wang, Q. H.; Bedoya-Pinto, A.; Blei, M.; Dismukes, A. H.; Hamo, A.; Jenkins, S.; Koperski, M.; Liu, Y.; Sun, Q.-C.; Telford, E. J.; others The magnetic genome of two-dimensional van der Waals materials. ACS Nano 2022, 16, 6960–7079
- Geim and Grigorieva 2013 Geim, A. K.; Grigorieva, I. V. Van der Waals heterostructures. Nature 2013, 499, 419–425
- Lam et al. 2022 Lam, D.; Lebedev, D.; Hersam, M. C. Morphotaxy of layered van der Waals materials. ACS nano 2022, 16, 7144–7167
- Kim et al. 2023 Kim, J.-y.; Ju, X.; Ang, K.-W.; Chi, D. Van der Waals layer transfer of 2D materials for monolithic 3D electronic system integration: review and outlook. ACS nano 2023, 17, 1831–1844
- Sun et al. 2024 Sun, X.; Suriyage, M.; Khan, A. R.; Gao, M.; Zhao, J.; Liu, B.; Hasan, M. M.; Rahman, S.; Chen, R.-s.; Lam, P. K.; others Twisted van der Waals Quantum Materials: Fundamentals, Tunability, and Applications. Chem. Rev. 2024,
- Fox et al. 2023 Fox, C.; Mao, Y.; Zhang, X.; Wang, Y.; Xiao, J. Stacking Order Engineering of Two-Dimensional Materials and Device Applications. Chem. Rev. 2023,
- Gong and Zhang 2019 Gong, C.; Zhang, X. Two-dimensional magnetic crystals and emergent heterostructure devices. Science 2019, 363, eaav4450
- Jungwirth et al. 2016 Jungwirth, T.; Marti, X.; Wadley, P.; Wunderlich, J. Antiferromagnetic spintronics. Nat. Nanotechnol. 2016, 11, 231
- Gomonay et al. 2018 Gomonay, O.; Baltz, V.; Brataas, A.; Tserkovnyak, Y. Antiferromagnetic spin textures and dynamics. Nat. Phys. 2018, 14, 213–216
- Baltz et al. 2018 Baltz, V.; Manchon, A.; Tsoi, M.; Moriyama, T.; Ono, T.; Tserkovnyak, Y. Antiferromagnetic spintronics. Rev. Mod. Phys. 2018, 90, 015005
- Rahman et al. 2021 Rahman, S.; Torres, J. F.; Khan, A. R.; Lu, Y. Recent developments in van der Waals antiferromagnetic 2D materials: Synthesis, characterization, and device implementation. ACS nano 2021, 15, 17175–17213
- Liu et al. 2023 Liu, P.; Zhang, Y.; Li, K.; Li, Y.; Pu, Y. Recent advances in 2D van der Waals magnets: Detection, modulation, and applications. Iscience 2023,
- McGuire 2017 McGuire, M. A. Crystal and magnetic structures in layered, transition metal dihalides and trihalides. Crystals 2017, 7, 121
- Jiang et al. 2021 Jiang, X.; Liu, Q.; Xing, J.; Liu, N.; Guo, Y.; Liu, Z.; Zhao, J. Recent progress on 2D magnets: Fundamental mechanism, structural design and modification. Appl. Phys. Rev. 2021, 8
- Siddiqui et al. 2020 Siddiqui, S. A.; Sklenar, J.; Kang, K.; Gilbert, M. J.; Schleife, A.; Mason, N.; Hoffmann, A. Metallic antiferromagnets. J. Appl. Phys. 2020, 128
- DiMasi et al. 1995 DiMasi, E.; Aronson, M. C.; Mansfield, J. F.; Foran, B.; Lee, S. Chemical pressure and charge-density waves in rare-earth tritellurides. Phys. Rev. B 1995, 52, 14516–14525
- Hamlin et al. 2009 Hamlin, J.; Zocco, D.; Sayles, T.; Maple, M.; Chu, J.-H.; Fisher, I. Pressure-induced superconducting phase in the charge-density-wave compound terbium tritelluride. Phys. Rev. Lett. 2009, 102, 177002
- Lei et al. 2020 Lei, S.; Lin, J.; Jia, Y.; Gray, M.; Topp, A.; Farahi, G.; Klemenz, S.; Gao, T.; Rodolakis, F.; McChesney, J. L.; others High mobility in a van der Waals layered antiferromagnetic metal. Sci. Adv. 2020, 6, eaay6407
- Yumigeta et al. 2021 Yumigeta, K.; Qin, Y.; Li, H.; Blei, M.; Attarde, Y.; Kopas, C.; Tongay, S. Advances in Rare-Earth Tritelluride Quantum Materials: Structure, Properties, and Synthesis. Adv. Sci. 2021, 8, 2004762
- May et al. 2019 May, A. F.; Ovchinnikov, D.; Zheng, Q.; Hermann, R.; Calder, S.; Huang, B.; Fei, Z.; Liu, Y.; Xu, X.; McGuire, M. A. Ferromagnetism near room temperature in the cleavable van der Waals crystal Fe5GeTe2. ACS Nano 2019, 13, 4436–4442
- May et al. 2020 May, A. F.; Du, M.-H.; Cooper, V. R.; McGuire, M. A. Tuning magnetic order in the van der Waals metal by cobalt substitution. Phys. Rev. Mater. 2020, 4, 074008
- Tian et al. 2020 Tian, C.; Pan, F.; Xu, S.; Ai, K.; Xia, T.; Cheng, P. Tunable magnetic properties in van der Waals crystals (Fe1- xCox) 5GeTe2. Appl. Phys. Lett. 2020, 116
- Seo et al. 2021 Seo, J.; An, E. S.; Park, T.; Hwang, S.-Y.; Kim, G.-Y.; Song, K.; Noh, W.-s.; Kim, J.-Y.; Choi, G. S.; Choi, M.; others Tunable high-temperature itinerant antiferromagnetism in a van der Waals magnet. Nat. Commun. 2021, 12, 2844
- Okuma et al. 2021 Okuma, R.; Ritter, C.; Nilsen, G. J.; Okada, Y. Magnetic frustration in a van der Waals metal CeSiI. Phys. Rev. Mater. 2021, 5, L121401
- Posey et al. 2024 Posey, V. A.; Turkel, S.; Rezaee, M.; Devarakonda, A.; Kundu, A. K.; Ong, C. S.; Thinel, M.; Chica, D. G.; Vitalone, R. A.; Jing, R.; others Two-dimensional heavy fermions in the van der Waals metal CeSiI. Nature 2024, 625, 483–488
- Kainzbauer et al. 2018 Kainzbauer, P.; Richter, K. W.; Effenberger, H. S.; Marker, M. C.; Ipser, H. Single-crystal structure determination of two new ternary bismuthides: Rh6Mn5Bi18 and RhMnBi3. Acta Cryst. C 2018, 74, 863–869
- Kainzbauer et al. 2020 Kainzbauer, P.; Marker, M. C.; Richter, K. W. Reassessment of the binary Mn-Rh phase diagram and experimental investigations of the ternary Bi-Mn-Rh system. J. Phase Equilib. Diffus. 2020, 41, 282
- Kouvel et al. 1963 Kouvel, J. S.; Hartelius, C. C.; Osika, L. M. Magnetic properties and crystal-structure transformation of the ordered alloy (MnRh). J. Appl. Phys. 1963, 34, 1095
- Cucka and Barrett 1962 Cucka, P.; Barrett, C. S. The crystal structure of Bi and of solid solutions of Pb, Sn, Sb and Te in Bi. Acta Crystallogr. 1962, 15, 865
- Björkman et al. 2012 Björkman, T.; Gulans, A.; Krasheninnikov, A. V.; Nieminen, R. M. Phys. Rev. Lett. 2012, 108, 235502
- Li and Yang 2014 Li, X.; Yang, J. J. Mater. Chem. C 2014, 2, 7071
- McGuire et al. 2015 McGuire, M. A.; Dixit, H.; Cooper, V. R.; Sales, B. C. Chem. Mater. 2015, 27, 612
- Zhang et al. 2015 Zhang, W.-B.; Qu, Q.; Zhu, P.; Lam, C.-H. J. Mater. Chem C 2015, 3, 12457
- Zhang et al. 2015 Zhang, X.; Zhao, X.; Wu, D.; Jing, Y.; Zhou, Z. Adv. Sci. 2015, 3, 1600062
- McGuire et al. 2017 McGuire, M. A.; Garlea, V. O.; KC, S.; Cooper, V. R.; Yan, J.; Cao, H.; Sales, B. C. Antiferromagnetism in the van der Waals layered spin-lozenge semiconductor . Phys. Rev. B 2017, 95, 144421
- Velický et al. 2018 Velický, M.; Donnelly, G. E.; Hendren, W. R.; McFarland, S.; Scullion, D.; DeBenedetti, W. J. I.; Correa, G. C.; Han, Y.; Wain, A. J.; Hines, M. A.; Muller, D. A.; Novoselov, K. S.; Abruña, H. D.; Bowman, R. M.; Santos, E. J. G.; Huang, F. Mechanism of Gold-Assisted Exfoliation of Centimeter-Sized Transition-Metal Dichalcogenide Monolayers. ACS Nano 2018, 12, 10463–10472
- Arguilla et al. 2016 Arguilla, M. Q.; Katoch, J.; Krymowski, K.; Cultrara, N. D.; Xu, J.; Xi, X.; Hanks, A.; Jiang, S.; Ross, R. D.; Koch, R. J.; others NaSn2As2: an exfoliatable layered van der Waals Zintl phase. ACS Nano 2016, 10, 9500–9508
- Asbrand et al. 1995 Asbrand, M.; Eisenmann, B.; Klein, J. Arsenidostannate mit Arsen-analogen [SnAs]-Schichten: Darstellung und Struktur von Na[Sn2As2], Na0,3Ca0,7[Sn2As2], Na0,6Sr0,6[Sn2As2], Na0,6Ba0,4[Sn2As2] und K0,3Sr0,7[Sn2As2]. ZAAC 1995, 621, 576–582
- Eisenmann and Klein 1991 Eisenmann, B.; Klein, J. Zintl-phases with layer anions: preparation and crystal structures of the isotypic compounds SrSn 2 As 2 and Sr 0.87 Ba 0.13 Sn 2 As 2 and a single crystal structure determination of KSnSb. ZAAC 1991, 598, 93–102
- Laurita and Seshadri 2022 Laurita, G.; Seshadri, R. Chemistry, structure, and function of lone pairs in extended solids. Acc. Chem. Res. 2022, 55, 1004–1014
- Savin et al. 1997 Savin, A.; Nesper, R.; Wengert, S.; Fassler, T. E. Angew. Chem. Int. Ed. Engl. 1997, 36, 1808–1832
- Momma and Izumi 2011 Momma, K.; Izumi, F. VESTA 3 for three-dimensional visualization of crystal, volumetric and morphology data. J. Appl. Cryst. 2011, 44, 1272–1276
- Rodríguez-Carvajal 1993 Rodríguez-Carvajal, J. Recent advances in magnetic structure determination by neutron powder diffraction. Physica B Condens. Matter 1993, 192, 55–69
- Wills 2000 Wills, A. A new protocol for the determination of magnetic structures using simulated annealing and representational analysis (SARAh). Physica B Condens. Matter 2000, 276, 680–681
- McGuire et al. 2008 McGuire, M. A.; Christianson, A. D.; Sefat, A. S.; Sales, B. C.; Lumsden, M. D.; Jin, R.; Payzant, E. A.; Mandrus, D.; Luan, Y.; Keppens, V.; Varadarajan, V.; Brill, J. W.; Hermann, R. P.; Sougrati, M. T.; Grandjean, F.; Long, G. J. Phase transitions in LaFeAsO: Structural, magnetic, elastic, and transport properties, heat capacity and Mössbauer spectra. Phys. Rev. B 2008, 78, 094517
- Fernandes et al. 2014 Fernandes, R.; Chubukov, A.; Schmalian, J. What drives nematic order in iron-based superconductors? Nat. Phys. 2014, 10, 97–104
- Kaneko et al. 2017 Kaneko, U. F.; Gomes, P. F.; García-Flores, A. F.; Yan, J.-Q.; Lograsso, T. A.; Barberis, G. E.; Vaknin, D.; Granado, E. Nematic fluctuations and phase transitions in LaFeAsO: A Raman scattering study. Phys. Rev. B 2017, 96, 014506
- Canfield et al. 2016 Canfield, P. C.; Kong, T.; Kaluarachchi, U. S.; Jo, N. H. Use of frit-disc crucibles for routine and exploratory solution growth of single crystalline samples. Phil. Mag. 2016, 96, 84
- Hafner and Kresse 1994 Hafner, J.; Kresse, G. Phys. Rev. B 1994, 49, 14251
- Perdew et al. 1996 Perdew, J. P.; Burke, K.; Ernzerhof, M. Phys. Rev. Lett. 1996, 77, 3865
- Dion et al. 2004 Dion, M.; Rydberg, H.; Schröder, E.; Langreth, D. C.; Lundqvist, B. I. Van der Waals Density Functional for General Geometries. Phys. Rev. Lett. 2004, 92, 246401
- Thonhauser et al. 2007 Thonhauser, T.; Cooper, V. R.; Li, S.; Puzder, A.; Hyldgaard, P.; Langreth, D. C. Van der Waals density functional: Self-consistent potential and the nature of the van der Waals bond. Phys. Rev. B 2007, 76, 125112
- Klimeš et al. 2011 Klimeš, J. c. v.; Bowler, D. R.; Michaelides, A. Van der Waals density functionals applied to solids. Phys. Rev. B 2011, 83, 195131
- Ovchinnikov et al. 2021 Ovchinnikov, D.; Huang, X.; Lin, Z.; Fei, Z.; Cai, J.; Song, T.; He, M.; Jiang, Q.; Wang, C.; Li, H.; Wang, Y.; Wu, Y.; Xiao, D.; Chu, J.-H.; Yan, J.; Chang, C.-Z.; Cui, Y.-T.; Xu, X. Intertwined Topological and Magnetic Orders in Atomically Thin Chern Insulator MnBi2Te4. Nano Lett. 2021, 21, 2544–2550