Detecting Subtle Differences between Human and Model Languages Using Spectrum of Relative Likelihood
Abstract
Human and model-generated texts can be distinguished by examining the magnitude of likelihood in language. However, it is becoming increasingly difficult as language model’s capabilities of generating human-like texts keep evolving. This study provides a new perspective by using the relative likelihood values instead of absolute ones, and extracting useful features from the spectrum-view of likelihood for the human-model text detection task. We propose a detection procedure with two classification methods, supervised and heuristic-based, respectively, which results in competitive performances with previous zero-shot detection methods and a new state-of-the-art on short-text detection. Our method can also reveal subtle differences between human and model languages, which find theoretical roots in psycholinguistics studies. Our code is available at https://github.com/CLCS-SUSTech/FourierGPT.
Detecting Subtle Differences between Human and Model Languages Using Spectrum of Relative Likelihood
Yang Xu1,*, Yu Wang2, Hao An1, Zhichen Liu1, Yongyuan Li1, 1Department of Computer Science and Engineering, Southern University of Science and Technology 2Bielefeld University, *Correspondence: xuyang@sustech.edu.cn
1 Introduction
One of the recent endeavors in natural language generation is to develop effective methods of detecting model-generated texts from real human texts. The current most effective methods for this task utilize the likelihood information in text data. More specifically, most existing methods rely on the observation that the absolute likelihood values of texts naturally distribute differently, depending on their sources. Examples include the early work like GLTR (Gehrmann et al., 2019) and more recent ones like DetectGPT (Mitchell et al., 2023) and Fast-DetectGPT (Bao et al., 2024).
However, existing methods have the following limitations: First, most work estimates likelihood as a static property of language, but overlooks the fact that human language processing is a dynamic process during which the likelihood of information under processing is bound to certain linguistic and cognitive constraints. For example, the trade-off between processing effort and likelihood of words (Levy, 2008; Smith and Levy, 2013), limited attention focus, activation decay Lewis et al. (2006) and so on. Second, merely using the absolute likelihood values to distinguish generated and human texts is a tricky “cat and mouse game” – as models’ capability of mimicking human language keeps growing, their productions would eventually become hardly distinguishable. Third, current methods are not computationally economical, because most of them need to run at least one time of inference on text with a fairly large language model.
We propose a human-model text detection approach that addresses the aforementioned issues and achieves better or competitive performance with existing methods. Our approach extracts features from the spectrum view of relative likelihood scores of texts, to capture the dynamic changes of likelihood in language. These features are used to design two types of classifiers, a supervised learning-based one and a heuristic-based zero-shot one, both of which reach impressive performances. The core idea is to obtain the spectrum of likelihood using the Fourier transform, which summarizes the complex patterns of likelihood change in time domain into a much more compact view that magnifies the subtle differences between different texts. It has a theoretical basis in psycholinguistic studies on surprisal (likelihood) distribution in natural language. Further, our method is still effective when likelihood scores are estimated by naïve n-gram models, which places much less computational cost. We name our approach FourierGPT, inspired by existing methods like DetectGPT and Fast-DetectGPT.
2 Related Work
2.1 Likelihood-based zero-shot text detection
“Zero-shot” means the text detection is cast not as a supervised classification task, but rather a statistics-based detection task. Early works directly use the magnitude of token-level likelihood scores. For example, Gehrmann et al. (2019) renders the likelihood value of tokens to human-readable color schemes, which creates good visual distinction between GPT-2 generated text and real human texts. Token ranks based on their log-likelihood scores (LogRank) are used for the same task (Solaiman et al., 2019).
Recent works develop more advanced statistics based on deeper insights into the distributional difference between human-created and model-generated languages in log-likelihood space. For example, Mitchell et al. (2023) finds that the probability distribution of model-generated text tends to lie under the areas of negative curvature of the log-likelihood function, and in contrast, human text tends not. Based on this finding, they propose DetectGPT, a zero-shot detection method that measures perturbation discrepency, the gap between an original text and its rewritten variant that maintains the same meaning. The assumption is that human text presents smaller gaps than model text. Bao et al. (2024) make substantial methodological improvements to DetectGPT and propose Fast-DetectGPT by replacing the probability curvature with conditional probability curvature, which broadly improves the detection accuracy and greatly shorten the computational time. Therefore, Fast-DetectGPT is the main state-of-the-art method compared with in this study. In nature, both DetectGPT and Fast-DetectGPT find an empirical threshold for the variance of absolute likelihood values, which depend on the choice of the inference model.
2.2 Surprisal and likelihood of language
The way likelihood scores are defined in the previous section is equivalent to the concepts of “surprisal” and “information density”, which are commonly used interchangeably in the psycholinguistics literature. Surprisal is known to reflect the cognitive load of processing a word, phrase, or sentence – it takes more effort and time to produce and comprehend units of higher surprisal, such as rare words Hale (2001). There is a preference in human language to keep the surprisal intensity evenly distributed in time, known as uniform information density (UID) (Jaeger, 2010), or entropy rate constancy (ERC) (Genzel and Charniak, 2002, 2003). This preference is an outcome of the speaker/writer’s intention to make the listener’s comprehension easier, which, therefore, draws a potential connection to the topic of this study – is this preference learned by language models? Another relevant work is Xu and Reitter (2017)’s finding that periodicity of surprisal exists in natural language, which can be captured by spectrum analysis methods and be used to predict the interaction outcome of dialogue partners.
Understanding the human mind’s preference and tendency in handling surprisal/likelihood leads to new ideas for natural language generation techniques. For example, some recent endeavors build on top of the assumption that model-generated language appears more natural and human-like if it is generated through a decoding algorithm that follows the UID theory, such as the beam search algorithm as evidenced in Meister et al. (2020); or it falls under the so-called stable entropy zone (Arora et al., 2023); Meister et al. (2023) propose locally typical sampling, which enforces the uniform distribution of likelihood during the generation process, and results in generated texts that are more aligned with human texts.
2.3 Evaluation of natural language generation with likelihood
The task of evaluating natural language generation (NLG) is essentially related to the text detection task. Therefore, likelihood (and its variants) is a natural option here. Early works in NLG often frame the evaluation equivalent to a detection task, which treats human text as gold-standard, and uses the “distance” from human text to measure the quality of generated text. For example, Ippolito et al. (2020) uses total probability as a measurement and Holtzman et al. (2020) compares the generation perplexity and Zipf coefficient (Zipf, 1949) (closely related to LogRank) of texts from different sampling methods. These works are very similar in methodology to those reviewed in Section 2.1, only except that they did not emphasize detection accuracy, but focused on “quality control” of generation.
Some recent evaluation metrics compare model text with human text in high dimensional space, such as MAUVE (Pillutla et al., 2021). While this type of method does not directly use likelihood information, interesting correlations have been found between likelihood-based metrics. For example, Yang et al. (2023b) proposes a novel evaluation metric called Fourier analysis of cross-entropy (FACE), which converts the cross-entropy scores (i.e., likelihood) to spectrum representations and then measures the distances in frequency-domain. The resulted distance scores can reflect generation qualities that are co-examined with other metrics, such as MAUVE, and align well with human judgements. This work indicates that with proper transformation on simple likelihood scores, rich insights about language use are viable. In fact, the text detection method proposed in this study is directly inspired by Yang et al.’s work (2023b).
3 Method
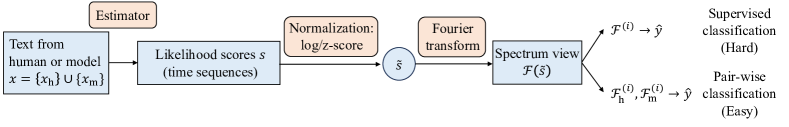
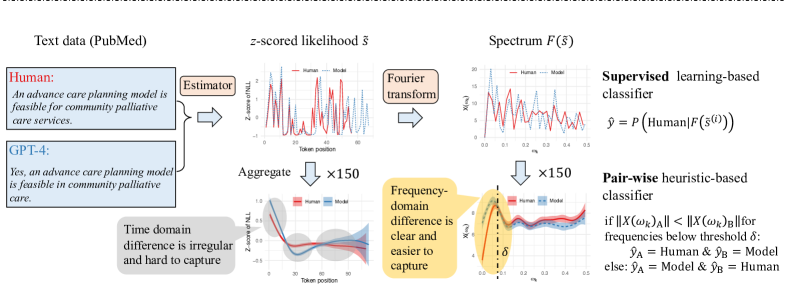
The procedure of FourierGPT consists of three steps: 1) Estimate and normalize likelihood scores; 2) Carry out Fourier transform to get the spectrum view; 3) Conduct classification on the spectrum. The procedure is illustrated in Figure 1 with an example. Details of each step are described below.
3.1 Estimation and normalization of likelihood scores
We estimate the likelihood scores of text data with pretrained language models of various scales: Mistral-7B (Jiang et al., 2023), GPT-2 families (Radford et al., 2019), and a bigram language model trained from scratch. We use the implementation of bigram model from Heafield (2011) and train it on a subset of C4 dataset (Raffel et al., 2019). Raw likelihood scores are estimated by running a forward pass on the input text. Taking an input of tokens, , the likelihood score of th token is computed by , i.e., the negative log probability returned by the language model, which we call the estimator model.
Then we normalize the raw likelihood scores within each sequence, obtaining the -scored likelihood , in which , and . Here we would like to stress that this seemingly trivial normalization step is actually critical for verifying the hypothesis of this study: the raw likelihood ’s value depends on the choice of estimator – larger models usually result in smaller values (similar to perplexity); but the -scored characterizes the relative level of likelihood within the range , which is less dependent on the estimator. As expected, the distribution of raw likelihood is highly skewed, while the -scored likelihood is closer to normal distribution and gives better classification results in the following steps.
We also find that -score normalization before the Fourier transform is supported by practices in signal processing. Reno et al. (2018) points out the secondary motion imaging artifact: when a time series consists of high and low-frequency components of different intensities, the vanilla Fourier transformed spectrum will be dominated by the low-frequency component, and normalization can eliminate this artifact.
3.2 Fourier transform
The next step is to obtain the spectrum view of the -scored likelihood sequence as input. We apply discrete Fourier transform (DFT) according to the following:
| (1) |
The result is a set of complex numbers as the frequency-domain representation of the input time-domain signal (likelihood scores), in which is the -th frequency component. We change the starting index of to 0 because DFT requires as the lowest frequency component. is a complex number made up of real and imaginary parts, . The norm represents the intensity of the th component . Finally, we use the sequence as the spectrum-view of likelihood, which provides features for the next classification step.
The range of is , and its interpretation is not trivial. Based on an intuitive interpretation provided by Yang et al. (2023b), we can roughly tell that the likelihood score at the level of tends to occur every tokens in the text data. Interestingly, we find the way distributes along provides unique information to distinguish human from model. To develop solid explanations of what the spectrum of likelihood means is important, yet a different topic. We primarily focus on harnessing the spectrum information for the detection task, and try to do gain some interpretive insights at our best in Section 5.
3.3 Classification methods
We use two classification methods for the text detection task: A supervised learning-based classifier trained from the entire labeled spectrum data, which makes a binary prediction (human or model) on any given input spectrum representation; and a pair-wise heuristic-based classifier that tells which one is from human (hence the other one is from a model) in any given pair of input spectrum representations. For the pair-wise classifier, we require that the input pair must come from the same text prompt, which guarantees that one of them is from human and the other one is from model. It is obvious to see that the supervised classifier is more difficult to train as no prior information is given.
3.3.1 Supervised learning-based classifier
We train the supervised classifier using an augmented spectrum as input feature, which is obtained with multiple rounds of circularization operation on the likelihood scores: given an original time series of likelihood scores , circularization at step is to chop off the segment of length at the head and then append it to the end, resulting in a new series . See the following complete procedure:
Next, we apply Fourier transform to each circularized likelihood sequence, which produces spectra in total, , . The average spectrum is used as the input feature for training the classifier. Lastly, we train several common types of classification models and evaluate their performances in Section 4.2. The circularization operation draws inspiration from the circular convolution in digital signal processing (Elliott, 2013). The intuition is: if a weak periodicity exists in the original “signal” , then obtaining multiple spectra from its multiple variants ( through ) should amplify the periodicity that is undetectable otherwise. From a machine learning perspective, it is like a way of data augmentation, which picks the most salient features by aggregating multiple variants of the original data.
3.3.2 Pair-wise Heuristic-based classifier
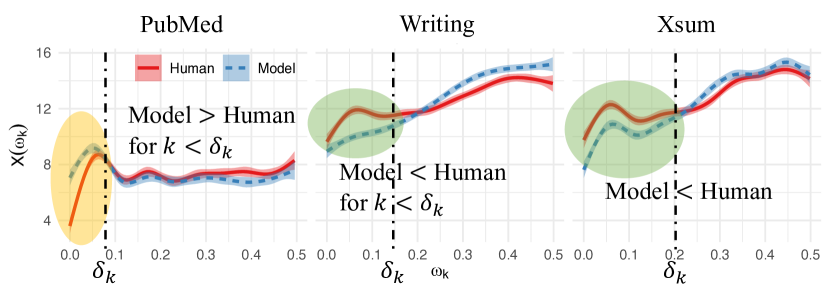
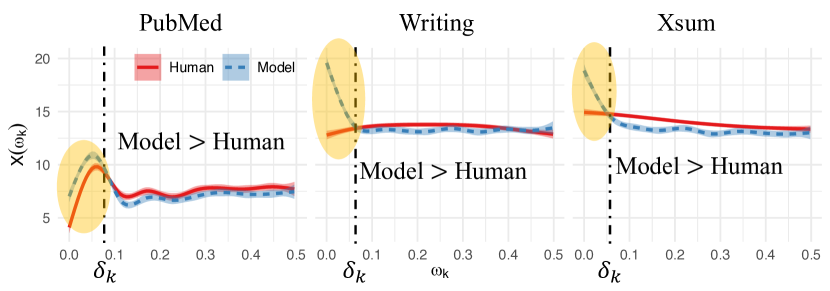
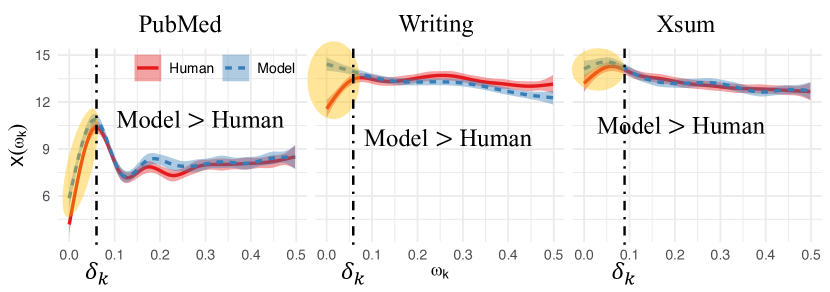
We design a set of classifiers based on an empirical heuristic obtained by observing the difference between human and model’s spectrum views: the likelihood spectrum presents a salient difference at the low-frequency end. The direction of difference slightly varies across dataset model groups, but for most groups, the model’s spectrum has a larger power amplitude than the human’s, except for GPT-4 on Writing and Xsum (see Figure 2).
The heuristic is expressed as follows:
in which is an integer threshold defining the range of frequency components selected for comparing the spectrum power s.t. , and its value is determined empirically in each dataset group. is a real number threshold characterizing the observed difference in between human and model, which is also determined empirically. A larger value means a more strict standard for distinguishing and . In our experiments, we use for convenience.
4 Experiment Results
4.1 Datasets
We use the text detection datasets provided by Bao et al. (2024), which follows the experiment settings of Mitchell et al. (2023). It makes sure that all comparisons made to the previous methods are valid and consistent. The datasets text prompts are gathered from three sources: PubMedQA dataset (Jin et al., 2019) which consists of 273.5k human experts’ answers to biomedical research questions; Reddit WritingPrompts dataset (Fan et al., 2018) which includes 300k human-written stories with prompts; XSum dataset Narayan et al. (2018) which contains human-written summarization of 226.7k online articles in British Broadcasting Corporation (BBC). The datasets are compiled by Bao et al. (2024), using the OpenAI API111https://openai.com/blog/openai-api. Three APIs are used for generation: GPT-4, GPT-3.5 (ChatGPT), and GPT-3 (Davinci). Each one of the three datasets (PubMed, Writing, and Xsum) contains 150 pairs of human and model texts. Each pair shares the first 30 tokens and differs afterward. Therefore, our main experiments work on 3 (genres) 3 (generation models) conditions.
| Dataset | Gen. model | Best acc. | Classifier |
|---|---|---|---|
| PubMed | GPT-4 | 0.8267 | SVM |
| GPT-3.5 | 0.6000 | SVM | |
| GPT-3 | 0.5800 | HGBT | |
| Writing | GPT-4 | 0.7167 | NB |
| GPT-3.5 | 0.7500 | NB | |
| GPT-3 | 0.8267 | SVM | |
| Xsum | GPT-4 | 0.7400 | SVM |
| GPT-3.5 | 0.7500 | SVM | |
| GPT-3 | 0.7400 | SVM |
| Method | PubMed | Writing | Avg. |
|---|---|---|---|
| GPT-4 | GPT-3 | ||
| Likelihood | 0.8104 | 0.8496 | 0.8300 |
| LogRank | 0.8003 | 0.8320 | 0.8162 |
| DNA-GPT | 0.7565 | 0.8354 | 0.7960 |
| NPR | 0.6328 | 0.7847 | 0.7088 |
| DetectGPT | 0.6805 | 0.7818 | 0.7312 |
| Fast-Detect | 0.8503 | 0.9568 | 0.9036 |
| FourierGPT | 0.8267 | 0.8267 | 0.8267 |
4.2 Supervised learning-based classification
Six common classification models are trained and evaluated using 5-fold cross-validation, and we find that the Support Vector Machine (SVM) model achieves the best overall performance. The accuracy scores of SVM on all datasets are shown in Table 1. It can be seen that our method performs particularly well for the PubMed dataset, which achieves an above 80% accuracy score, as compared to the scores around 70% for the other two datasets. This indicates that the supervised classifier can learn features in short texts better than in longer ones.
Although our best scores on PubMed are lower than the state-of-the-art from Fast-DetectGPT (see Table 3), we think this is still an impressive result because it outperforms most of the other previous methods that use absolute likelihood scores for detection, and the gap from SOTA is small. We list the comparison on PubMed (GPT-4) and Writing (GPT-3) in Table 2.
| Dataset | Gen. model | FourierGPT | Est. model | Fast-Detect | Likelihood | GPTZero | |
|---|---|---|---|---|---|---|---|
| PubMed | GPT-4 | 0.9133 | 3 | GPT2-xl | 0.8503 | 0.8104 | 0.8482 |
| GPT-3.5 | 0.9467 | 2 | Mistral | 0.9021 | 0.8775 | 0.8799 | |
| GPT-3 | 0.6867 | 5 | Mistral | 0.7225 | 0.5668 | 0.4246 | |
| Writing | GPT-4 | 0.8467 | 23 | GPT2-xl | 0.9612 | 0.8553 | 0.8262 |
| GPT-3.5 | 0.9200 | 30 | Mistral | 0.9916 | 0.9740 | 0.9292 | |
| GPT-3 | 0.7200 | 6 | Mistral | 0.9568 | 0.8496 | 0.6009 | |
| Xsum | GPT-4 | 0.8733 | 29 | GPT2-xl | 0.9067 | 0.7980 | 0.9815 |
| GPT-3.5 | 0.9200 | 24 | GPT2-xl | 0.9907 | 0.9578 | 0.9952 | |
| GPT-3 | 0.6067 | 13 | GPT2-xl | 0.9396 | 0.8370 | 0.4860 |
4.3 Pair-wise heuristic-based classification
The pair-wise heuristic-based classification results are shown in Table 3. For a comprehensive comparison, we include the second-best performing open-source method Likelihood and a commercial detection solution GPTZero (Tian and Cui, 2023) in the table. Our method performs generally better on GPT-4 and GPT-3.5 groups: it outperforms the state-of-the-art Fast-DetectGPT on PubMed data, though not as good in Writing or Xsum. Yet, the performance on the latter two datasets is quite competitive to the second-best previous method.
Similar to the supervised classifier, we also experiment with heuristic-based classifiers using likelihood scores estimated from bigram models, whose accuracy results are shown in Table 4. It has surprisingly good performance on Writing data: the accuracy on Writing+GPT-3.5 reaches 0.9067, which is better than Fast-DetectGPT.
| Dataset | Best group | Best acc. | Avg. acc. |
|---|---|---|---|
| Pubmed | GPT-3 | 0.6733 | 0.6511 |
| Writing | GPT-3.5 | 0.9067 | 0.7867 |
| Xsum | GPT-3.5 | 0.7800 | 0.7289 |
5 Discussion: Text Features Affects Spectrum of Likelihood
The purpose of this section is to investigate why the spectrum view of relative likelihood scores can be used to distinguish texts from humans and models. What specific features in the text are reflected in the frequency-domain? Can we know more about what language models learned (and did not learn) from humans by reading their likelihood spectrum? With these questions in mind, we present some interesting patterns discovered.
| Group | Start w/ “Yes” | Start w/ “No” |
|---|---|---|
| GPT-4 | 78/150 | 10/150 |
| GPT-3.5 | 35/150 | 2/150 |
| Davinci | 32/150 | 32/150 |
| Human | 0/150 | 0/150 |
5.1 Answers starting with “yes/no”
We find that in PubMed data, model-generated answers are much more likely to start with a fixed pattern of “Yes”/“No”, while humans do not answer in this style at all (at least in the current data). The ratios of answers with this pattern are listed in Table 5. Since each model group comes with a different set of 150 human question/answer texts, the total odds of the human group is as low as 0/450.
This is an interesting finding because it indicates the tendency of models to generate texts of high certainty: when the prompt is in an explicit form like “Question: …”, then the model tends to address it first by giving a certain answer like “Yes” or “No”. On the other side, human answers sound less confident and tend to avoid certainty. We conjecture that this finding could be due to the general tendency of human language to use more hedging and avoid over-confidence, particularly in face of difficult questions such as the highly professional ones in PubMed.
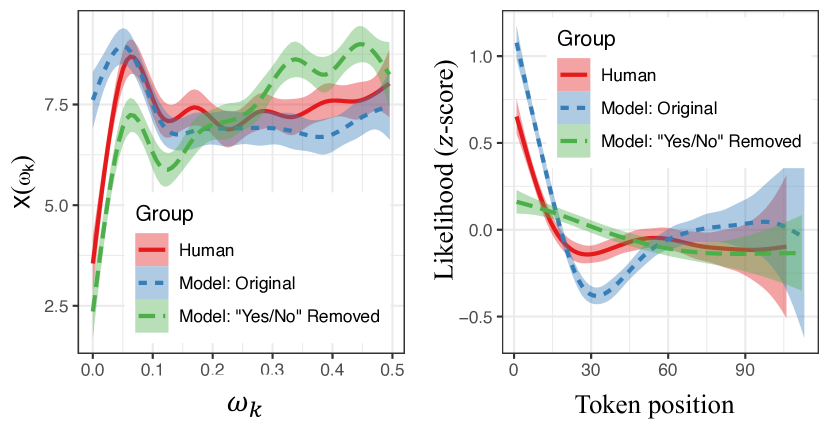
We use a simple ablation experiment on data to examine whether this subtle difference is reflected in the spectrum of likelihood. We remove the “Yes”/“No” at the beginning of the answer, re-computing the likelihood scores, and re-do the Fourier transform. Consequently, the spectrum of the model morphs in shape towards the direction of human (Figure 3 (left)): the altered GPT-4 data’s low-frequency components drop, and the high ends rise, both towards the direction of human. To showcase the advantage of spectrum view, we also plot the -scored likelihood against token position (Figure 3 (right)), which shows that removing “Yes”/“No” makes the likelihood curve flatter (thus, closer to human), but this change is not as easy to describe as the spectrum. In sum, the subtle differences between human and model languages, like the “Yes”/“No” use discussed here, can be reflected in likelihood space, and the spectrum view can capture this difference conveniently.
5.2 Text lengths effect
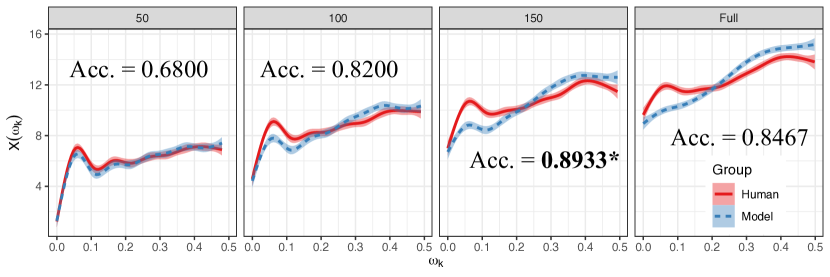
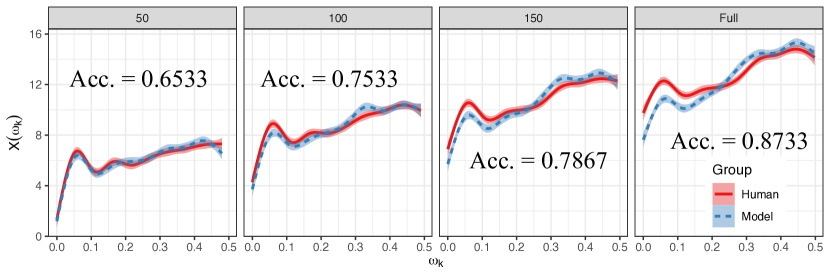
It is pointed out in previous work that zero-shot detectors are supposed to perform worse on short text because shorter text means fewer data points to compute the likelihood-based statistics (Bao et al., 2024). We examine the effect of text length on FourierGPT’s performance, by using only the first tokens for the entire classification procedure on Writing and Xsum datasets. As PubMed data are already short, with the mean length of the answer part being words, they are not included in the experiment.
From Figure 4 it can be seen that shorter texts indeed result in more indistinguishable spectrum shapes between human and model. Surprisingly, however, when we use the cut-off token count on Writing data, the pair-wise classifier’s accuracy increases by a significant percentage, even better than using full length. It strengthens the finding on PubMed that likelihood spectrum better captures the characteristics of short texts.
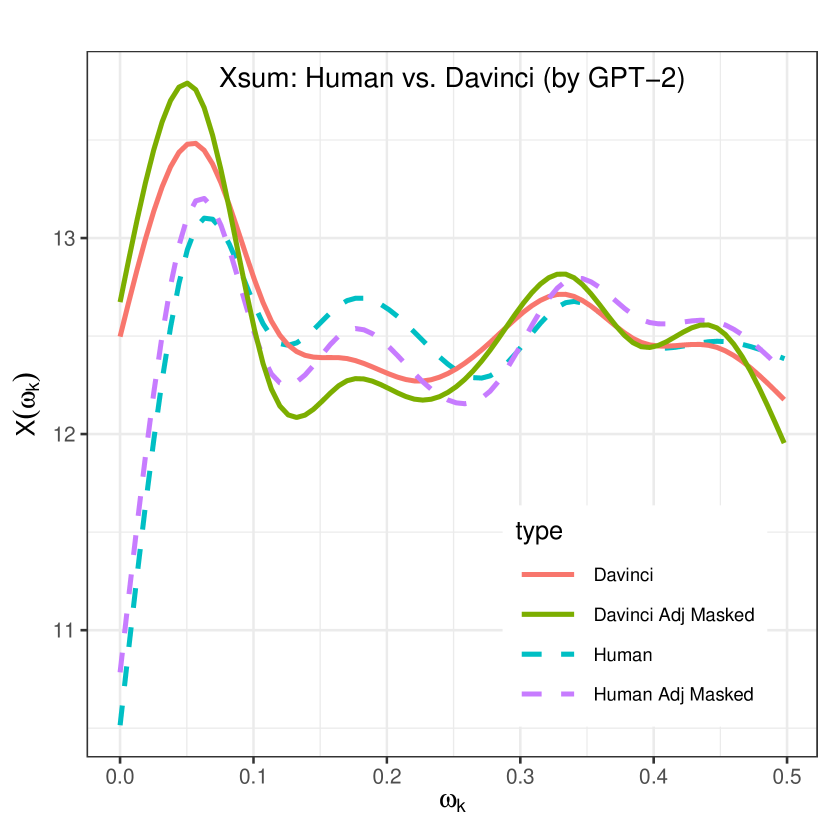
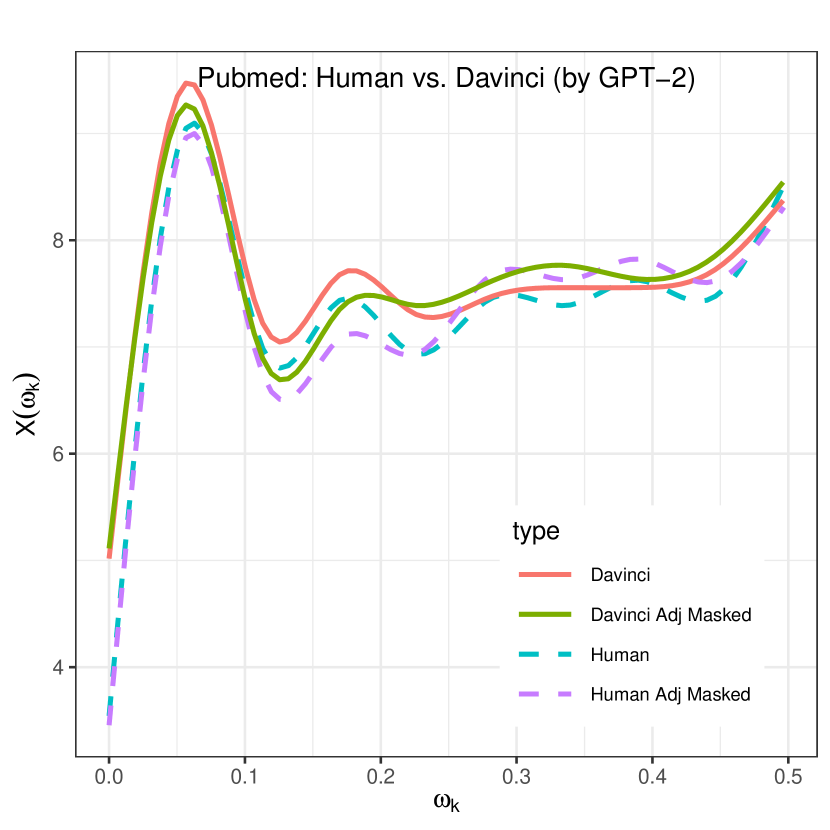
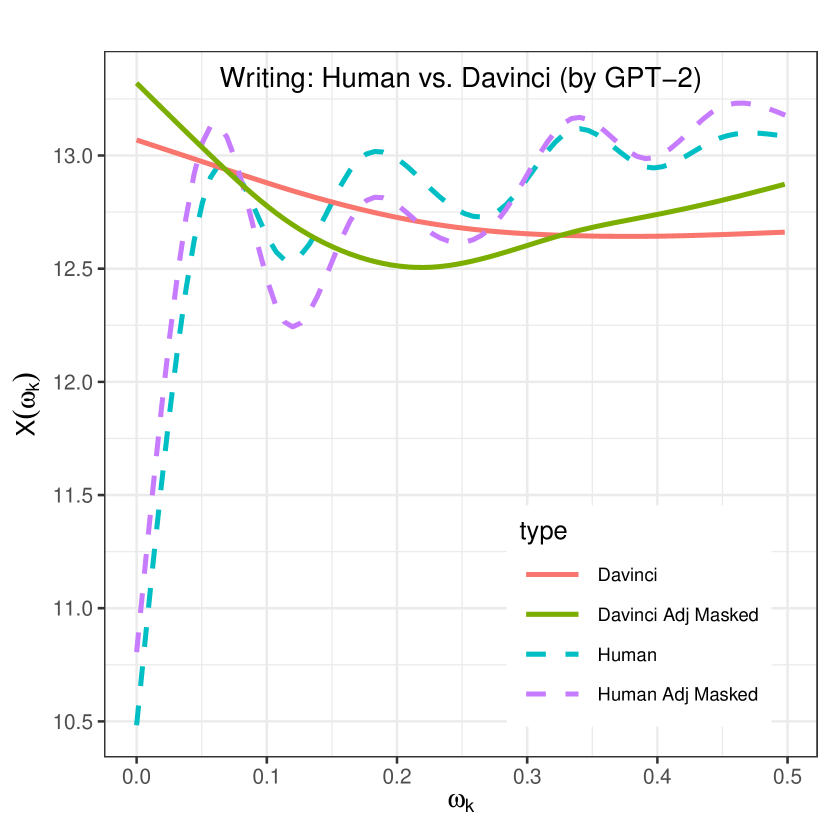
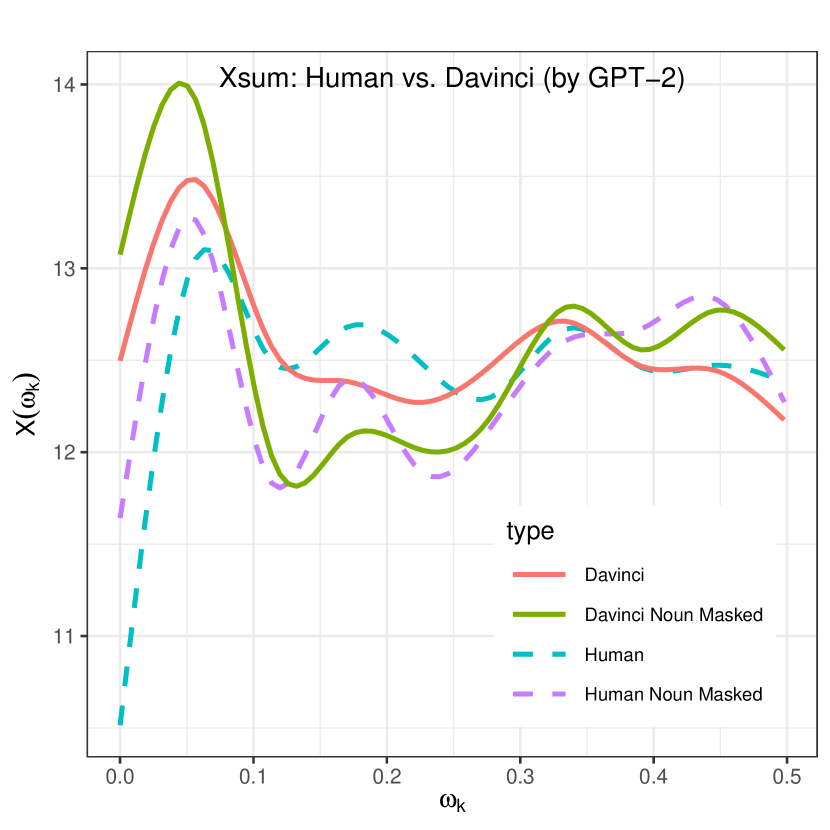
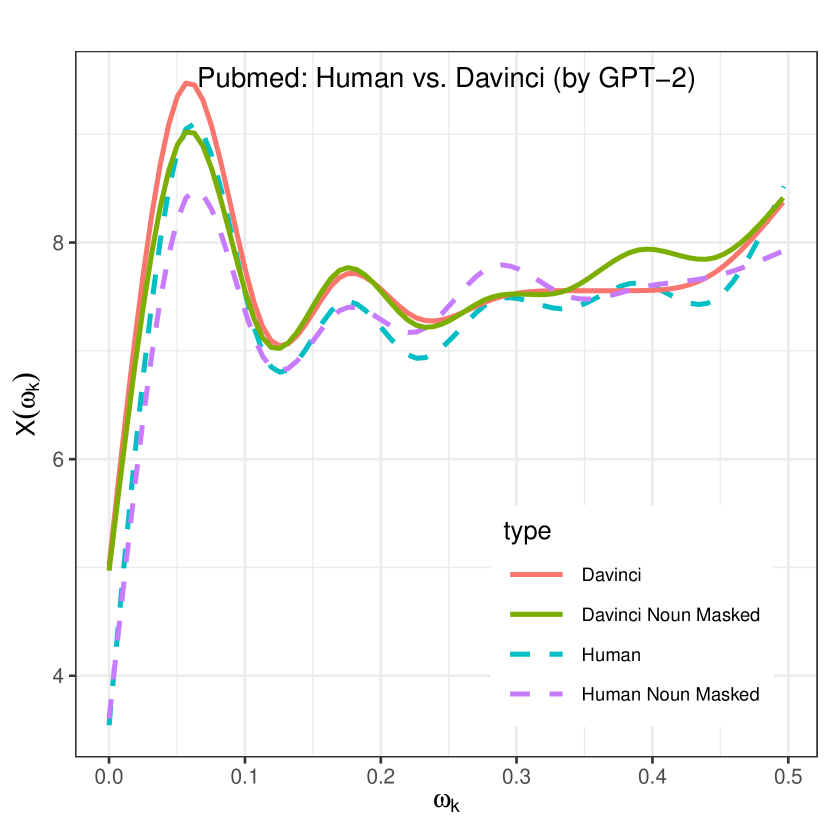
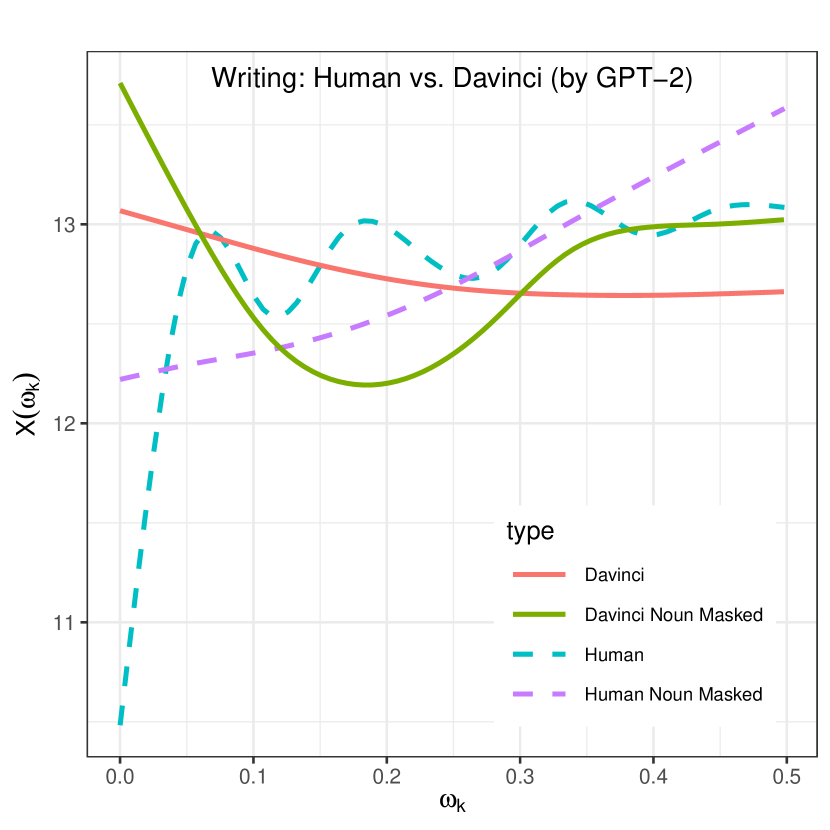
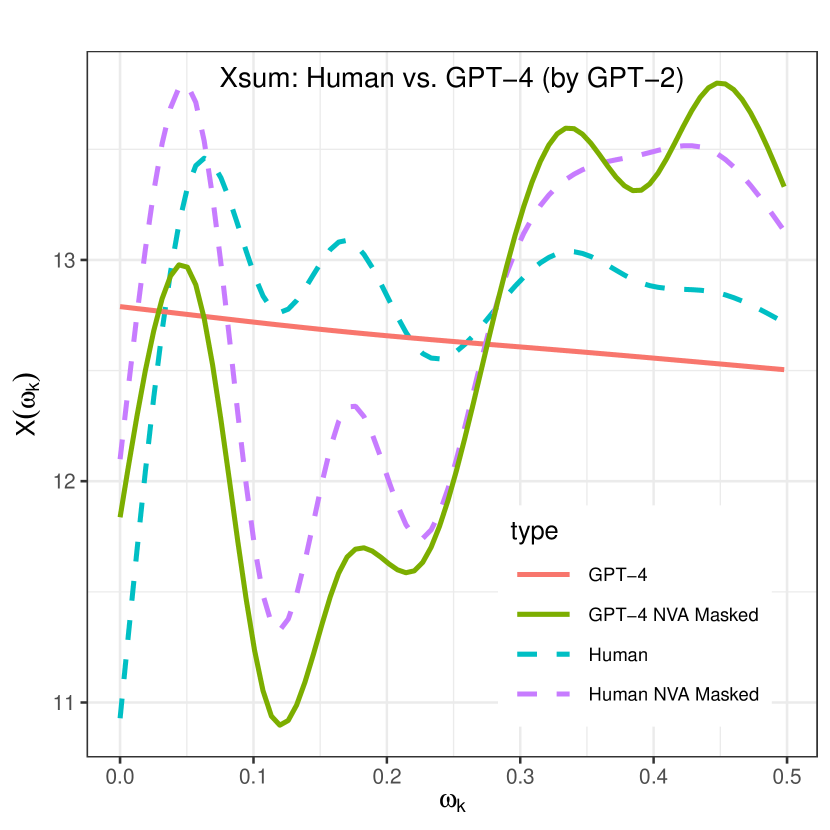
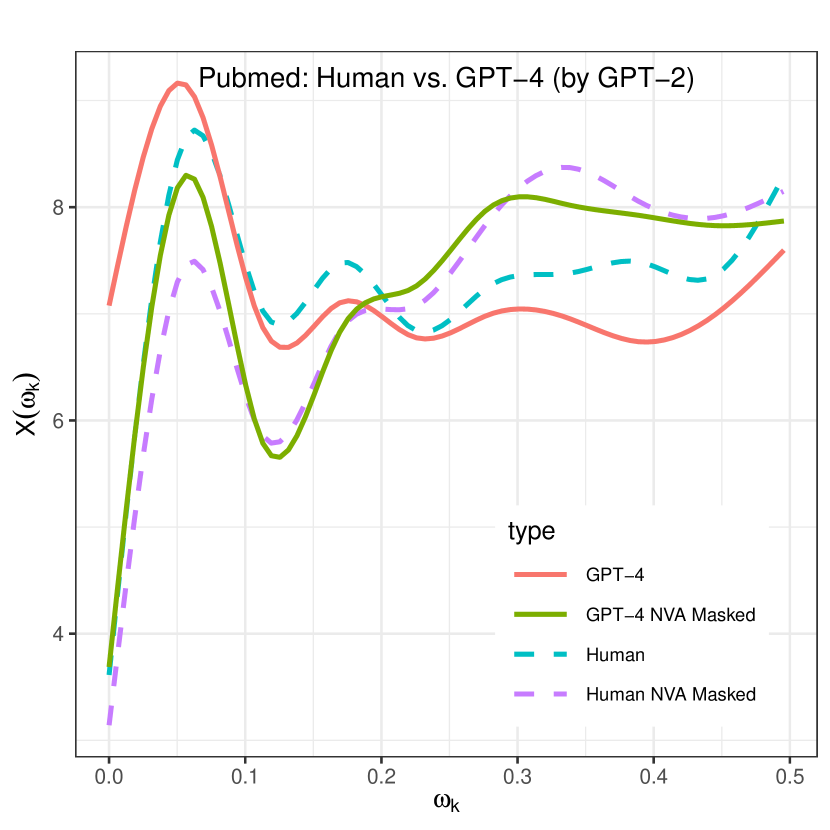
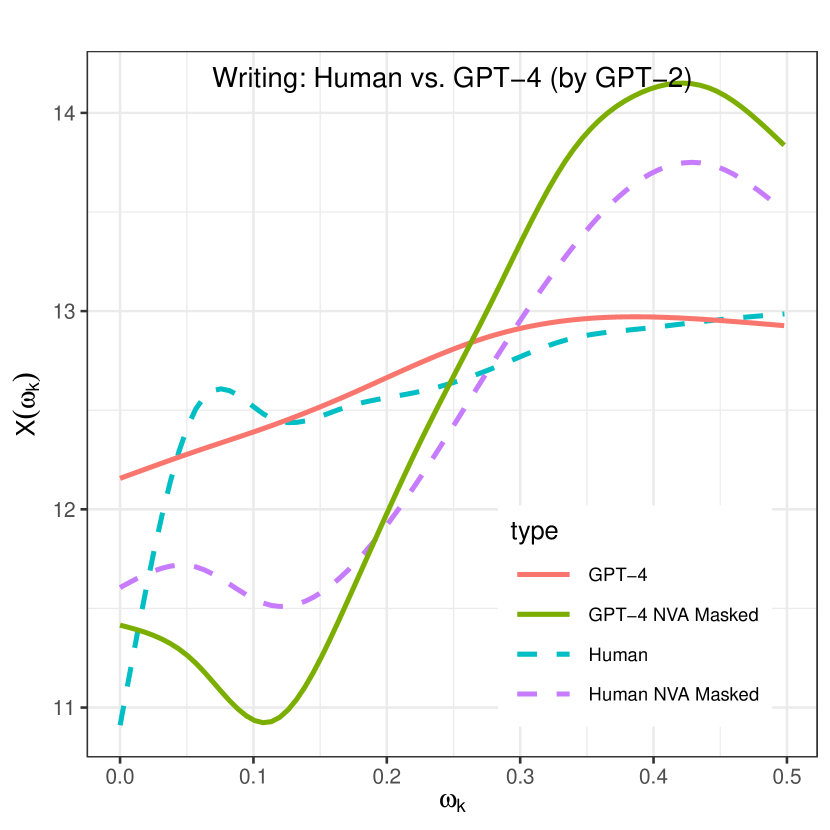
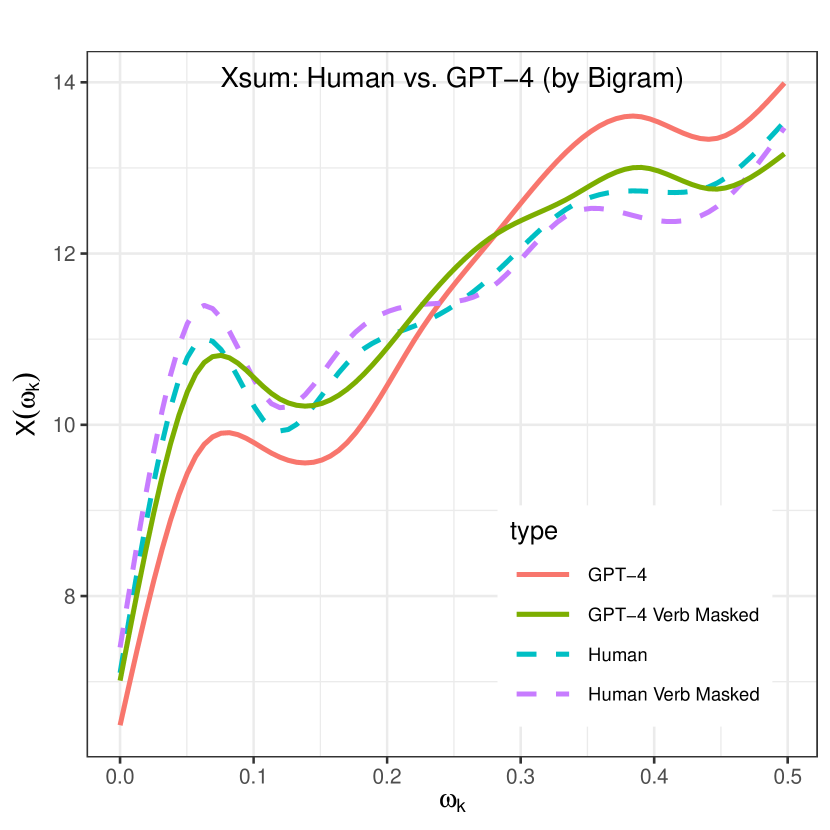
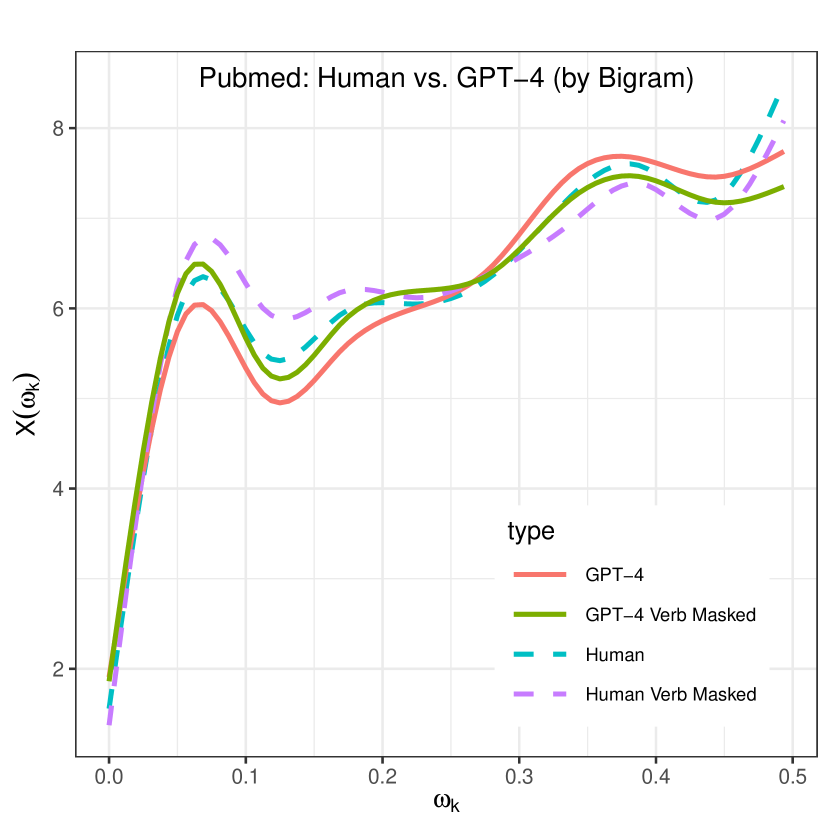
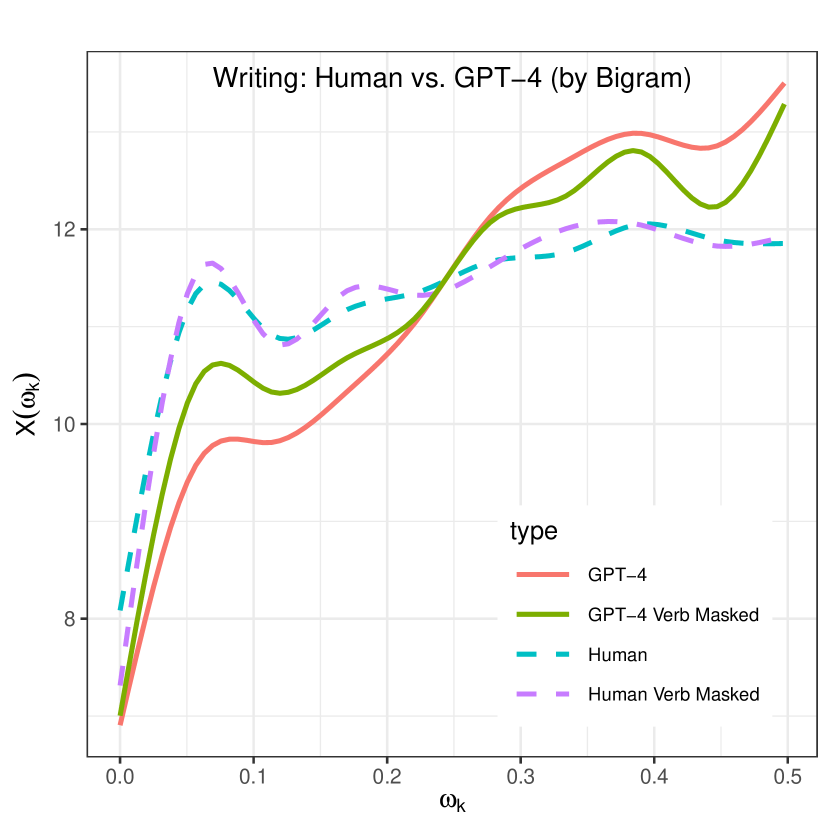
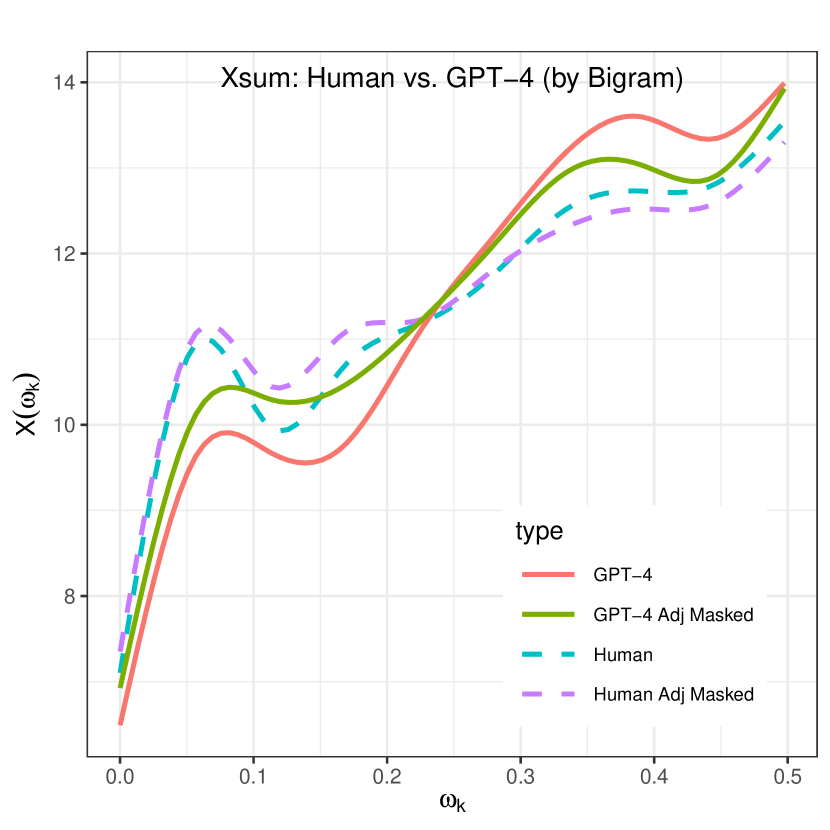
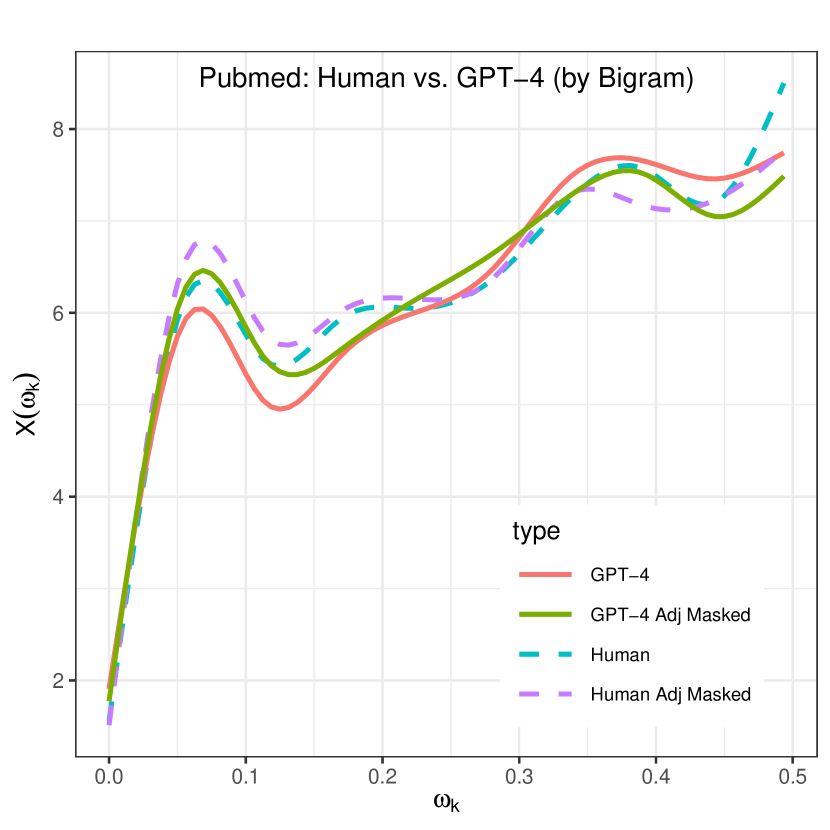
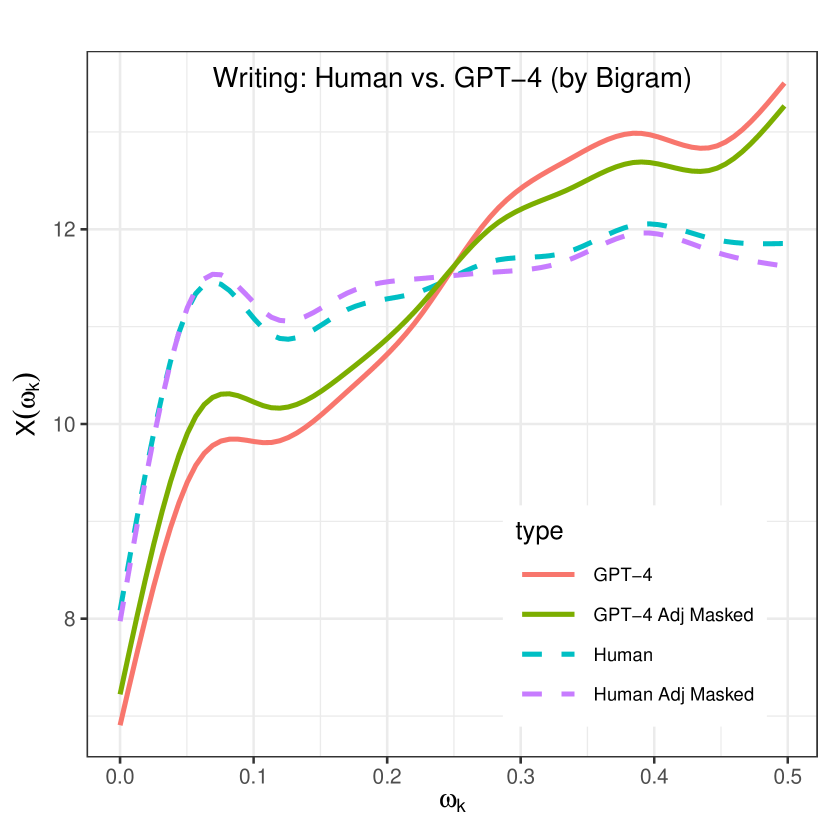
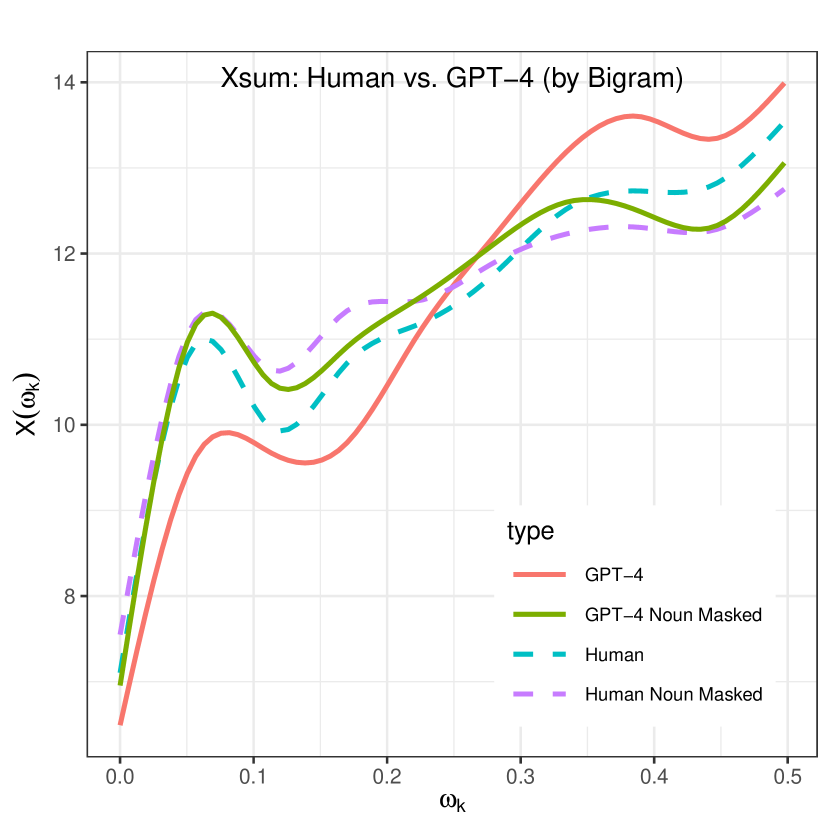
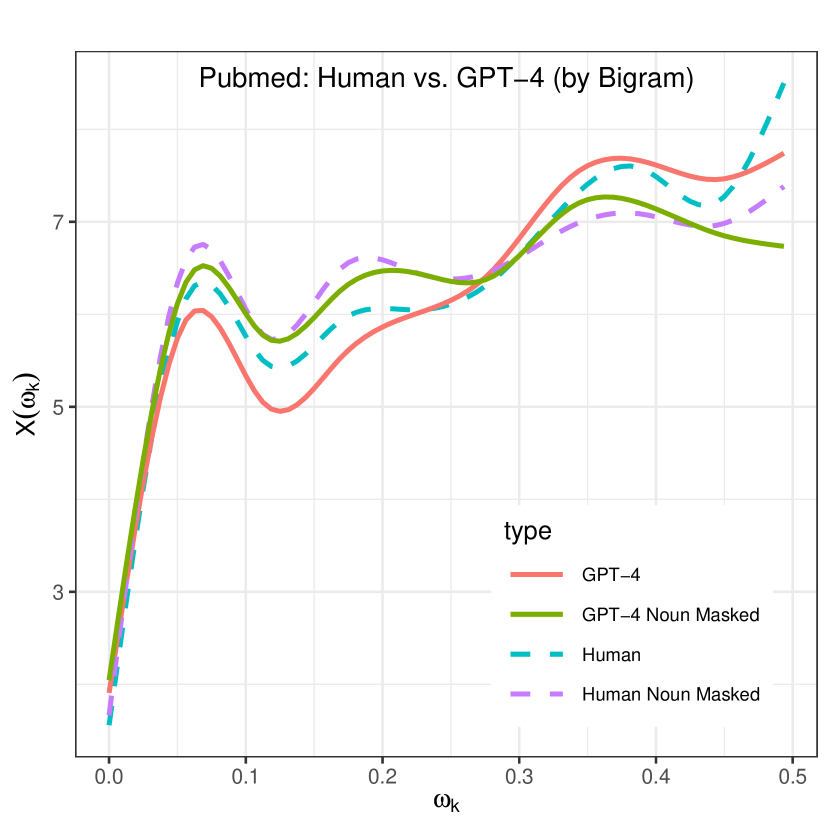
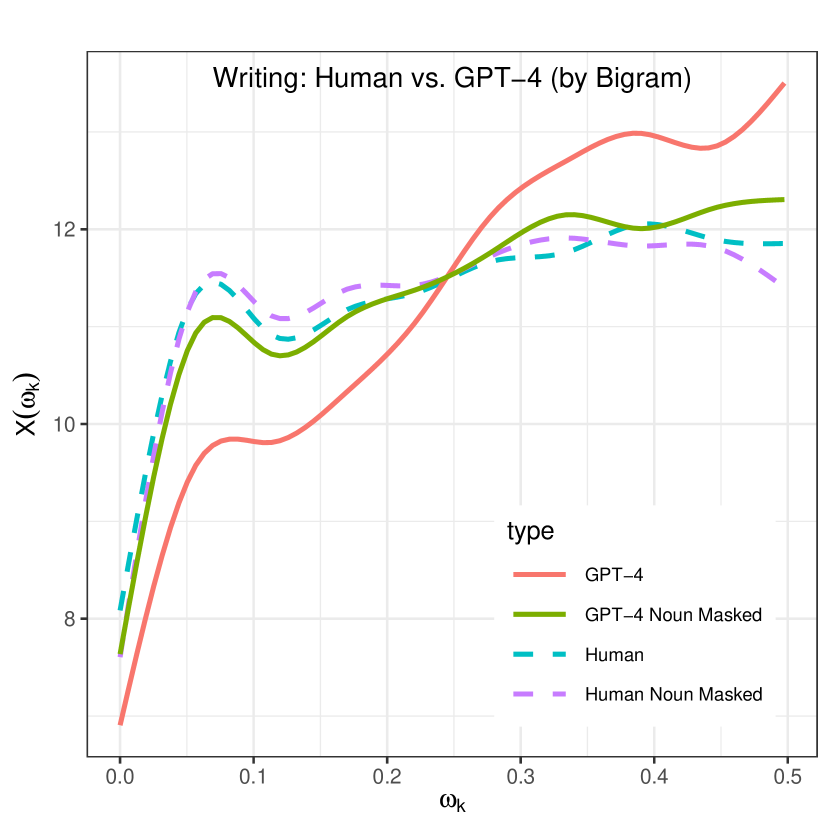
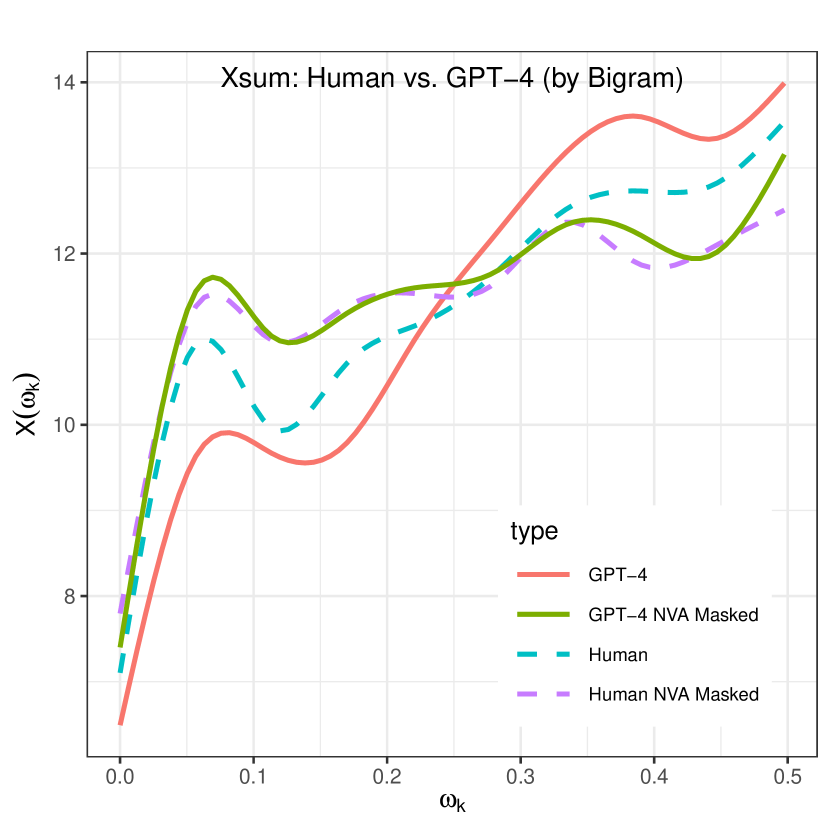
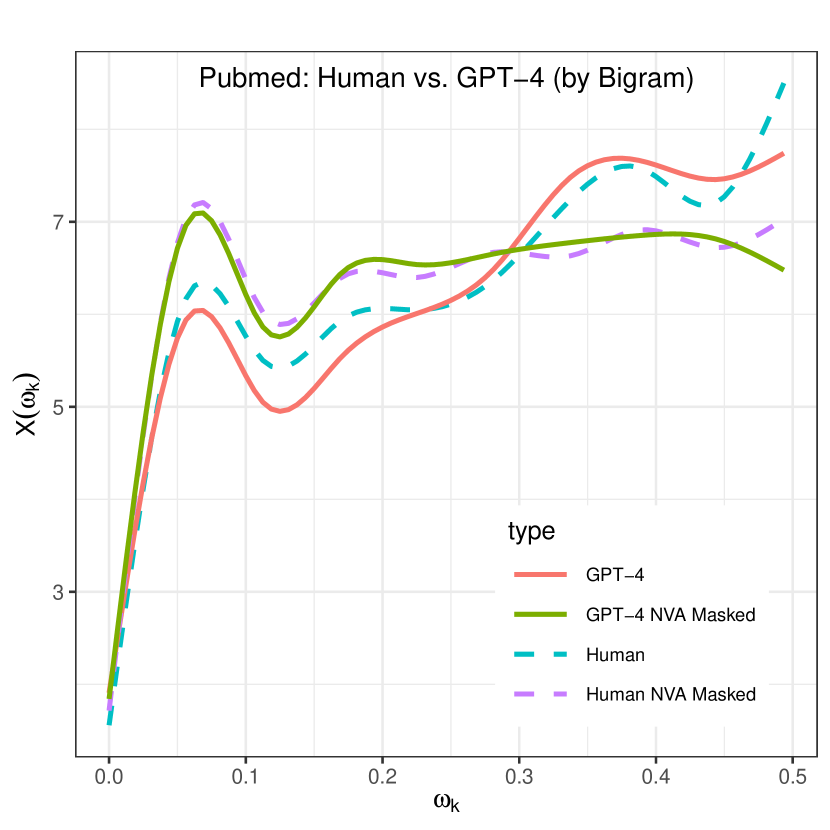
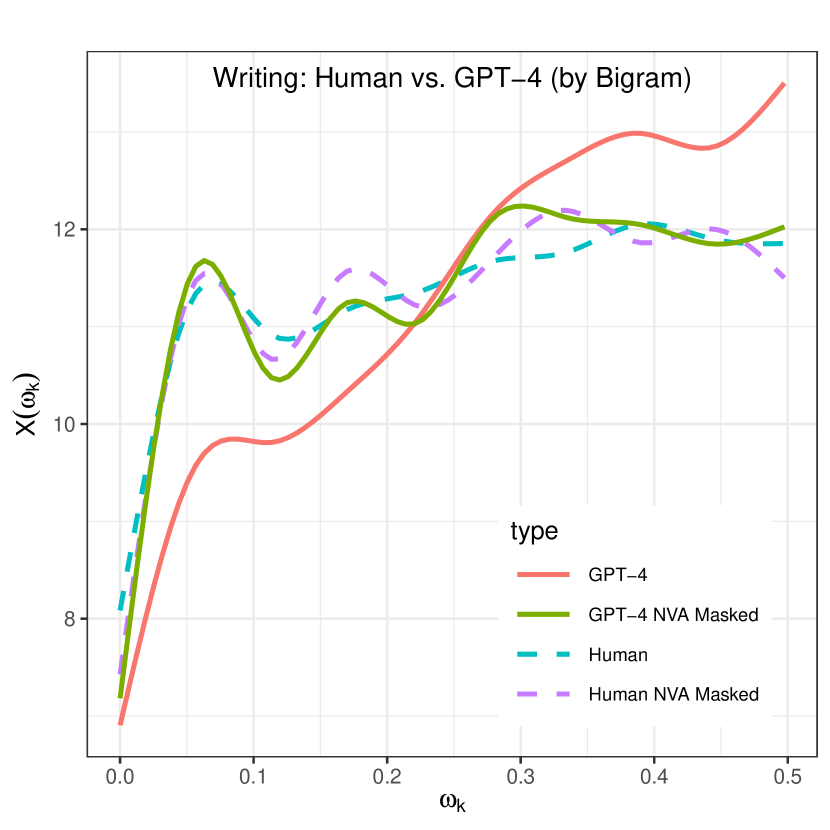
5.3 Part-of-speech masking
As the last part of discussion, we test the role played by words of different part-of-speech (POS) tags in affecting the likelihood spectrum. First, we mask three POS tags in text: ‘NOUN’, ‘VERB’, and ‘ADJ’, individually; and the union of the three, ‘NOUN+VERB+ADJ’ (NVA). Then, the masked tokens’ likelihood scores are replaced with the average score, thus eliminating the contribution from that specific POS tag. Masking is done use the spaCy (Honnibal et al., 2020) POS tagger. The likelihood spectrum results after ‘VERB’ being masked is shown in Figure 5.
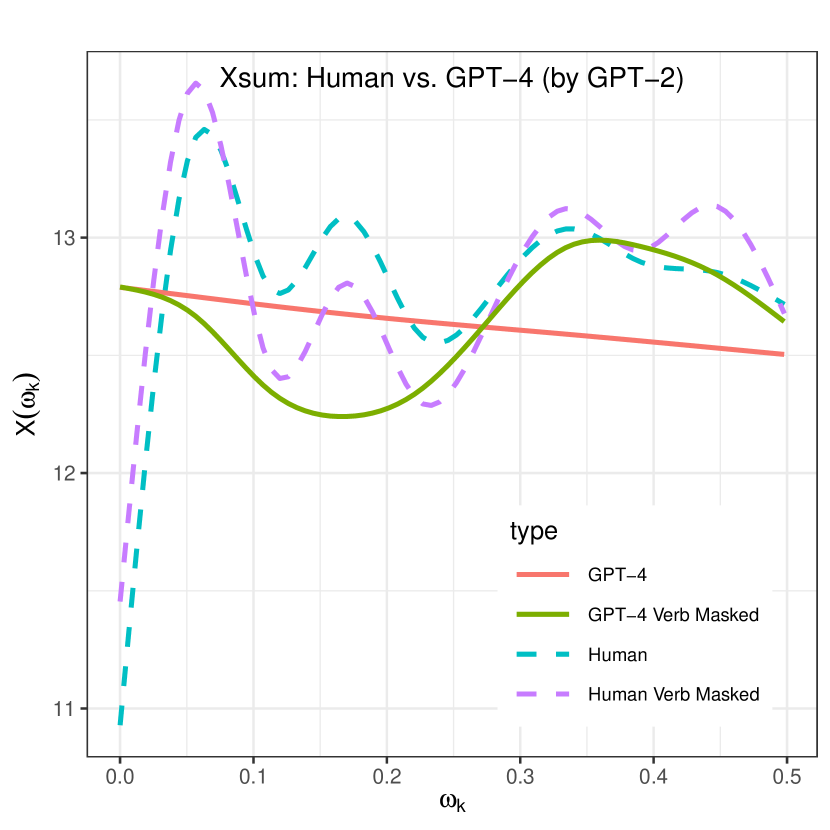
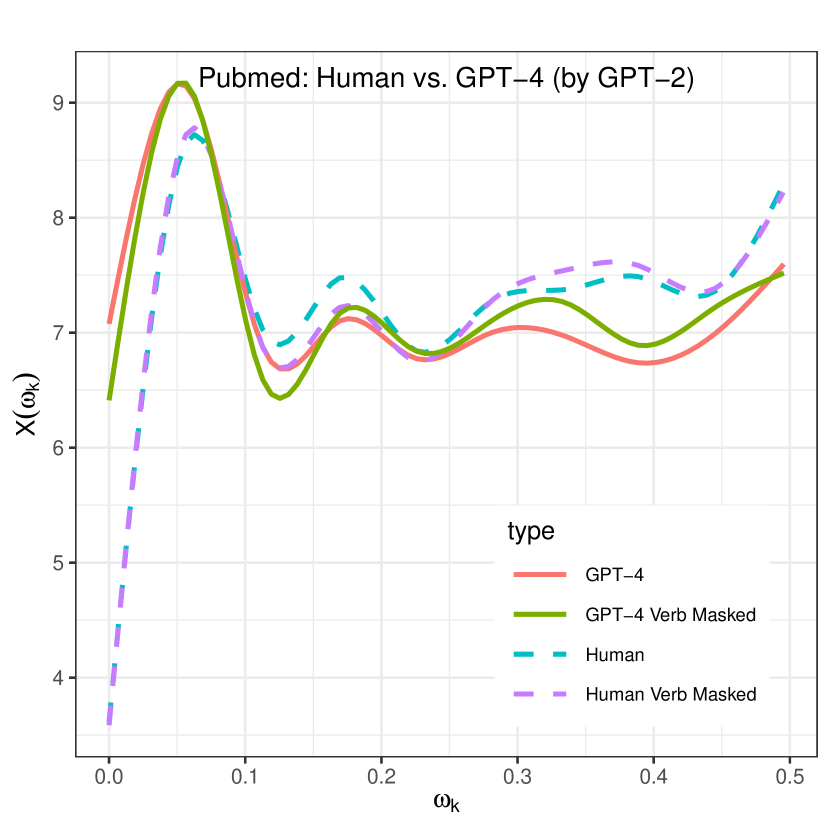
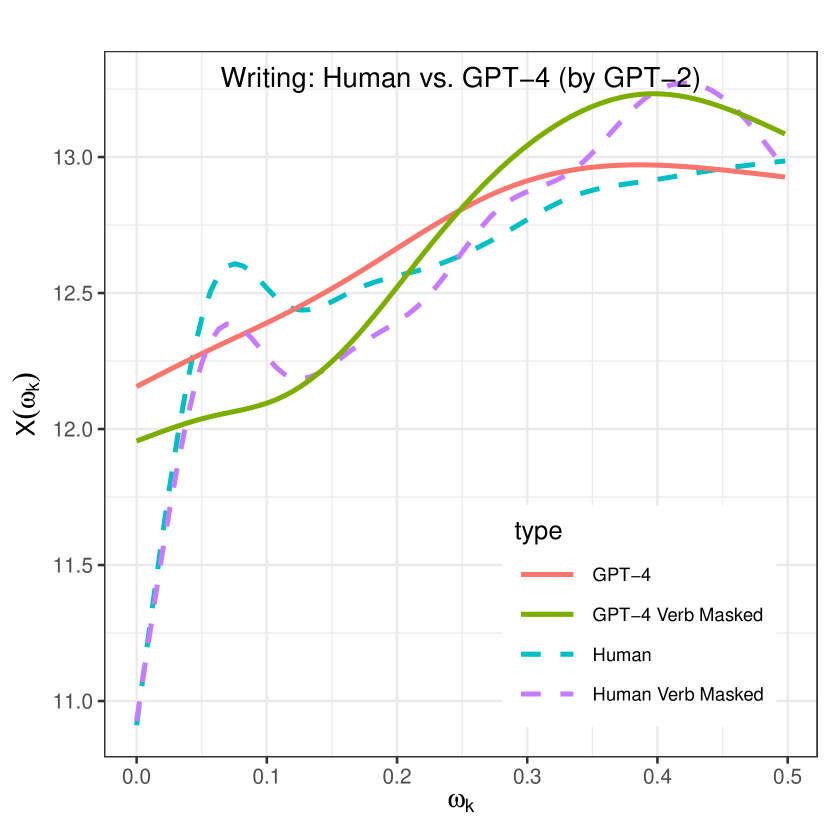
We find an interesting phenomenon that, after applying the POS mask, the change of likelihood spectrum for human text is relatively small, while for the model text (GPT-4), the change is much bigger (see (a) and (c) in Figure 5). Such difference is not limited to ‘VERB’, but also observed for the other POS tags (shown from Figure 6 to Figure 8 in Appendix). The difference will be more salient if switching the estimator from GPT-2 to bigram (shown in Figure 9 to Figure 12 in Appendix). We back up the observed difference by calculating the spectral overlap, the metric proposed by Yang et al. (2023b) to measure the similarity between two spectra: The original spectrum and the one after POS masking, for both human and model texts. It turns out that indeed model text has smaller spectral overlap compared to human text, which indicates that the model spectrum is less stable against POS masking. (Details reported in Table 8 in Appendix)
This finding is similar to the finding about probability curvature in DetectGPT Mitchell et al. (2023): human text is less likely to reach the local maxima of likelihood than model-generated text. In our case: there is more randomness in real human text and as a result, it is more stable against perturbation of likelihood in time-domain, such as the POS masking. Therefore, spectrum stability is a potential statistic for zero-shot detection.
6 Conclusions
In this study, we propose a new text detection method FourierGPT, which draws information from the spectrum view of relative likelihood scores in language, as the basis for distinguishing human and model texts. Our approach reaches better or competitive performances with state-of-the-art methods on typical zero-shot detection tasks, and particularly better on short text detection tasks.
Our method has the following strengths: First, it utilizes the relative likelihood (-scores) rather than absolute values as used by most previous methods, which means it can capture likelihood patterns in language that are less dependent on the expressiveness of the generation model. We consider this as an advantage because the LM’s capability of producing more “likely” texts inevitably grows, and thus, detection methods relying on the absolute “thresholds” of likelihood will also eventually fail.
Secondly, we take a novel spectrum view of likelihood, which goes beyond the static view that simply aggregates likelihood at multiple time steps into a single value, but instead, characterizes the dynamic features how likelihood changes in time. This spectrum view draws inspiration from cognitive characteristics of language production revealed in the psycholinguistics literature, such as UID, periodicity of surprisal etc. The likehood spectrum can reflect subtle differences in human and model languages that are otherwise indetectable.
Thirdly, our method places a relatively low requirement on how accurate the likelihood scores need be estimated. A GPT-2 level model or even -gram model suffices to provide likelihood features to reach a decent detection performance. It suggests that how the likelihood of human language distributes in time is a subtle process, which may not be easily mimicked by language models trained via maximum likelihood estimation. LLMs that try hard to squeeze out the gap between every single prediction and ground-truth token may still lack the ability to produce human-like language.
For future work, we will address the limitations with focus on: building stronger supervised classifiers by better utilizing the circularized spectrum; collecting larger datasets from broader domains and multiple languages; looking for more concrete linguistic cases (such as the “Yes”/“No” example in Section 5.1) to provide richer interpretations for the spectrum-view of likelihood.
7 Limitations
The limitations of the current study are: First, the pair-wise classifier requires the two texts being classified must be generated from the same prompt. It is yet to be verified whether the classifier’s performance will retain if the source prompts are different. Second, the supervised classifier is not a strict zero-shot detector, and its performance still has space for improvement. We argue that it would be less of an issue if the classifier learns the general features instead of idiosyncrasy in certain data. This, however, requires further investigation to whether likelihood spectrum is such a general feature. Third, the datasets examined are relatively small. It is worth exploration on larger datasets (especially short text corpus, such as QA) to further confirm the effectiveness of the method.
References
- Arora et al. (2023) Kushal Arora, Timothy J O’Donnell, Doina Precup, Jason Weston, and Jackie CK Cheung. 2023. The stable entropy hypothesis and entropy-aware decoding: An analysis and algorithm for robust natural language generation. arXiv preprint arXiv:2302.06784.
- Bao et al. (2024) Guangsheng Bao, Yanbin Zhao, Zhiyang Teng, Linyi Yang, and Yue Zhang. 2024. Fast-detectgpt: Efficient zero-shot detection of machine-generated text via conditional probability curvature. In The Twelfth International Conference on Learning Representations.
- Elliott (2013) Douglas F Elliott. 2013. Handbook of Digital Signal Processing: Engineering Applications. Elsevier.
- Fan et al. (2018) Angela Fan, Mike Lewis, and Yann Dauphin. 2018. Hierarchical neural story generation. In Proceedings of the 56th Annual Meeting of the Association for Computational Linguistics (Volume 1: Long Papers), pages 889–898, Melbourne, Australia. Association for Computational Linguistics.
- Gehrmann et al. (2019) Sebastian Gehrmann, Hendrik Strobelt, and Alexander Rush. 2019. GLTR: Statistical detection and visualization of generated text. In Proceedings of the 57th Annual Meeting of the Association for Computational Linguistics: System Demonstrations, pages 111–116, Florence, Italy. Association for Computational Linguistics.
- Genzel and Charniak (2002) Dmitriy Genzel and Eugene Charniak. 2002. Entropy rate constancy in text. In Proceedings of the 40th annual meeting of the Association for Computational Linguistics, pages 199–206.
- Genzel and Charniak (2003) Dmitriy Genzel and Eugene Charniak. 2003. Variation of entropy and parse trees of sentences as a function of the sentence number. In Proceedings of the 2003 conference on empirical methods in natural language processing, pages 65–72.
- Hale (2001) John Hale. 2001. A probabilistic earley parser as a psycholinguistic model. In Second meeting of the north american chapter of the association for computational linguistics.
- Heafield (2011) Kenneth Heafield. 2011. Kenlm: Faster and smaller language model queries. In WMT@EMNLP.
- Holtzman et al. (2020) Ari Holtzman, Jan Buys, Li Du, Maxwell Forbes, and Yejin Choi. 2020. The curious case of neural text degeneration. In International Conference on Learning Representations.
- Honnibal et al. (2020) Matthew Honnibal, Ines Montani, Sofie Van Landeghem, and Adriane Boyd. 2020. spaCy: Industrial-strength Natural Language Processing in Python.
- Ippolito et al. (2020) Daphne Ippolito, Daniel Duckworth, Chris Callison-Burch, and Douglas Eck. 2020. Automatic detection of generated text is easiest when humans are fooled. In Proceedings of the 58th Annual Meeting of the Association for Computational Linguistics, pages 1808–1822. Association for Computational Linguistics.
- Jaeger (2010) T Florian Jaeger. 2010. Redundancy and reduction: Speakers manage syntactic information density. Cognitive psychology, 61(1):23–62.
- Jiang et al. (2023) Albert Q Jiang, Alexandre Sablayrolles, Arthur Mensch, Chris Bamford, Devendra Singh Chaplot, Diego de las Casas, Florian Bressand, Gianna Lengyel, Guillaume Lample, Lucile Saulnier, et al. 2023. Mistral 7b. arXiv preprint arXiv:2310.06825.
- Jin et al. (2019) Qiao Jin, Bhuwan Dhingra, Zhengping Liu, William Cohen, and Xinghua Lu. 2019. Pubmedqa: A dataset for biomedical research question answering. In Proceedings of the 2019 Conference on Empirical Methods in Natural Language Processing and the 9th International Joint Conference on Natural Language Processing (EMNLP-IJCNLP), pages 2567–2577, Hong Kong, China.
- Levy (2008) Roger Levy. 2008. Expectation-based syntactic comprehension. Cognition, 106(3):1126–1177.
- Lewis et al. (2006) Richard L Lewis, Shravan Vasishth, and Julie A Van Dyke. 2006. Computational principles of working memory in sentence comprehension. Trends in cognitive sciences, 10(10):447–454.
- Meister et al. (2020) Clara Meister, Ryan Cotterell, and Tim Vieira. 2020. If beam search is the answer, what was the question? In Proceedings of the 2020 Conference on Empirical Methods in Natural Language Processing (EMNLP), pages 2173–2185, Online.
- Meister et al. (2023) Clara Meister, Tiago Pimentel, Gian Wiher, and Ryan Cotterell. 2023. Locally typical sampling. Transactions of the Association for Computational Linguistics, 11:102–121.
- Mitchell et al. (2023) Eric Mitchell, Yoonho Lee, Alexander Khazatsky, Christopher D Manning, and Chelsea Finn. 2023. Detectgpt: Zero-shot machine-generated text detection using probability curvature. In International Conference on Machine Learning, pages 24950–24962. PMLR.
- Narayan et al. (2018) Shashi Narayan, Shay B. Cohen, and Mirella Lapata. 2018. Don’t give me the details, just the summary! topic-aware convolutional neural networks for extreme summarization. In Proceedings of the 2018 Conference on Empirical Methods in Natural Language Processing, pages 1797–1807, Brussels, Belgium. Association for Computational Linguistics.
- Pillutla et al. (2021) Krishna Pillutla, Swabha Swayamdipta, Rowan Zellers, John Thickstun, Sean Welleck, Yejin Choi, and Zaid Harchaoui. 2021. Mauve: Measuring the gap between neural text and human text using divergence frontiers. In Advances in Neural Information Processing Systems, volume 34, pages 4816–4828. Curran Associates, Inc.
- Radford et al. (2019) Alec Radford, Jeffrey Wu, Rewon Child, David Luan, Dario Amodei, Ilya Sutskever, et al. 2019. Language models are unsupervised multitask learners. OpenAI blog, 1(8):9.
- Raffel et al. (2019) Colin Raffel, Noam Shazeer, Adam Roberts, Katherine Lee, Sharan Narang, Michael Matena, Yanqi Zhou, Wei Li, and Peter J. Liu. 2019. Exploring the limits of transfer learning with a unified text-to-text transformer. arXiv e-prints.
- Reno et al. (2018) Allison Reno, Andrew W Hunter, Yang Li, Tong Ye, and Ann C Foley. 2018. Quantification of cardiomyocyte beating frequency using fourier transform analysis. In Photonics, volume 5, page 39. MDPI.
- Smith and Levy (2013) Nathaniel J Smith and Roger Levy. 2013. The effect of word predictability on reading time is logarithmic. Cognition, 128(3):302–319.
- Solaiman et al. (2019) Irene Solaiman, Miles Brundage, Jack Clark, Amanda Askell, Ariel Herbert-Voss, Jeff Wu, Alec Radford, Gretchen Krueger, Jong Wook Kim, Sarah Kreps, et al. 2019. Release strategies and the social impacts of language models. arXiv preprint arXiv:1908.09203.
- Su et al. (2023) Jinyan Su, Terry Yue Zhuo, Di Wang, and Preslav Nakov. 2023. Detectllm: Leveraging log rank information for zero-shot detection of machine-generated text. arXiv preprint arXiv:2306.05540.
- Tian and Cui (2023) Edward Tian and Alexander Cui. 2023. Gptzero: Towards detection of ai-generated text using zero-shot and supervised methods, 2023. URL https://gptzero. me.
- Xu and Reitter (2017) Yang Xu and David Reitter. 2017. Spectral analysis of information density in dialogue predicts collaborative task performance. In Proceedings of the 55th Annual Meeting of the Association for Computational Linguistics (Volume 1: Long Papers), pages 623–633.
- Yang et al. (2023a) Xianjun Yang, Wei Cheng, Yue Wu, Linda Petzold, William Yang Wang, and Haifeng Chen. 2023a. Dna-gpt: Divergent n-gram analysis for training-free detection of gpt-generated text. arXiv preprint arXiv:2305.17359.
- Yang et al. (2023b) Zuhao Yang, Yingfang Yuan, Yang Xu, Shuo Zhan, Huajun Bai, and Kefan Chen. 2023b. Face: Evaluating natural language generation with fourier analysis of cross-entropy. arXiv preprint arXiv:2305.10307. Published to NeurIPS 2023.
- Zipf (1949) G Zipf. 1949. Human Behavior and the Principle of Least Effort. New York: Addison-Wesley.
Appendix A Hyperparameters for Supervised Classifiers
Detail classification results are shown on Table 6 and Table 7. The result is the mean of 5-fold cross-validation score of each dataset.
| Dataset | Gen. model | HGBT | KNN | MLP | SVM | NB | LR |
|---|---|---|---|---|---|---|---|
| PubMed | GPT4 | 0.567 | 0.580 | 0.580 | 0.593 | 0.573 | 0.597 |
| GPT3.5 | 0.597 | 0.583 | 0.597 | 0.607 | 0.607 | 0.603 | |
| GPT3 | 0.577 | 0.600 | 0.613 | 0.603 | 0.597 | 0.593 | |
| Writing | GPT4 | 0.663 | 0.677 | 0.707 | 0.717 | 0.710 | 0.677 |
| GPT3.5 | 0.680 | 0.713 | 0.693 | 0.743 | 0.733 | 0.737 | |
| GPT3 | 0.553 | 0.543 | 0.537 | 0.530 | 0.530 | 0.527 | |
| Xsum | GPT4 | 0.693 | 0.670 | 0.713 | 0.717 | 0.707 | 0.697 |
| GPT3.5 | 0.640 | 0.623 | 0.660 | 0.677 | 0.660 | 0.667 | |
| GPT3 | 0.557 | 0.560 | 0.550 | 0.557 | 0.550 | 0.563 |
| Dataset | Gen. model | HGBT | KNN | MLP | SVM | NB | LR |
|---|---|---|---|---|---|---|---|
| PubMed | GPT4 | 0.797 | 0.800 | 0.800 | 0.827 | 0.806 | 0.810 |
| GPT3.5 | 0.580 | 0.583 | 0.557 | 0.600 | 0.533 | 0.573 | |
| GPT3 | 0.580 | 0.553 | 0.553 | 0.570 | 0.567 | 0.557 | |
| Writing | GPT4 | 0.713 | 0.690 | 0.693 | 0.707 | 0.717 | 0.663 |
| GPT3.5 | 0.687 | 0.683 | 0.713 | 0.737 | 0.750 | 0.723 | |
| GPT3 | 0.797 | 0.800 | 0.817 | 0.827 | 0.807 | 0.810 | |
| Xsum | GPT4 | 0.717 | 0.690 | 0.737 | 0.740 | 0.733 | 0.723 |
| GPT3.5 | 0.730 | 0.710 | 0.727 | 0.750 | 0.737 | 0.730 | |
| GPT3 | 0.717 | 0.687 | 0.723 | 0.740 | 0.733 | 0.723 |
For classification, the data will pass through a scaler, and then a k-best feature selector, at last, the classifier. We apply grid-search on different parameters and report the best outputs. The parameters of the overall workflow are shown below:
-
•
Scaler: MinMax, ZScore, Robust
-
•
KBestFeatures: 50, 80, 100, 120, 150, 200, 250, 300, 400, 500
-
•
SVM (Support Vector Machine):
-
–
kernel: rbf, linear
-
–
C: 1, 2, 10
-
–
gamma: scale, auto
-
–
-
•
HGBT (Histogram Gradient Boosting Trees):
-
–
max iter: 500
-
–
learning rate: 0.1, 0.05, 0.01, 0.005, 0.001
-
–
min samples leaf: 7, 13
-
–
-
•
MLP (Multi-Layer Perceptrons):
-
–
constant learning rate: 0.001
-
–
SGD momentum: 0.9
-
–
max iter: 800
-
–
hidden layer: (500), (500, 50)
-
–
-
•
LR (Logistic Regression):
-
–
solver: liblinear
-
–
penalty: l1, l2
-
–
C: 1, 2, 10
-
–
-
•
KNN (K-Neighbors Classifier):
-
–
n: 3, 5, 7, 9
-
–
-
•
NB (Complement Naive Bayes):
-
–
alpha: 0.5, 1, 2
-
–
| Pubmed | Writing | Xsum | ||||||||
|---|---|---|---|---|---|---|---|---|---|---|
| GPT-3 | GPT-3.5 | GPT-4 | GPT-3 | GPT-3.5 | GPT-4 | GPT-3 | GPT-3.5 | GPT-4 | ||
| VERB | H | 0.8559 | 0.8574 | 0.8536 | 0.8155 | 0.8185 | 0.8187 | 0.8062 | 0.8015 | 0.8017 |
| M | 0.8497 | 0.8390 | 0.8311 | 0.8001 | 0.7950 | 0.8074 | 0.8036 | 0.7947 | 0.8029 | |
| NOUN | H | 0.7564 | 0.7598 | 0.7564 | 0.7972 | 0.7982 | 0.7979 | 0.7736 | 0.7717 | 0.7714 |
| M | 0.7528 | 0.7280 | 0.7267 | 0.7827 | 0.7624 | 0.7676 | 0.7639 | 0.7537 | 0.7600 | |
| ADJ | H | 0.8109 | 0.8110 | 0.8077 | 0.8700 | 0.8679 | 0.8674 | 0.8575 | 0.8526 | 0.8548 |
| M | 0.8196 | 0.7830 | 0.7833 | 0.8485 | 0.8349 | 0.8357 | 0.8486 | 0.8272 | 0.8302 | |
| NVA | H | 0.6976 | 0.6961 | 0.6953 | 0.7397 | 0.7433 | 0.7414 | 0.7250 | 0.7238 | 0.7232 |
| M | 0.6938 | 0.6634 | 0.6697 | 0.7249 | 0.7151 | 0.7207 | 0.7220 | 0.7083 | 0.7165 |
Xsum
PubMed
Writing
Xsum
PubMed
Writing
Xsum
PubMed
Writing
Xsum
PubMed
Writing
Xsum
PubMed
Writing
Xsum
PubMed
Writing
Xsum
PubMed
Writing