Calibrating and standardizing the Tip of the Red Giant Branch in the Small Magellanic Cloud
using small-amplitude red giants
Abstract
We investigate the absolute calibration of the Tip of the Red Giant Branch (TRGB) in the Small Magellanic Cloud (SMC) using small amplitude red giant stars (SARGs) classified by the Optical Gravitational Lensing Experiment (OGLE). We show that all stars near the SMC’s TRGB are SARGs. Distinguishing older and younger RGs near the Tip according to two period-luminosity sequences labeled A and B, we show many similarities among SARG populations of the LMC and the SMC, along with notable differences. Specifically, SMC SARGs have shorter periods due to lower metallicity and lower amplitudes due to younger ages than LMC SARGs. We discover two period-color relations near the TRGB that span all A-sequence and B-sequence stars in the OGLE-III footprints of the SMC and LMC, and we investigate using periods instead of color for TRGB standardization. Using variability derived information only, we trace the SMC’s age and metallicity gradients and show the core to be populated by younger, more metal rich RGs. B-sequence SARGs yield both the most precise and the brightest tip magnitude, and they are best suited for distance determination and Hubble constant measurements because they correspond to the oldest stars near TRGB. Assuming the geometric distance measured by detached eclipsing binaries, the B-sequence yields the SMC’s most accurate TRGB calibration to date: mag ( in distance). Further study of SARGs will unravel the impact of population diversity on TRGB distances and further improve TRGB standardization.
1 Introduction
The Tip of the Red Giant Branch (TRGB) is an empirical feature in the color-magnitude diagrams of old stellar populations that serves as an important standard candle for determining luminosity distances (Lee et al., 1993). Indeed, the TRGB is the most commonly applied stellar standard candle for measuring extragalactic distances (e.g., Anand et al., 2021) thanks to the high prevalence of evolved metal-poor stars in most galaxies out to a few tens of Mpc. This renders the TRGB a useful tool for measuring the Hubble constant via an extragalactic distance ladder, either as calibrators of type-Ia supernovae (e.g., Freedman, 2021; Anand et al., 2022; Scolnic et al., 2023) or of surface brightness fluctuations (Anand et al., 2024), cf. also the recent review by Li & Beaton (2024). Astrophysically, the TRGB feature is understood to be caused by the helium flash that abruptly inverts the evolutionary direction of first-ascent low-mass red giant branch (RGB) stars (Sweigart & Gross, 1978; Salaris et al., 2002, ). The rapidity of the He flash creates a near discontinuity in the luminosity function of red giant stars, which is in practice frequently contaminated by younger and higher-luminosity asympototic giant branch (AGB) stars.
As with any standard candle, both calibration and standardization are required in order to measure accurate distances using the TRGB (Anderson, 2024). Standardization involves algorithmic subtleties (Madore et al., 2009; Makarov et al., 2006; Hatt et al., 2017; Wu et al., 2022) as well as corrections for astrophysical differences. For example, differences in chemical composition affect both the luminosity and the shape of the TRGB feature and vary according to the photometric bands considered. In particular, the band is known for its particularly flat TRGB that provides best consistency for distance estimates. In band, several studies have reported that higher metallicity leads to dimmer TRGB magnitudes (Freedman et al., 2020; Rizzi et al., 2007; Hoyt, 2023). Age differences are not usually considered due to lack of reliable information, and an expectation that age differences for very old red giants (several Gyr and older) should be small (e.g. Salaris & Girardi, 2005; Serenelli et al., 2017). The calibration of the TRGB absolute magnitude requires knowledge of geometric distances to stars undergoing the core Helium flash. The geometric distances currently available to this end are trigonometric parallaxes from the ESA Gaia mission (Gaia Collaboration et al., 2016; Lindegren et al., 2021), the distances of the Magellanic Clouds determined using evolved detached eclipsing binaries (Pietrzyński et al., 2019; Graczyk et al., 2020), and the megamaser distance to NGC 4258 (Reid et al., 2019). Among these possibilities, the Magellanic Clouds benefit from a particularly comprehensive and long-term observational dataset that allows detailed studies of red giant (RG) populations. In particular, the Optical Gravitational Lensing Experiment (OGLE) has provided more than decade-long time series observations that allow to map even low-amplitude variability for millions of stars in the Magellanic Clouds (Udalski et al., 2008; Soszyński et al., 2004, 2011).
Using photometry, reddening maps, and variability information delivered by OGLE, Anderson et al. (2024, henceforth: A24) recently showed that virtually all stars near the TRGB in the LMC are small amplitude red giant stars (SARGs) that exhibit multi-modal long-period variability at the level of a few hundredths of a magnitude. Intriguingly, the dominant pulsation mode of SARGs allows to distinguish between younger and older red giant sub-populations in the Large Magellanic Cloud (LMC), which yield significantly different values for the TRGB magnitude. Hence, variability provides urgently needed information to distinguish ages and to probe systematics of the TRGB according to variability-selected RG sub-populations. While the amplitudes of SARGs are arguably too small to be readily measured beyond the local group, it is nonetheless likely that SARGs observed in nearby galaxies will allow to develop standardization methods for improving the accuracy of TRGB distances.
In this article, we build on A24 and investigate the TRGB calibration based on the Small Magellanic Cloud (SMC) based on SARGs. We seek to further understand how variability can inform TRGB standardization in order to achieve the best possible absolute calibration for extragalactic distance measurements. The structure of the article is as follows. Section 2 describes the input data used, sample selection, and recalls the method developed in A24. An overview of statistical and systematic uncertainties is provided in Section 2.6. Section 3 first presents apparent TRGB magnitudes determined using SMC samples and compares differences among variability-selected subsamples (Sect. 3.1). In turn, Sect. 3.2 considers spatial variations and derives period-color relations for SARGs on two long-period variable sequences near the RGB tip (Sect. 3.3). SARGs are used to measure the difference in distance modulus between the SMC and the LMC, , in Sect. 3.4, and the absolute magnitude of the TRGB is calibrated in Sect. 3.5, which further considers metallicity differences traced by differences in pulsation periods. Additional discussion of these results and of the variable TRGB is presented in Section 4. The final Sect. 5 summarizes our results and presents our conclusions.
2 Data and Methods
2.1 Sample Definitions
We considered four samples made up of RG stars in the OGLE-III footprint of the SMC as well as the LMC samples described in A24. The sample of all RG stars is henceforth referred to as Allstars. The SARGs sample is a subset of Allstars, whose variability was reported and classified in the OGLE-III catalog of long-period variables (Soszyński et al., 2011). The SMC sample of SARGs is significantly smaller than the LMC: we started with 16,810 SARGs in the SMC (Soszyński et al., 2011), compared to the 79,200 SARGs in the LMC (Soszyński et al., 2009). Figure 1 shows the Period-Wesenheit relations of the OGLE long-period variables, which exhibit multi-periodic variability and populate multiple period-luminosity sequences of both radial and non-radial modes, typically labeled A′, A, B, and so on (Wood et al., 1999; Wray et al., 2004; Wood, 2015).
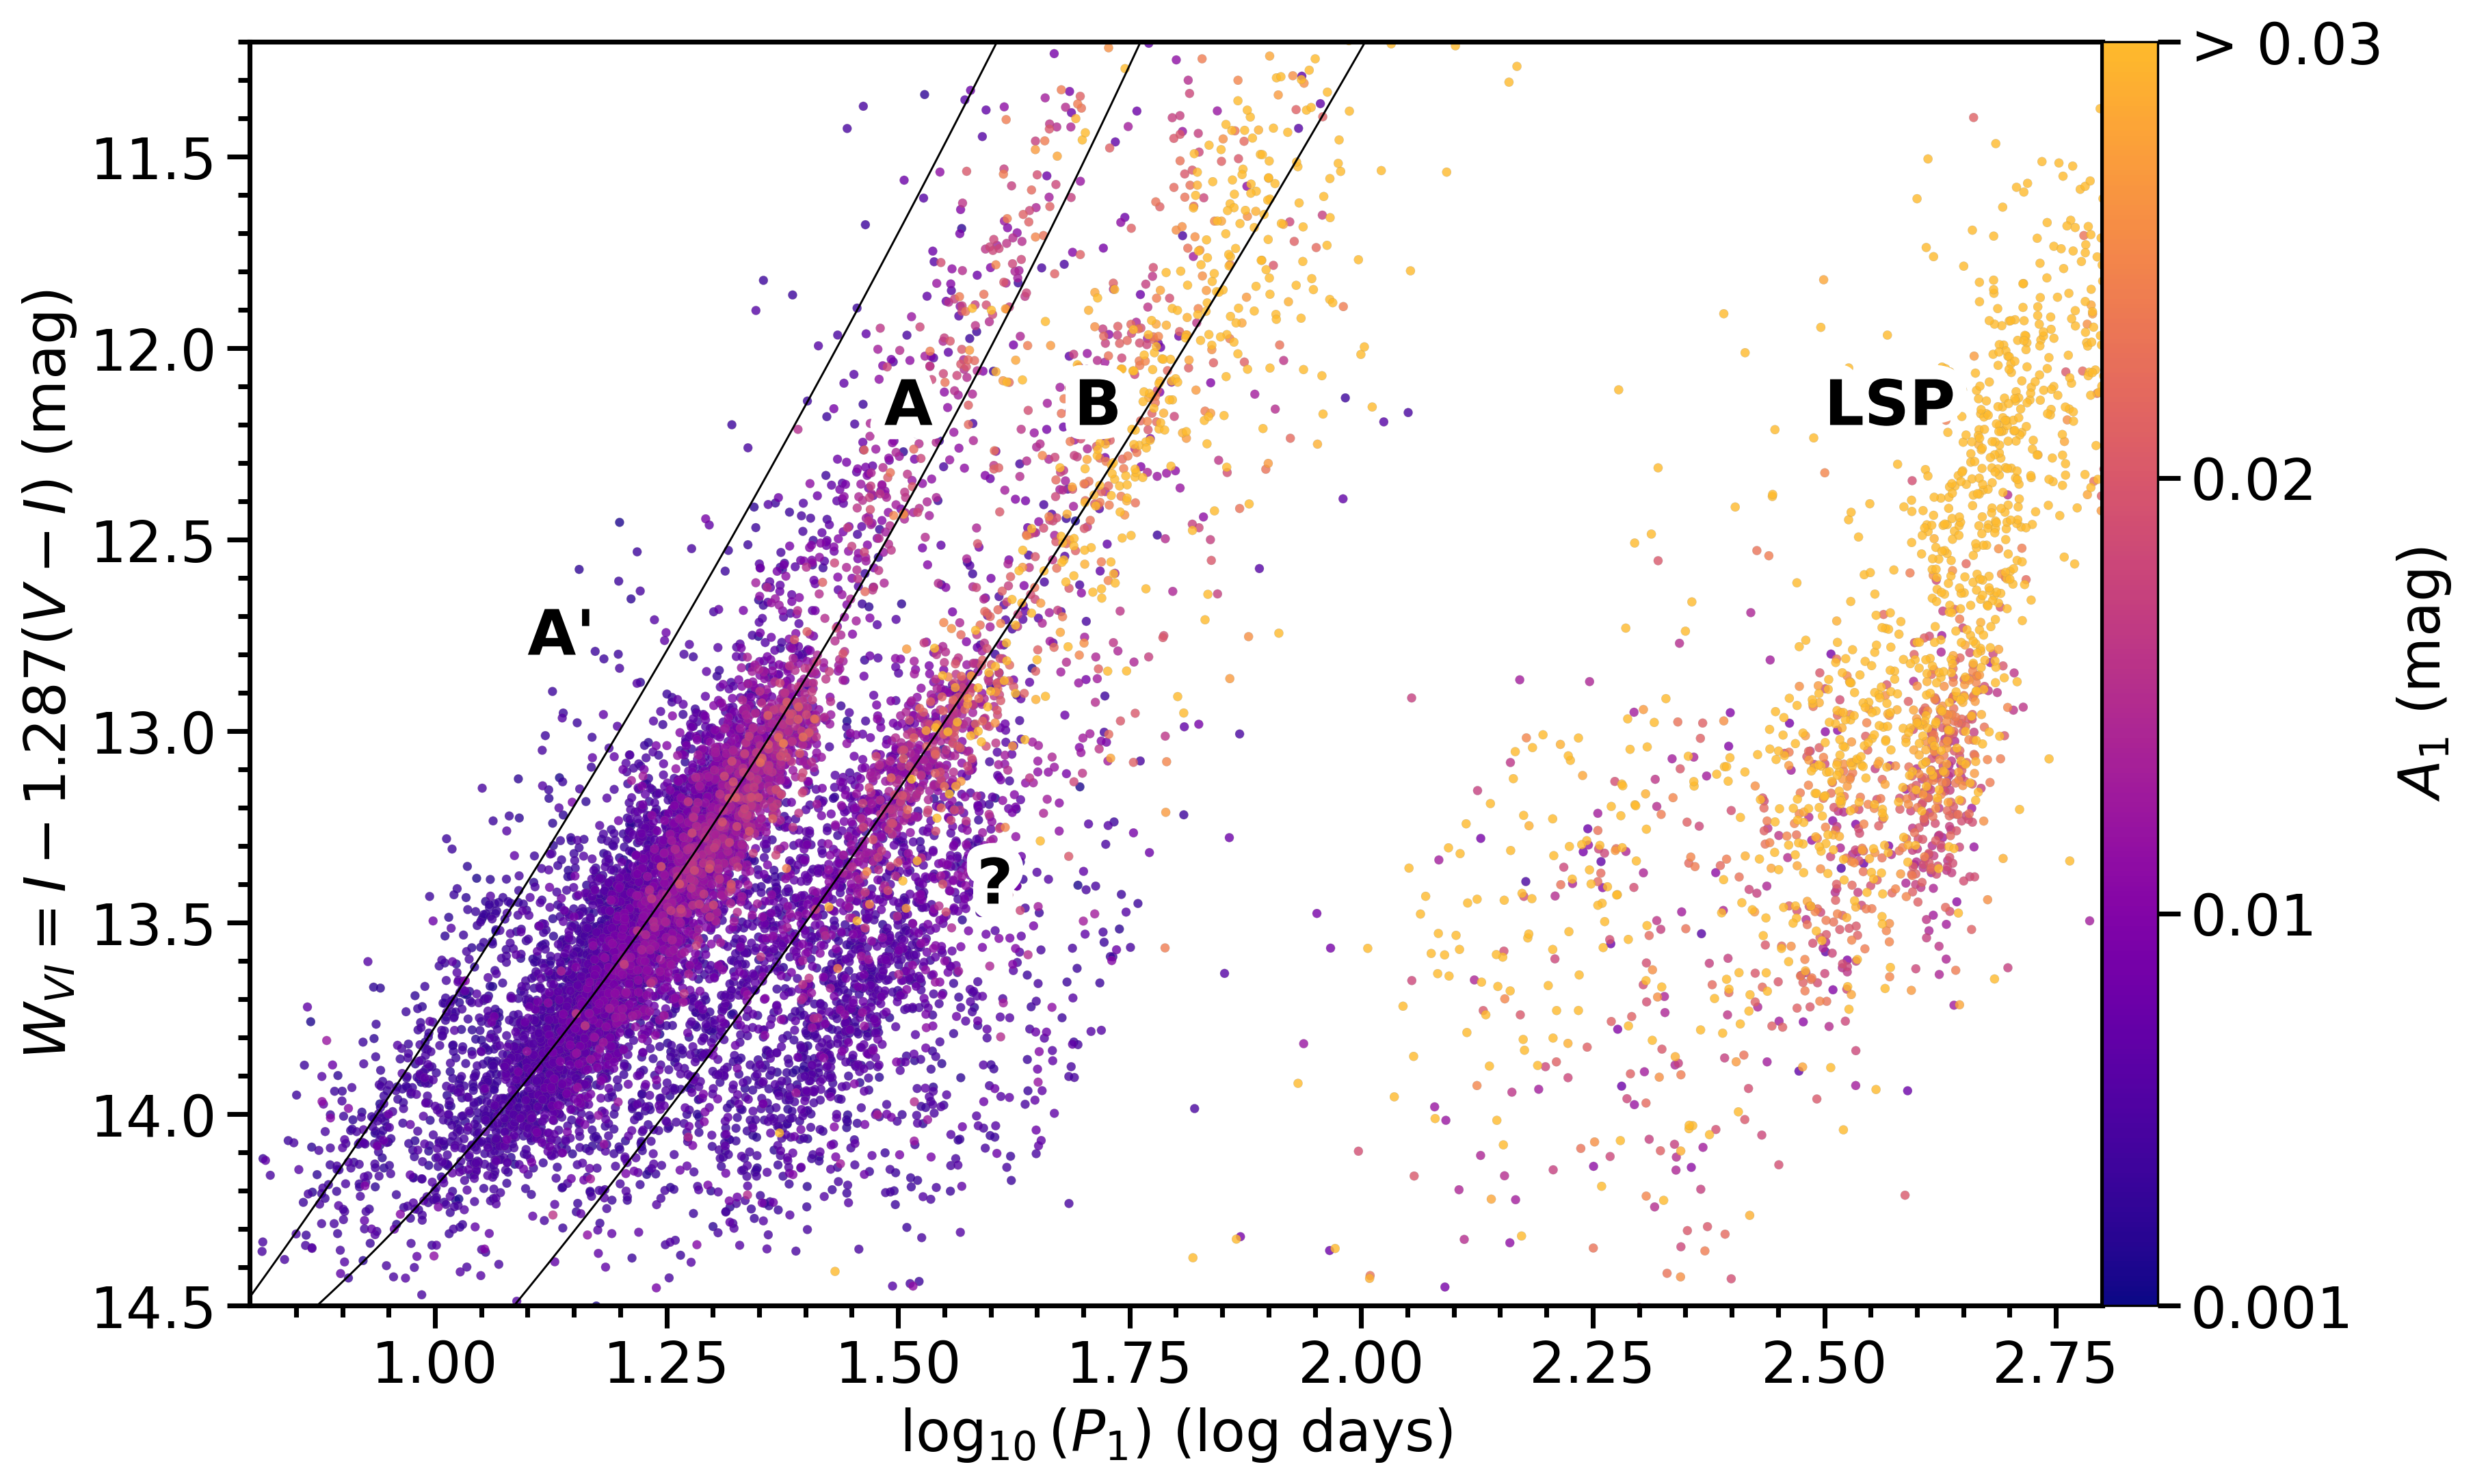
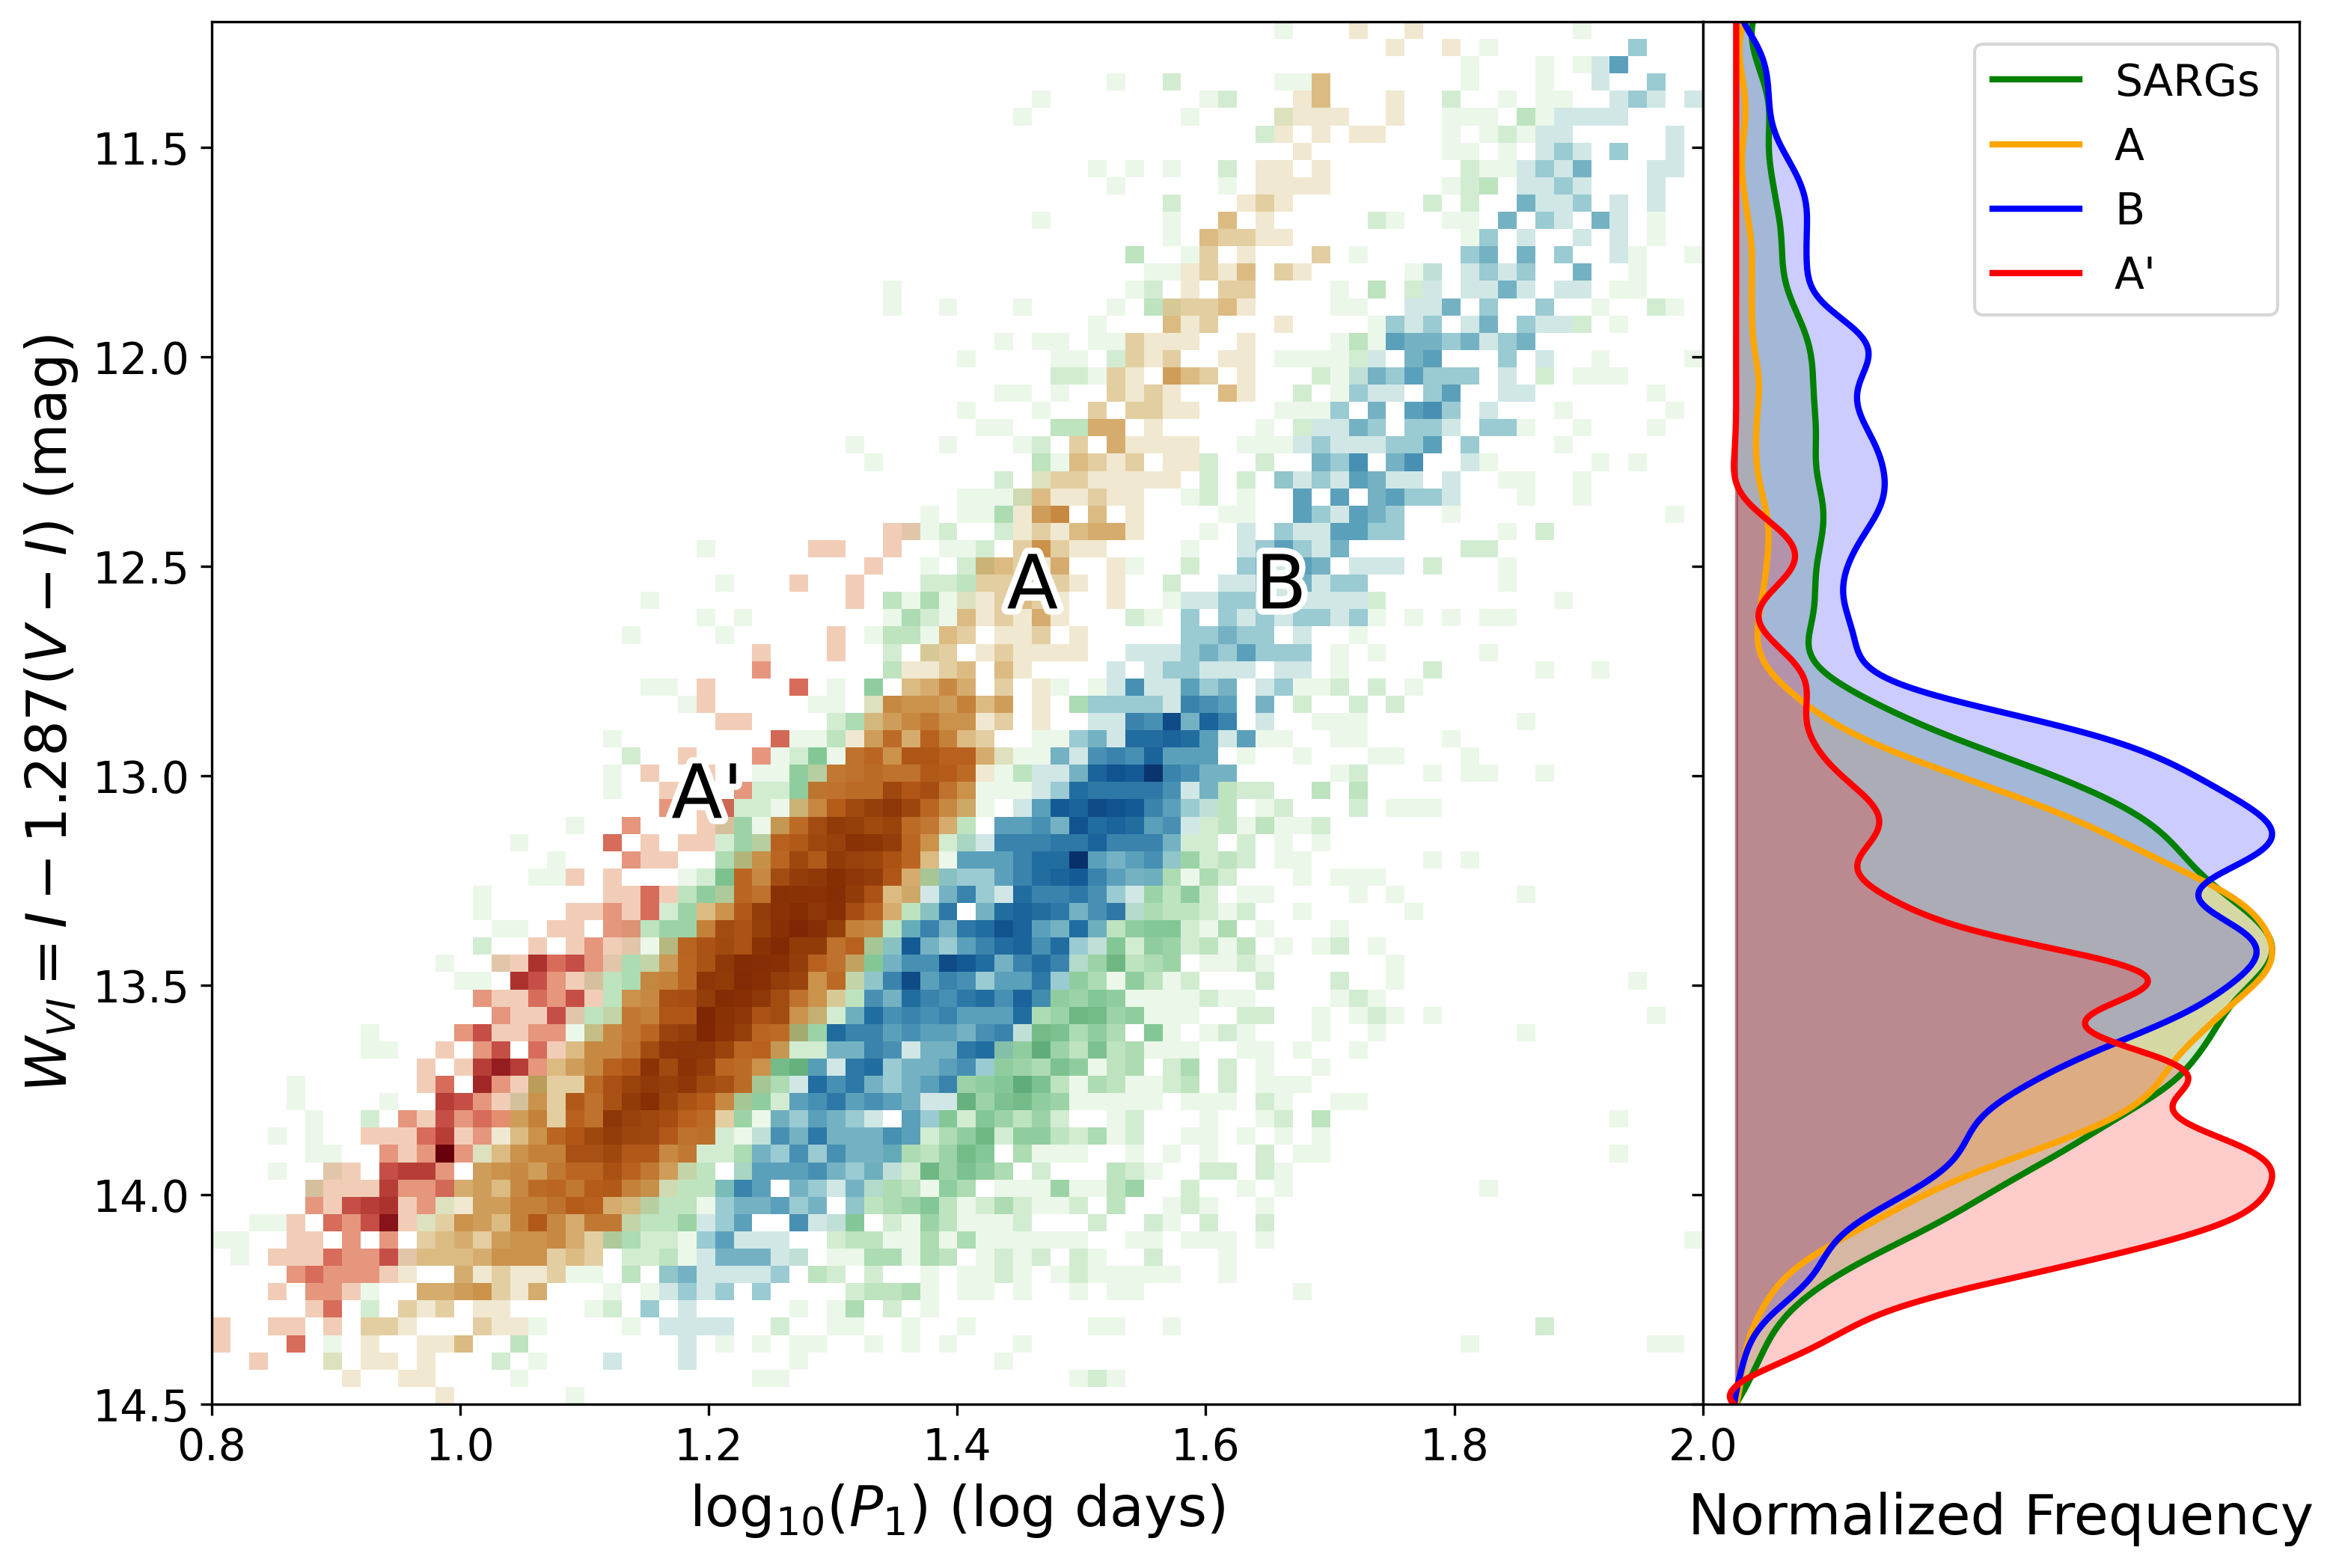
We selected two further subsamples, A-sequence and B-sequence, according to the period-lumionsity relation of their dominant pulsation period, , in analogy to A24. Specifically, we used second order polynomial fits to period-Wesenheit relations computed using , which is reddening-free by construction (Madore, 1982) assuming and a typical color of stars near the RGB tip (Anderson, 2022). Wesenheit magnitudes were only used to select samples, cf. Sect. 2.2. Three clipping was applied to avoid overlap between both sequences. To further minimize contamination for the B-sequence sample, we restricted the selection using a polygon designed to exclude a longer-period, lower-luminosity sequence situated below the B-sequence TRGB. This sequence, marked as “?” in Figure 1, might correspond to the b1 sequence identified by Soszyński et al. (2004) because it does not reach the TRGB. However, we note that the exclusion of these stars has no impact on our TRGB measurement. The polynomial fits are for A-sequence: mag with a dispersion of mag and for B-sequence: mag with a dispersion of mag. The selected sequences can be see in Figure 2 along with their luminosity functions and the collected information for each sample is listed in Table 1.
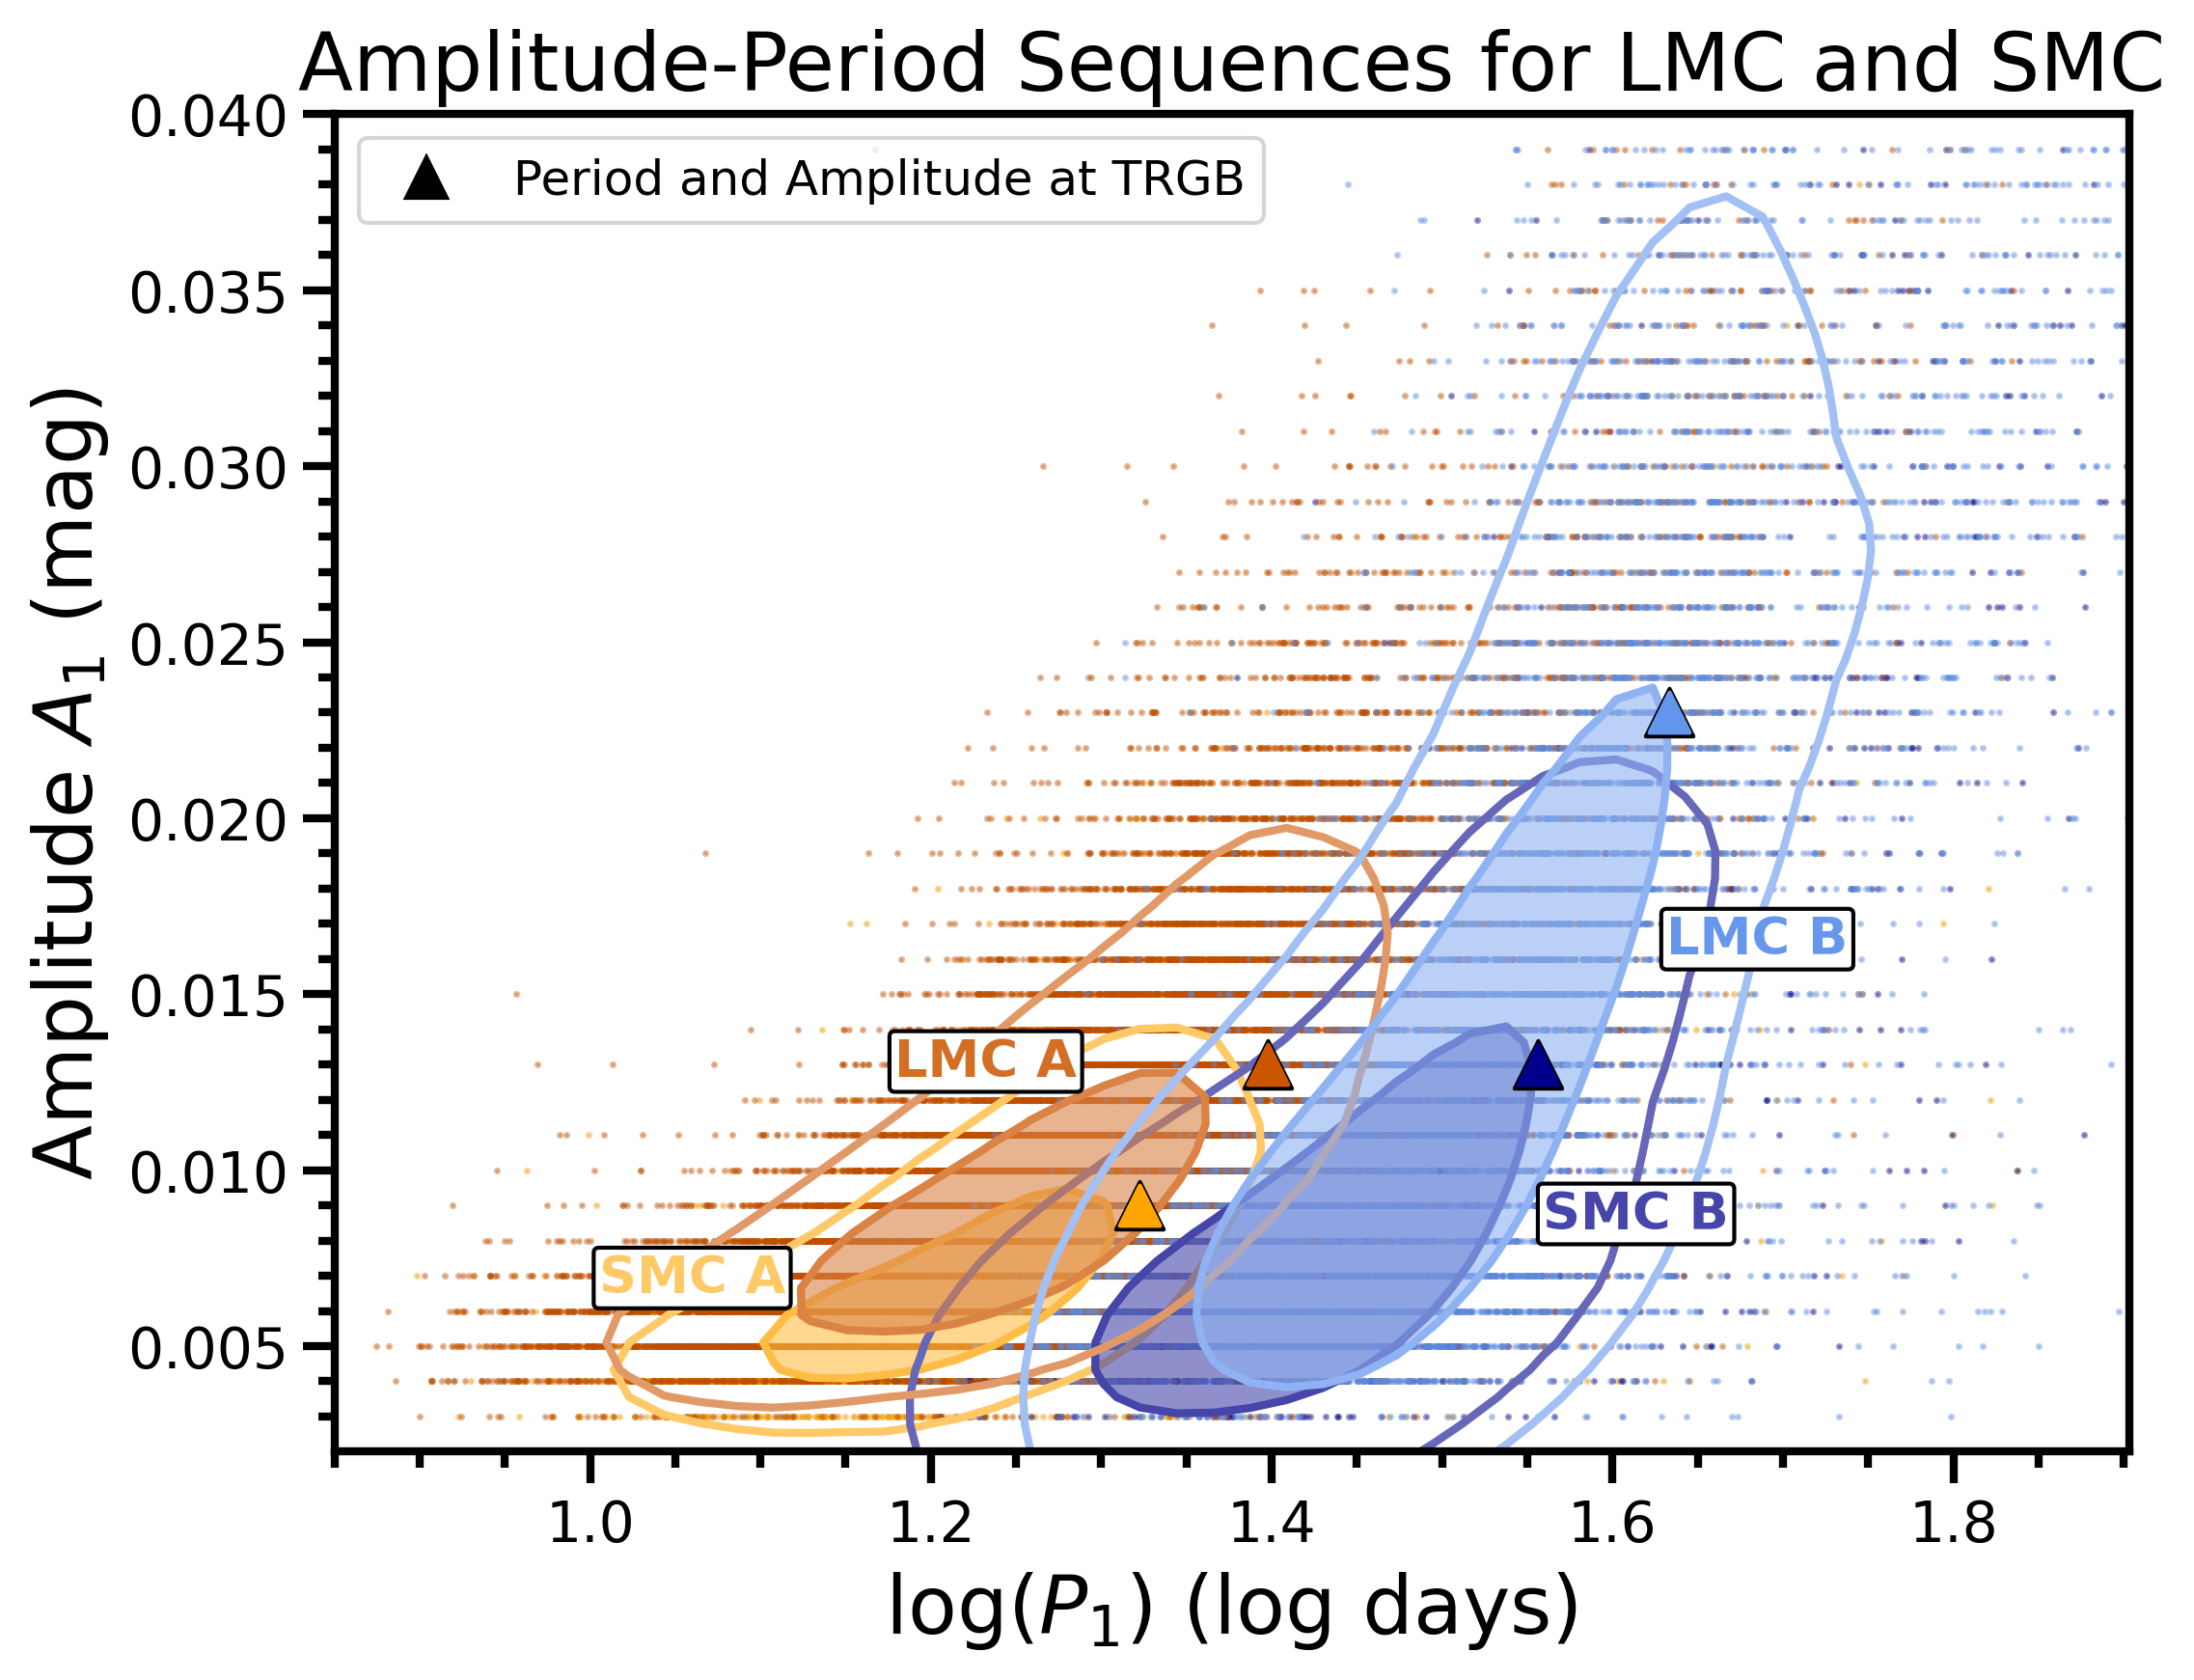
Figure 3 shows the period-amplitude relations for SARGs on the A and B-sequences, which feature oscillation amplitudes mag near the TRGB. Interestingly, SMC B-sequence stars exhibit lower amplitudes near the TRGB than LMC B-sequence stars. This is further discussed in Section 2.3 below.
| Number of Stars | ||||||||||||||
| (mag) | (d) | (mmag) | () | (Gyr) | ||||||||||
| Sample | LMC | SMC | LMC | SMC | LMC | SMC | LMC | SMC | LMC | SMC | LMC | SMC | LMC | SMC |
| A | 1.78 (0.30) | 1.52 (0.15) | 25 | 21 | 13 | 9 | -0.63 (0.17) | -0.95 (0.25) | 1.2 | 1.2 | 3.5 | 2.9 | 20 470 | 5 468 |
| B | 1.84 (0.38) | 1.57 (0.18) | 43 | 36 | 23 | 13 | -0.77 (0.35) | -1.09 (0.29) | 0.9 | 1.0 | 6.3 | 4.1 | 9 164 | 1 943 |
| SARGs | 1.80 (0.37) | 1.55 (0.18) | 39 | 29 | 19 | 12 | -0.70 (0.32) | -1.00 (0.28) | 1.0 | 1.1 | 4.6 | 3.2 | 40 185 | 11 584 |
| All Stars | 1.78 (0.42) | 1.53 (0.23) | - | - | - | - | -0.68 (0.35) | -1.00 (0.31) | 1.1 | 1.1 | 4.3 | 3.2 | 140 774 | 45 821 |
2.2 Photometric data collected
We computed the mean magnitudes from and band time-series photometry from the SMC (Soszyński et al., 2011) and LMC OGLE-III studies (Soszyński et al., 2009). For non-variable stars we used the OGLE-III photometric maps of the SMC (Udalski et al., 2009) and LMC (Udalski et al., 2008), removing duplicate stars in the photometric maps within . The mean time-series magnitudes and the photometric maps are fully consistent with each other, with a mean difference of mag.
We cross-matched the OGLE stars with Gaia DR3 (Gaia Collaboration et al., 2022a) to collect astrometry and photometry in Gaia band and synthetic photometry from the gaiadr3.synthetic_photometry_gsp table that provides HST ACS/WFC band and Cousins band, among others, in addition to photometric quality indicators. We applied very loose constraints on the color-magnitude diagram, as well as proper motion and quality selections, following A24. Our Gaia query for the SMC was centered on the SMC central region (Graczyk et al., 2020):
SELECT * FROM gaiadr3.gaia_source as GS
INNER JOIN gaiadr3.synthetic_photometry_gspc as S
ON S.source_id = GS.source_id
WHERE CONTAINS(POINT(’ICRS’,GS.ra,GS.dec),
CIRCLE(’ICRS’,,,))=1
AND S.i_jkc_mag
AND S.i_jkc_mag
AND (S.v_jkc_mag - S.i_jkc_mag)
AND (S.v_jkc_mag - S.i_jkc_mag)
Several additional quality cuts similar to those recommended by Riello et al. (2021) and Gaia Collaboration et al. (2022b) were applied to remove stars likely affected by blending or poor photometry which amounted to 30-36% of stars depending on the sample. These cuts are detailed in Table 3 of Appendix A in A24, and include cuts on the following parameters: ipd_frac_multi_peak, ipd_frac_odd_win, , and (Riello et al., 2021).
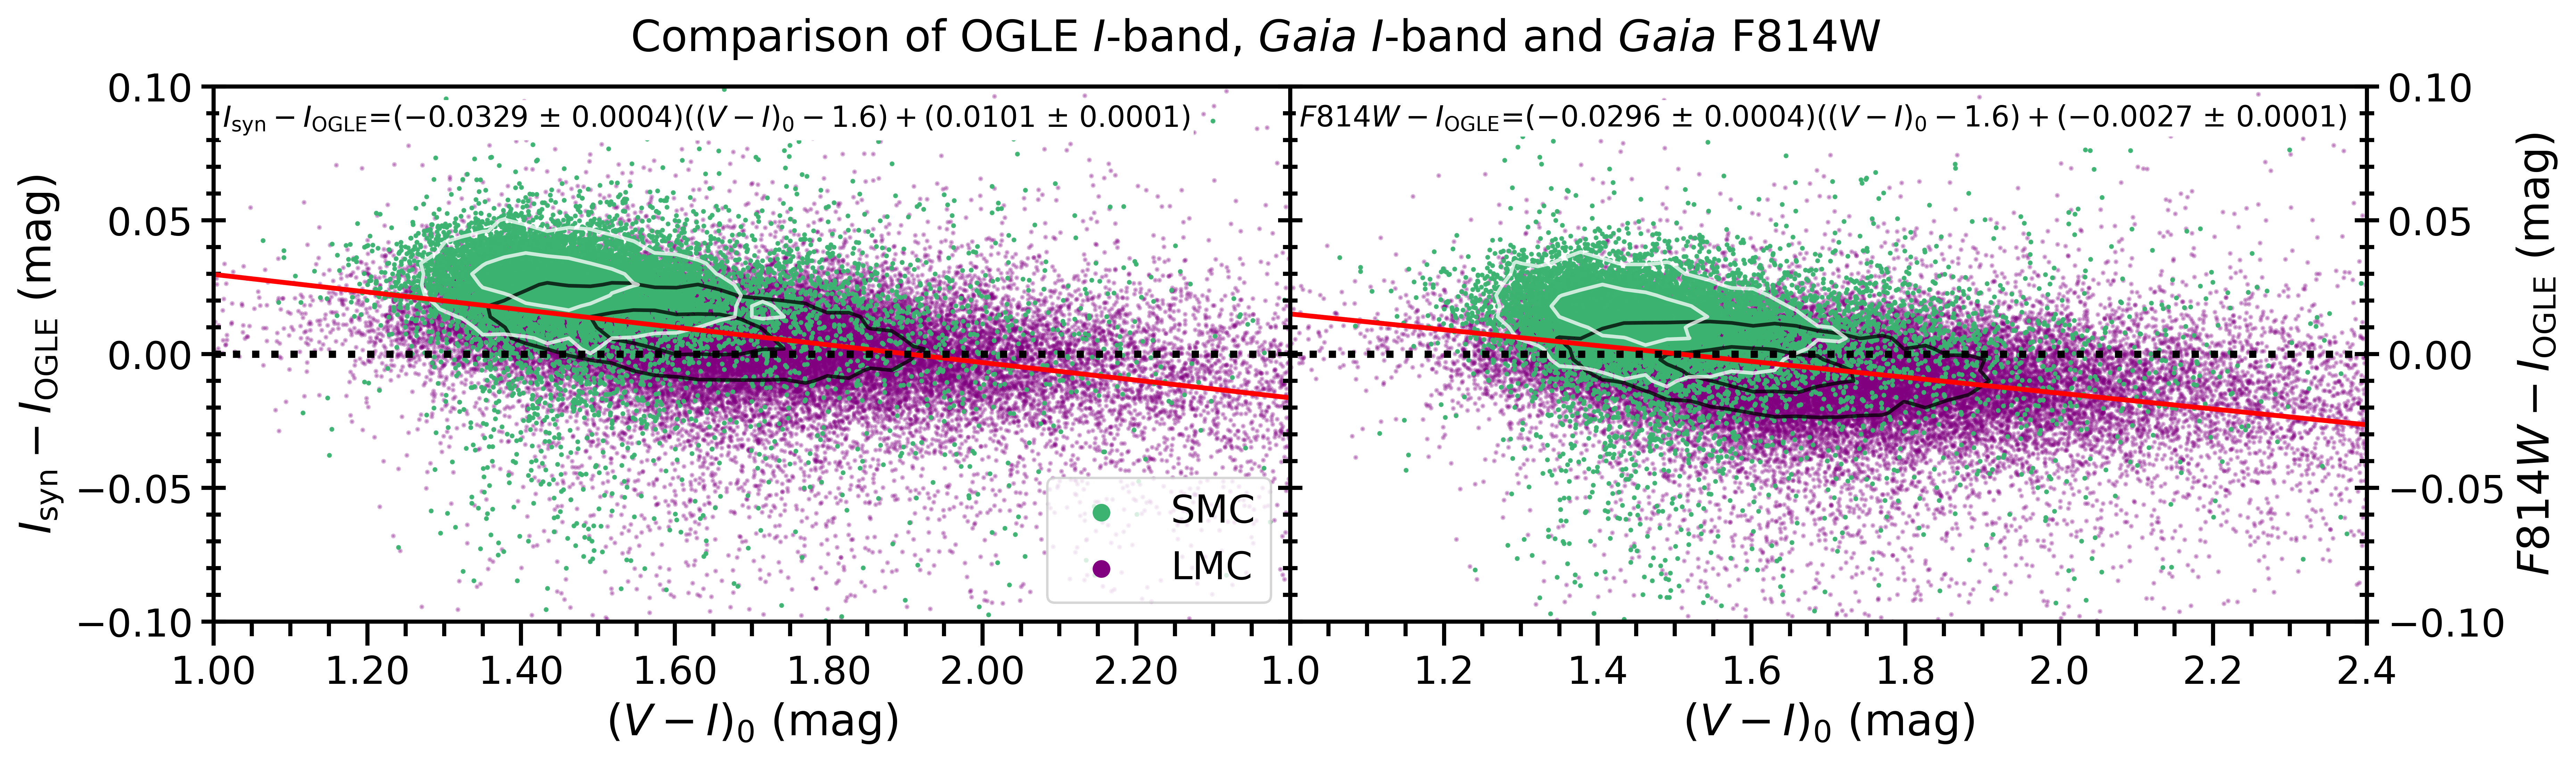
band photometry from OGLE-III, Gaia’s synthetic Cousins band, and Gaia’s synthetic F814W band are all similar, although slightly different. We investigated differences between OGLE band and Gaia’s synthetic Cousins and F814W for all SMC and LMC SARGs and found a significant trend with color shown in Figure 4. Fitting the trends with straight lines, we obtained mag with an rms scatter of approximately 0.026 mag, in line with the dispersion of mag found for the validation of Gaia synthetic photometry based on globular clusters (Gaia Collaboration et al., 2022b). Despite the scatter, the color-dependence is highly significant and should be accounted for when mixing photometric systems. To avoid issues related to mixed photometric systems, we primarily considered TRGB measurements based on Gaia’s synthetic F814W photometry, although we also reported measurements based on OGLE band, Gaia Cousins band, and Gaia spectrophotometric magnitudes.
Suspected foreground stars were removed if they met the following criteria: the star had high quality astrometry (RUWE), and either the star has a parallax satisfying with a signal-to-noise ratio of , or the star was outside the proper motion ellipse: (Gaia Collaboration et al., 2021).
2.3 Additional information considered
We further collected information on iron abundance ([Fe/H]) and stellar ages based on infrared spectroscopy from the Apache Point Observatory Galactic Evolution Experiment using the APOGEE Stellar Parameters and Chemical Abundances Pipeline (Pérez et al., 2016; Jönsson et al., 2020) and specific studies of RGs in the Magellanic clouds (Povick et al., 2023a, b). Table 1 provides an overview of the RG populations in the SMC and LMC based on this information. For each RG sample, we determined the median color, period, amplitude, [Fe/H], mass, and age of all stars within mag of the TRGB. We note that [Fe/H], age, and mass were derived from much fewer stars than the other parameters due to the smaller spectroscopic dataset.
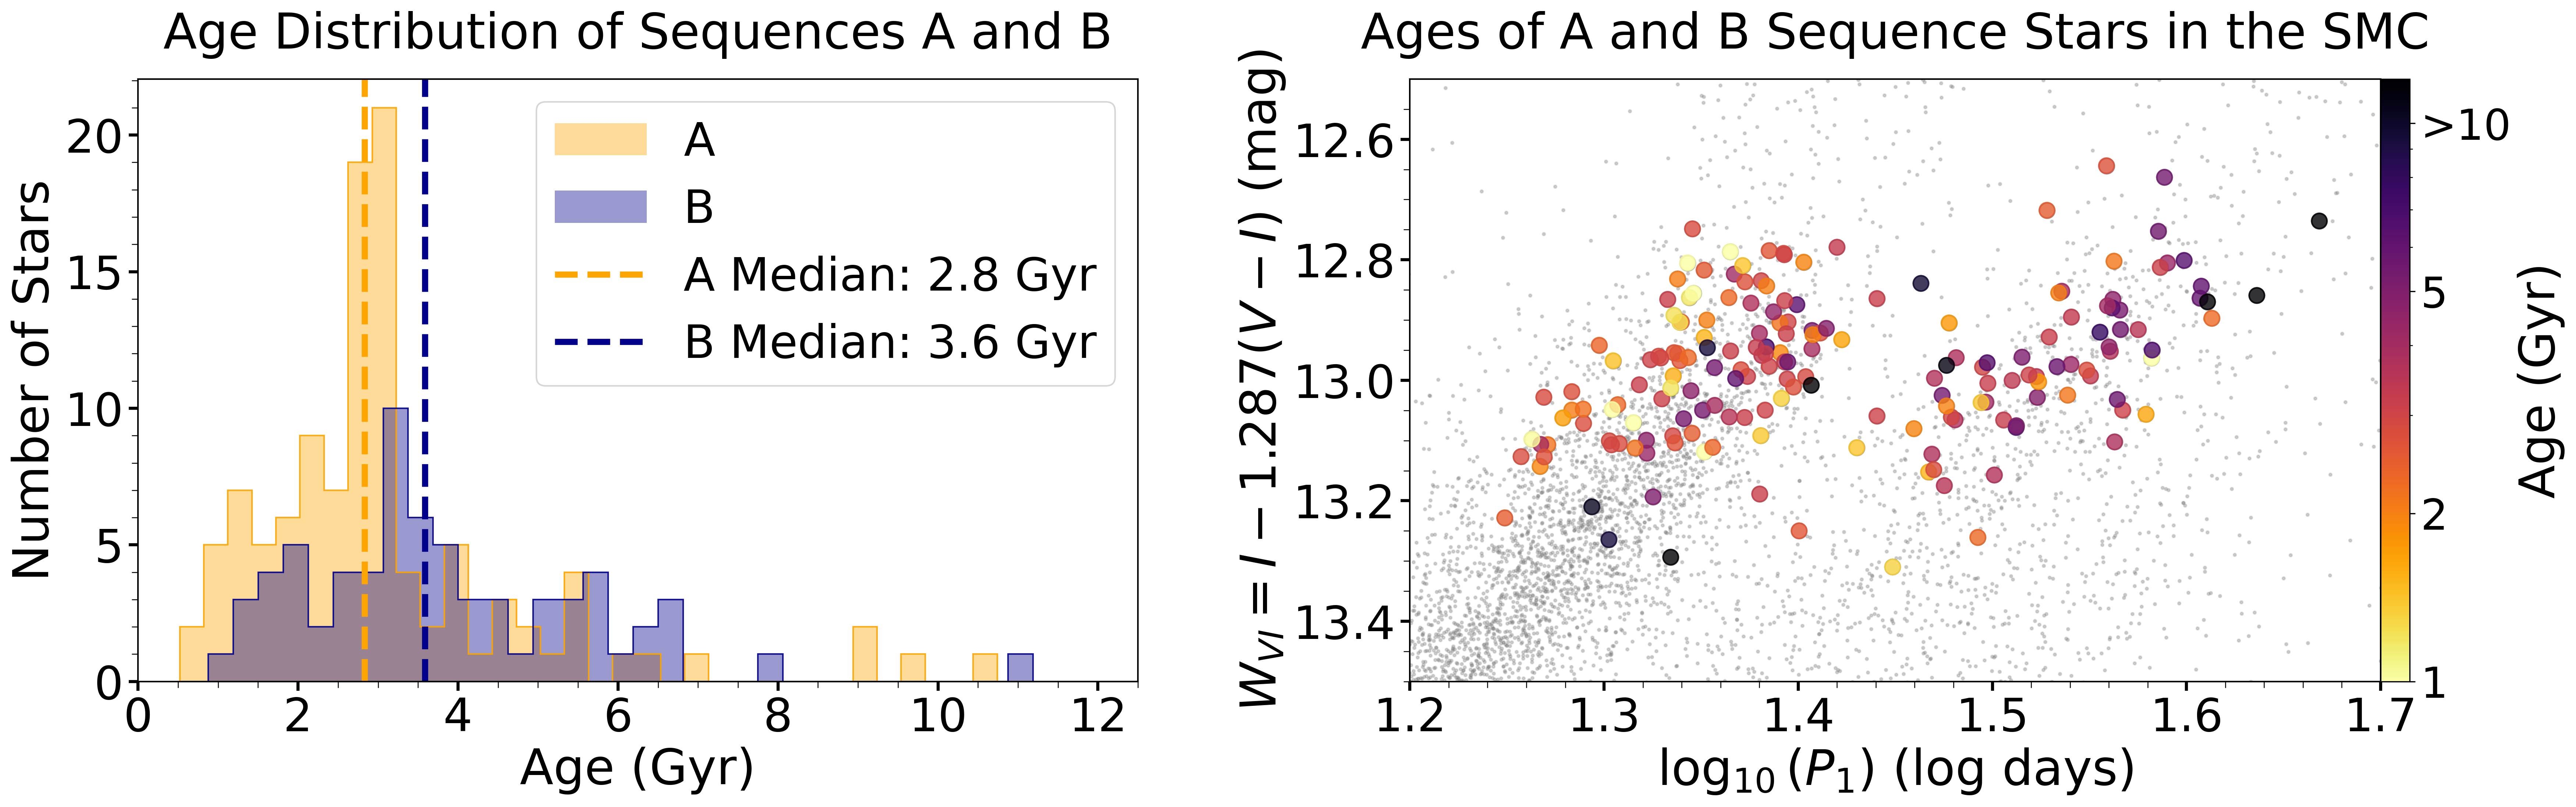
As expected, we see that the SMC stars are slightly more metal-poor than the LMC, with the LMC stars near [Fe/H] = -0.7 dex and the SMC near [Fe/H] = -1.0 (Pérez et al., 2016). Additionally, Fig. 5 shows ages from Povick et al. (2023b) and reveals B-sequence RGs to be older than A-sequence RGs in the SMC, as A24 found in the LMC. This confirms the evolutionary scenario of SARGs proposed by Wood (2015), which describes the P-L sequences of long-period variables as an evolutionary sequence. Interestingly, however, the SMC RGs are overall younger than the RGs in the LMC. Further support for the evolutionary scenario of the LPV sequences comes from the mass differences between A-sequence and B-sequence stars, which are in the LMC and in the SMC, respectively, and agree well with the expectation based on pulsation models (Wood, 2015, ).
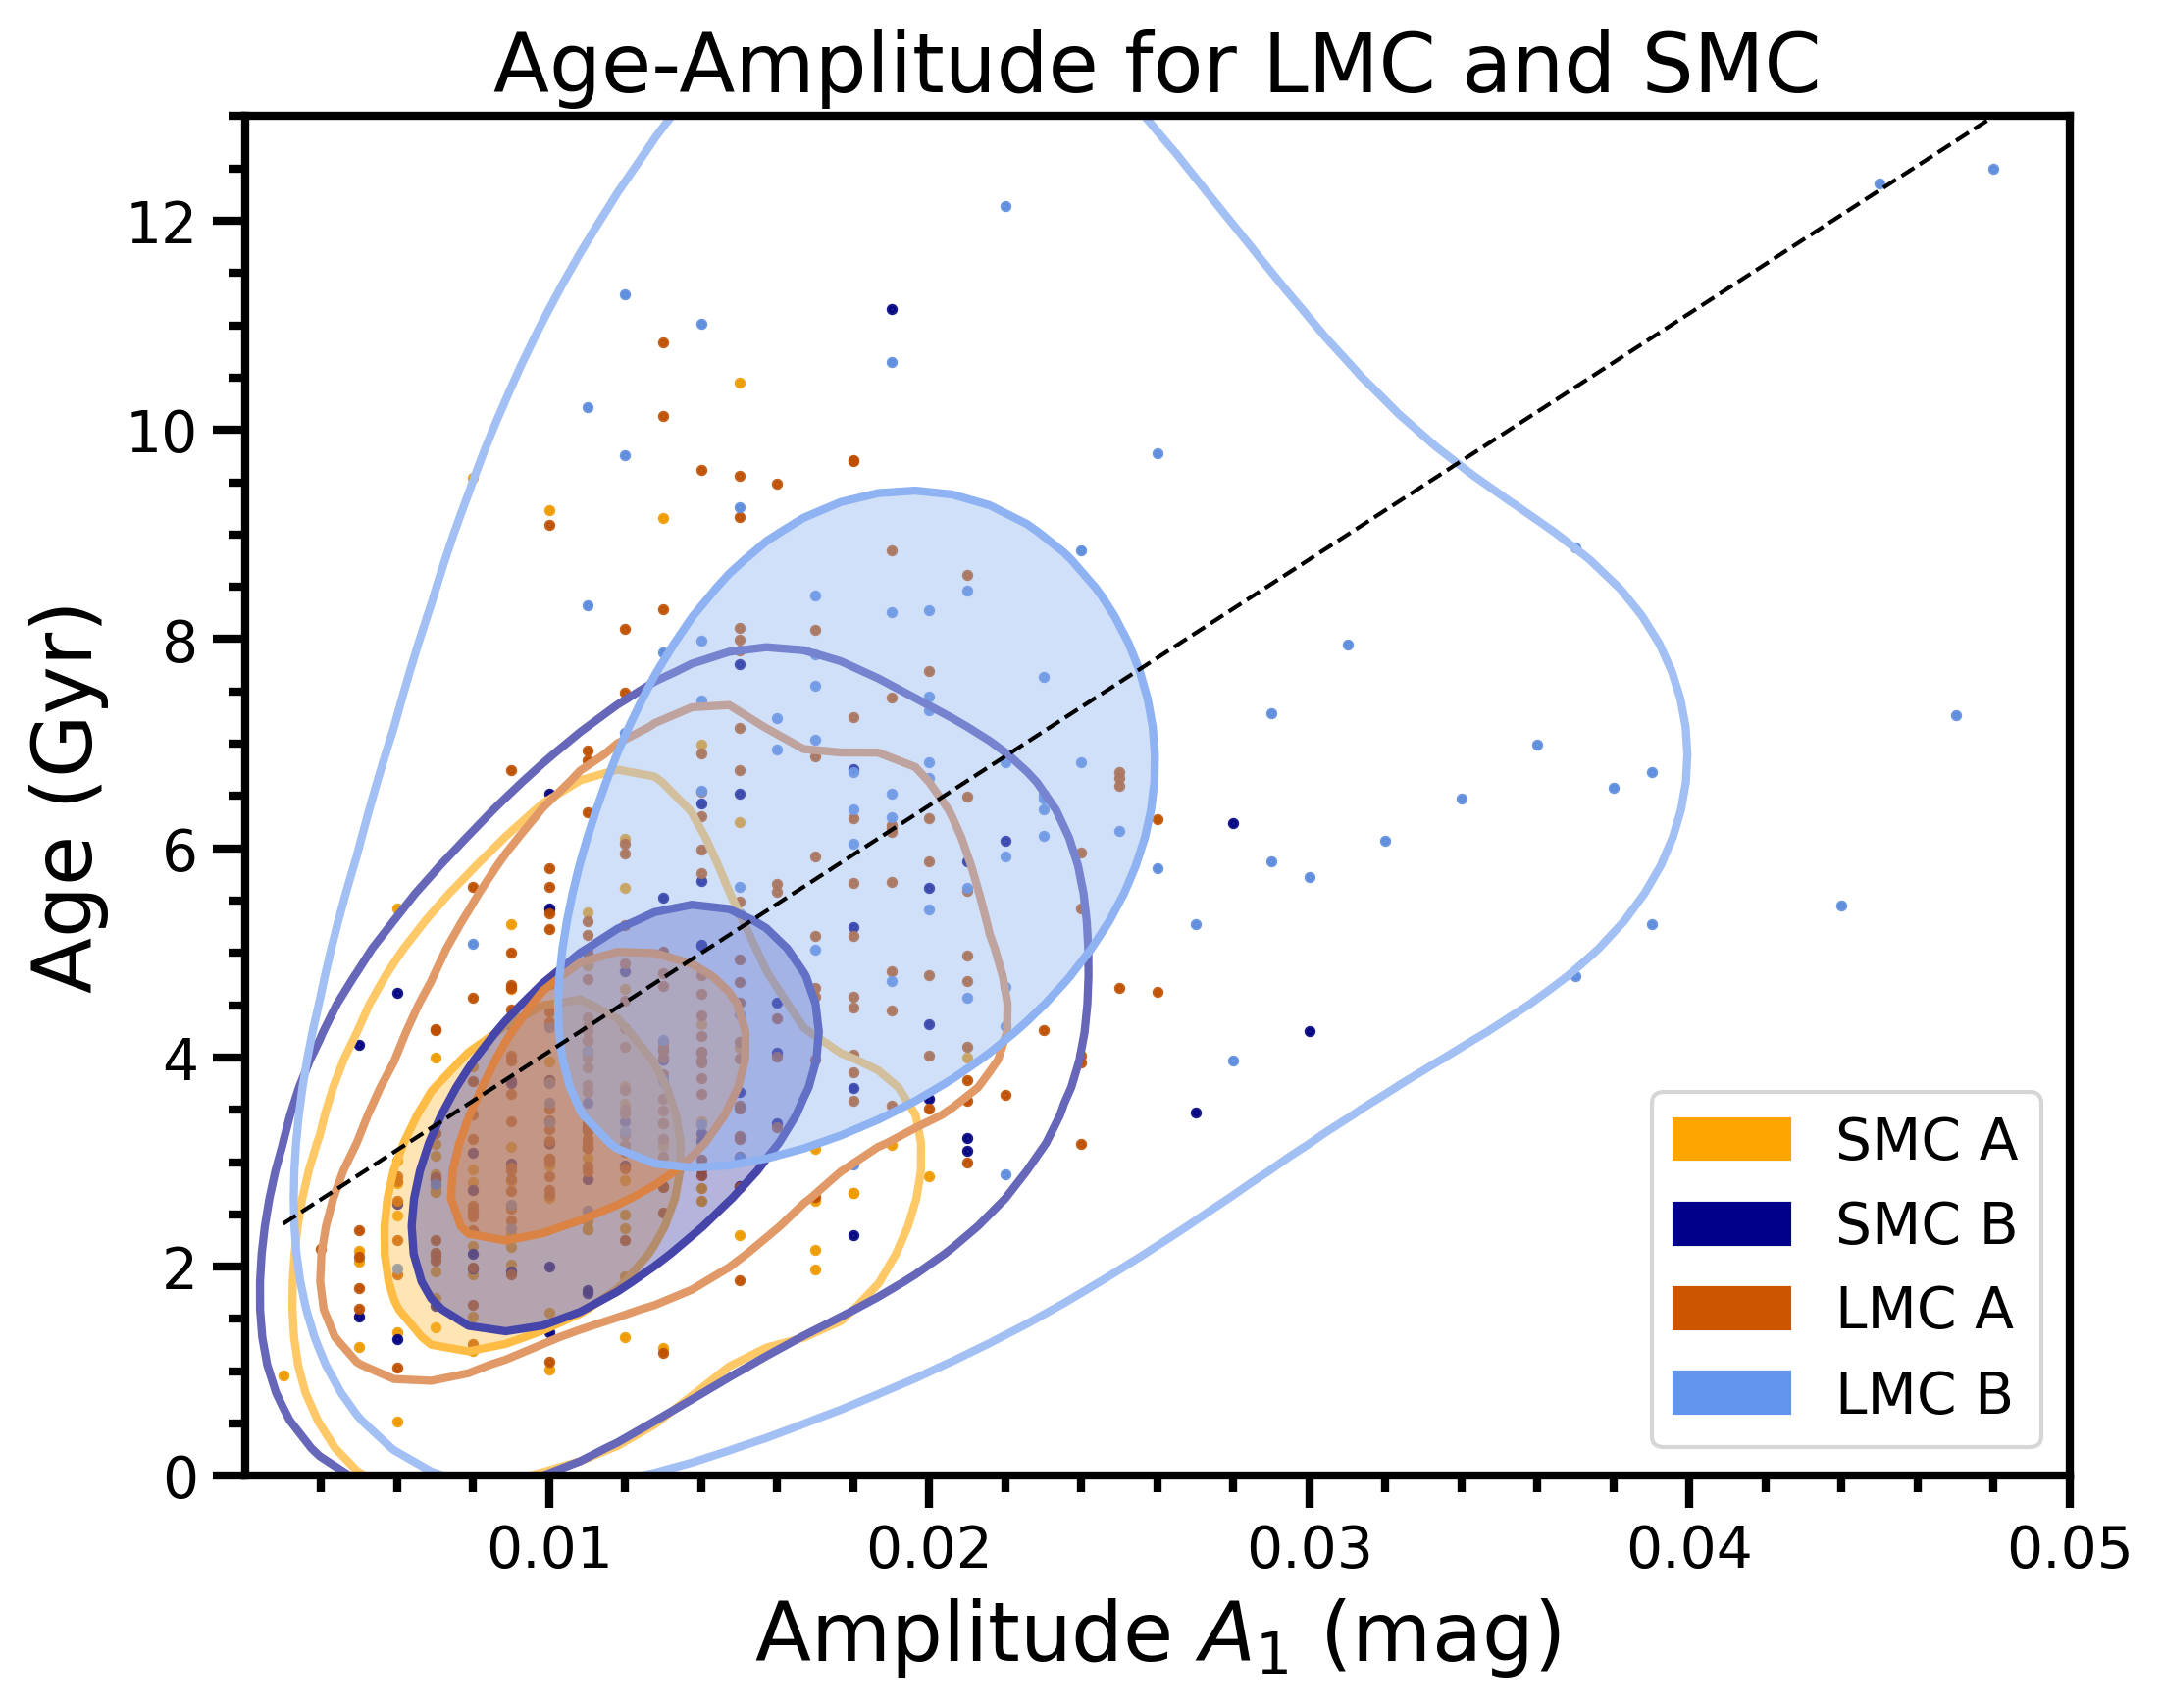
Figure 6 shows that older stars have higher amplitudes in both the A-sequence and B-sequence samples, and that the older LMC stars have higher amplitudes on both sequences than the younger SMC stars. It thus appears that the variance of RG magnitudes in an extragalactic context could usefully identify the older, higher-amplitude variability of the older RG populations, which are particularly desirable for extragalactic TRGB measurements. We note that the correlation between amplitude and age is not a selection effect related to photometric incompleteness since the lower amplitudes are found among the fainter stars in the SMC.
2.4 Reddening
All stars are de-reddened () using the reddening map for the Magellanic system based on OGLE-IV Red Clump stars (Skowron et al., 2021) and , , calculated using pysynphot (STScI Development Team, 2013), assuming the spectrum of a typical RG star near the tip (Anderson, 2022) and the recommended value for the SMC from Bouchet et al. (1985) and Gordon et al. (2003) who derived it using O-B stars. As a check, we also considered in Section 3.4, which yields (as in A24). We removed stars with mag to reduce the impact of reddening law uncertainties, leading to a mean of mag.
We averaged the statistical uncertainties from reddening maps ( and ) for each value obtained from Skowron et al. (2021) and combined them in quadrature with the photometric statistical uncertainties. The reddening uncertainties clearly dominate the combined statistical photometric uncertainties, whose average turned out to be mag for SARGs. These were used in the Monte Carlo method to determine a final statistical uncertainty for the TRGB magnitude.
2.5 Determining the TRGB Magnitude
The process for determining the TRGB follows the methodology detailed by A24 and adapted from Hatt et al. (2017). First, a smoothed luminosity function (LF) is obtained by binning the dereddened band magnitudes and in turn smoothing the LF using a Gaussian-windowed LOcal regrESSion (GLOESS) algorithm that depends on the smoothing parameter (Persson et al., 2004). The measured TRGB magnitude, , corresponds to the inflection point of this smoothed LF and is determined by the maximum of an unweighted [-1, 0, +1] Sobel filter response curve. While several recent studies adopted a weighted Sobel filter response curves to determine (Scolnic et al., 2023; Wu et al., 2022; Li et al., 2023; Hoyt, 2023), we prefer an unweighted Sobel filter edge detection response (EDR) because weighting introduces a systematic on that depends on the properties (specifically contrast) of the LF, which can only be assessed a posteriori (A24).
Uncertainties are determined through a Monte Carlo simulation that remeasures the TRGB after sampling stellar magnitudes from Gaussian distributions, using the photometric and reddening errors. The Monte Carlo was iterated 1000 times to extract a mean TRGB and standard deviation for the range .
A24 pointed out the importance of bias introduced by smoothing, which can impact the value of depending on the shape of the observed LF. Following A24, we measured the global value using the range of values where remains insensitive to the smoothing parameter as measured by the derivative, . Specifically, we considered the lowest, continuous range satisfying . The reported values of are the median of the values satisfying these criteria.
| Uncertainty | Includes / based on | |||
| Estimation of statistical uncertainty | ||||
| Average: 0.062 mag. Computed as quadratic sum of: | ||||
| Photometric uncertainties (Udalski et al., 2009; Soszyński et al., 2011; Gaia Collaboration et al., 2022b) | ||||
| , with the average of , from Skowron et al. (2021) | ||||
| , with mag, the systematic uncertainty from Skowron et al. (2021) | ||||
| Gaia GSPC: standardization uncertainties from Gaia Collaboration et al. (2022b) | ||||
| Dispersion of 1000 MC resamples per value | ||||
| Total statistical uncertainty on : median across range, where | ||||
| In case of also considers statistical uncertainty of geometric distance | ||||
| Systematic uncertainties of , combines bin size & phase, choice of , and algorithmic aspects | ||||
| A-sequence | 0.015 | |||
| B-sequence | 0.008 | |||
| SARGs | 0.006 | |||
| Allstars | 0.008 | |||
| Distance-related uncertainties | (stat.) | (syst.) | ||
| SMC DEB distance | from Graczyk et al. (2020): mag | |||
| LMC DEB distance | from Pietrzyński et al. (2019): mag | |||
| DEB distance difference | from Graczyk et al. (2020): mag | |||
2.6 Overview of statistical and systematic uncertainties
Table 2 summarizes the systematic uncertainties applicable to our results, including uncertainties related to photometric systems, dereddening, metallicity corrections, and the algorithmic implementation of TRGB determination. We further note the importance of measuring using consistent and properly standardized methods to avoid bias. As a reminder, we used an unbiased [-1,0,1] Sobel filter for edge detection to avoid correlations between the measured and tip contrast.
We report as statistical uncertainties on , , the median of the standard deviations across the range of values, where . The Monte Carlo resampling considers the total photometric uncertainty for each star, , obtained by the squared sum of reported photometric uncertainties, the uncertainty of photometric standardization (in the case of Gaia synthetic photometry), and reddening-related uncertainties, which dominate the overall error budget. Absolute magnitudes further consider the statistical uncertainties of the geometric distances.
Differences between photometric systems were considered in Section 2.2 and can be applied if needed. However, we considered only direct comparisons between identical photometric bands.
Systematic uncertainties on , , include contributions from bin size and phase variations (estimated following A24), the choice of the reddening law (cf. Section 2.4), and simulation-based bias estimates following Appendix B in A24, adapted here to match the LF shapes in the SMC. We note that the systematic error of the red clump color excesses of mag (Skowron et al., 2021) is already included in . Absolute magnitudes further consider the systematic uncertainties of the geometric distances.
2.7 Absolute magnitudes and relative distances
We determined absolute TRGB magnitudes, , using the measured apparent magnitudes, , and the known distance modulus of the SMC, mag, from Graczyk et al. (2020). In the case of the LMC, we use mag from Pietrzyński et al. (2019).
We further determined the relative distance modulus, , by considering the difference of the apparent magnitudes of the RGB tips in both galaxies, . We compared these distance differences to the equivalent number determined using the geometric distances of the detached eclipsing binaries ( mag) based on 15 systems in the SMC and 20 in the LMC (Graczyk et al., 2020; Pietrzyński et al., 2019). We note that the uncertainty on is smaller than the squared sum of uncertainties for both galaxies due to shared systematics.
3 Results
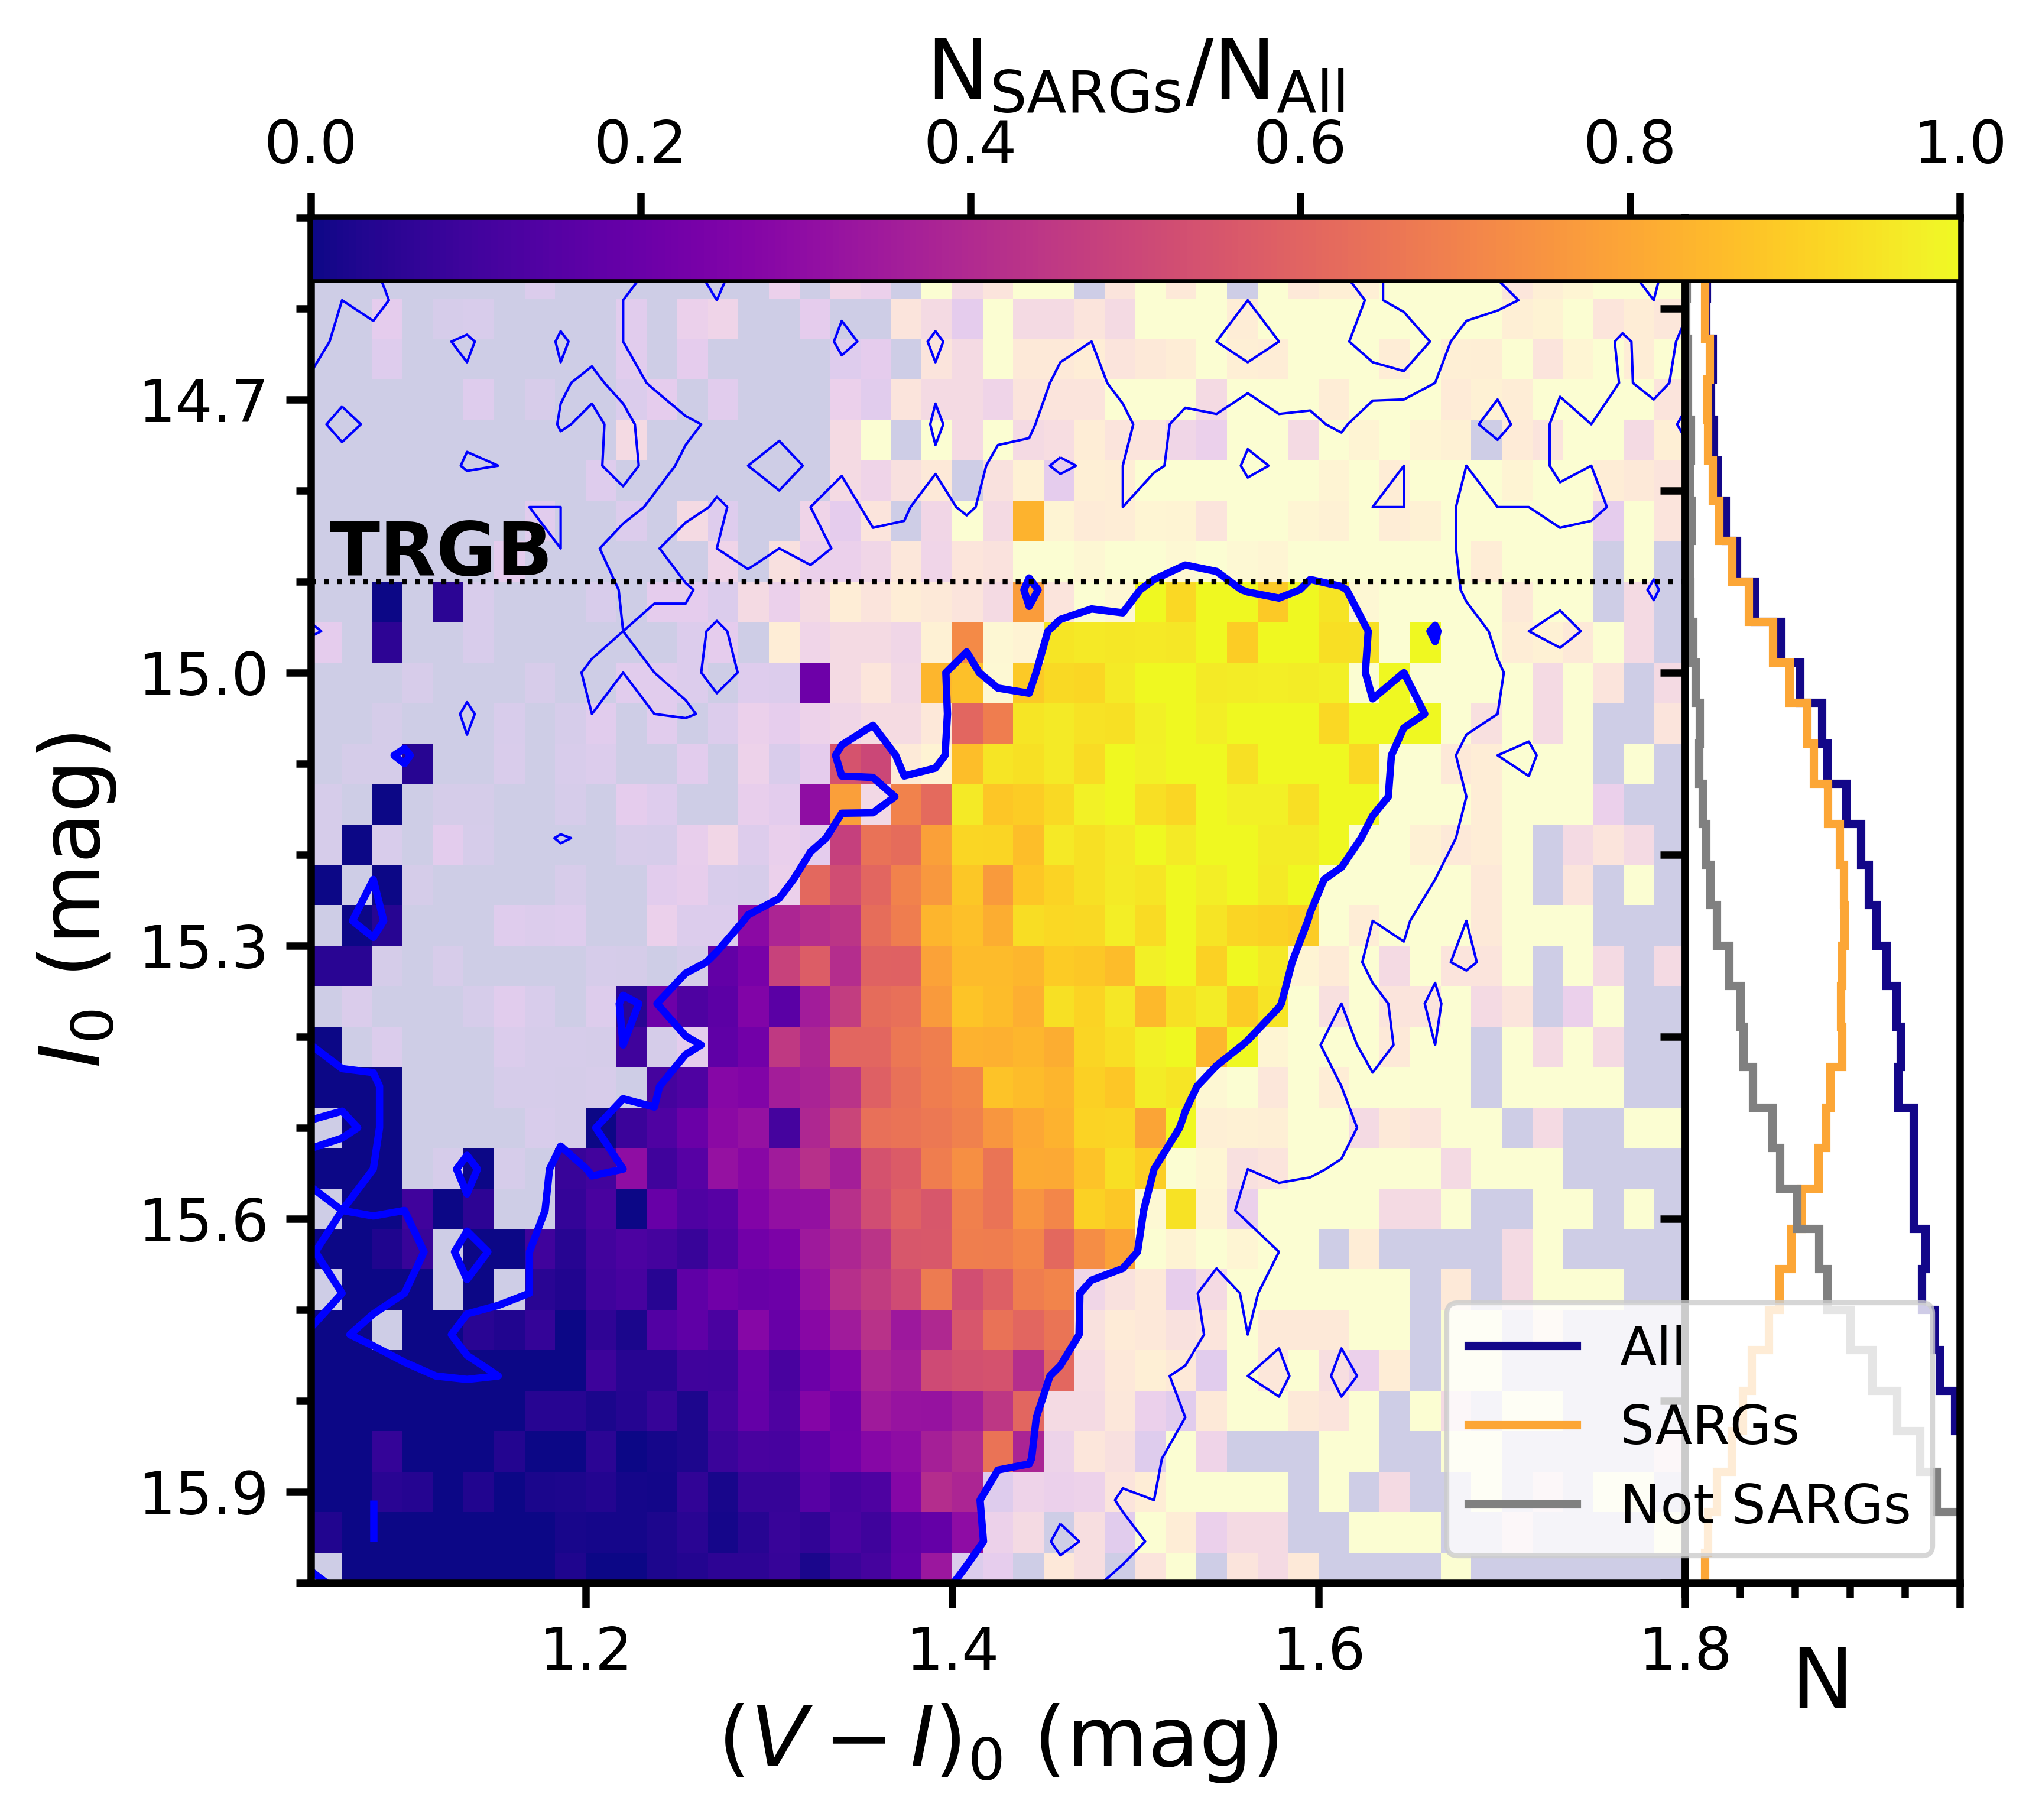
A24 recently showed that virtually all red giant stars near the RGB tip in the LMC are SARGs. Figure 7 shows the analogous behavior for red giants in the SMC: nearly 100% of SMC stars near the RGB tip inside the OGLE-III footprint are SARGs. Given the agreement between LMC and SMC in this regard, it seems clear that this level of variability is an astrophysical property of stars near the helium flash.
From Fig. 3, it is clear that the periods of the A & B-sequence SARGs are systematically shorter in the SMC compared to the LMC in addition to featuring smaller amplitudes. The following first measures the SMC TRGB magnitudes and then proceeds to exploit variability features (periods and amplitudes) to investigate the impact of astrophysical differences on TRGB measurements.
3.1 Apparent TRGB magnitudes in the SMC
| LMC | SMC | SMC-LMC | LMC | SMC | ||
| Passband | Sample | (mag) | (mag) | (mag) | (mag) | (mag) |
| A | 14.545 0.013 | 15.056 0.052† | 0.511 0.054† | -3.932 0.014 | -3.921 0.055† | |
| B | 14.459 0.014 | 14.911 0.009 | 0.452 0.017 | -4.018 0.015 | -4.066 0.018 | |
| OSARGs | 14.501 0.010 | 14.947 0.038 | 0.446 0.040 | -3.976 0.011 | -4.030 0.041 | |
| AllStars | 14.495 0.021 | 14.959 0.041 | 0.464 0.046 | -3.982 0.021 | -4.018 0.044 | |
| A | 14.543 0.012 | 15.070 0.053† | 0.527 0.054† | -3.934 0.013 | -3.907 0.055† | |
| B | 14.457 0.015 | 14.933 0.010 | 0.476 0.018 | -4.020 0.016 | -4.044 0.019 | |
| OSARGs | 14.497 0.011 | 14.968 0.037 | 0.471 0.039 | -3.980 0.012 | -4.009 0.041 | |
| AllStars | 14.478 0.029 | 14.969 0.037 | 0.491 0.047 | -3.999 0.029 | -4.008 0.040 | |
| A | 14.537 0.012 | 15.053 0.055† | 0.516 0.056† | -3.940 0.013 | -3.924 0.057† | |
| B | 14.452 0.013 | 14.920 0.010 | 0.468 0.016 | -4.025 0.014 | -4.057 0.019 | |
| OSARGs | 14.491 0.010 | 14.953 0.038 | 0.462 0.039 | -3.986 0.011 | -4.024 0.041 | |
| AllStars | 14.473 0.027 | 14.956 0.039 | 0.483 0.047 | -4.004 0.027 | -4.021 0.042 | |
| A | 14.690 0.009 | 15.194 0.051† | 0.504 0.052† | -3.787 0.010 | -3.783 0.054† | |
| B | 14.607 0.013 | 15.055 0.010 | 0.448 0.016 | -3.870 0.014 | -3.922 0.019 | |
| OSARGs | 14.640 0.009 | 15.091 0.035 | 0.451 0.036 | -3.837 0.010 | -3.886 0.038 | |
| AllStars | 14.635 0.024 | 15.092 0.040 | 0.457 0.047 | -3.842 0.024 | -3.885 0.043 | |
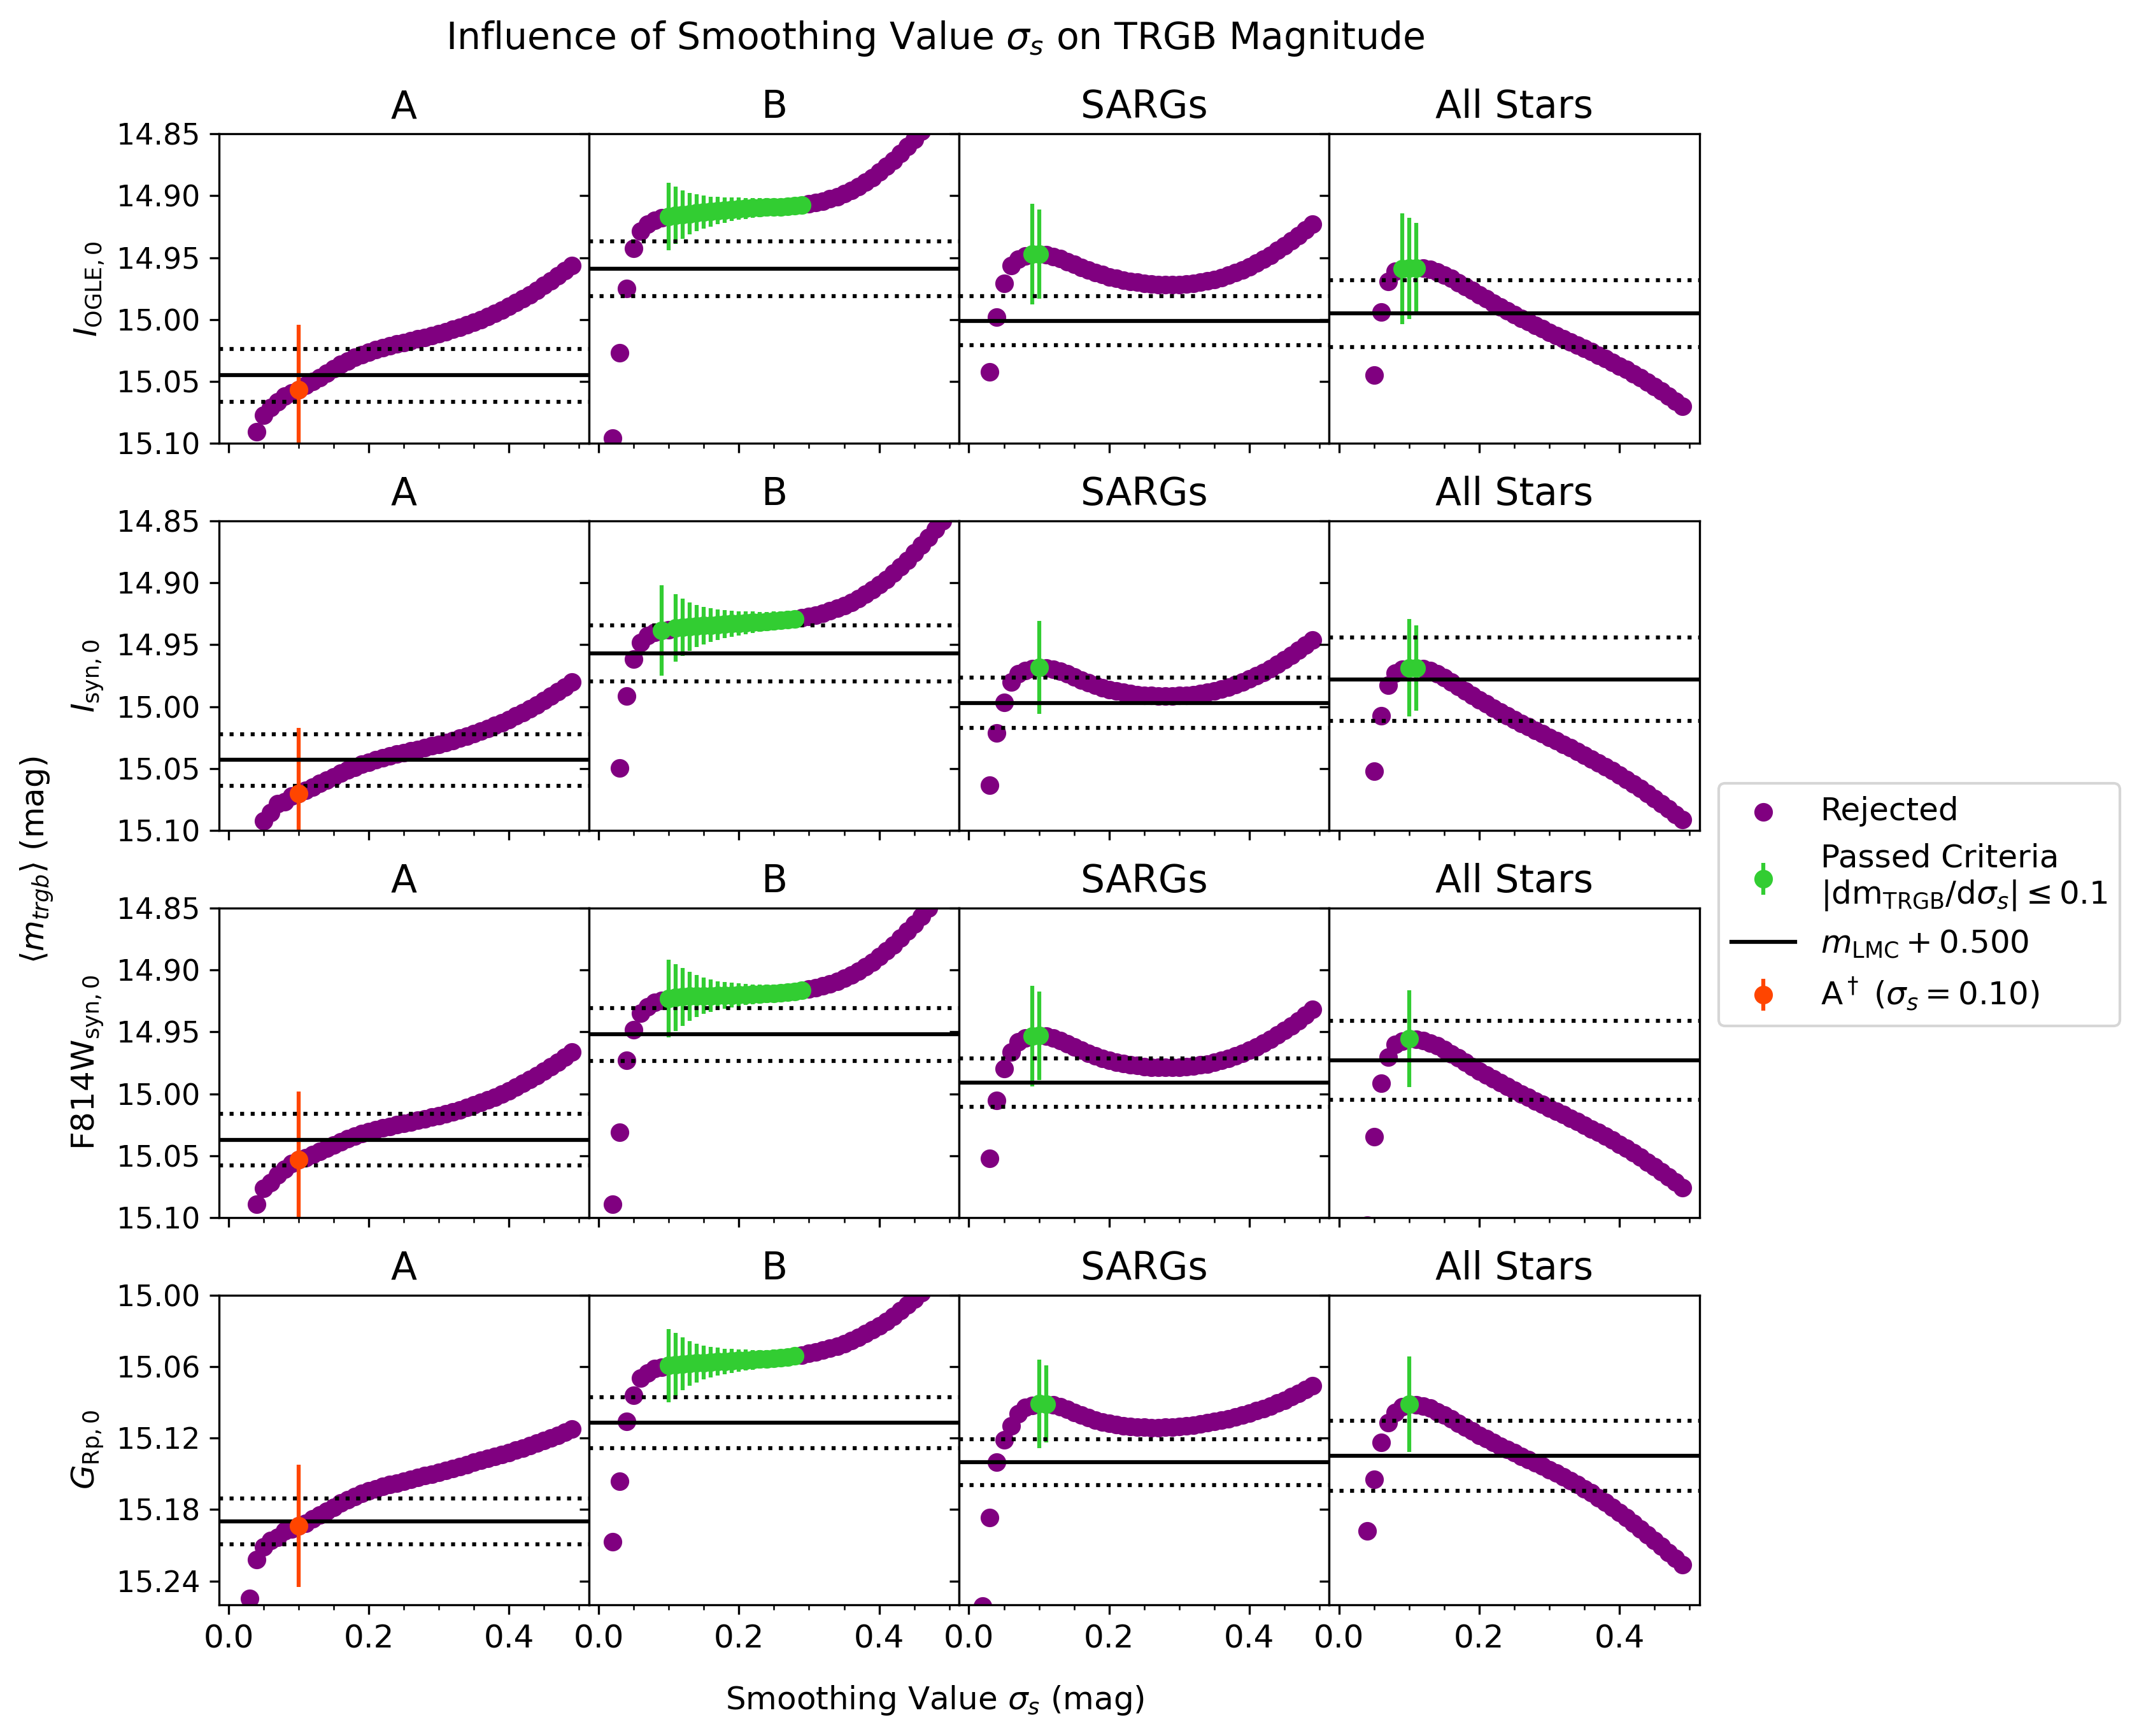
Figure 8 illustrates the TRGB measurements obtained as a function of for different samples and photometric datasets; these results are listed numerically in Tab. 3 alongside the LMC results presented in A24. The smoothing insensitive range of over which we determine the final values of is highlighted using green circles with errorbars that correspond to . As in A24, we find that the shape of the observed LF has a significant impact on smoothing bias. Additionally, the same hierarchy of magnitudes is found in the SMC as was reported in the LMC by A24: the B-sequence sample consistently yields the brightest , followed by SARGs (and Allstars), and the A-sequence sample always yields the faintest . SARGs and Allstars results are fully consistent with each other, as expected from the fact that all red giants near the TRGB are also SARGs (Fig. 7). As in A24, we find that the Allstars LFs is rather sensitive to smoothing bias and that only a small range of values yields consistent TRGB magnitudes.
The B-sequence sample yields the best TRGB measurement over the largest range of in the SMC, whereas the SARGs sample had provided the best overall measurement in the LMC (A24). Specifically, we measured mag for the B-sequence, which is slightly more precise than the B-sequence in the LMC and subject to a systematic uncertainty of mag (Tab. 2). The gain in precision for the B-sequence TRGB measurement is driven by the higher degree of smoothing, which by construction boosts the Sobel filter signal (Hatt et al., 2017). We use the B-sequence as our baseline for further inspections of systematics such as metallicity and reddening effects.
Contrary to the LMC, the SMC’s A-sequence sample is particularly sensitive to smoothing bias and there is indeed no range of where the dependence of on is flat. As a result, we consider the A-sequence measurement less reliable and consider it below only for comparison and using a fixed value of mag, which corresponds to the typical smoothing value for the LMC A-sequence (A24) and is not far from the typical combined photometric uncertainty. This yields mag, with an additional systematic uncertainty of mag (Tab. 2).
We find similar values of for the SARGs and Allstars samples of mag and mag, respectively. Similar to the A-sequence, we find a very restricted range for the SARGs and Allstars samples. This is likely the case because A-sequence stars are much more numerous than B-sequence stars (cf. Tab. 1) and hence dominate the LF starting at approximately mag below the B-sequence .
| Band | LMC | SMC | diff |
| -0.042 0.017 | -0.036 0.039 | 0.1 | |
| -0.040 0.019 | -0.035 0.039 | 0.1 | |
| -0.039 0.016 | -0.033 0.039 | 0.1 | |
| -0.033 0.016 | -0.036 0.036 | 0.1 | |
| -0.086 0.019 | -0.146 0.053† | 1.1† | |
| -0.086 0.019 | -0.137 0.054† | 0.9† | |
| -0.085 0.018 | -0.133 0.056† | 0.8† | |
| -0.083 0.016 | -0.139 0.052† | 1.0† | |
Table 4 compares apparent magnitude differences between the samples in both galaxies and shows that the B-sequence sample yields a mag brighter magnitude than the SARGs in both the SMC and the LMC. The B-sequence is furthermore brighter than the A-sequence by mag in the SMC and mag in the LMC. This brightness difference is readily apparent also in the LFs in Fig. 2 and established independently of distance, with similar differences in every photometric band considered ( mag variation). Therefore we conjecture that this brightness difference is of astrophysical origin and can be found in other galaxies as well.
Interestingly, we find that is mag brighter than in the SMC. Conversely, in the LMC is slightly brighter than , although both agree to within a few mmag. The difference is more pronounced for Allstars. Considering that the LMC stars near the Tip are redder than the SMC, the difference between the SMC and LMC samples is consistent with the color-dependent photometric system differences seen in Figure 4. Moreover, the difference between and in the SMC matches the star-to-star comparison presented in Section 2.2 above, which yields an average difference of mag.
3.2 Spatial analysis shows radial metallicity gradient

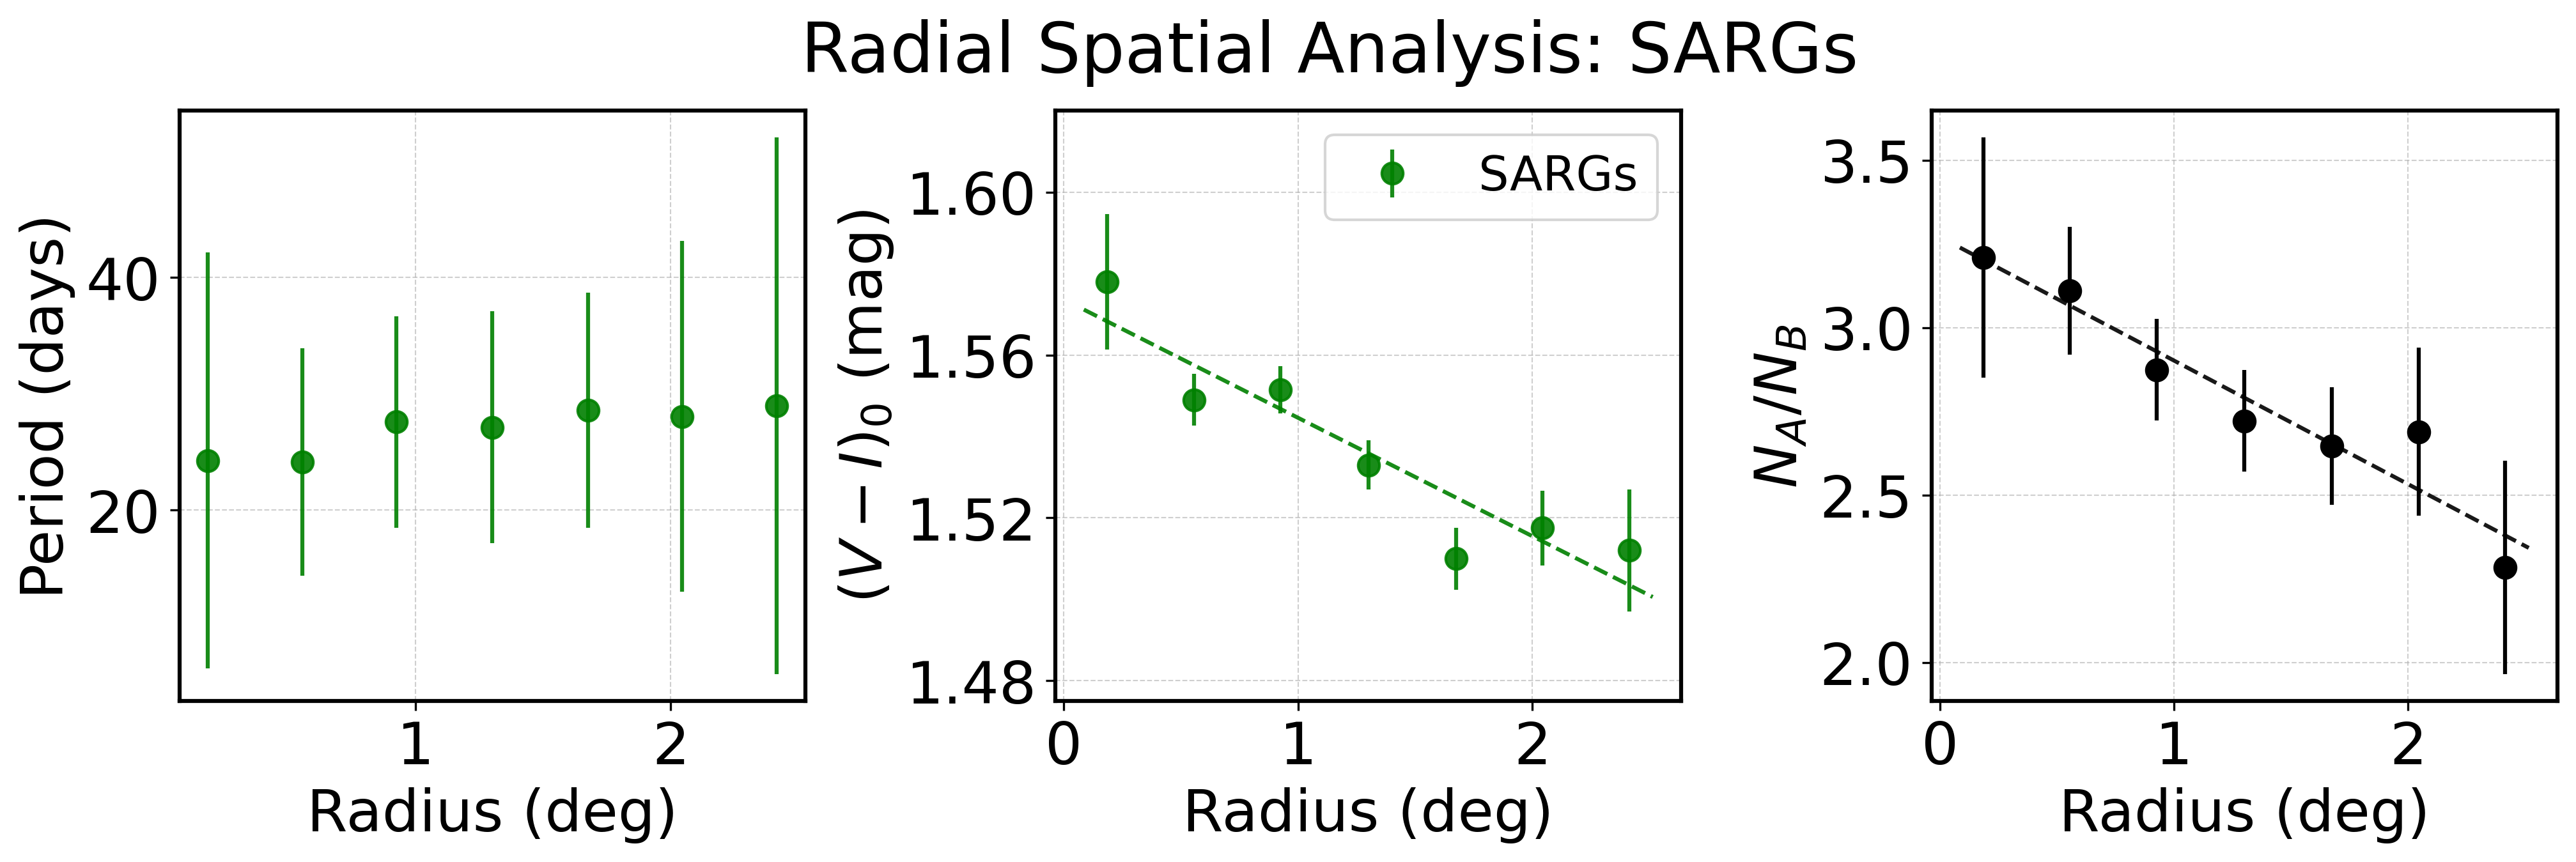
The SMC’s metallicity gradient has been traced using RGB stars (Povick et al., 2023b; Li et al., 2024) and classical Cepheids (Breuval et al., 2022, their Fig. 5). Here, we show that SARGs also trace the SMC’s metallicity gradient. We grouped stars into spatial rings based on their radial separation from the SMC center (12.44∘, -72.94∘) (Graczyk et al., 2020). The annular regions were defined at 7 equidistant intervals out to a maximum radius of 2.6 degrees from the core. The mid-radius, i.e., the region half-way between inner and outer boundary, is used to quantify the radial trends.
We computed the median period and median color for each ring for stars with band magnitudes between and mag for all three samples involving SARGs. While we also attempted to measure the TRGB magnitude of each ring, noise due to insufficient number of stars complicates detecting a significant trend in .
As Figure 9 shows, the median period and color both the A-sequence and B-sequence samples increase towards the SMC’s core. This suggests that RGs in the SMC’s core have higher metallicity, which causes them to appear redder and exhibit larger radii due to line blanketing. Given a nearly constant mass, larger radii result in longer periods. Furthermore, the ratio of increases towards the center, implying an age gradient since A-sequence stars are younger than B-sequence stars (cf. Figure 5 and Table 1). Both trends suggest a younger and more metal-rich core, likely a consequence of the SMC’s cumulative star formation history. Hence, the variability of RG near the TRGB provides useful information for inferring the properties of the RG populations.
Figure 10 shows the analogous radial analysis based on the SARGs sample, which does not distinguish between P-L sequences and is mostly composed of A-sequence and B-sequence stars. The ratio of the number of stars on the two sequences is seen to increase towards the center, as is the average color. However, there is no radial trend with average period because the relative increase in shorter-period A-sequence stars towards the center compensates the trends with period that are present on both sequences. These trends can only be recovered by selecting samples according to their period-luminosity sequences. Thus, while color traces metallicity trends regardless of the RG sample, tracing ages according to frequencies requires considering the dominant periods of the RGs. Table 5 lists the fitted trends from Figures 9 and 10.
| (days) | (mag) | |||||
| Sample | m | c | m | c | m | c |
| A-sequence | -0.33 | 21.81 | -0.031 | 1.56 | ||
| B-sequence | -1.45 | 36.0 | -0.021 | 1.59 | ||
| SARGs | -0.03 | 1.57 | -0.37 | 3.27 | ||
3.3 A period-color relation at the TRGB
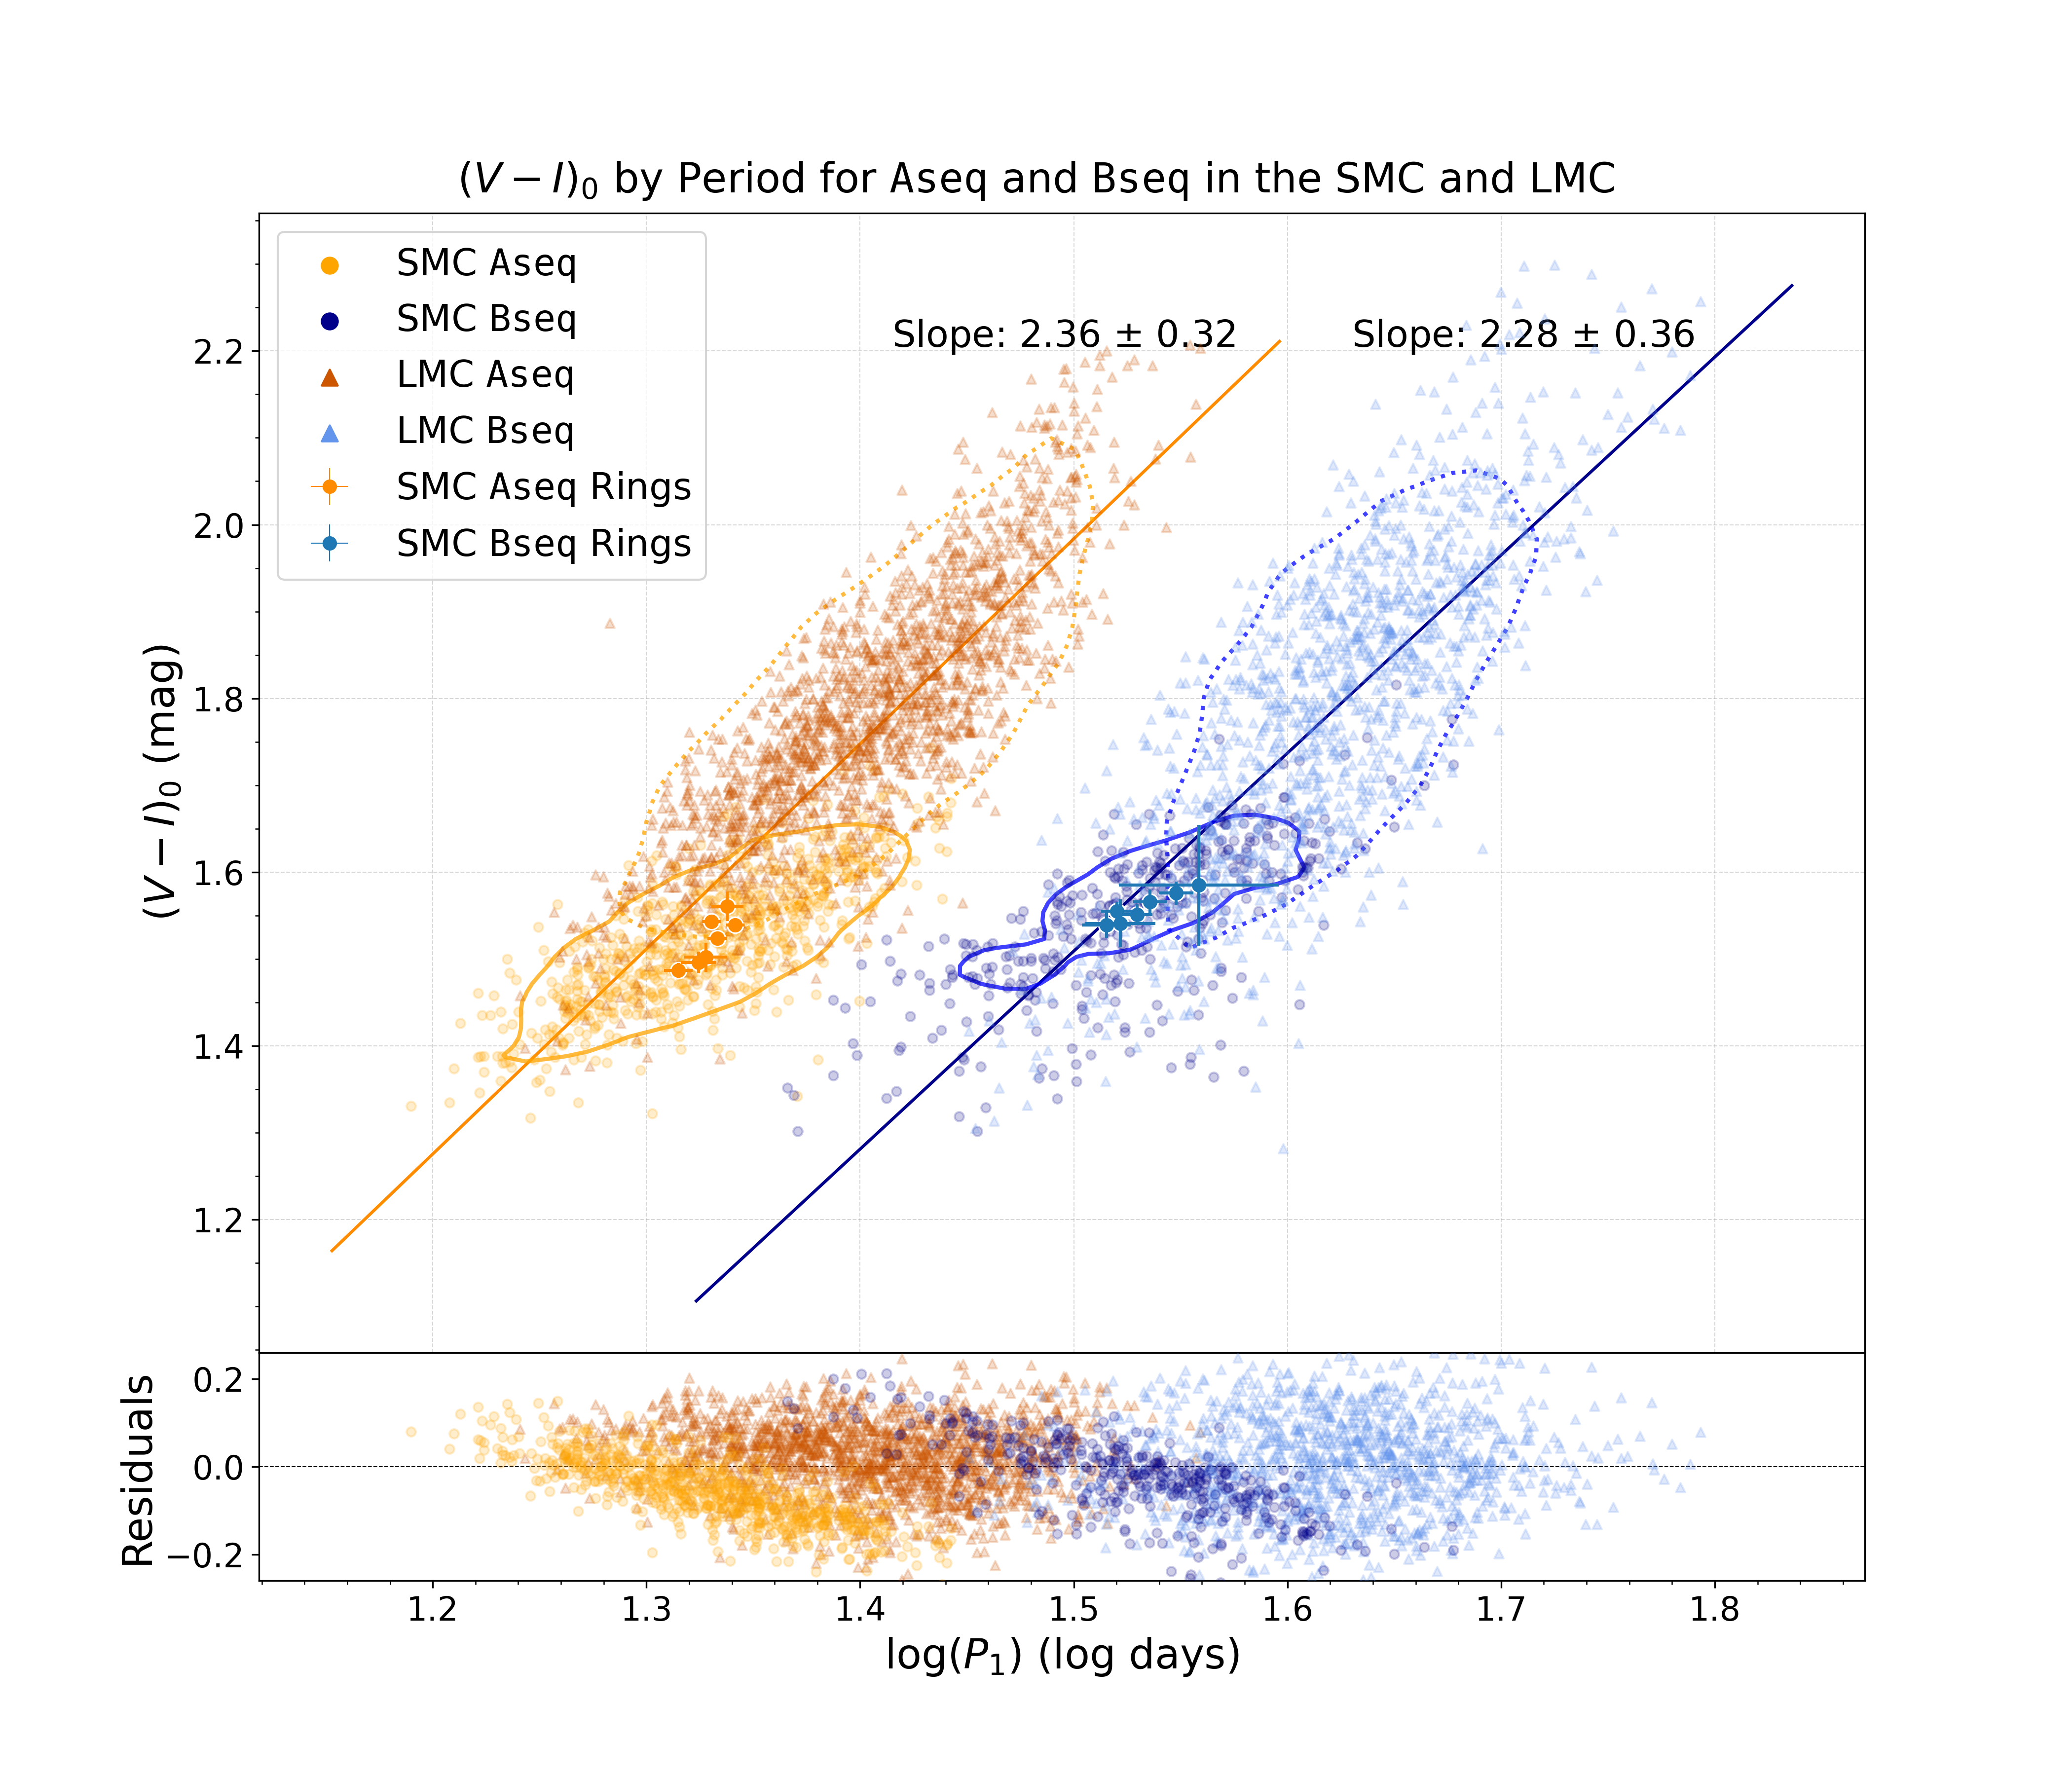
Stars near the RGB tip are intrinsically redder in the LMC than in the SMC due to the latter’s lower metallicity, cf. Tab. 1. Additionally, the periods of both B-sequence and A-sequence stars near the TRGB are shorter in the SMC than the LMC, which implies smaller radii for equal mass, since (Ritter, 1879; Rosseland, 1943), similar to the radial analysis shown above. The consequence of both (color and period) trends reverting to the same physical origin (metallicity) is the existence of a metallicity-sensitive period-color relation for small amplitude red giants near the RGB tip.
Figure 11 illustrates this period-color relation for the TRGB using stars from the A-sequence and B-sequence samples that are within mag of the respective . For the SMC, we also show average values reported for the different annular regions considered in Section 3.2 as larger errorbars. Overall, we see two rather clean sequences spanning approximately dex in and up to mag in color. While there is overlap among the stars from both galaxies, the SMC stars tend to populate the shorter-period, bluer parts of the relations, and the LMC stars the redder, longer-period parts. Remarkably, stars from both galaxies appear to mostly follow a single relation per SARG sequence. Combined fits to the SMC and LMC stars yield mag for the A-sequence and mag for the B-sequence.
The TRGB’s period-color relations provide a potentially useful tool for addressing interstellar reddening, for example for calibrating based on Gaia parallaxes of Milky Way RGs whose SARG-like variability will be classified in increasing detail in future Gaia data releases by the long-period variables specific object studies (Lebzelter et al., 2023; Eyer et al., 2023). Additionally, Section 3.5 below considers the use of these period-color relations to standardize TRGB magnitudes for metallicity differences in the absence of spectroscopic information.
3.4 Distance modulus differences measured with and without a metallicity correction
We computed the difference in distance modulus, , using the values of determined for the B-sequence and SARGs samples in Section 3.1 and listed in Tab. 3. If the absolute magnitude of the TRGB were identical in both galaxies, then one would expect to find a value of mag as measured using DEBs (Graczyk et al., 2020). However, we found that tends to be smaller than the reference number, irrespective of the sample or photometric bands considered. We therefore decided to investigate whether metallicity or dust effects could improve the agreement. The results are listed in Table 6.
| Sample | |||
|---|---|---|---|
| A-sequence | 2.7 | 0.511 ± 0.054 (0.2) | 0.569 ± 0.054 (1.2) |
| 3.3 | 0.489 ± 0.060 (0.2) | 0.547 ± 0.060 (0.8) | |
| B-sequence | 2.7 | 0.452 ± 0.017 (2.0) | 0.513 ± 0.018 (0.5) |
| 3.3 | 0.443 ± 0.018 (2.3) | 0.504 ± 0.019 (0.2) | |
| SARGs | 2.7 | 0.446 ± 0.040 (1.2) | 0.501 ± 0.040 (0.03) |
| 3.3 | 0.443 ± 0.038 (1.4) | 0.498 ± 0.039 (0.04) | |
| Allstars | 2.7 | 0.464 ± 0.046 (0.7) | 0.520 ± 0.046 (0.4) |
| 3.3 | 0.457 ± 0.042 (0.9) | 0.513 ± 0.043 (0.3) |
The color-based metallicity corrections by Rizzi et al. (2007) improve the agreement between the expected and measured values. Indeed, color-corrected distance differences, , agree nearly perfectly with the expected value based on DEBs: the B-sequence SMC-LMC distance modulus, agrees with DEBs to within 0.5 after metallicity corrections, and SARGs agree with DEBs to within 0.1.
For comparison, changing the reddening law for the SMC has a much smaller effect on . Using instead of our default ( Gordon et al., 2003) increases the difference between the values only very slightly (by less than mag) because of the low reddening (typical E(V-I)=0.05 mag) of the SMC. As an aside, the scatter in the reddening-free Wesenheit-magnitudes for the B-sequence increases from 0.176 to 0.182 when assuming . We therefore kept and adopted half the range of the reddening-law related differences as part of the systematic uncertainties stated in Tab. 2.
3.5 Absolute TRGB magnitudes and standardization
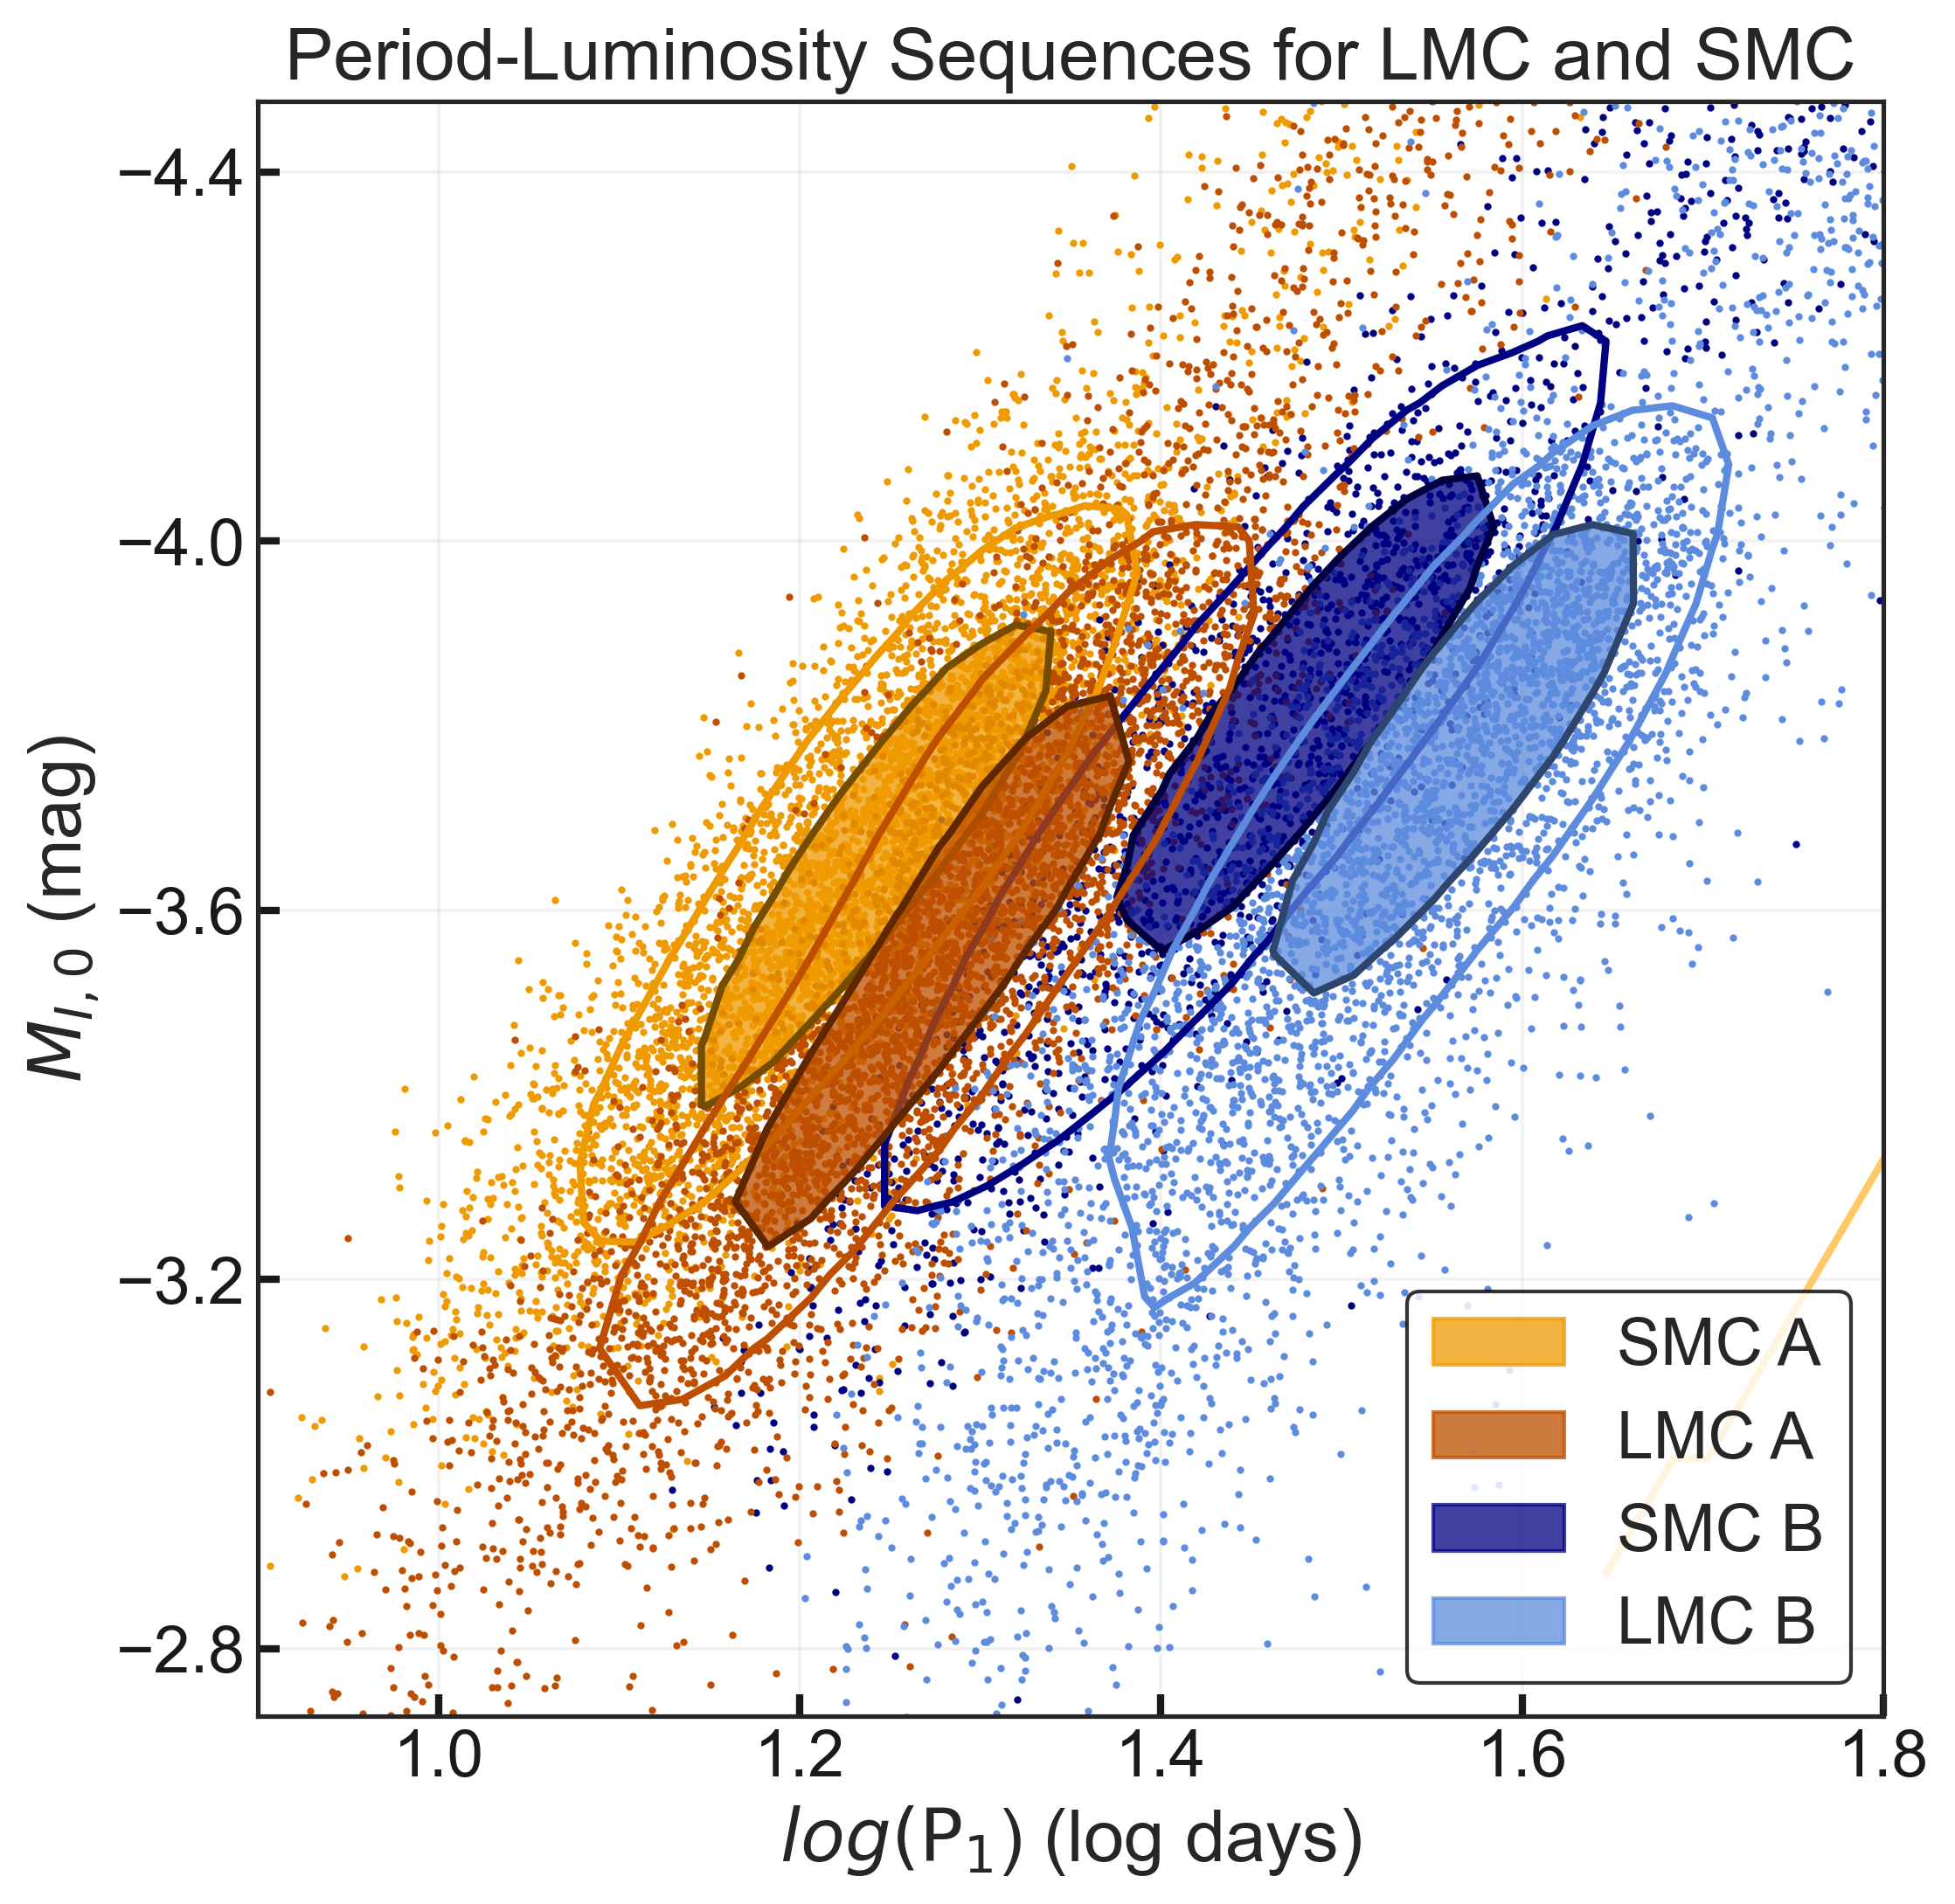
Adopting the geometric distance to the SMC determined using DEBs (Graczyk et al., 2020), we obtain the most accurate TRGB calibration in the SMC ( mag) to date using the B-sequence sample: . Thus, we find a slightly ( mag) brighter TRGB in the SMC compared to the LMC, where A24 reported mag. Figure 12 shows the period-absolute band magnitude relations for the A-sequence and B-sequence stars in both galaxies. The SMC’s shorter periods and brighter RGB tips are readily apparent even just from the contours of the stars on these sequences.
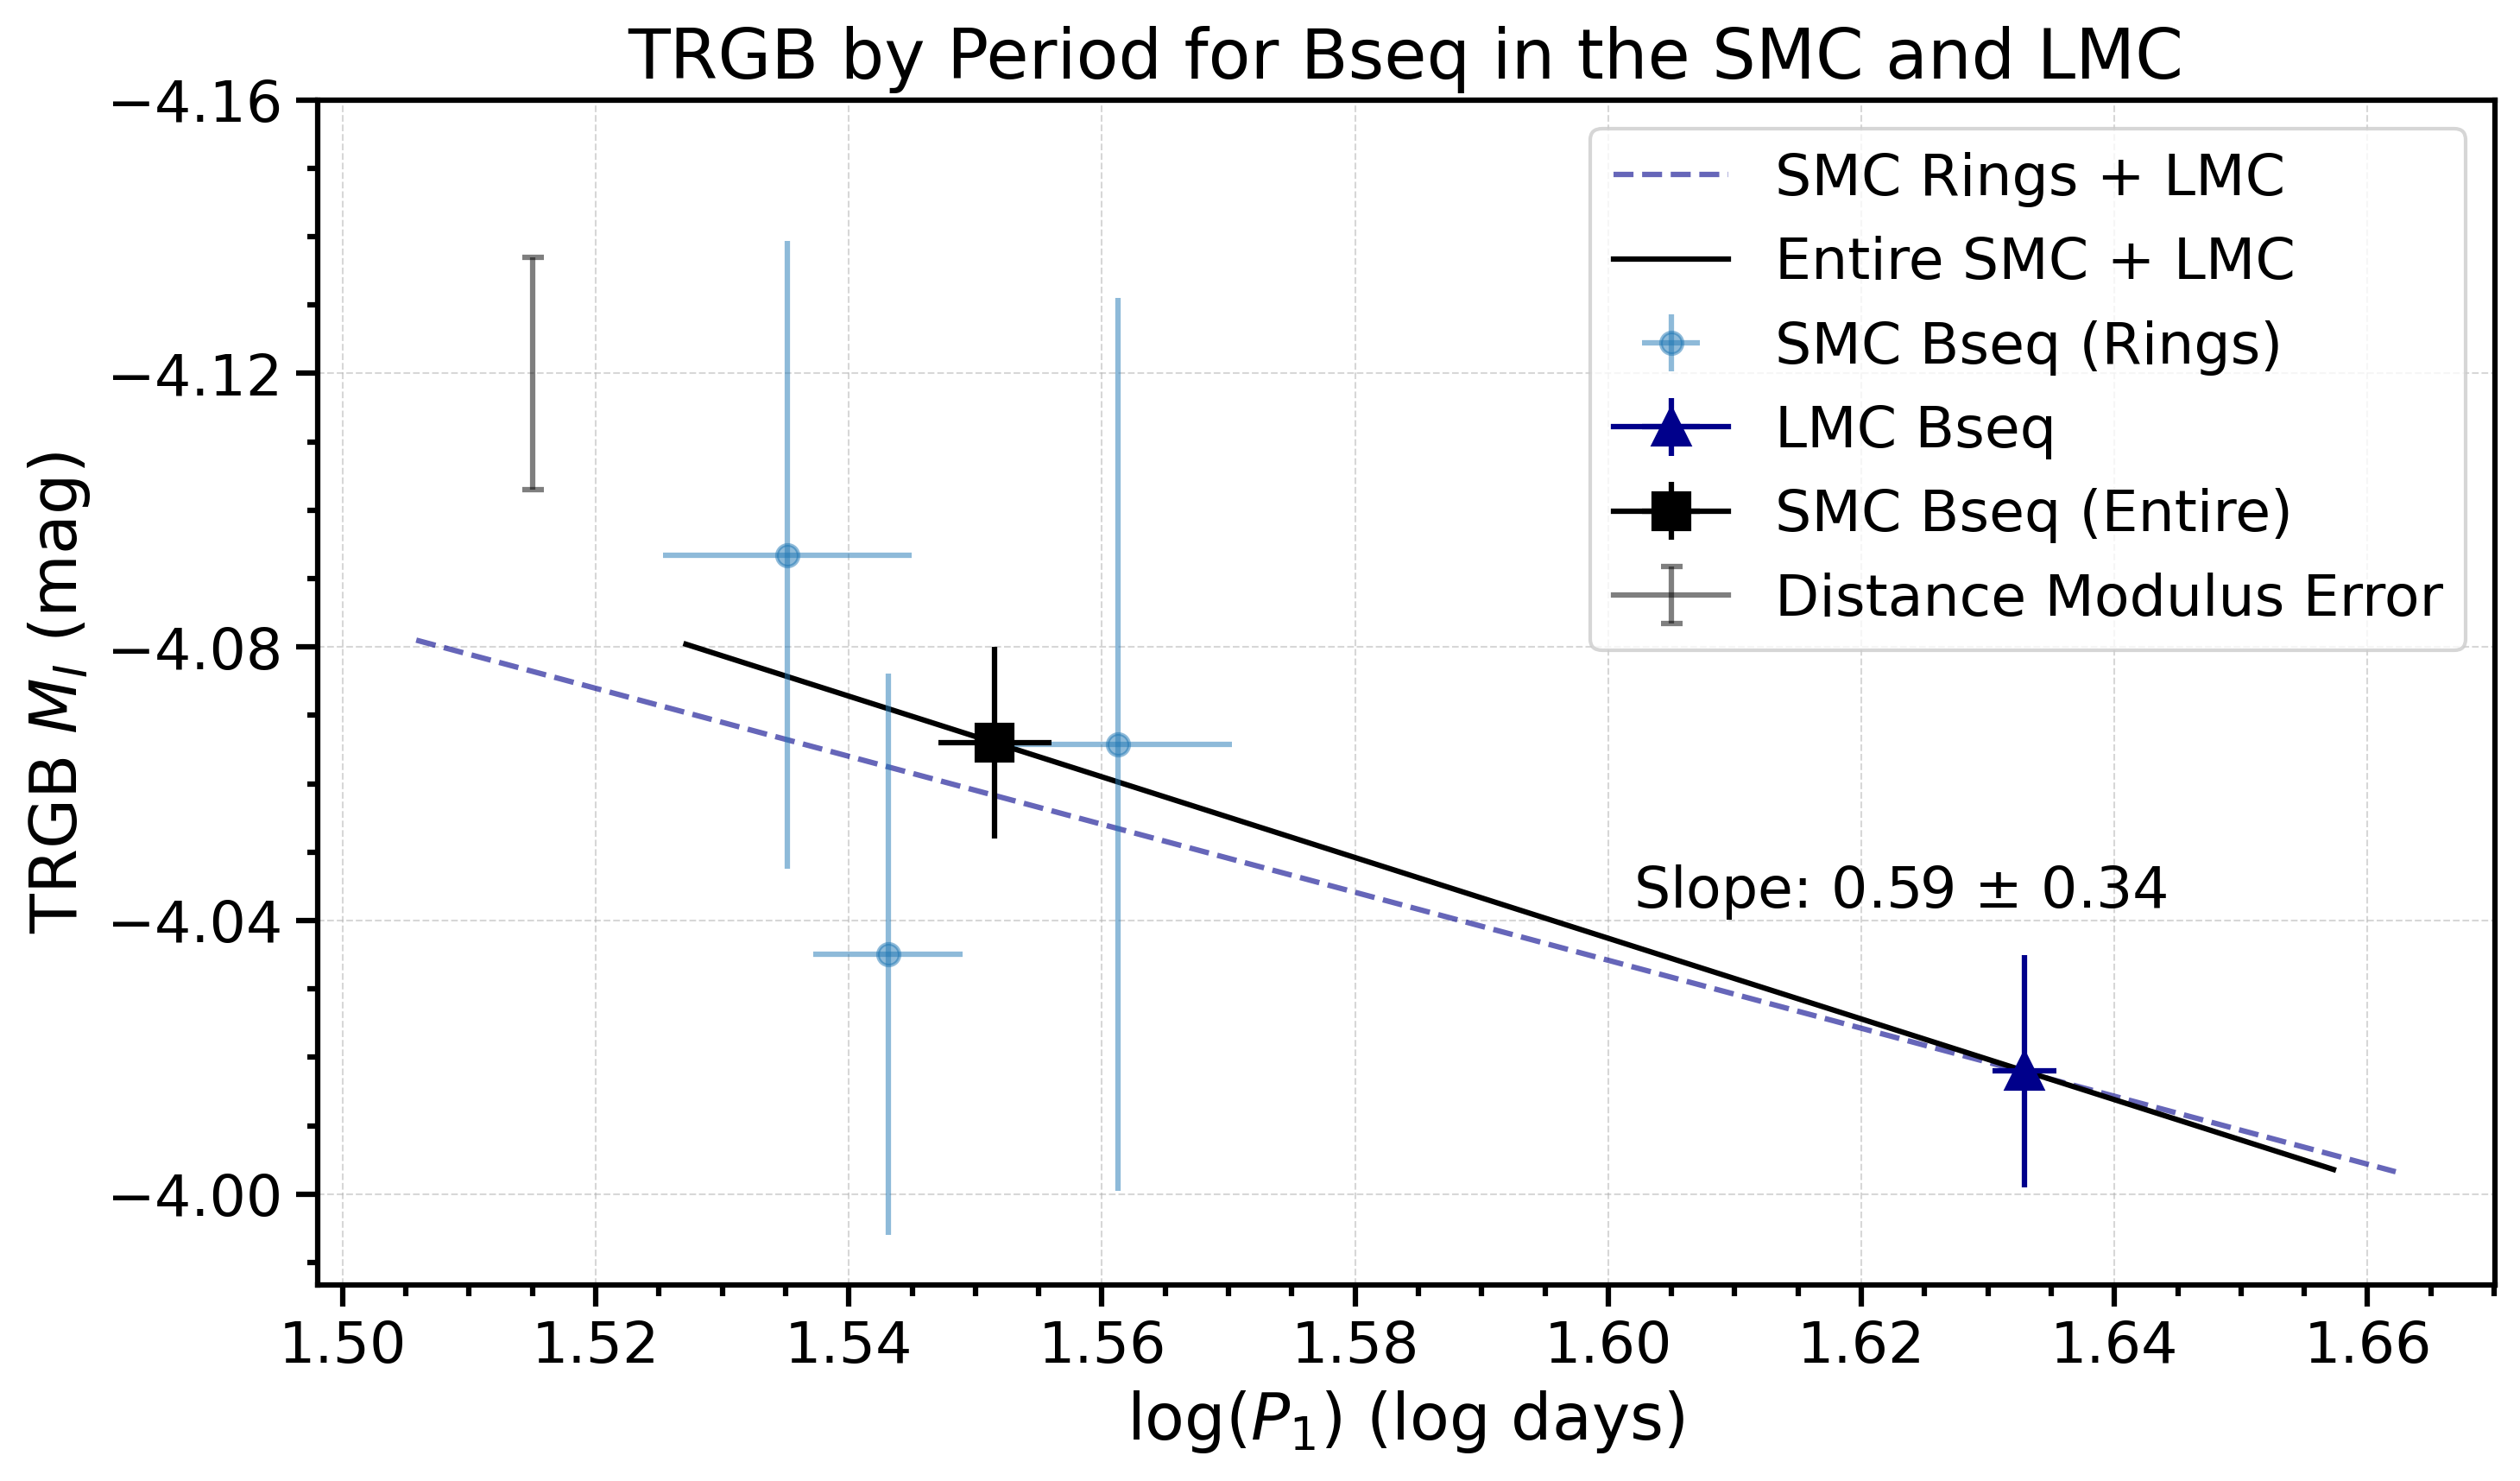
Calculating the difference in vs for the B-sequence yields a slope of mag/dex111‘dex’ in this paragraph refers to a decade in logarithmic period, which at least in principle could be used to correct metallicity differences in using variability periods instead of color, see Figure 13. Unfortunately, the uncertainty on this slope is rather large due to the small metallicity difference between the LMC and SMC and due to the significant dispersion of the SARG period-luminosity relations. Nevertheless, we combined the period- relation with the period-color relation of Sect. 3.3 () to determine the implied color-based metallicity correction of . This is in good agreement with from Rizzi et al. (2007) and from Madore et al. (2009), although it agrees somewhat less with reported by Hoyt (2023). Greater leverage on metallicity is needed to improve this period-based metallicity correction of TRGB magnitudes, which could have the benefit of being independent of color, and hence, reddening. The entire absolute magnitude calibration of the B-sequence TRGB across both galaxies using periods to correct for metallicity differences thus becomes:
| (1) |
with d and mag based on the LMC calibration, cf. Tab. 3 and A24.
We note that our Allstars TRGB magnitude in the SMC, = mag, is slightly dimmer than the results of mag reported by Hoyt (2023) using the same dataset. While the difference between the two apparent magnitudes ( mag) agrees within the reported uncertaines, we briefly mention some of the methodological differences in Sec. 4.1 and defer to Appendix C in A24 for further detail. Here, we simply point out that the two numbers should not be compared without considering the substantial systematic differences between the present work and Hoyt (2023).
As argued in A24, TRGB calibrations based on B-sequence stars should be preferred in order to ensure that the red giants in both the anchor and host galaxies are dominated by the older, lower-mass population (cf. also Freedman, 2021). However, if the fields selected for extragalactic TRGB measurements may contain a significant contribution from younger (A-sequence) red giants, then the slightly fainter SARGs-based calibration appears more adequate. Given that the slope of the TRGB feature depends both on wavelength and population age (Valenti et al., 2004; Madore et al., 2023), such issues will be particularly relevant for NIR-IR TRGB distances measured using the JWST (e.g., Newman et al., 2024a, b).
4 Discussion
4.1 Comparison to Other Studies
Calibrations of the TRGB in the Small Magellanic Cloud based on the geometric distance by Graczyk et al. (2020) have been presented in the recent literature by Freedman et al. (2020) and Hoyt (2023, henceforth: H23), and previously also by Górski et al. (2016) and Yuan et al. (2019). In particular, H23 employed the same OGLE-IV reddening maps (Skowron et al., 2021) and OGLE-III photometry considered by us. However, there are several significant methodological differences between our work and H23 as explained in Appendix C of A24. The most significant differences in H23 relative to this work include the use of weighted Sobel filter responses, non-specified smoothing parameter, application of color cuts, and differences in the treatment of reddening, among others. We further note that the most direct comparison between H23 and the present work should consider our results for the Allstars sample, after correcting methodological differences. Suffice it here to mention that the spatial selection applied in H23 affected the reported by mag (Fig. 2 in H23) and does not follow the age trend detected by variability, cf. Figs. 9 and 10. Specifically, differences in sample and methodology do not allow a direct comparison of the apparent magnitude of mag reported in H23 with our B-sequence calibration of mag, even if the two numbers are similar. We note that the larger uncertainty of our Allstars sample result ( mag) originates mainly from the significant sensitivity of to and the treatment of reddening uncertainties, which do not average as as assumed in H23 (cf. A24).
Very recently, Bellazzini & Pascale (2024) presented TRGB measurements in the LMC and SMC based on Gaia DR3 synthetic photometry, including the bands labeled here as (their JKC ) and (their ACS-WFC F814W). Small differences can be expected notably due to the exclusion of the inner regions of the LMC and SMC by Bellazzini & Pascale (2024, cf. their Fig. 1). Nevertheless, despite using rather different regions of the sky to measure , and despite several differences in methodology, our results for the Allstars sample agree to better than with their reported apparent magnitudes. Specifically for the SMC, we find mag vs. their mag in and mag vs. their mag in . The comparison for the LMC is similar.
Since Sobel filter response weighting introduces a tip-contrast relation (Wu et al., 2022, A24), it is crucial to standardize RGB tip magnitudes measured using weighted Sobel filters. In the case of the LMC and SMC, the overall tip contrast is very similar ( and 3.4 respectively with a normal Sobel filter, see A24 for definitions), so that the related correction will not be significant when considering between the two galaxies. However, this situation can be very different for other galaxies, or even among different fields of the same galaxy (Scolnic et al., 2023), when TRGB contrasts differ more significantly.
4.2 Relevance for extragalactic distances and the Hubble constant
We underline the importance of using consistently measured values when measuring distances, e.g., with the goal of determining the Hubble constant, . The typical desired populations for determining are old, metal-poor RGs (e.g., Freedman et al., 2020). Field-to-field variations of within the same galaxy (Wu et al., 2022; Scolnic et al., 2023) underline the need to ensure consistency of algorithmic aspects of measuring as well as the underlying stellar population (cf. also Beaton et al., 2018; Li & Beaton, 2024, and references therein).
The Magellanic Clouds offer crucial opportunities for the absolute calibration of the TRGB as a standard candle thanks to the availability of geometric distances. However, the red giant populations of the Magellanic Clouds contain many rather young stars and are thus not representative of the old red giant populations targeted at greater distances. Furthermore, the Magellanic Clouds are observed under different conditions than more distant galaxies, using different telescopes and photometric systems, and using different photometric algorithms. In this work, we show that a TRGB calibration based on older red giant stars can be achieved by isolating the B-sequence stars, and we employ Gaia synthetic F814W magnitudes to provide a calibration in the HST/ACS system. Additionally, we report results based on unweighted Sobel filters and a method specifically developed to avoid bias due to smoothed LFs. We believe that this calibration provides the best available accuracy while also ensuring consistency with the target populations at greater distances.
Nevertheless, we caution that distance measurements based on our calibration should follow an equivalent methodology in order to avoid methodological bias. This in particular applies to algorithmic choices, such as smoothing scale and Sobel filter weighting, which can influence the results at the level of approximately mag ( in distance) as described in A24.
5 Summary and conclusions
We have investigated the SMC’s TRGB in an effort to provide the most accurate calibration applicable to distance measurements targeting old and metal-poor red giant populations. Following A24, we considered the small amplitude variability of luminous RGs that allows to distinguish older and younger samples by the different period-luminosity sequences they occupy. In so doing, we found that all RGs near the SMC’s TRGB measured inside the OGLE-III footprint exhibit small-amplitude long-period pulsations (Fig. 7). Since the same is true in the LMC (A24), we conjecture that this type of variability is an astrophysical property of all high-luminosity red giants. Furthermore, we found that SMC RGs on sequence A are younger than those on sequence B (Fig. 5), just as in the LMC, and just as predicted by the evolutionary picture proposed by Wood (2015). Isolating long-period variables on sequence B should therefore provide the best TRGB calibration for use in distance measurements targeting old RGs in the halos of distant galaxies.
Comparing homogeneously determined ages of SARGs in the LMC and SMC based on APOGEE spectra (Povick et al., 2023a, b), we found that a) the SMC RGs are younger than LMC RGs, despite their lower metallicity and b) that the amplitude of pulsations in the SMC SARGs tends to be lower than in the LMC, especially for the B-sequence. The resulting age-amplitude relation (Fig. 6) may offer a useful avenue for assessing the ages of RG populations.
The SMC’s P-L sequences of long-period variables are shifted to significantly shorter periods compared to the LMC. This is readily explained by the reduced opacity of lower metallicity stars. Hence, the period of SARGs carries valuable information for standardizing TRGB magnitudes according to differences in chemical composition. As a consequence of this shift in period due to metallicity, RGs near the RGB tip obey a period-color relation (Fig. 11), which we here report for the first time and at a statistical significance of . These period-color relations will be useful for several other applications, e.g., for calibrating the TRGB method based on Gaia parallaxes.
The age and metallicity information derived from the variability of SARGs allows us to qualitatively trace the SMC’s age gradient using the relative number of A- to B-sequence SARGs. Additionally, the period-metallicity relation at the TRGB allowed us to trace a metallicity gradient in the SMC by the decrease in period for both A- and B-sequence RGs with increasing radius. Using purely variability-derived information, we thus qualitatively showed that age increases with distance from the SMC’s core, while metallicity decreases.
We measured the extinction-corrected TRGB apparent magnitude in the SMC for four subsamples and found that the B-sequence provides the most precise and stable (against methodological parameters) choices. Additionally, we confirmed the hierarchy of values measured in the LMC (A24), with the B-sequence sample yielding the brightest of mag using Gaia synthetic ACS/F814W photometry. Using OGLE-III photometry, we find mag, and we show that the small difference between and is fully consistent with the differences in the photometric systems at the SMC’s TRGB color (Fig. 4).
Assuming the known DEB distance of the SMC (Graczyk et al., 2020), we obtained the most accurate TRGB calibration in the SMC to date, of mag (total error in distance) based on the B-sequence sample and synthetic HST ACS/F814W magnitudes derived from Gaia’s synthetic photometry. Other samples were found to be rather sensitive to the choice of smoothing parameters and yielded significantly lower precision. Since our calibration uses the older RG stars in the SMC, it is also particularly well suited for distance measurements targeting . However, we stress the need to carefully consider methodological differences among TRGB measurements when seeking to measure distances.
We further considered whether the difference in between the SMC and LMC B-sequence calibrations () can be explained by metallicity and reddening differences, the latter of which are readily excluded due to small color excess. We found that the color-based metallicity correction by Rizzi et al. (2007) brings the two numbers into near perfect agreement, although the small difference in metallicity between LMC and SMC RGs limits the statistical significance of this result. Adopting the distance modulus difference from DEBs from Graczyk et al. (2020), we determined a period-based metallicity correction that creates agreement between in the LMC and SMC, and we found that converting this period-based correction back to a color-based correction using the period-color relation yields a result consistent with the literature. We consider this a useful first step and consistency check and note that a larger metallicity lever is needed to further calibrate a period-based metallicity correction for the TRGB.
Going forward, we believe that variability near the TRGB will provide further useful insights into TRGB measurements and calibration. Further study is needed, notably involving spectroscopy and larger samples of SARGs. Even if the low-level variability of SARGs is difficult to measure in detail beyond the local group, understanding the impact of population diversity and population differences on extragalactic distances is crucial to achieving the highest accuracy on TRGB-calibrated measurements.
References
- Anand et al. (2022) Anand, G. S., Tully, R. B., Rizzi, L., Riess, A. G., & Yuan, W. 2022, ApJ, 932, 15, doi: 10.3847/1538-4357/ac68df
- Anand et al. (2021) Anand, G. S., Rizzi, L., Tully, R. B., et al. 2021, AJ, 162, 80, doi: 10.3847/1538-3881/ac0440
- Anand et al. (2024) Anand, G. S., Tully, R. B., Cohen, Y., et al. 2024, arXiv e-prints, arXiv:2405.03743, doi: 10.48550/arXiv.2405.03743
- Anderson (2022) Anderson, R. I. 2022, A&A, 658, A148, doi: 10.1051/0004-6361/202141644
- Anderson (2024) —. 2024, arXiv e-prints, arXiv:2403.02801, doi: 10.48550/arXiv.2403.02801
- Anderson et al. (2024) Anderson, R. I., Koblischke, N. W., & Eyer, L. 2024, The Astrophysical Journal Letters, 963, L43, doi: 10.3847/2041-8213/ad284d
- Beaton et al. (2018) Beaton, R. L., Bono, G., Braga, V. F., et al. 2018, Space Sci. Rev., 214, 113, doi: 10.1007/s11214-018-0542-1
- Bellazzini & Pascale (2024) Bellazzini, M., & Pascale, R. 2024, arXiv e-prints, arXiv:2406.04781, doi: 10.48550/arXiv.2406.04781
- Bouchet et al. (1985) Bouchet, P., Lequeux, J., Maurice, E., Prevot, L., & Prevot-Burnichon, M. L. 1985, A&A, 149, 330
- Breuval et al. (2022) Breuval, L., Riess, A. G., Kervella, P., Anderson, R. I., & Romaniello, M. 2022, The Astrophysical Journal, 939, 89, doi: 10.3847/1538-4357/ac97e2
- Eyer et al. (2023) Eyer, L., Audard, M., Holl, B., et al. 2023, A&A, 674, A13, doi: 10.1051/0004-6361/202244242
- Freedman (2021) Freedman, W. L. 2021, ApJ, 919, 16, doi: 10.3847/1538-4357/ac0e95
- Freedman et al. (2020) Freedman, W. L., Madore, B. F., Hoyt, T., et al. 2020, The Astrophysical Journal, 891, 57, doi: 10.3847/1538-4357/ab7339
- Gaia Collaboration et al. (2022a) Gaia Collaboration, Vallenari, A., Brown, A.G.A., Prusti, T., & et al. 2022a, A&A, doi: 10.1051/0004-6361/202243940
- Gaia Collaboration et al. (2016) Gaia Collaboration, Prusti, T., de Bruijne, J. H. J., et al. 2016, A&A, 595, A1, doi: 10.1051/0004-6361/201629272
- Gaia Collaboration et al. (2021) Gaia Collaboration, Luri, X., Chemin, L., et al. 2021, A&A, 649, A7, doi: 10.1051/0004-6361/202039588
- Gaia Collaboration et al. (2022b) Gaia Collaboration, Montegriffo, P., Bellazzini, M., et al. 2022b, arXiv e-prints, arXiv:2206.06215, doi: 10.48550/arXiv.2206.06215
- Gordon et al. (2003) Gordon, K. D., Clayton, G. C., Misselt, K. A., Landolt, A. U., & Wolff, M. J. 2003, ApJ, 594, 279, doi: 10.1086/376774
- Graczyk et al. (2020) Graczyk, D., Pietrzyński, G., Thompson, I. B., et al. 2020, ApJ, 904, 13, doi: 10.3847/1538-4357/abbb2b
- Górski et al. (2016) Górski, M., Pietrzyński, G., Gieren, W., et al. 2016, The Astronomical Journal, 151, 167, doi: 10.3847/0004-6256/151/6/167
- Hatt et al. (2017) Hatt, D., Beaton, R. L., Freedman, W. L., et al. 2017, The Astrophysical Journal, 845, 146, doi: 10.3847/1538-4357/aa7f73
- Hoyt (2023) Hoyt, T. J. 2023, Nature Astronomy, 7, 590, doi: 10.1038/s41550-023-01913-1
- Jönsson et al. (2020) Jönsson, H., Holtzman, J. A., Allende Prieto, C., et al. 2020, AJ, 160, 120, doi: 10.3847/1538-3881/aba592
- Lebzelter et al. (2023) Lebzelter, T., Mowlavi, N., Lecoeur-Taibi, I., et al. 2023, A&A, 674, A15, doi: 10.1051/0004-6361/202244241
- Lee et al. (1993) Lee, M. G., Freedman, W. L., & Madore, B. F. 1993, ApJ, 417, 553, doi: 10.1086/173334
- Li & Beaton (2024) Li, S., & Beaton, R. L. 2024, arXiv e-prints, arXiv:2403.17048, doi: 10.48550/arXiv.2403.17048
- Li et al. (2023) Li, S., Riess, A. G., Scolnic, D., et al. 2023, arXiv e-prints, arXiv:2306.10103, doi: 10.48550/arXiv.2306.10103
- Li et al. (2024) Li, Y., Jiang, B., & Ren, Y. 2024, arXiv e-prints, arXiv:2402.02058, doi: 10.48550/arXiv.2402.02058
- Lindegren et al. (2021) Lindegren, L., Klioner, S. A., Hernández, J., et al. 2021, A&A, 649, A2, doi: 10.1051/0004-6361/202039709
- Madore (1982) Madore, B. F. 1982, The Astrophysical Journal, 253, 575, doi: 10.1086/159659
- Madore et al. (2023) Madore, B. F., Freedman, W. L., Owens, K. A., & Jang, I. S. 2023, AJ, 166, 2, doi: 10.3847/1538-3881/acd3f3
- Madore et al. (2009) Madore, B. F., Mager, V., & Freedman, W. L. 2009, ApJ, 690, 389, doi: 10.1088/0004-637X/690/1/389
- Makarov et al. (2006) Makarov, D., Makarova, L., Rizzi, L., et al. 2006, AJ, 132, 2729, doi: 10.1086/508925
- Newman et al. (2024a) Newman, M. J. B., McQuinn, K. B. W., Skillman, E. D., et al. 2024a, ApJ, 966, 175, doi: 10.3847/1538-4357/ad306d
- Newman et al. (2024b) —. 2024b, arXiv e-prints, arXiv:2406.03532, doi: 10.48550/arXiv.2406.03532
- Nicholls et al. (2009) Nicholls, C. P., Wood, P. R., Cioni, M. R. L., & Soszyński, I. 2009, MNRAS, 399, 2063, doi: 10.1111/j.1365-2966.2009.15401.x
- Pawlak et al. (2024) Pawlak, M., Trabucchi, M., Eyer, L., & Mowlavi, N. 2024, A&A, 682, A88, doi: 10.1051/0004-6361/202346163
- Pérez et al. (2016) Pérez, A. E. G., Prieto, C. A., Holtzman, J. A., et al. 2016, The Astronomical Journal, 151, 144, doi: 10.3847/0004-6256/151/6/144
- Persson et al. (2004) Persson, S. E., Madore, B. F., Krzemiński, W., et al. 2004, The Astronomical Journal, 128, 2239, doi: 10.1086/424934
- Pietrzyński et al. (2019) Pietrzyński, G., Graczyk, D., Gallenne, A., et al. 2019, Nature, 567, 200, doi: 10.1038/s41586-019-0999-4
- Povick et al. (2023a) Povick, J. T., Nidever, D. L., Massana, P., et al. 2023a, Revealing the Chemical Structure of the Magellanic Clouds with APOGEE. I. Calculating Individual Stellar Ages of RGB Stars in the Large Magellanic Cloud. https://arxiv.org/abs/2306.06348
- Povick et al. (2023b) Povick, J. T., Nidever, D. L., Massana, P., et al. 2023b, arXiv e-prints, arXiv:2310.14299, doi: 10.48550/arXiv.2310.14299
- Reid et al. (2019) Reid, M. J., Pesce, D. W., & Riess, A. G. 2019, ApJ, 886, L27, doi: 10.3847/2041-8213/ab552d
- Riello et al. (2021) Riello, M., De Angeli, F., Evans, D. W., et al. 2021, A&A, 649, A3, doi: 10.1051/0004-6361/202039587
- Ritter (1879) Ritter, A. 1879, Wiedemanns Annalen, VIII
- Rizzi et al. (2007) Rizzi, L., Tully, R. B., Makarov, D., et al. 2007, ApJ, 661, 815, doi: 10.1086/516566
- Rosseland (1943) Rosseland, S. 1943, MNRAS, 103, 233, doi: 10.1093/mnras/103.5.233
- Salaris et al. (2002) Salaris, M., Cassisi, S., & Weiss, A. 2002, PASP, 114, 375, doi: 10.1086/342498
- Salaris & Girardi (2005) Salaris, M., & Girardi, L. 2005, MNRAS, 357, 669, doi: 10.1111/j.1365-2966.2005.08689.x
- Scolnic et al. (2023) Scolnic, D., Riess, A. G., Wu, J., et al. 2023, arXiv e-prints, arXiv:2304.06693, doi: 10.48550/arXiv.2304.06693
- Serenelli et al. (2017) Serenelli, A., Weiss, A., Cassisi, S., Salaris, M., & Pietrinferni, A. 2017, A&A, 606, A33, doi: 10.1051/0004-6361/201731004
- Skowron et al. (2021) Skowron, D. M., Skowron, J., Udalski, A., et al. 2021, ApJS, 252, 23, doi: 10.3847/1538-4365/abcb81
- Soszyński et al. (2004) Soszyński, I., Udalski, A., Kubiak, M., et al. 2004, Acta Astron., 54, 129, doi: 10.48550/arXiv.astro-ph/0407057
- Soszyński et al. (2009) Soszyński, I., Udalski, A., Szymanski, M. K., et al. 2009, Acta Astronomica, doi: 10.48550/ARXIV.0910.1354
- Soszyński et al. (2011) Soszyński, I., Udalski, A., Szymański, M. K., et al. 2011, Acta Astron., 61, 217, doi: 10.48550/arXiv.1109.1143
- Soszyński et al. (2021) Soszyński, I., Olechowska, A., Ratajczak, M., et al. 2021, ApJ, 911, L22, doi: 10.3847/2041-8213/abf3c9
- STScI Development Team (2013) STScI Development Team. 2013, pysynphot: Synthetic photometry software package, Astrophysics Source Code Library, record ascl:1303.023. http://ascl.net/1303.023
- Sweigart & Gross (1978) Sweigart, A. V., & Gross, P. G. 1978, ApJS, 36, 405, doi: 10.1086/190506
- Udalski et al. (2008) Udalski, A., Soszyński, I., Szymanski, M. K., et al. 2008, Acta Astronomica, doi: 10.48550/ARXIV.0807.3889
- Udalski et al. (2009) Udalski, A., Soszynski, I., Szymanski, M. K., et al. 2009, The Optical Gravitational Lensing Experiment. OGLE-III Photometric Maps of the Small Magellanic Cloud. https://arxiv.org/abs/0901.4632
- Valenti et al. (2004) Valenti, E., Ferraro, F. R., & Origlia, L. 2004, MNRAS, 354, 815, doi: 10.1111/j.1365-2966.2004.08249.x
- Wood (2015) Wood, P. R. 2015, Monthly Notices of the Royal Astronomical Society, 448, 3829, doi: 10.1093/mnras/stv289
- Wood et al. (1999) Wood, P. R., Alcock, C., Allsman, R. A., et al. 1999, in Asymptotic Giant Branch Stars, ed. T. Le Bertre, A. Lebre, & C. Waelkens, Vol. 191, 151
- Wray et al. (2004) Wray, J. J., Eyer, L., & Paczyński, B. 2004, MNRAS, 349, 1059, doi: 10.1111/j.1365-2966.2004.07587.x
- Wu et al. (2022) Wu, J., Scolnic, D., Riess, A. G., et al. 2022, arXiv e-prints, arXiv:2211.06354, doi: 10.48550/arXiv.2211.06354
- Yuan et al. (2019) Yuan, W., Riess, A. G., Macri, L. M., Casertano, S., & Scolnic, D. M. 2019, ApJ, 886, 61, doi: 10.3847/1538-4357/ab4bc9