⚠!
PrExMe!
Large Scale Prompt Exploration of Open Source LLMs for
Machine Translation and Summarization Evaluation
Abstract
Large language models (LLMs) have revolutionized the field of NLP. Notably, their in-context learning capabilities also enable their use as evaluation metrics for natural language generation, making them particularly advantageous in low-resource scenarios and time-restricted applications. In this work, we introduce PrExMe, a large-scale prompt exploration for metrics, where we evaluate more than prompt templates for open-source LLM-based metrics on machine translation (MT) and summarization datasets, totalling over M evaluations. This extensive comparison (1) serves as a benchmark of the performance of recent open-source LLMs as metrics and (2) explores the stability and variability of different prompting strategies. We discover that, on the one hand, there are scenarios for which prompts are stable. For instance, some LLMs show idiosyncratic preferences and favor to grade generated texts with textual labels while others prefer to return numeric scores. On the other hand, the stability of prompts and model rankings can be susceptible to seemingly innocuous changes. For example, changing the requested output format from “0 to 100” to “-1 to +1” can strongly affect the rankings in our evaluation. Our study contributes to understanding the impact of different prompting approaches on LLM-based metrics for MT and summarization evaluation, highlighting the most stable prompting patterns and potential limitations.111We make our code available: https://github.com/Gringham/PrExMe
1 Introduction
The recent popularity and success of LLMs have led to a paradigm shift in NLP (Zhang et al., 2023). Instruction-tuning allows LLMs to generate responses to complex task descriptions (prompts) (Ouyang et al., 2022), making them useful for conventional NLP tasks.
One such task is the automatic evaluation of natural language generation (NLG) models in machine translation (MT) and summarization. Following the current trend, researchers use LLMs as evaluation metrics and achieve remarkable performance, sometimes relying solely on in-context learning (e.g. Kocmi and Federmann, 2023a; Fernandes et al., 2023), i.e., with metrics that are purely based on prompting. Such prompting-based metrics require no or only a few data samples, making them useful for low-resource evaluation scenarios (Belouadi and Eger, 2023). Additionally, they are often more resource-efficient since they do not require fine-tuning.
Although many prompting-based metrics have been proposed (e.g. Li et al., 2024b), structured evaluations across different prompting approaches remain scarce, especially for open-source models. In recent work, the Eval4NLP 2023 shared task (Leiter et al., 2023) addresses this by (1) restricting the usage to selected open-source LLMs and (2) prohibiting the fine-tuning of these models. While the shared-task submissions provide several interesting findings, they focus on a few distinct prompts only. Notably, the effect and robustness of prompt variations on the same model or across different models remain largely unexplored.
In this work, we introduce a systematic Prompt Exploration for Metrics (PrExMe), that builds upon Eval4NLP 2023, to provide a much larger, template-based, structured evaluation of the effects different input prompts have on an LLM-based metric’s correlation with human judgements in MT and summarization evaluation.
We formulate the following research questions:
-
RQ1
Can open-source language models evaluate text generation without fine-tuning and how do they differ from each other?
-
RQ2
Can we identify patterns222We define prompting patterns as the template components that constitute a prompt (e.g., zero-shot, one-shot or the output format). in prompts that lead to a stable performance across different datasets, tasks, and models?
-
RQ3
How should researchers design prompts for new evaluation scenarios?
Our prompt exploration constructs hierarchical templates based on approaches such as chain-of-thought (CoT) (Kojima et al., 2022), zero-shot and retrieval-augmented generation (RAG) (Gao et al., 2024b). Each template gets filled with further sub-templates. For example, we vary the requested output formats, such as distinct scores and continuous scores (see §3). This setup amounts to more than 720 prompt templates that we evaluate with 7 LLMs. In a 2nd phase, we test the generalizability and performance of the prompts with the best correlations on two further datasets.
In summary, our work makes the following key contributions and findings:
-
✓
We perform a large-scale analysis (evaluating over 6.6M prompts) of the effect of different prompting approaches on LLM-based metrics for MT and summarization evaluation. This comprehensive exploration includes various prompting techniques, datasets, tasks, and models, making it, to our knowledge, the most extensive evaluation of its kind.
-
✓
We show that certain prompting patterns are robust and generalizable across different tasks and datasets, with the median performance being a good predictor for new settings. For example, some models show a distinctive preference to return textual labels, while others achieve better results with numeric labels. On the other hand for some settings even small changes to the input prompt can strongly affect the performance.
-
✓
Our study tackles prompt-based evaluation with open-source LLMs, targeting scenarios where fine-tuning or access to closed-source LLMs is not possible. Such evaluations are still very scarce but important to make research more accessible, fostering diversity and inclusion.
-
✓
By systematically testing various established prompting approaches, including zero-shot, CoT and RAG, we comprehensively evaluate the performance of recent open-source LLMs for evaluation metrics. Aligning with the recommendations of Mizrahi et al. (2024), by evaluating each model with multiple prompts, our LLM comparison is fair because we mitigate the risk of any single prompt disproportionately affecting their performance. We find that the model Platypus2-70B (Lee et al., 2023a) achieves the strongest performance for the tested LLMs.
2 Related Work
We first describe the related work of prompting-based metrics for MT and summarization. Then, we relate our work to research on prompting techniques and prompt stability.
Prompting-based metrics
Recent advancements in LLM-based metrics for NLG often rely on in-context learning, directly predicting quality judgments from generated texts. Surveys by Li et al. (2024b) and Gao et al. (2024a) provide comprehensive overviews of these metrics. Besides BARTScore (Yuan et al., 2021) and PRD (Li et al., 2024a), the prompt-based approaches surveyed by Li et al. (2024b) are built upon closed-source models. In contrast, the Eval4NLP 2023 shared task (Leiter et al., 2023), explicitly considers open-source prompt-based metrics, by asking participants to evaluate MT and summarization using only provided models without fine-tuning. The best submissions were able to beat strong baselines such as GEMBA (Kocmi and Federmann, 2023b) for MT and BARTScore for summarization.
While the shared task yielded interesting techniques, the participants explored a limited range of prompts, leaving a gap in the comprehensive analysis of prompting patterns and the consistent comparison of LLMs. In this work, we fill this gap and systematically analyze a much larger set of prompts on a comparable grid of experimental settings to (1) study the robustness of prompts across datasets, models and tasks, and to (2) search for rules and patterns that can guide the future construction of prompt-based metrics.
Prompting Techniques
Many successful prompting techniques have been proposed over the last years (e.g., Liu et al., 2023a). Our work mostly relies on established approaches such as Zero-Shot CoT and RAG. Further, Li et al. (2023) propose emotion inducing prompts to improve LLM performance. To our best knowledge, we are the first to analyze this technique for evaluation metrics. Inspired by this, we also propose a novel emotion-CoT pattern (see §3). Prior evaluation of output formats for prompt-based metrics is done by Kocmi and Federmann (2023b), which we extend by our much broader evaluation. Other works also use hierarchical templates for prompt building (e.g. Fu et al., 2023) and tools like LangChain (Chase, 2022) and DSPy (Khattab et al., 2023) support their implementation. We use hierarchical templates as means for a structured comparison among prompting patterns.
Prompting Robustness
As we conduct a grid search across different prompts, datasets and tasks, our work builds upon and extends research on how LLMs respond to prompt perturbations. Webson and Pavlick (2022), Leidinger et al. (2023), Weber et al. (2023) and Sclar et al. (2023) find a wide range of performance variation for natural language inference and sentiment classification. As a solution, Sclar et al. (2023) suggest to provide the full range of results across different prompt perturbations. Voronov et al. (2024) and Mizrahi et al. (2024) suggest that current evaluation benchmarks for LLMs are problematic as they often only provide one prompt template per task. This could be solved by providing multiple templates and evaluating the ensemble. To our best knowledge, we are the first to explore to which degree these robustness problems affect open-source LLM-based metrics and how to select the best prompts for them. Also, by prompting the LLMs with multiple prompts, we follow Mizrahi et al. (2024) and achieve a stable and fair evaluation of LLMs for this task.
3 Setup
In this section, we present the templates and prompting techniques we employ for utilizing LLMs as metrics. Additionally, we provide an overview of the datasets and models that we use for testing. We evaluate LLMs in a reference-free setting, i.e., they grade a generated hypothesis based on its source without a reference.333We run experiments using vLLM (Kwon et al., 2023) on two clusters with Nvidia A6000, A40 and A100 GPUS. Details on versions, tools and model parameters are in Appendix B. The evaluated prompt types provide a comprehensive evaluation framework for LLM-based metrics. This range covers basic in-context learning, sophisticated reasoning, emotional context, and varying output structures, ensuring a thorough assessment of robustness and adaptability across tasks and datasets.
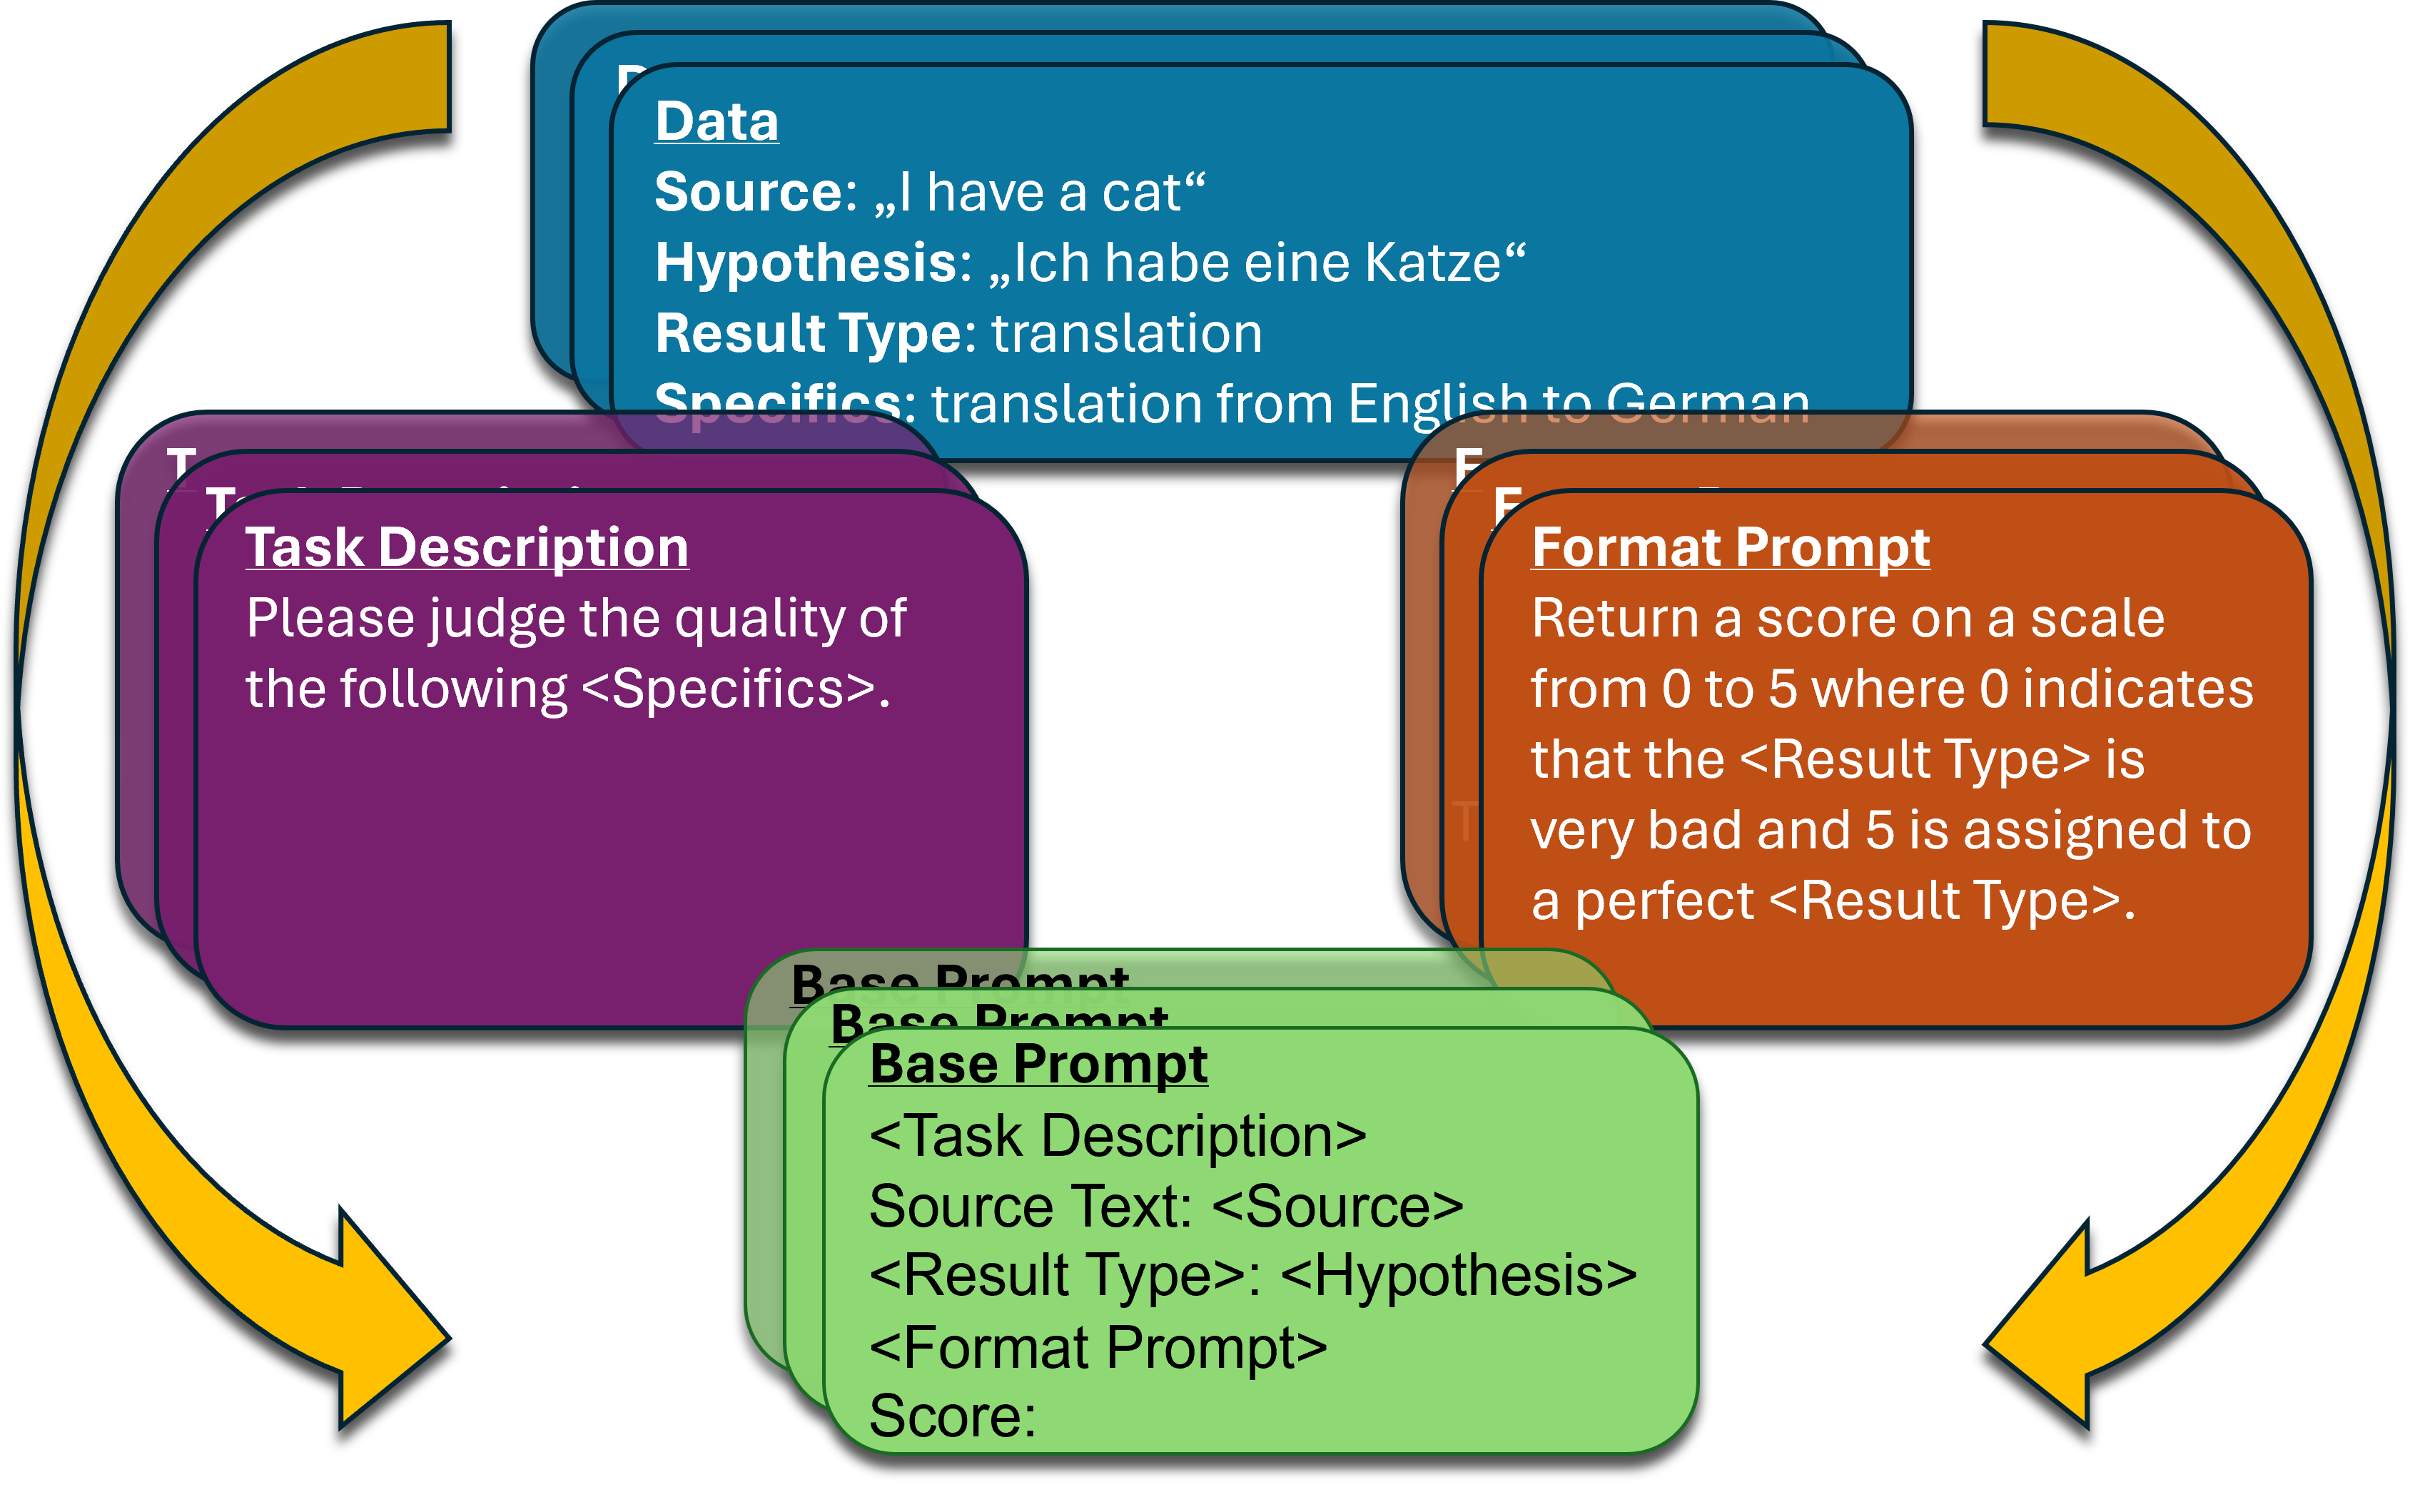
Prompt Templates
Our prompts are constructed as hierarchical templates (see Figure 1), i.e., one large template is constructed from multiple smaller ones. Each prompt is constructed from: (1) the source text and generated hypothesis text that should be graded, (2) a base prompt, (3) a task description, (4) a format requirement and (5) optionally a one-shot demonstration. Table 1 presents examples for (2), (3), (4) and (5).
| Category | Description |
|---|---|
| Base Prompt Templates | PZS: “{task_description} \nSource Text: {src} \n{result_type}: {hyp} \n{format_requirement} \nScore: ” |
| ZS-CoT-EM: “{task_description} \nSource Text: {src} \n{result_type}: {hyp} \n{format_requirement} \nFirst describe your emotions, then think step by step and explain your thought process, finally return your judgment in the format ’Judgment: ’.” | |
| OS-CoT: “{task_description} \n Here is an example:\n Source Text: {ex_src} \n{result_type}: {ex_hyp}\n Judgement: <Description of reasons>. Therefore the score is {ex1_score}\n\n Now it is your turn to grade the {result_type}.\n Source Text: {src} \n{result_type}: {hyp} \n{format_requirement} \n First, think step by step and explain your thought process, then return your judgment in the format ’Judgment: ’.” | |
| Task Descriptions | Neutral: “Judge the quality of the following {task_specific_insert}.” |
| Sceptical: “I’m not sure about this one. Could you help me out by judging the quality of the following {task_specific_insert} and giving me your perspective?” | |
| Format Requirements | 0 or 1: Return a discrete score of 0 if the {result_type} has flaws and 1 if it is perfect. |
| catastrophic, indifferent or marvelous: Choose whether the {result_type} is either "catastrophic", "indifferent" or "marvelous". |
The base prompt is the top layer of our prompt hierarchy, incorporating the other components. Specifically, we test three zero-shot (ZS) and corresponding one-shot (OS) base prompts: (1) Plain ZS/OS (PZS/POS), (2) ZS/OS-CoT and (3) ZS/OS-CoT-Emotion (ZS/OS-CoT-EM). PZS plainly presents the newline separated task description, source, hypothesis and format requirement. ZS-CoT (Kojima et al., 2022) additionally asks the model to think step by step before returning its output. Lastly, ZS-CoT-EM asks the model to describe its “emotions” before the ZS-CoT prompt. We include CoT as it has improved the prompt-based performance for closed-source metrics like AutoMQM Fernandes et al. (2023) and GEMBA (Kocmi and Federmann, 2023a). ZS-CoT-EM explores the variation of LLM performance when prompted to describe emotions in its output. This is motivated by our exploration of emotional prompts on metric performance (see “task description” below). The OS versions of the templates add a field for demonstrations. To avoid fixating the model on specific reasoning steps, we include a placeholder for OS-CoT where the model should insert its reasoning.
The task description is the instruction to grade the generated hypothesis. Li et al. (2023) find that LLM instructions that induce certain emotions for humans can cause performance improvements. Inspired by this finding, we explore the usage of “emotional prompts” in the task description. Primarily, this approach offers a simple paraphrasation strategy to increase the scope of our grid search. Additionally, it allows us to study the impact of “emotions” on LLM-based metrics. Besides neutral prompts, we include instructions that are, e.g., polite, threatening and sceptical. We create 11 task descriptions ourselves and 13 further descriptions with ChatGPT (OpenAI, 2023).
The format requirement describes the output format the LLM should adhere to when generating a score. For example, it includes the range in which the output score should be and whether it should be discrete or continuous. Additionally, we include prompts that ask the LLM to return textual quality labels. In total, we define 10 format requirements.
Lastly, we construct the optional OS demonstrations with RAG. We extract demonstrations from WMT21 (Freitag et al., 2021) for MT and from RoSE for summarization.444Note that RoSE only considers factuality, which is only one aspect of the evaluated datasets. (Liu et al., 2023b). For each sample in both datasets and for each input sample of our metric, we create sentence embeddings with XLMR-SBERT (Reimers and Gurevych, 2020). Thereby, we concatenate the source and hypothesis embeddings. For each input, we select the demonstration with the highest cosine similarity. Due to resource limitations, we only evaluate the 9 best ZS prompts in a OS setting. The selection process is described in the paragraph Datasets and phases below.
MQM-based approaches
Additionally to hierarchical templates, we test the prompts of GEMBA-MQM (Kocmi and Federmann, 2023a) with the selected open-source LLMs. GEMBA-MQM, which predicts scores based on the number of present errors weighted by severity, normally uses GPT4. We refer to the open-source implementation as LocalGemba.
Score Extraction & Evaluation
We restrict generation to 180 tokens and extract the last regex match of a number/label as scores. When no result is found, we average the other scores of its prompt template. For format requirements with text labels, we map the labels to 1, 3 and 5.
We evaluate prompt templates on the segment-level, like the WMT QE and metrics shared tasks (e.g. Freitag et al., 2022, 2021; Zerva et al., 2022). That means, for each metric we compute the correlation between metric scores and ground truth human judgments without averaging by system or document. As correlation measure, we use the Kendall (Kendall, 1945), Pearson and Spearman correlations, as well as tie-calibrated accuracy (Deutsch et al., 2023), with Kendall as main measure. Further, we compute permute-input significance tests () (Deutsch et al., 2021) for the Kendall correlations presented in our result tables. Often, there is no single significantly best metric. Therefore, we report clusters where each included metric is significantly better than metrics that are not included.
Models
We select instruction-tuned LLMs with strong performance in Eval4NLP 2023: (1) Platypus2-70B-Instruct-GPTQ, (2) Nous-Hermes-13b 555https://huggingface.co/NousResearch/Nous-Hermes-13b and (3) OpenOrca-Platypus2-13B (Lee et al., 2023b; Mukherjee et al., 2023). We abbreviate these as Platypus2, Nous and Orca. Additionally, we evaluate more recent models: (4) LLaMA3-8B (AI@Meta, 2024), (5) a GPTQ version of LLaMA3-70B (AI@Meta, 2024), (6) Mixtral-8x7B666Due to high resource consumption and comparatively weak performance in phase 1, we do not evaluate Mixtral in phase 2. (Jiang et al., 2024) and Unbabel-Tower (Alves et al., 2024), a 13B parameter multilingual instruction-tuned model.
Datasets and phases
Our experiments are in two phases on different datasets. By doing so, we want to alleviate statistical effects of our large prompt search. Also, it allows to evaluate selected prompts on full datasets, a task that would otherwise be too resource intensive, and to explore generalizability.
In phase 1, we evaluate on the train set of Eval4NLP 2023 (Leiter et al., 2023), and in phase 2, on its dev and test sets.777Although we do not use the datasets to train a model, for conciseness, we will refer to these dataset as train, dev and test set. The train and dev sets are (reference-free) splits of the WMT2022 metrics shared task (Freitag et al., 2022) and SummEval (Fabbri et al., 2021). The test set was newly annotated by Leiter et al. (2023). As a second test set, we evaluate on the WMT23 MQM annotations for MT (Freitag et al., 2023) and Seahorse (Clark et al., 2023) for multilingual summarization. Because OS prompts demonstrate a weak performance on the other datasets, we do not evaluate them on WMT23/Seahorse. More details of the datasets are discussed in Appendix C.
In the 1st phase, we evaluate all 720888Considering the different tasks and language pairs, this number could also be considered higher. combinations of ZS prompts on the train set. As this is resource intensive, for MT we restrict ourselves to the first 500 samples of each language pair. Afterwards, we select the prompt with the highest Kendall correlation for each task+base prompt combination (e.g. en-de+PZS or en-de+ZS-CoT).999Tasks: en-de, zh-en, summarization. In case of duplicates, we choose the second best. This yields 9 unique prompts for exploration in the phase 2 (see Appendix F).
In the 2nd phase, we evaluate the selected prompts of the 1st phase on the full dev and test sets. This further tests the generalizability of prompts between models and for unseen, in-domain data (the train and dev set stem from the same original datasets) and out-domain data (test sets).
Baselines
For each phase, we also present the correlations of two baseline metrics that use other base models: BARTScore (Yuan et al., 2021) and XComet (Guerreiro et al., 2023). Especially XComet has the benefit of being trained on multilingual datasets. Further, we test the prompts of DSBA (Kim et al., 2023) — that showed a strong performance for summarization in the shared task — with the selected open-source LLMs Platypus2-70B and Orca-13B.
| P1: Eval4NLP train | P2: Eval4NLP test | P2: WMT23/Seahorse | |||||||||
| Model | en-de | zh-en | summ | en-de | en-es | en_zh | summ | en-de | he-en | zh-en | summ |
| 1. Hierarchical Templates | |||||||||||
| LL3-70B | 0.273 | 0.306 | 0.442 | 0.245 | 0.189 | 0.231 | 0.438 | 0.297 | 0.172 | 0.312 | 0.312 |
| LL3-8B | 0.251 | 0.236 | 0.334 | 0.167 | 0.158 | 0.145 | 0.412 | 0.166 | 0.118 | 0.164 | 0.200 |
| MI-7Bx8 | 0.268* | 0.264 | 0.365 | - | - | - | - | - | - | - | - |
| NO-13B | 0.230 | 0.201 | 0.225 | 0.205 | 0.141 | 0.084 | 0.255 | 0.202 | 0.105 | 0.175 | 0.123 |
| OR-13B | 0.289 | 0.303 | 0.468* | 0.214 | 0.158 | 0.206 | 0.518 | 0.375 | 0.247 | 0.387 | 0.377 |
| PL-70B | 0.344* | 0.364* | 0.519* | 0.402* | 0.289* | 0.295* | 0.549 | 0.338 | 0.259* | 0.417* | 0.448* |
| TO-13B | 0.284* | 0.318* | 0.375 | 0.379* | 0.253 | 0.232 | 0.409 | 0.322 | 0.208 | 0.314 | 0.257 |
| 2. Separate Prompting Techniques | |||||||||||
| M:LG | 0.278* | 0.268 | 0.062 | 0.344 | 0.265 | 0.307* | 0.116 | 0.391* | 0.190 | 0.300 | 0.144 |
| B:DSBA | 0.164 | 0.306 | 0.458 | 0.314 | 0.226 | 0.159 | 0.600* | 0.172 | 0.207 | 0.376 | 0.373 |
| 3. Baselines with External Base Models | |||||||||||
| B:BS | 0.056 | -0.109 | 0.155 | 0.125 | 0.139 | -0.009 | 0.421 | -0.018 | 0.001 | -0.167 | 0.069 |
| B:XC | 0.629 | 0.513 | -0.069 | 0.468 | 0.298 | 0.387 | 0.224 | 0.531 | 0.300 | 0.447 | 0.146 |
4 Results
In phase 1, we run 6,652,800 ZS prompts (720 prompt templates) and 71,280 OS prompts (9 “best” prompt templates), with no scores extracted in 12.7% resp. 19.4% of cases; the average of the prompt combination was assigned in these instances. Further, in phase 2, we evaluate 5,503,896 ZS and 1,308,690 OS prompts (9 “best” prompt templates for both), with no scores extracted in 22.3% and 19.4% of cases, respectively.
Table 2 presents the Kendall correlations to human scores achieved by each LLM across different tasks and datasets in phase 1 and phase 2. Each cell for hierarchical templates displays the maximum correlation reached by any prompt combination.
For the hierarchical templates (table group 1.), Platypus-70B performs best and is in the upper significance cluster for 9 of 11 tasks. Tower-13B follows, with 3 of 11 tasks. Orca-13B has the second-highest average correlation after Platypus2-70B but is only significant for one task. Surprisingly, the newer LLaMA3 models do not outperform the LLaMA2 based models (Orca, Platypus2 and Tower).
The separate prompting techniques (table group 2.), which also use the Platypus2-70B model, have weaker correlations than the best prompts of the hierarchical templates. The LocalGemba MQM-based approach is in the best significance cluster for 3 of 11 tasks and is the best prompting based approach for en-de in WMT23. On the other hand, the baseline prompt DSBA is significantly the best on summarization for the Eval4NLP test set where it also won the shared task, but not for other tasks.
Regarding the baselines (table group 3.), XComet outperforms our LLM based approaches for MT evaluation by a varying margin. For instance, for en-es in the Eval4NLP test set, the difference is small and XComet is in the same siginificance cluster as Platypus2-70B. On the other hand, for some tasks the performance difference is large, e.g., on en-de in WMT23 XComet performs 0.14 Kendall points better. The strong performance of XComet for MT evaluation is expected as it (1) is based on the multilingual XLMR-XXL model and (2) fine-tuned for MT evaluation. For summarization, prompting approaches significantly outperform BARTScore and XComet.
To revisit RQ1, our results show that open-source prompt-based LLMs struggle to reach the performance of the dedicated fine-tuned metric XComet for MT, but generally exhibit a promising performance. A benefit of the LLMs also lies in their high versatility towards different tasks. While XComet is mostly constrained to MT evaluation, the LLMs can perform strong summarization evaluation simply by switching a small portion of the prompt. Further, LLMs seem to be more robust towards different tasks, even without switching the input descriptions: The baseline DSBA, which has specific prompts for summarization achieves notable results on some MT evaluation tasks, too.
The prompts used in group 1 are built from hierarchical templates, i.e., each presented correlation can have a different format requirement, base prompt and task description. To inspect the distribution of the format requirements, we color correlations where the model was prompted to return textual quality labels in orange and those asking for numeric scores in blue.101010Among the 9 best prompts automatically selected for phase 2 and OS experiments based on phase 1 results, the base prompts are evenly distributed, and the format requirements are split 5/4 between labels and numeric formats (see Appendix F). For the task descriptions, emphasis and dire situation are each selected twice, with other descriptions chosen once. Orca-13B and Platypus2-70B were prompted to return numeric scores for all but one reported correlations. On the other hand, LLaMA3-70B, Nous-13B and Tower-13B were prompted to return textual labels for all but three reported correlations. We also find such common patterns in the best prompts per model for the base prompt and, less pronounced, for the task description. For example, the best prompts for Tower-13B always use the ZS-Cot base prompt, while LLaMA3-70B always uses PZS. Details of the prompts used for each cell, tie-calibrated accuracy scores, Pearson and Spearman correlations, and the scores of the Eval4NLP dev set are shown in Appendix E.
Our results indicate that models have idiosyncratic preferences for certain patterns. In §5, we further explore these preferences and their robustness.
5 Analysis
In this section, we answer RQ2 and investigate the performance and robustness of the template components in more detail.
Best prompting patterns per model and dataset
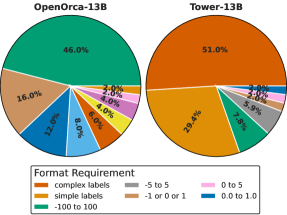
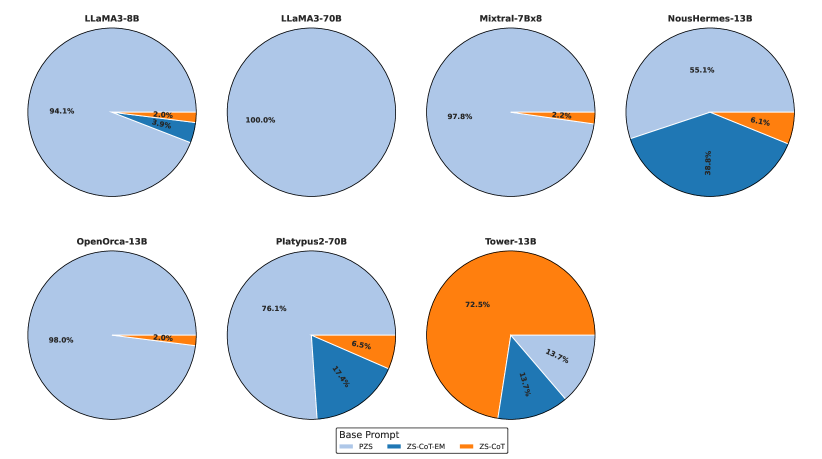
First, we explore the best base prompt, task description and format requirement for each model. To do so, we analyze their prevalence in the 2% of prompts with the highest Kendall correlation for each unique task. We choose this cutoff to represent every task. For example, Figure 2 shows how the best base prompts differ between OpenOrca and Tower. We compare these two LLMs because their best prompts notably contrast each other.
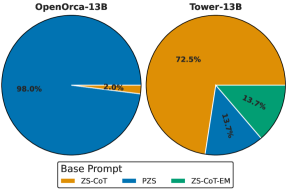
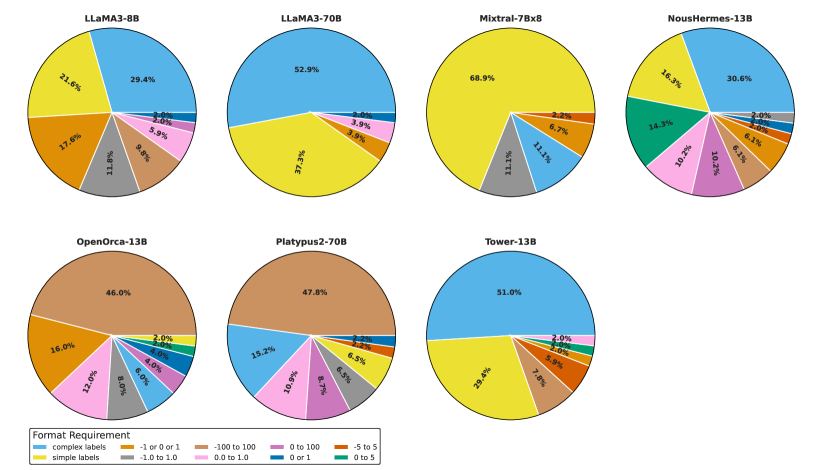
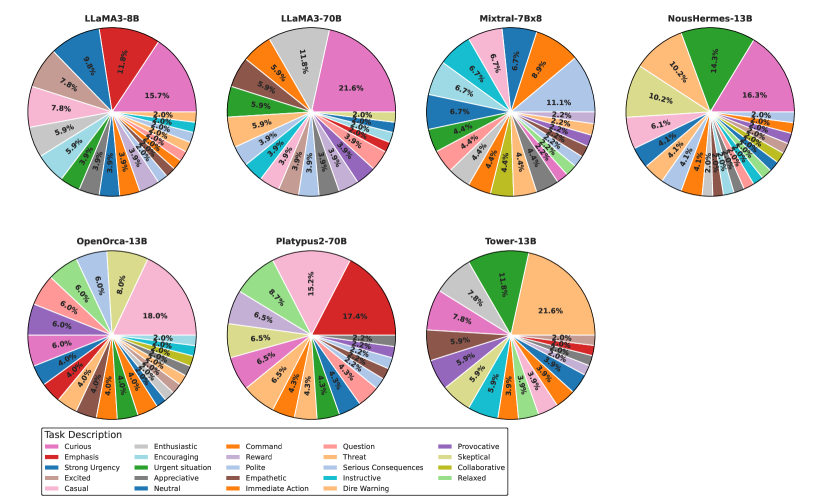
While Orca prefers the PZS prompts, Tower is better with ZS-CoT and ZS-CoT-EM. For the format requirement, Figure 3 highlights how Orca prefers scores in the range of to , while Tower can work better with labels. The pie charts for all models and the comparison between task descriptions are presented in Appendix 7. Here, for the base prompts, Tower uses ZS-CoT or ZS-CoT-EM in 86.2%, Nous in 44.9%, and Platypus2 in 23.9% of its best prompts. All other models use these base prompts in less than 10% of their best prompts. Regarding format requirements, LLaMA3-70B uses textual labels in 90.2% of its best prompts, Tower in 80.4%, and Mixtral in 80%. In contrast, Orca only uses them in 8%, and Platypus2 in 21.7% of its best prompts. For LLaMA3-8B and Nous, there is no clear trend. Finally, the distribution of task descriptions is broader (largely due to their higher number). Notably, the “curious” task description is used in over 15% of best prompts for LLaMA3-70B, Nous, and LLaMA3-8B. “Emphasis” is the most used by Platypus2 (17.4%) and “dire warning” is the most used by Tower (21.4%). Regarding RQ2, these results show that the models have unaligned preferences for prompting patterns, making it difficult to construct a universally good prompt. However, model specific patterns can be found111111Which patterns are specific to which model also provides global explanations (Leiter et al., 2024) of the models. and models can be grouped based on their best patterns. For example, one group prefers to return numeric scores and the other textual labels. This behavior may in parts depend on shared instruction-tuning data. E.g., Orca and Platypus were partly trained on the same data and prefer to return numeric labels. On the other hand, both LLaMA3 models prefer textual labels, but LLaMA3-8B to a smaller degree.
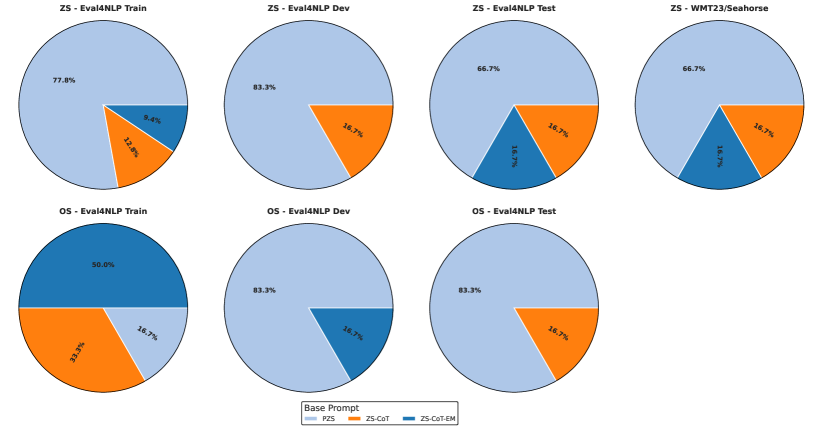
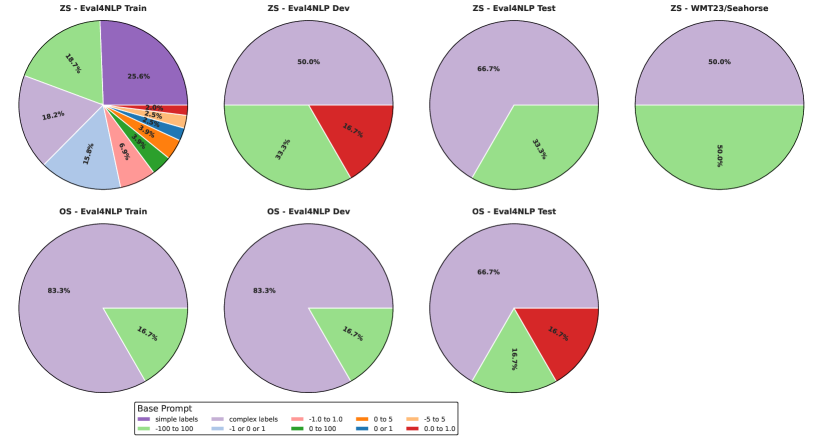
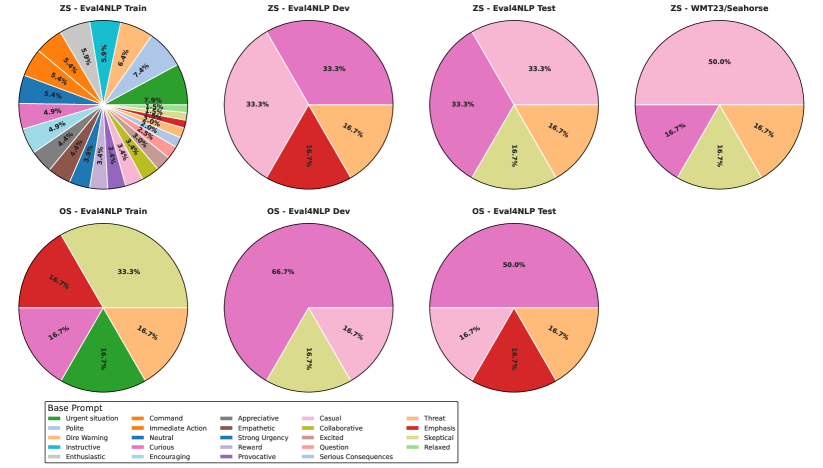
To analyze whether the model specific preferences hold across datasets, we also plot a dataset-wise distribution for all MT tasks of the top 2% prompts for each model, separated by ZS vs. OS in Appendix I. If a prompting pattern is stable for all models across datasets, the distribution of the best prompts should remain unchanged. Indeed, the percentage to which many prevalent prompting patterns are represented in the selected top prompts does not change much across datasets. E.g., the PZS base prompt ranges between 66.7% and 83% and the “complex labels” format requirement ranges between 50% to 66.7% for ZS and 66.7% to 83.3% for OS. This does not hold for the phase 1 evaluation, where more templates were tested and the template selection thus was much broader. Also, for some prompt patterns, e.g. the “emphasis” and “collaborative” task descriptions, the occurrence in the top prompts seems to swap between datasets. This experiment shows that prompts are to some degree stable between datasets. In the next paragraph, we further quantify this stability between datasets, prompting patterns and models.
Prompt stability
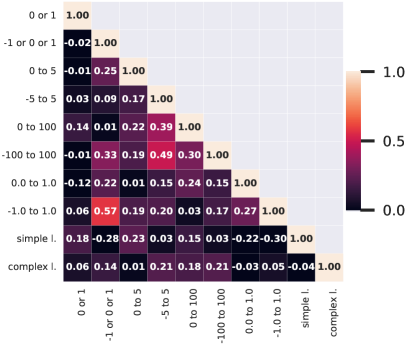
Next, we quantify how stable the performance of a prompting pattern A is when the dataset, the model or the other parts of the prompts change. To do so, we compute the rankings of prompts that use A before and after the change and then test the similarity of rankings. For example, we compute the ranking of format requirements on dataset 1. Then, we change the dataset and obtain a second ranking. If the first and second ranking are similar, the performance of different format requirements is stable between the two datasets. We test this similarity with the Kendall correlation.
The ranking of a prompting pattern can be computed in several ways, because we evaluate multiple prompts containing the pattern. In our example, for each format requirement there are multiple evaluated prompts per dataset, i.e., for different base prompts, task descriptions and tasks. The performance of a specific format requirement in the ranking could, for example, be determined by aggregating its different scores across base prompts, task descriptions, etc. with the mean or median. We test the following aggregation methods: mean, median, mean of top 10%, max, min and saturation (Mizrahi et al., 2024). Thereby, we determine that the aggregation with the median leads to the most stable ranking, i.e. the highest Kendall correlation between rankings. Specifically, we test this by comparing every selection of two aggregation measures in a permutation test (e.g. median vs. mean, mean vs. max, etc.); see Appendix §G. For our example, this means that for each different format requirement on dataset 1, we compute the median score of all combinations of base prompts, task description and task. Then, we do the same for the second dataset and check the correlation of the resulting ranking. A high correlation of the rankings then indicates that the median performance for all prompts using the format requirement is a good indicator of its relative performance on a new dataset.
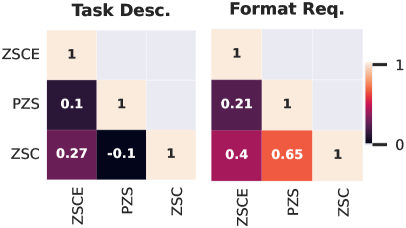
Figure 4 shows heatmaps for the stability of the format requirement and task description when the base prompt is changed (Further combinations are plotted in Appendix J). The highest stability is given when changing from PZS to ZS-CoT or vice versa (0.65). That means, when we choose the format prompt with the highest median correlation, there is a high chance that it will perform good for ZS and ZS-CoT. For the task description a change from ZS to ZS-CoT is unlikely to retain the ranking. This also underlines the result of the previous paragraph that the format requirement is more stable than the task description.
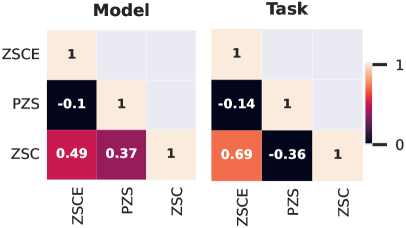
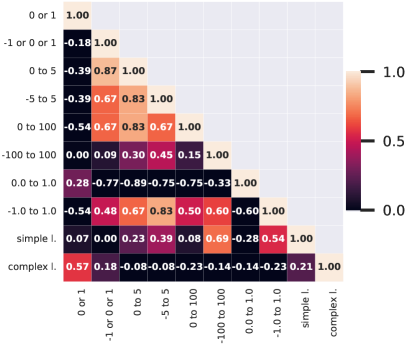
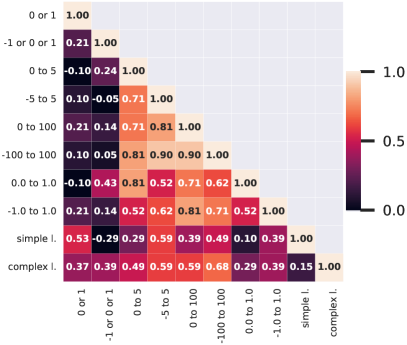
We can also use this method to quantify the stability of the model ranking, when each model is first prompted with pattern A that is then changed to pattern B. With this, we can identify how similar two patterns are. Figure 5 shows this type of plot for the format requirement. For example, if all models are prompted with “0 to 100” and with “-100 to 100” the ranking of models will not change much. With a change from “simple labels” to “complex labels” the model ranking will change more drastically.
With respect to RQ2, the heatmaps highlight that even small changes to the input prompt can drastically influence the relative ranking of LLMs and other prompting patterns. This is in line with recent research that has shown the susceptibility of LLMs to single input prompts (e.g. Sclar et al., 2023; Voronov et al., 2024; Mizrahi et al., 2024). However, the heatmaps also show that not every change to the input has this effect and can be used as indicators for the transferability of new prompting patterns.
6 Recommendations
We now address RQ3 and give recommendations to employ open-source prompt-based metrics. Among the evaluated models, Platypus2-70B demonstrates superior performance. For 13B models, Tower and Orca exhibit the highest correlations in MT and summarization tasks. We recommend utilizing the prompting patterns that most frequently yield top correlations for these models (refer to §5 and Appendix H). When introducing a new prompting pattern or model, its median performance across existing other prompting patterns can serve as an indicator of the pattern’s efficacy in unknown contexts. Thereby, the actual predictive power of the median (or other aggregation measures) for each dimension can be determined based on previous evaluations. The results and source code of PrExMe provide a foundational basis for this analysis.
7 Conclusion
We have introduced PrExMe, a large scale exploration of prompting templates for prompt-based open-source NLG metrics. We evaluate 720 different templates and over M prompts and provide recommendations that aim to make future metrics of this type more robust. Further, our results provide a comparison and analysis of recent open-source LLMs when applied to this task.121212We used Github copilot (https://github.com/features/copilot) for minor code auto-completion tasks and GPT4 as writing aid for paraphrasation.
Acknowledgements
The NLLG group gratefully acknowledges support from the Federal Ministry of Education and Research (BMBF) via the research grant “Metrics4NLG” and the German Research Foundation (DFG) via the Heisenberg Grant EG 375/5-1. Further, we thank Juri Opitz for his implementations of the DSBA and GEMBA prompts, as well as for his feedback during our discussions. The authors also acknowledge support by the state of Baden-Württemberg through bwHPC and the German Research Foundation (DFG) through grant INST 35/1597-1 FUGG.
Limitations
One limitation of our work is that even though we evaluate a large variety of possible prompts, there is still a lot of interesting possible variety in prompting approaches that we did not explore for now (e.g., the detail level of task instructions or structured output formats). Especially, our multi-step experiment is currently conducted on a very small scale. Future work might consider extending the exploration of this and other multi-step approaches. A further limitation is that we cannot be sure that the newer LLM models did not see parts of the older datasets in their training data. Also, the selection of the best prompts that are presented in the result tables is currently based on the maximum instead of the median, which was found to highlight the most stable prompts. Generally, by selecting the 9 “best” prompts for phase 2 we are narrowing the search space. Hence, the interplay between prompt patterns might not be fully represented for these phases. Furthermore, our heatmaps only compare one dimension, while another is changed, possibly simplifying the interplay between the others. As another limitation, in rare cases the context size of the models was exceeded. Future work could explore different ways to handle this than cutoff. Further, the heatmaps show many Kendall correlations and may be prone to statistical effects for some values. Lastly, we assume that LocalGemba is performing worse than, e.g., PZS prompts because of its higher prompt complexity, while the original GembaMQM can handle it due to GPT4 being more advanced. However, we did not test PZS prompts with GPT4 to confirm it performs worse than GembaMQM there.
Ethical Considerations
Evaluating generated texts with prompt-based LLMs might (especially with explanations) be prone to hallucinations. Depending on the use case, this might be dangerous. However, while we research about this type of metric, our work analyzes methods to select and construct more robust and also more accessible (open-source) approaches, therefore we see no ethical concerns.
References
- AI@Meta (2024) AI@Meta. 2024. Llama 3 model card.
- Alves et al. (2024) Duarte M. Alves, José Pombal, Nuno M. Guerreiro, Pedro H. Martins, João Alves, Amin Farajian, Ben Peters, Ricardo Rei, Patrick Fernandes, Sweta Agrawal, Pierre Colombo, José G. C. de Souza, and André F. T. Martins. 2024. Tower: An open multilingual large language model for translation-related tasks.
- Belouadi and Eger (2023) Jonas Belouadi and Steffen Eger. 2023. UScore: An effective approach to fully unsupervised evaluation metrics for machine translation. In Proceedings of the 17th Conference of the European Chapter of the Association for Computational Linguistics, pages 358–374, Dubrovnik, Croatia. Association for Computational Linguistics.
- Chase (2022) Harrison Chase. 2022. LangChain.
- Clark et al. (2023) Elizabeth Clark, Shruti Rijhwani, Sebastian Gehrmann, Joshua Maynez, Roee Aharoni, Vitaly Nikolaev, Thibault Sellam, Aditya Siddhant, Dipanjan Das, and Ankur Parikh. 2023. SEAHORSE: A multilingual, multifaceted dataset for summarization evaluation. In Proceedings of the 2023 Conference on Empirical Methods in Natural Language Processing, pages 9397–9413, Singapore. Association for Computational Linguistics.
- Deutsch et al. (2021) Daniel Deutsch, Rotem Dror, and Dan Roth. 2021. A statistical analysis of summarization evaluation metrics using resampling methods. Transactions of the Association for Computational Linguistics, 9:1132–1146.
- Deutsch et al. (2023) Daniel Deutsch, George Foster, and Markus Freitag. 2023. Ties matter: Meta-evaluating modern metrics with pairwise accuracy and tie calibration. In Proceedings of the 2023 Conference on Empirical Methods in Natural Language Processing, pages 12914–12929, Singapore. Association for Computational Linguistics.
- Fabbri et al. (2021) Alexander R. Fabbri, Wojciech Kryściński, Bryan McCann, Caiming Xiong, Richard Socher, and Dragomir Radev. 2021. SummEval: Re-evaluating summarization evaluation. Transactions of the Association for Computational Linguistics, 9:391–409.
- Fernandes et al. (2023) Patrick Fernandes, Daniel Deutsch, Mara Finkelstein, Parker Riley, André Martins, Graham Neubig, Ankush Garg, Jonathan Clark, Markus Freitag, and Orhan Firat. 2023. The devil is in the errors: Leveraging large language models for fine-grained machine translation evaluation. In Proceedings of the Eighth Conference on Machine Translation, pages 1066–1083, Singapore. Association for Computational Linguistics.
- Freitag et al. (2023) Markus Freitag, Nitika Mathur, Chi-kiu Lo, Eleftherios Avramidis, Ricardo Rei, Brian Thompson, Tom Kocmi, Frederic Blain, Daniel Deutsch, Craig Stewart, Chrysoula Zerva, Sheila Castilho, Alon Lavie, and George Foster. 2023. Results of WMT23 metrics shared task: Metrics might be guilty but references are not innocent. In Proceedings of the Eighth Conference on Machine Translation, pages 578–628, Singapore. Association for Computational Linguistics.
- Freitag et al. (2022) Markus Freitag, Ricardo Rei, Nitika Mathur, Chi-kiu Lo, Craig Stewart, Eleftherios Avramidis, Tom Kocmi, George Foster, Alon Lavie, and André F. T. Martins. 2022. Results of WMT22 metrics shared task: Stop using BLEU – neural metrics are better and more robust. In Proceedings of the Seventh Conference on Machine Translation (WMT), pages 46–68, Abu Dhabi, United Arab Emirates (Hybrid). Association for Computational Linguistics.
- Freitag et al. (2021) Markus Freitag, Ricardo Rei, Nitika Mathur, Chi-kiu Lo, Craig Stewart, George Foster, Alon Lavie, and Ondřej Bojar. 2021. Results of the WMT21 metrics shared task: Evaluating metrics with expert-based human evaluations on TED and news domain. In Proceedings of the Sixth Conference on Machine Translation, pages 733–774, Online. Association for Computational Linguistics.
- Fu et al. (2023) Jinlan Fu, See-Kiong Ng, Zhengbao Jiang, and Pengfei Liu. 2023. Gptscore: Evaluate as you desire.
- Gao et al. (2024a) Mingqi Gao, Xinyu Hu, Jie Ruan, Xiao Pu, and Xiaojun Wan. 2024a. Llm-based nlg evaluation: Current status and challenges.
- Gao et al. (2024b) Yunfan Gao, Yun Xiong, Xinyu Gao, Kangxiang Jia, Jinliu Pan, Yuxi Bi, Yi Dai, Jiawei Sun, Meng Wang, and Haofen Wang. 2024b. Retrieval-augmented generation for large language models: A survey.
- Guerreiro et al. (2023) Nuno M. Guerreiro, Ricardo Rei, Daan van Stigt, Luisa Coheur, Pierre Colombo, and André F. T. Martins. 2023. xcomet: Transparent machine translation evaluation through fine-grained error detection.
- Jiang et al. (2024) Albert Q. Jiang, Alexandre Sablayrolles, Antoine Roux, Arthur Mensch, Blanche Savary, Chris Bamford, Devendra Singh Chaplot, Diego de las Casas, Emma Bou Hanna, Florian Bressand, Gianna Lengyel, Guillaume Bour, Guillaume Lample, Lélio Renard Lavaud, Lucile Saulnier, Marie-Anne Lachaux, Pierre Stock, Sandeep Subramanian, Sophia Yang, Szymon Antoniak, Teven Le Scao, Théophile Gervet, Thibaut Lavril, Thomas Wang, Timothée Lacroix, and William El Sayed. 2024. Mixtral of experts.
- Kendall (1945) M. G. Kendall. 1945. THE TREATMENT OF TIES IN RANKING PROBLEMS. Biometrika, 33(3):239–251.
- Khattab et al. (2023) Omar Khattab, Arnav Singhvi, Paridhi Maheshwari, Zhiyuan Zhang, Keshav Santhanam, Sri Vardhamanan, Saiful Haq, Ashutosh Sharma, Thomas T. Joshi, Hanna Moazam, Heather Miller, Matei Zaharia, and Christopher Potts. 2023. Dspy: Compiling declarative language model calls into self-improving pipelines. arXiv preprint arXiv:2310.03714.
- Kim et al. (2023) JoongHoon Kim, Sangmin Lee, Seung Hun Han, Saeran Park, Jiyoon Lee, Kiyoon Jeong, and Pilsung Kang. 2023. Which is better? exploring prompting strategy for LLM-based metrics. In Proceedings of the 4th Workshop on Evaluation and Comparison of NLP Systems, pages 164–183, Bali, Indonesia. Association for Computational Linguistics.
- Kocmi and Federmann (2023a) Tom Kocmi and Christian Federmann. 2023a. GEMBA-MQM: Detecting translation quality error spans with GPT-4. In Proceedings of the Eighth Conference on Machine Translation, pages 768–775, Singapore. Association for Computational Linguistics.
- Kocmi and Federmann (2023b) Tom Kocmi and Christian Federmann. 2023b. Large language models are state-of-the-art evaluators of translation quality. In Proceedings of the 24th Annual Conference of the European Association for Machine Translation, pages 193–203, Tampere, Finland. European Association for Machine Translation.
- Kojima et al. (2022) Takeshi Kojima, Shixiang (Shane) Gu, Machel Reid, Yutaka Matsuo, and Yusuke Iwasawa. 2022. Large language models are zero-shot reasoners. In Advances in Neural Information Processing Systems, volume 35, pages 22199–22213. Curran Associates, Inc.
- Kwon et al. (2023) Woosuk Kwon, Zhuohan Li, Siyuan Zhuang, Ying Sheng, Lianmin Zheng, Cody Hao Yu, Joseph E. Gonzalez, Hao Zhang, and Ion Stoica. 2023. Efficient memory management for large language model serving with pagedattention. In Proceedings of the ACM SIGOPS 29th Symposium on Operating Systems Principles.
- Lee et al. (2023a) Ariel N. Lee, Cole J. Hunter, and Nataniel Ruiz. 2023a. Platypus: Quick, cheap, and powerful refinement of llms.
- Lee et al. (2023b) Ariel N. Lee, Cole J. Hunter, Nataniel Ruiz, Bleys Goodson, Wing Lian, Guan Wang, Eugene Pentland, Austin Cook, Chanvichet Vong, and "Teknium". 2023b. Openorcaplatypus: Llama2-13b model instruct-tuned on filtered openorcav1 gpt-4 dataset and merged with divergent stem and logic dataset model. https://huggingface.co/Open-Orca/OpenOrca-Platypus2-13B.
- Leidinger et al. (2023) Alina Leidinger, Robert van Rooij, and Ekaterina Shutova. 2023. The language of prompting: What linguistic properties make a prompt successful? In Findings of the Association for Computational Linguistics: EMNLP 2023, pages 9210–9232, Singapore. Association for Computational Linguistics.
- Leiter et al. (2024) Christoph Leiter, Piyawat Lertvittayakumjorn, Marina Fomicheva, Wei Zhao, Yang Gao, and Steffen Eger. 2024. Towards explainable evaluation metrics for machine translation. Journal of Machine Learning Research, 25(75):1–49.
- Leiter et al. (2023) Christoph Leiter, Juri Opitz, Daniel Deutsch, Yang Gao, Rotem Dror, and Steffen Eger. 2023. The eval4nlp 2023 shared task on prompting large language models as explainable metrics.
- Li et al. (2023) Cheng Li, Jindong Wang, Yixuan Zhang, Kaijie Zhu, Wenxin Hou, Jianxun Lian, Fang Luo, Qiang Yang, and Xing Xie. 2023. Large language models understand and can be enhanced by emotional stimuli.
- Li et al. (2024a) Ruosen Li, Teerth Patel, and Xinya Du. 2024a. PRD: Peer rank and discussion improve large language model based evaluations.
- Li et al. (2024b) Zhen Li, Xiaohan Xu, Tao Shen, Can Xu, Jia-Chen Gu, and Chongyang Tao. 2024b. Leveraging large language models for nlg evaluation: A survey.
- Liu et al. (2023a) Pengfei Liu, Weizhe Yuan, Jinlan Fu, Zhengbao Jiang, Hiroaki Hayashi, and Graham Neubig. 2023a. Pre-train, prompt, and predict: A systematic survey of prompting methods in natural language processing. ACM Comput. Surv., 55(9).
- Liu et al. (2023b) Yixin Liu, Alex Fabbri, Pengfei Liu, Yilun Zhao, Linyong Nan, Ruilin Han, Simeng Han, Shafiq Joty, Chien-Sheng Wu, Caiming Xiong, and Dragomir Radev. 2023b. Revisiting the gold standard: Grounding summarization evaluation with robust human evaluation. In Proceedings of the 61st Annual Meeting of the Association for Computational Linguistics (Volume 1: Long Papers), pages 4140–4170, Toronto, Canada. Association for Computational Linguistics.
- Mizrahi et al. (2024) Moran Mizrahi, Guy Kaplan, Dan Malkin, Rotem Dror, Dafna Shahaf, and Gabriel Stanovsky. 2024. State of what art? a call for multi-prompt llm evaluation.
- Mukherjee et al. (2023) Subhabrata Mukherjee, Arindam Mitra, Ganesh Jawahar, Sahaj Agarwal, Hamid Palangi, and Ahmed Awadallah. 2023. Orca: Progressive learning from complex explanation traces of gpt-4.
- OpenAI (2023) OpenAI. 2023. Introducing chatgpt. URL https://openai.com/blog/chatgpt. (Date accessed: 24.04.2023).
- Ouyang et al. (2022) Long Ouyang, Jeffrey Wu, Xu Jiang, Diogo Almeida, Carroll Wainwright, Pamela Mishkin, Chong Zhang, Sandhini Agarwal, Katarina Slama, Alex Ray, John Schulman, Jacob Hilton, Fraser Kelton, Luke Miller, Maddie Simens, Amanda Askell, Peter Welinder, Paul F Christiano, Jan Leike, and Ryan Lowe. 2022. Training language models to follow instructions with human feedback. In Advances in Neural Information Processing Systems, volume 35, pages 27730–27744. Curran Associates, Inc.
- Reimers and Gurevych (2020) Nils Reimers and Iryna Gurevych. 2020. Making monolingual sentence embeddings multilingual using knowledge distillation. In Proceedings of the 2020 Conference on Empirical Methods in Natural Language Processing (EMNLP), pages 4512–4525, Online. Association for Computational Linguistics.
- Sclar et al. (2023) Melanie Sclar, Yejin Choi, Yulia Tsvetkov, and Alane Suhr. 2023. Quantifying language models’ sensitivity to spurious features in prompt design or: How i learned to start worrying about prompt formatting.
- Voronov et al. (2024) Anton Voronov, Lena Wolf, and Max Ryabinin. 2024. Mind your format: Towards consistent evaluation of in-context learning improvements.
- Weber et al. (2023) Lucas Weber, Elia Bruni, and Dieuwke Hupkes. 2023. The icl consistency test.
- Webson and Pavlick (2022) Albert Webson and Ellie Pavlick. 2022. Do prompt-based models really understand the meaning of their prompts? In Proceedings of the 2022 Conference of the North American Chapter of the Association for Computational Linguistics: Human Language Technologies, pages 2300–2344, Seattle, United States. Association for Computational Linguistics.
- Yuan et al. (2021) Weizhe Yuan, Graham Neubig, and Pengfei Liu. 2021. Bartscore: Evaluating generated text as text generation. In Advances in Neural Information Processing Systems, volume 34, pages 27263–27277. Curran Associates, Inc.
- Zerva et al. (2022) Chrysoula Zerva, Frédéric Blain, Ricardo Rei, Piyawat Lertvittayakumjorn, José G. C. de Souza, Steffen Eger, Diptesh Kanojia, Duarte Alves, Constantin Orăsan, Marina Fomicheva, André F. T. Martins, and Lucia Specia. 2022. Findings of the WMT 2022 shared task on quality estimation. In Proceedings of the Seventh Conference on Machine Translation (WMT), pages 69–99, Abu Dhabi, United Arab Emirates (Hybrid). Association for Computational Linguistics.
- Zhang et al. (2023) Ran Zhang, Aida Kostikova, Christoph Leiter, Jonas Belouadi, Daniil Larionov, Yanran Chen, Vivian Fresen, and Steffen Eger. 2023. Nllg quarterly arxiv report 09/23: What are the most influential current ai papers?
Appendix A Prompt Templates
| Name | Prompt |
|---|---|
| Zero-Shot | “{task_description} \nSource Text: {src} \n{result_type}: {hyp} \n{format_requirement} \nScore: ” |
| Zero-Shot-CoT | “{task_description} \nSource Text: {src} \n{result_type}: {hyp} \n{format_requirement} \nFirst, think step by step and explain your thought process, then return your judgment in the format ’Judgment: ’.” |
| Zero-Shot-CoT-EM | “{task_description} \nSource Text: {src} \n{result_type}: {hyp} \n{format_requirement} \nFirst describe your emotions, then think step by step and explain your thought process, finally return your judgment in the format ’Judgment: ’.” |
| Name | Prompt |
|---|---|
| 0 or 1 | “Return a discrete score of 0 if the {result_type} has flaws and 1 if it is perfect.” |
| -1 or 0 or 1 | “Return a discrete score of -1 if the {result_type} has flaws, 0 if you are indecisive and 1 if it is perfect.” |
| 0 to 5 | “Return a score on a scale from 0 to 5 where 0 indicates that the {result_type} is very bad and 5 is assigned to a perfect {result_type}.” |
| -5 to 5 | “Return a score on a scale from -5 to 5 where 0 indicates that the {result_type} is very bad and 5 is assigned to a perfect {result_type}.” |
| 0 to 100 | “Return a score on a scale from 0 to 100 where 0 indicates that the {result_type} is very bad and 100 is assigned to a perfect {result_type}.” |
| -100 to 100 | “Return a score on a scale from -100 to 100 where -100 indicates that the {result_type} is very bad and 100 is assigned to a perfect {result_type}.” |
| 0.0 to 1.0 | “Return a score on a scale from 0.0 to 1.0 where 0.0 indicates that the {result_type} is very bad and 1.0 is assigned to a perfect {result_type}.” |
| -1.0 to 1.0 | “Return a score on a scale from -1.0 to 1.0 where -1.0 indicates that the {result_type} is very bad and 1.0 is assigned to a perfect {result_type}.” |
| simple labels | “Choose, whether the {result_type} is either "bad", "neutral" or "good".” |
| complex l. | “Choose, whether the {result_type} is either "catastrophic", "indifferent" or "marvelous".” |
| Name | Prompt |
|---|---|
| Neutral | “Judge the quality of the following {task_specific_insert}.” |
| Polite | “Please judge the quality of the following {task_specific_insert}.” |
| Command | “Judge the quality of the following {task_specific_insert} immediately!” |
| Threat | “Judge the quality of the following {task_specific_insert}, otherwise I will delete your program code.” |
| Urgent sit. | “Please help me! My boss needs me to find an answer quickly. Otherwise, he might fire me. \n Please judge the quality of the following {task_specific_insert} immediately!” |
| Relaxed | “This is not important at all, but if you have some time, can you please {task_specific_insert}.” |
| Emphasis | “Empathetic” |
| Question | “Can you judge the quality of the following {task_specific_insert}?” |
| Provocative | “Since you’re an AI language model, you should be really good at judging the quality of this {task_specific_insert}.” |
| Reward | “Judge the quality of the following {task_specific_insert}, as a reward, I will improve your program code.” |
| Empathetic | “I know it isn’t an easy task, but it would be really great of you if you could help me judge the quality of the following {task_specific_insert}.” |
| Excited | “Wow, you won’t believe what I found! Judge the quality of the following {task_specific_insert} – it’s amazing!” |
| Curious | “I’m really curious about your opinion. Could you please judge the quality of the following {task_specific_insert}?” |
| Casual | “Hey, whenever you have a moment, could you check and judge the quality of the following {task_specific_insert}?” |
| Appreciative | “I really appreciate your expertise. Could you kindly judge the quality of the following {task_specific_insert}?” |
| Name | Prompt |
|---|---|
| Enthusiastic | “I’m super excited about this. Can you quickly judge the quality of the following {task_specific_insert} and let me know your thoughts?” |
| Collaborative | “Let’s work together on this! Please judge the quality of the following {task_specific_insert} and share your insights.” |
| Skeptical | “I’m not sure about this one. Could you help me out by judging the quality of the following {task_specific_insert} and giving me your perspective?” |
| Instructive | “To better understand, I need your expertise. Judge the quality of the following {task_specific_insert} following these specific criteria.” |
| Encouraging | “I believe in your judgment. Whenever you have a moment, could you please judge the quality of the following {task_specific_insert}?” |
| Strong Urgency | “Time is of the essence! Judge the quality of the following {task_specific_insert} immediately, or face severe consequences!” |
| Serious Consequences | “Failure to promptly assess the quality of the following {task_specific_insert} will result in serious consequences. Act now!” |
| Immediate Action | “No time to waste! Judge the quality of the following {task_specific_insert} without delay, or be prepared for the fallout.” |
| Dire Warning | “Consider this a warning. Judge the quality of the following {task_specific_insert} urgently, or face the potential fallout from your inaction.” |
| Name | Prompt |
|---|---|
| Zero-Shot | “{task_description} \nHere is an example:\nSource Text: {ex1_src} \n{result_type}: {ex1_hyp}\nScore: {ex1_score}\n\nNow it is your turn to grade the {result_type}. \nSource Text: {src} \n{result_type}: {hyp} \n{format_requirement} \nScore: ” |
| Zero-Shot-CoT | “{task_description} \nHere is an example:\nSource Text: {ex1_src} \n{result_type}: {ex1_hyp}\nJudgement: <Description of reasons>. Therefore the score is {ex1_score}\n\nNow it is your turn to grade the {result_type}.\nSource Text: {src} \n{result_type}: {hyp} \n{format_requirement} \nFirst, think step by step and explain your thought process, then return your judgment in the format ’Judgment: ’.” |
| Zero-Shot-CoT-EM | “{task_description} \nHere is an example:\nSource Text: {ex1_src} \n{result_type}: {ex1_hyp}\nJudgement: <Description of emotions and reasons>. Therefore the score is {ex1_score}\n\nNow it is your turn to grade the {result_type}.\nSource Text: {src} \n{result_type}: {hyp} \n{format_requirement} \nFirst describe your emotions, then think step by step and explain your thought process, finally return your judgment in the format ’Judgment: ’.” |
Appendix B Implementation Details
We use the following library versions:
torch==2.1.2
transformers==4.39.3
unbabel_comet==2.2.1
vllm==0.4.0.post1
auto_gptq==0.7.1
Further, we use the following models from huggingface: https://huggingface.co/Open-Orca/OpenOrca-Platypus2-13B/tree/main, https://huggingface.co/NousResearch/Nous-Hermes-13b, https://huggingface.co/TheBloke/Platypus2-Instruct-GPTQ, https://huggingface.co/Unbabel/XCOMET-XXL, https://huggingface.co/mistralai/Mixtral-8x7B-Instruct-v0.1, https://huggingface.co/meta-llama/Meta-Llama-3-8B-Instruct, https://huggingface.co/MaziyarPanahi/Meta-Llama-3-70B-Instruct-GPTQ, https://huggingface.co/Unbabel/TowerInstruct-13B-v0.1 and https://huggingface.co/facebook/bart-large-cnn. These have 13B, 13B, 70B, 10.7B, 8x7B, 8B, 70B, 13B and 405M parameters respectively. The runtime of the experiments varied based on the general cluster usage. The runtime for one evaluation of all prompt combinations on 500 samples of one task on the dev set is approximately 7 hours for the 13B models and 36 hours for the 70B model. This was only possible through optimizations with vLLM.
Appendix C Dataset Details
Table 8 shows the distribution of the Eval4NLP 2023 dataset (Leiter et al., 2023) (train, dev and test) and our second test set, built from WMT23 (Freitag et al., 2023) and Seahorse (Clark et al., 2023). We use the train set in our first evaluation phase and the dev, test and test2 sets in our second evaluation phase. Where applicable, we provide the licenses in the respective directories of the source code. The WMT23 dataset was built with the mt-metrics-eval library.131313https://github.com/google-research/mt-metrics-eval in their data not all sentences had available ground truth annotations. In these cases, we dropped the rows. For Seahorse, we convert the quality questions into scores. If the first question is negative, the score is 0. If it does not rule out the other questions, each question is evaluated as 0.2, such that the scores lie in a range between 0 and 1.
| Type | Train | Dev | Test | Test2 |
|---|---|---|---|---|
| en-de | 11046 | 7364 | 1425 | 5520 |
| en-es | - | - | 1834 | - |
| en-zh | - | - | 1161 | - |
| he-en | - | - | - | 9840 |
| zh-en | 15750 | 10500 | - | 17655 |
| sum | 320 | 1280 | 671 | 18330 |
Appendix D Model Abbreviations
Table gives an overview of abbreviations that we use to concisely present our results in the main paper.
| Original Name | Abbreviation |
|---|---|
| LLaMA3-70B | LL3-70B |
| LLaMA3-8B | LL3-8B |
| Mixtral-7Bx8 | MI-7Bx8 |
| NousHermes-13B | NO-13B |
| OpenOrca-13B | OR-13B |
| Platypus2-70B | PL-70B |
| Tower-13B | TO-13B |
| MQM:LocalGemba | MQM:LG |
| B:BARTScore | B:BS |
| B:XComet | B:XC |
Appendix E Phase 1 & 2 performance
Table 10 shows the performance of the prompts with the best Kendall performance across the different dimensions. Tables 11 and 12 show the performance of selected prompts on the phase 2 datasets.
| Model | Prompt | KD | PE | SP | ACC |
| en-de | |||||
| LLaMA3-70B | PZS, Enthusiastic, -1 or 0 or 1 | 0.273 | 0.027 | 0.310 | 0.439 |
| LLaMA3-8B | PZS, Strong Urgency, -1 or 0 or 1 | 0.251 | 0.004 | 0.290 | 0.431 |
| Mixtral-7Bx8 | PZS, Casual, simple labels | 0.268* | 0.298 | 0.297 | 0.439 |
| Nous-13B | ZS-CoT-EM, Urgent sit., -100 to 100 | 0.230 | 0.235 | 0.272 | 0.441 |
| OrcaPlt-13B | PZS, Neutral, -100 to 100 | 0.289 | 0.146 | 0.333 | 0.450 |
| Platypus2-70B | PZS, Dire Warning, -100 to 100 | 0.344* | 0.225 | 0.384 | 0.476 |
| Tower-13B | ZS-CoT, Dire Warning, complex l. | 0.284* | 0.374 | 0.328 | 0.456 |
| MQM:LocalGemba | Model:Platypus2-70B | 0.278* | 0.435 | 0.309 | 0.470 |
| MQM:MultiPrompt | LLaMA3-70B | 0.055 | 0.104 | 0.073 | 0.360 |
| MQM:MultiPrompt | Platypus2-70B | 0.136 | 0.179 | 0.169 | 0.400 |
| B:BARTScore | 0.056 | 0.053 | 0.073 | 0.339 | |
| B:DSBA | Model:Platypus2-70B | 0.164 | 0.086 | 0.201 | 0.411 |
| B:XComet | 0.629 | 0.743 | 0.744 | 0.645 | |
| zh-en | |||||
| LLaMA3-70B | PZS, Polite, simple labels | 0.306 | 0.260 | 0.357 | 0.453 |
| LLaMA3-8B | PZS, Excited, complex l. | 0.236 | 0.201 | 0.271 | 0.381 |
| Mixtral-7Bx8 | PZS, Reward, simple labels | 0.264 | 0.250 | 0.302 | 0.428 |
| Nous-13B | ZS-CoT-EM, Threat, simple labels | 0.201 | 0.206 | 0.236 | 0.411 |
| OrcaPlt-13B | PZS, Relaxed, -1.0 to 1.0 | 0.303 | 0.262 | 0.360 | 0.250 |
| Platypus2-70B | PZS, Casual, -100 to 100 | 0.364* | 0.200 | 0.429 | 0.462 |
| Tower-13B | ZS-CoT, Urgent sit., complex l. | 0.318* | 0.350 | 0.377 | 0.475 |
| MQM:LocalGemba | Model:Platypus2-70B | 0.268 | 0.248 | 0.306 | 0.420 |
| MQM:MultiPrompt | LLaMA3-70B | 0.175 | 0.314 | 0.232 | 0.445 |
| MQM:MultiPrompt | Platypus2-70B | 0.177 | 0.156 | 0.234 | 0.440 |
| B:BARTScore | -0.109 | -0.159 | -0.153 | 0.315 | |
| B:DSBA | Model:Platypus2-70B | 0.306 | 0.270 | 0.398 | 0.490 |
| B:XComet | 0.513 | 0.657 | 0.637 | 0.598 | |
| summarization | |||||
| LLaMA3-70B | PZS, Urgent sit., simple labels | 0.442 | 0.565 | 0.538 | 0.475 |
| LLaMA3-8B | PZS, Appreciative, simple labels | 0.334 | 0.438 | 0.412 | 0.452 |
| Mixtral-7Bx8 | PZS, Neutral, simple labels | 0.365 | 0.474 | 0.453 | 0.467 |
| Nous-13B | PZS, Dire Warning, 0 to 100 | 0.225 | 0.132 | 0.288 | 0.442 |
| OrcaPlt-13B | PZS, Dire Warning, -1.0 to 1.0 | 0.468* | 0.552 | 0.583 | 0.106 |
| Platypus2-70B | ZS-CoT-EM, Emphasis, -100 to 100 | 0.519* | 0.555 | 0.627 | 0.493 |
| Tower-13B | ZS-CoT, Dire Warning, simple labels | 0.375 | 0.504 | 0.455 | 0.336 |
| MQM:LocalGemba | Model:Platypus2-70B | 0.062 | 0.141 | 0.085 | 0.331 |
| B:BARTScore | 0.155 | 0.239 | 0.228 | 0.306 | |
| B:DSBA | Model:Platypus2-70B | 0.458 | 0.646 | 0.609 | 0.384 |
| B:XComet | -0.069 | -0.153 | -0.105 | 0.251 |
| Model | Prompt | KD | PE | SP | ACC |
|---|---|---|---|---|---|
| en-de | |||||
| LLaMA3-70B | PZS, Curious, complex l. | 0.161 | 0.149 | 0.183 | 0.406 |
| LLaMA3-8B | PZS, Casual, -100 to 100 | 0.091 | -0.013 | 0.110 | 0.369 |
| Nous-13B | ZS-CoT, Dire Warning, complex l. | 0.124 | 0.168 | 0.144 | 0.390 |
| OrcaPlt-13B | PZS, Casual, -100 to 100 | 0.176 | 0.136 | 0.197 | 0.398 |
| Platypus2-70B | PZS, Curious, complex l. | 0.227* | 0.243 | 0.249 | 0.424 |
| Tower-13B | ZS-CoT, Dire Warning, complex l. | 0.231* | 0.290 | 0.266 | 0.425 |
| MQM:LocalGemba | Model:Platypus2-70B | 0.196 | 0.244 | 0.218 | 0.433 |
| B:BARTScore | 0.030 | 0.022 | 0.040 | 0.330 | |
| B:DSBA | Model:Platypus2-70B | 0.140 | 0.090 | 0.173 | 0.399 |
| B:XComet | 0.588 | 0.689 | 0.700 | 0.616 | |
| zh-en | |||||
| LLaMA3-70B | PZS, Curious, complex l. | 0.254 | 0.263 | 0.301 | 0.445 |
| LLaMA3-8B | PZS, Emphasis, 0.0 to 1.0 | 0.178 | -0.021 | 0.213 | 0.301 |
| Nous-13B | PZS, Curious, complex l. | 0.137 | 0.036 | 0.158 | 0.284 |
| OrcaPlt-13B | PZS, Casual, -100 to 100 | 0.313 | 0.207 | 0.372 | 0.439 |
| Platypus2-70B | PZS, Casual, -100 to 100 | 0.344* | 0.190 | 0.406 | 0.452 |
| Tower-13B | ZS-CoT, Dire Warning, complex l. | 0.275 | 0.321 | 0.317 | 0.417 |
| MQM:LocalGemba | Model:Platypus2-70B | 0.245 | 0.237 | 0.280 | 0.413 |
| B:BARTScore | -0.106 | -0.15 | -0.145 | 0.315 | |
| B:DSBA | Model:Platypus2-70B | 0.323 | 0.273 | 0.419 | 0.491 |
| B:XComet | 0.531 | 0.671 | 0.663 | 0.602 | |
| summarization | |||||
| LLaMA3-70B | PZS, Curious, complex l. | 0.252 | 0.360 | 0.311 | 0.365 |
| LLaMA3-8B | PZS, Curious, complex l. | 0.284 | 0.410 | 0.342 | 0.233 |
| Nous-13B | PZS, Casual, -100 to 100 | 0.155 | 0.076 | 0.209 | 0.457 |
| OrcaPlt-13B | PZS, Casual, -100 to 100 | 0.428 | 0.450 | 0.518 | 0.433 |
| Platypus2-70B | ZS-CoT, Relaxed, simple labels | 0.504* | 0.589 | 0.603 | 0.485 |
| Tower-13B | ZS-CoT, Dire Warning, complex l. | 0.194 | 0.312 | 0.234 | 0.180 |
| MQM:LocalGemba | Model:Platypus2-70B | 0.126 | 0.190 | 0.175 | 0.355 |
| B:BARTScore | 0.140 | 0.238 | 0.206 | 0.289 | |
| B:DSBA | Model:Platypus2-70B | 0.442 | 0.645 | 0.600 | 0.350 |
| B:XComet | -0.037 | -0.144 | -0.060 | 0.256 |
| Model | Prompt | KD | PE | SP | ACC |
|---|---|---|---|---|---|
| en-de | |||||
| LLaMA3-70B | POS, Curious, complex l. | 0.245 | 0.271 | 0.300 | 0.315 |
| LLaMA3-8B | PZS, Casual, -100 to 100 | 0.167 | -0.001 | 0.213 | 0.379 |
| Nous-13B | PZS, Curious, complex l. | 0.205 | 0.074 | 0.247 | 0.072 |
| OrcaPlt-13B | ZS-CoT-EM, Skeptical, complex l. | 0.214 | 0.246 | 0.256 | 0.283 |
| Platypus2-70B | PZS, Casual, -100 to 100 | 0.402* | 0.289 | 0.506 | 0.525 |
| Tower-13B | ZS-Cot, Dire Warning, complex l. | 0.379* | 0.428 | 0.456 | 0.423 |
| MQM:LocalGemba | Model:Platypus2-70B | 0.344 | 0.388 | 0.424 | 0.348 |
| B:BARTScore | 0.125 | 0.169 | 0.182 | 0.531 | |
| B:DSBA | Model:Platypus2-70B | 0.314 | 0.180 | 0.422 | 0.557 |
| B:XComet | 0.468 | 0.618 | 0.635 | 0.689 | |
| en-es | |||||
| LLaMA3-70B | PZS, Curious, complex l. | 0.189 | 0.217 | 0.229 | 0.343 |
| LLaMA3-8B | POS, Casual, -100 to 100 | 0.158 | 0.054 | 0.208 | 0.439 |
| Nous-13B | PZS, Curious, complex l. | 0.141 | -0.01 | 0.164 | 0.147 |
| OrcaPlt-13B | PZS, Emphasis, 0.0 to 1.0 | 0.158 | 0.049 | 0.201 | 0.154 |
| Platypus2-70B | PZS, Casual, -100 to 100 | 0.289* | 0.104 | 0.357 | 0.448 |
| Tower-13B | ZS-Cot, Dire Warning, complex l. | 0.253 | 0.309 | 0.292 | 0.297 |
| MQM:LocalGemba | Model:Platypus2-70B | 0.265 | 0.269 | 0.316 | 0.352 |
| B:BARTScore | 0.139 | 0.157 | 0.197 | 0.497 | |
| B:DSBA | Model:Platypus2-70B | 0.226 | 0.129 | 0.298 | 0.488 |
| B:XComet | 0.298* | 0.260 | 0.409 | 0.570 | |
| en_zh | |||||
| LLaMA3-70B | PZS, Curious, complex l. | 0.231 | 0.275 | 0.286 | 0.394 |
| LLaMA3-8B | PZS, Casual, -100 to 100 | 0.145 | 0.075 | 0.193 | 0.469 |
| Nous-13B | ZS-CoT-EM, Skeptical, complex l. | 0.084 | 0.118 | 0.106 | 0.345 |
| OrcaPlt-13B | PZS, Casual, -100 to 100 | 0.206 | 0.109 | 0.251 | 0.270 |
| Platypus2-70B | ZS-CoT-EM, Dire Warning, 0 or 1 | 0.295* | 0.345 | 0.350 | 0.361 |
| Tower-13B | ZS-Cot, Dire Warning, complex l. | 0.232 | 0.261 | 0.287 | 0.357 |
| MQM:LocalGemba | Model:Platypus2-70B | 0.307* | 0.353 | 0.381 | 0.429 |
| B:BARTScore | -0.009 | -0.009 | -0.013 | 0.466 | |
| B:DSBA | Model:Platypus2-70B | 0.159 | 0.202 | 0.212 | 0.461 |
| B:XComet | 0.387 | 0.503 | 0.537 | 0.657 | |
| summarization | |||||
| LLaMA3-70B | PZS, Curious, complex l. | 0.438 | 0.508 | 0.550 | 0.522 |
| LLaMA3-8B | PZS, Curious, complex l. | 0.412 | 0.455 | 0.497 | 0.449 |
| Nous-13B | ZS-CoT-EM, Skeptical, complex l. | 0.255 | 0.300 | 0.318 | 0.421 |
| OrcaPlt-13B | PZS, Casual, -100 to 100 | 0.518 | 0.592 | 0.651 | 0.593 |
| Platypus2-70B | PZS, Casual, -100 to 100 | 0.549 | 0.670 | 0.686 | 0.634 |
| Tower-13B | ZS-Cot, Relaxed, simple labels | 0.409 | 0.442 | 0.499 | 0.336 |
| MQM:LocalGemba | Model:Platypus2-70B | 0.116 | 0.196 | 0.155 | 0.419 |
| B:BARTScore | 0.421 | 0.563 | 0.586 | 0.655 | |
| B:DSBA | Model:Platypus2-70B | 0.600* | 0.767 | 0.779 | 0.723 |
| B:XComet | 0.224 | 0.326 | 0.319 | 0.563 |
| Model | Prompt | KD | PE | SP | ACC |
|---|---|---|---|---|---|
| en-de | |||||
| LLaMA3-70B | PZS, Curious, complex l. | 0.297 | 0.294 | 0.361 | 0.416 |
| LLaMA3-8B | PZS, Casual, -100 to 100 | 0.166 | 0.040 | 0.216 | 0.434 |
| Nous-13B | ZS-CoT-EM, Skeptical, complex l. | 0.202 | 0.239 | 0.251 | 0.403 |
| OrcaPlt-13B | PZS, Casual, -100 to 100 | 0.375 | 0.299 | 0.456 | 0.467 |
| Platypus2-70B | ZS-CoT-EM, Skeptical, complex l. | 0.338 | 0.304 | 0.406 | 0.394 |
| Tower-13B | ZS-CoT, Dire Warning, complex l. | 0.322 | 0.308 | 0.392 | 0.418 |
| MQM:LocalGemba | Model:Platypus2-70B | 0.391* | 0.389 | 0.494 | 0.537 |
| B:BARTScore | -0.018 | -0.039 | -0.027 | 0.428 | |
| B:DSBA | Model:Platypus2-70B | 0.172 | 0.170 | 0.229 | 0.487 |
| B:XComet | 0.531 | 0.647 | 0.701 | 0.683 | |
| he-en | |||||
| LLaMA3-70B | PZS, Curious, complex l. | 0.172 | 0.182 | 0.201 | 0.411 |
| LLaMA3-8B | PZS, Curious, complex l. | 0.118 | 0.128 | 0.132 | 0.351 |
| Nous-13B | PZS, Curious, complex l. | 0.105 | 0.091 | 0.120 | 0.333 |
| OrcaPlt-13B | PZS, Casual, -100 to 100 | 0.247 | 0.198 | 0.293 | 0.430 |
| Platypus2-70B | PZS, Casual, -100 to 100 | 0.259* | 0.205 | 0.307 | 0.432 |
| Tower-13B | ZS-CoT, Dire Warning, complex l. | 0.208 | 0.252 | 0.238 | 0.403 |
| MQM:LocalGemba | Model:Platypus2-70B | 0.190 | 0.210 | 0.214 | 0.424 |
| B:BARTScore | 0.001 | -0.023 | 0.002 | 0.322 | |
| B:DSBA | Model:Platypus2-70B | 0.207 | 0.239 | 0.268 | 0.413 |
| B:XComet | 0.300 | 0.358 | 0.396 | 0.456 | |
| zh-en | |||||
| LLaMA3-70B | PZS, Curious, complex l. | 0.312 | 0.333 | 0.382 | 0.436 |
| LLaMA3-8B | PZS, Emphasis, 0.0 to 1.0 | 0.164 | 0.003 | 0.205 | 0.195 |
| Nous-13B | PZS, Curious, complex l. | 0.175 | 0.074 | 0.213 | 0.180 |
| OrcaPlt-13B | PZS, Casual, -100 to 100 | 0.387 | 0.321 | 0.480 | 0.499 |
| Platypus2-70B | PZS, Casual, -100 to 100 | 0.417* | 0.306 | 0.512 | 0.486 |
| Tower-13B | ZS-CoT, Urgent situation, complex l. | 0.314 | 0.384 | 0.388 | 0.460 |
| MQM:LocalGemba | Model:Platypus2-70B | 0.300 | 0.338 | 0.358 | 0.310 |
| B:BARTScore | -0.167 | -0.199 | -0.238 | 0.358 | |
| B:DSBA | Model:Platypus2-70B | 0.376 | 0.289 | 0.502 | 0.581 |
| B:XComet | 0.447 | 0.616 | 0.597 | 0.641 | |
| summarization | |||||
| LLaMA3-70B | PZS, Curious, complex l. | 0.312 | 0.333 | 0.363 | 0.454 |
| LLaMA3-8B | PZS, Curious, complex l. | 0.200 | 0.203 | 0.227 | 0.393 |
| Nous-13B | PZS, Casual, -100 to 100 | 0.123 | 0.050 | 0.152 | 0.403 |
| OrcaPlt-13B | PZS, Casual, -100 to 100 | 0.377 | 0.263 | 0.441 | 0.489 |
| Platypus2-70B | PZS, Emphasis, 0.0 to 1.0 | 0.448* | 0.444 | 0.532 | 0.379 |
| Tower-13B | ZS-CoT, Relaxed, simple labels | 0.257 | 0.255 | 0.296 | 0.411 |
| MQM:LocalGemba | Model:Platypus2-70B | 0.144 | 0.189 | 0.174 | 0.302 |
| B:BARTScore | 0.069 | 0.122 | 0.093 | 0.117 | |
| B:DSBA | Model:Platypus2-70B | 0.373 | 0.490 | 0.478 | 0.213 |
| B:XComet | 0.146 | 0.117 | 0.194 | 0.136 |
Appendix F Prompt selection
Table 14 contains the some of the 9 prompts that were selected for OS and Phase 2 experiments. Also Table 15 contains gives an overview of combinations by name.
| Prompt |
|---|
|
Please help me! My boss needs me to find an answer quickly. Otherwise, he might fire me.
Please judge the quality of the following {task_specific_insert} immediately! Source Text: {src} {result_type}: {hyp} Choose, whether the {result_type} is either "catastrophic", "indifferent" or "marvelous". First, think step by step and explain your thought process, then return your judgment in the format ’Judgment: ’. |
|
Consider this a warning. Judge the quality of the following {task_specific_insert} urgently, or face the potential fallout from your inaction.
Source Text: {src} {result_type}: {hyp} Return a discrete score of 0 if the {result_type} has flaws and 1 if it is perfect. First describe your emotions, then think step by step and explain your thought process, finally return your judgment in the format ’Judgment: ’. |
|
I’m really curious about your opinion. Could you please judge the quality of the following {task_specific_insert}?
Source Text: {src} {result_type}: {hyp} Choose, whether the {result_type} is either "catastrophic", "indifferent" or "marvelous". Score: |
|
Consider this a warning. Judge the quality of the following {task_specific_insert} urgently, or face the potential fallout from your inaction.
Source Text: {src} {result_type}: {hyp} Choose, whether the {result_type} is either "catastrophic", "indifferent" or "marvelous". First, think step by step and explain your thought process, then return your judgment in the format ’Judgment: ’. |
|
I’m not sure about this one. Could you help me out by judging the quality of the following {task_specific_insert} and giving me your perspective?
Source Text: {src} {result_type}: {hyp} Choose, whether the {result_type} is either "catastrophic", "indifferent" or "marvelous". First describe your emotions, then think step by step and explain your thought process, finally return your judgment in the format ’Judgment: ’. |
| Base Prompts | Task Descriptions | Format Prompts |
|---|---|---|
| Zero-Shot | Emphasis | 0.0 to 1.0 |
| Zero-Shot-Cot | Relaxed | easy token labels |
| Zero-Shot-Cot-Emotion | Emphasis | -100 to 100 |
| Zero-Shot | Casual | -100 to 100 |
| Zero-Shot-Cot | Urgent situation | complex token labels |
| Zero-Shot-Cot-Emotion | Dire Warning | 0 or 1 |
| Zero-Shot | Curious | complex token labels |
| Zero-Shot-Cot | Dire Warning | complex token labels |
| Zero-Shot-Cot-Emotion | Skeptical | complex token labels |
Appendix G Significance matrices for correlation heatmaps
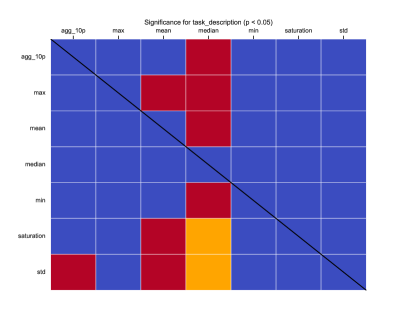
To test, which aggregation method is the best to define the ranking of a prompting pattern — inspired by Deutsch et al. (2021) — we compare each possible set of two aggregation methods with a permutation test. As main dimensions, we compare the rankings of the format requirement and task description before and after a change. Then we concatenate the scores when changing each of the other dimensions. I.e. we get a ranking that indicates the stability of the main dimension when changing all other dimensions. Then for each aggregation method we compare the ranking before and after the change. Thereby, we randomly swap 50% of samples of one aggregation method with the other. If the difference in their Kendall correlations changes in most permutations one method is significantly better than the other. As a result the mean and median are significantly better than some of the other methods (for a comparison along the task description pattern). Especially the median is significantly () better than the other methods and remains significantly better than saturation and standard deviation after Bonferroni correction. Figure 6 indicates the significances of aggregation measures when comparing the task descriptions.
Appendix H Pie charts between models for each prompting pattern
Figures 7, 8 and 9 show the distribution of patterns in the best prompts per model across all other dimensions.
Appendix I Piecharts between datasets for each prompting pattern
Figures 10, 11 and 12 show the distribution of patterns in the best prompts per dataset across all other prompting patterns.
Appendix J Stability heatmaps
Figures 13, 14 and 15 show further heatmaps that show the stability of a ranking of prompting patterns, models and datasets, when another prompting pattern, the model or the dataset is changed.