Accessing a New Population of Supermassive Black Holes with Extensions to the Event Horizon Telescope
Abstract
The Event Horizon Telescope has produced resolved images of the supermassive black holes Sgr A∗ and M87∗, which present the largest shadows on the sky. In the next decade, technological improvements and extensions to the array will enable access to a greater number of sources, unlocking studies of a larger population of supermassive black holes through direct imaging. In this paper, we identify 12 of the most promising sources beyond Sgr A∗ and M87∗ based on their angular size and millimeter flux density. For each of these sources, we make theoretical predictions for their observable properties by ray tracing general relativistic magnetohydrodynamic models appropriately scaled to each target’s mass, distance, and flux density. We predict that these sources would have somewhat higher Eddington ratios than M87∗, which may result in larger optical and Faraday depths than previous EHT targets. Despite this, we find that visibility amplitude size constraints can plausibly recover masses within a factor of 2, although the unknown jet contribution remains a significant uncertainty. We find that the linearly polarized structure evolves substantially with Eddington ratio, with greater evolution at larger inclinations, complicating potential spin inferences for inclined sources. We discuss the importance of 345 GHz observations, milli-Jansky baseline sensitivity, and independent inclination constraints for future observations with upgrades to the Event Horizon Telescope (EHT) through ground updates with the next-generation EHT (ngEHT) program and extensions to space through the Black Hole Explorer (BHEX).
1 Introduction
The Event Horizon Telescope (EHT) collaboration has produced resolved images of two supermassive black holes (SMBHs), M87∗ (Event Horizon Telescope Collaboration et al., 2019a, b, c, d, e, f, 2021a, 2021b; Event Horizon Telescope Collaboration et al., 2023; Event Horizon Telescope Collaboration et al., 2024a) and Sgr A∗ (Event Horizon Telescope Collaboration et al., 2022a, b, c, d, e, f, 2024b, 2024c). This was accomplished using Very Long Baseline Interferometry (VLBI) at a frequency of 230 GHz, which, limited by the size of the Earth, achieved a resolution of approximately 20 as. These images confirmed the existence of a black hole’s apparent shadow and have enabled new tests of gravity and accretion physics.
A number of extensions to the array are planned to produce higher quality images and movies of these two SMBHs, as well as enable demographic studies for a larger population of SMBHs. The next-generation Event Horizon Telescope (ngEHT) project aims to add several new dishes around the world while upgrading many of the existing EHT sites (Doeleman et al., 2023; Johnson et al., 2023). These upgrades would enable simultaneous multi-frequency (86-230-345 GHz) observations, substantially improving the array sensitivity, as well as expanded observing campaigns that will be capable of producing movies that image the accretion disk and jet simultaneously with high dynamic range. Through observations at 345GHz and increased baseline coverage, the ngEHT will greatly improve the angular resolution possible with ground VLBI arrays. Meanwhile, the Black Hole Explorer (BHEX) aims to complement the ground array with an orbiting satellite (Johnson et al., 2024). The higher angular resolution provided by space baselines will enable photon ring detections of M87∗ and potentially also Sgr A∗. Both ngEHT and BHEX will allow access to black hole shadows with smaller angular sizes on the sky.
These array improvements will resolve horizon scale emission for a greater population of sources, enabling demographic studies for the first time. Theoretical studies of the EHT images of both Sgr A∗ and M87∗ favor models with dynamically important magnetic fields (so-called “magnetically arrested disks” or MADs; Bisnovatyi-Kogan & Ruzmaikin, 1974; Igumenshchev et al., 2003; Narayan et al., 2003). MAD models power efficient jets (Tchekhovskoy et al., 2011) via the Blandford & Znajek (1977) (BZ) mechanism, which has important implications for SMBH-galaxy co-evolution. With a larger sample of objects, we can begin to test the universality of this accretion state and investigate trends as a function of SMBH mass, inclination, Eddington ratio, and host galaxy properties. The morphology of the linear polarization has also been proposed as a probe of spin, since synchrotron emission inherits the geometry of the magnetic field, which in turn is affected by frame dragging on event horizon scales (Palumbo et al., 2020; Emami et al., 2023; Ricarte et al., 2022; Chael et al., 2023), although there remain theoretical uncertainties with respect to the electron thermodynamics and Faraday effects. Potential spin constraints with extensions to the EHT could be used to test the Blandford-Znajek mechanism as well as models of SMBH assembly over cosmic time (Ricarte et al., 2023).
By modeling the SMBH mass function and Eddington ratio distribution, Pesce et al. (2021) estimated that the ngEHT could access event horizon scale structure of tens more sources. To identify real candidates, the ongoing Event Horizon and Environs (ETHER) survey has been pursuing millimeter observations of promising sources and assembling a database of multi-frequency observations (Ramakrishnan et al., 2023; Hernández-Yévenes et al., 2024). Pesce et al. (2022) later simulated futuristic array performance and confirmed that the ngEHT could plausibly measure masses (from inferred ring diameters) and spins (from inferred polarized morphology) for tens of sources using geometric modeling. However, it remained to be tested if such inferences would be valid for physical models with realistic Eddington ratios and inclinations.
In this work, using the ETHER database as a starting point, we perform the first in-depth study of 12 of the (currently identified) most promising targets for the EHT as well as its extensions through the ngEHT and BHEX. A similar list was assembled prior to EHT observations in Johannsen et al. (2012), and since then, available data on SMBH mass measurements, their spectral energy distributions, and array specifications have advanced substantially. In section 2, we study the ETHER catalogue and describe these 12 most promising candidate sources. In section 3, we produce a new library of simulated images of these sources from general relativistic fluid and radiative transfer simulations, which we use to infer Eddington ratios and make predictions for demographic science. We discuss and summarize our findings in section 5.
2 Summary of Future Targets
We begin our investigation using the ETHER database, which compiles a large quantity of masses, multi-frequency flux measurements, and host galaxy information for 3.8 million sources (Ramakrishnan et al., 2023; Hernández-Yévenes et al., 2024). Pesce et al. (2022) determined a minimum 230 GHz flux density as a function of angular size required to make mass measurements of optically thin black holes by the ngEHT111Note that for simplicity, we refer to the EHT upgraded as described in section 1 as the ngEHT throughout this paper.. We select sources by hand from ETHER that satisfy this criterion based on currently available data. We note that 230 GHz flux measurements or predictions of ETHER sources with large angular sizes are continually being added to the database, so the ngEHT-observable sample is expected to grow significantly over the upcoming years. The relevant angular size is that of the photon ring, which for a non-spinning black hole, has an angular diameter given by
| (1) |
where is the gravitational constant, is the SMBH mass, is the speed of light, and is the distance to the object. If the SMBH is spinning, the photon ring changes size by only 10% (e.g., Johannsen & Psaltis, 2010; Johnson et al., 2020; Chael et al., 2021).
Most of the mass estimates in this work come from direct gas or stellar dynamical modeling. Note that we only adopt a single value of SMBH mass, distance, and mm flux density for each source, but systematic error dominates the error in these quantities. For most of our sources, there are multiple mass estimates arising from different datasets and different methodologies. For the sources in our sample, the average difference between the maximum and minimum mass estimate is 0.8 dex, and the average standard deviation among different mass estimates for the same object is 0.3 dex.
For each object, we assign a 230 GHz flux density based on available data. These values are used as inputs for our ray-tracing calculations, which are normalized to reproduce the appropriate flux density (see section 3). Only for Sgr A∗ and M87∗ can we utilize estimates of the compact flux density from the EHT. For the rest of our sources, the unknown compact flux fraction is a key systematic uncertainty in our work. For M87∗, the compact flux density is about half the flux density measured by ALMA alone (Event Horizon Telescope Collaboration et al., 2019a). For Sgr A∗, EHT constrains at least 80% of the observed flux to the compact region (Event Horizon Telescope Collaboration et al., 2022c). Lacking available 230 GHz VLBI constraints for the rest of our sources, we assume that 100% of the flux density observed at 230 GHz, by single dish or phased-array observations as described for each source, can be attributed to the compact (non-jet) region modeled by our General Relativistic Magnetohydrodynamics (GRMHD) simulations.222Near the synchrotron emission peak, the emissivity coefficient . Since and , we expect that . Therefore, if our flux densities were over-estimated by a factor of 10, the Eddington ratio would only be over-estimated by a factor of 3. Due to the incompleteness of 230 GHz flux density measurements, we adopted the 345 GHz flux for NGC 4552, the 43 GHz flux for NGC 3998, and the 8.4 GHz flux for NGC 2663, effectively assuming an spectral index of 0. In the future, better estimates of the compact 230 GHz flux will be obtained either directly, by ongoing EHT observation programs, or by SED modeling (see e.g., Bandyopadhyay et al., 2019).
Our sample includes a variety of black hole masses, stellar masses, morphologies, and environments. Below, we summarize some interesting characteristics of these objects, listed in descending projected shadow size. Interestingly, there is overlap between our list and the list of galaxies most likely to emit nHz gravitational waves via SMBH binaries, both of which select for massive and nearby galaxies (Mingarelli et al., 2017). Almost all of these objects have jets from which inclination constraints can potentially be obtained. We reiterate that this is not an exhaustive list of objects observable by ngEHT and/or BHEX, and that it is simply a computationally tractable sample based on currently available data.
-
•
IC 1459 is an elliptical LINER galaxy with symmetric jets (Tingay & Edwards, 2015), located in a loose galaxy group with 8 bright members (Brough et al., 2006). It is a slowly rotating galaxy with a counter-rotating core (Prichard et al., 2019). Its 230 GHz flux, measured at 09 resolution with ALMA, is 217 mJy (Ruffa et al., 2019).
-
•
NGC 4594 (also known as M104, the Sombrero Galaxy) is a LINER galaxy hosting a LLAGN. It is a well-known potential EHT target (Bandyopadhyay et al., 2019; Fish et al., 2020), and also the closest galaxy on this list with a distance of 9.87 Mpc. It is a well-studied AGN with small-scale radio jets (Hada et al., 2013). From the jet-to-counterjet brightness ratio, the jet viewing angle is estimated at (Yan et al., 2024). Its 230 GHz flux at arcsec scales is obtained from the ALMA Calibrator Source Catalogue333https://almascience.nrao.edu/sc/.
-
•
NGC 3998 is a lenticular Seyfert 1 / LINER galaxy hosting a LLAGN, located in the outer areas of the Ursa Major group. Kinematical observations show that NGC 3998 is tidally stripped of dark matter (Boardman et al., 2016). VLBI observations have identified a jet-like structure on the northern side of its nucleus (Filho et al., 2002; Helmboldt et al., 2007), and further observations revealed a kpc-size one-sided jet (Frank et al., 2016). New VLBA 43 GHz imaging (Ramakrishnan et al., in prep.) reveal a flux of 133 mJy at 0.5 mas resolution; given its relatively flat spectrum at mas-scales, we use this value for the 230 GHz flux.
-
•
NGC 4261 is an elliptical FR I LINER galaxy with a LLAGN in the Virgo cluster. It has been targeted numerous times over the years, with a famously resolved disk observed with HST in 1993 (Jaffe et al., 1993). It has a two-sided jet (Haga et al., 2015; Yan et al., 2023), and a nuclear disk of dust roughly perpendicular to the radio jet (Jaffe et al., 1993). Its relatively compact cool core could be classified as a galactic corona (O’Sullivan et al., 2011), a cool core with radii on the scale of a few kiloparsecs. Its 230 GHz flux at 02 resolution is 200-250 mJy (Boizelle et al., 2021).
-
•
NGC 2663 is an elliptical galaxy featuring some of the longest collimated jets known, extending to 355 kpc from one side to the other (Velović et al., 2022). Although its SED is poorly sampled at present, SED modeling suggests that it may be a viable source for resolving Event Horizon structure (Nagar et al. in prep.). Lacking millimeter observations, we adopt its mas-scale 8.4 GHz flux density from the VLBA Calibrator Catalogue of 84 mJy, but note that this may be a significant underestimate.
-
•
NGC 3894 is an elliptical galaxy hosting an LLAGN (Balasubramaniam et al., 2021), with symmetric relativistic parsec-scale jets (Taylor et al., 1998). From VLBA observations between 5 and 15 GHz, a viewing angle of is estimated (Principe et al., 2020). Its 05 mas resolution 43 GHz flux is 60 mJy (Ramakrishnan et al., in prep.). We adopt its 230 GHz 57.6 mJy flux density measured by SCUBA (Antón et al., 2004).
-
•
M84 (NGC 4374) is an elliptical or lenticular galaxy in the Virgo cluster with a compact core and single jet at pc-scales (Nagar et al., 2002), and double FR I type jets at kpc scales (Laing & Bridle, 1987). It is one of few known systems close enough for resolved Chandra observations in the Bondi radius (Bambic et al., 2023). M84 has depressions in emissivity in the Northern and Southern regions of the AGN (Bambic et al., 2023), characteristic of the radio lobes associated with FR I (Fanaroff & Riley, 1974) radio jet activity (Laing & Bridle, 1987). At 230 GHz, linear polarization was not detected by the SMA, suggesting significant Faraday depolarization (Bower et al., 2017). Its 230 GHz flux density was measured at 126 mJy at 09 resolution. Interestingly, its 230 GHz flux density is highly variable (at 5″ scales), in the range 80-225 mJy (Chen et al., 2023).
-
•
NGC 4552 (M89) is an elliptical LINER galaxy, with a compact core and twin jets at pc-scales (Nagar et al., 2002). Although optical observations identified a jet extending 10 arcminutes (Malin, 1979), later observations concluded that the apparent jet may instead be a tidal tail from a galaxy interaction (Clark et al., 1987; Katsiyannis et al., 1998). In recent years, it was observed that M89 is radio-dim (Wójtowicz et al., 2023), raising the possibility of the absence of a jet. Its 230 GHz flux observed (at 5″ scales) by SMA is highly variable: 18–38 mJy (Chen et al., 2023).
-
•
3C 317 is a cD galaxy hosting a LLAGN in the X-ray cooling flow cluster Abell 2052, offering the opportunity to study jet launching in an environment where AGN feedback is less effective than in M87 (Zhao et al., 1993). Unlike the typical FRI galaxies, which are characterized by cores, twin jets and lobes, 3C 317 has an amorphous halo around its bright core (Venturi et al., 2004). It has two opposing jets with twisted morphology (Venturi et al., 2004). The ALMA Calibrator Source Catalogue lists 230 GHz flux densities of 32 to 34 mJy from 2017 to 2019.
-
•
NGC 315 is a giant elliptical FR II galaxy and LLAGN (Tomar et al., 2021) located in the Zwicky cluster. The spectral energy distribution (SED) for this AGN has been measured with a wavelength range from radio to X-ray, and a bolometric luminosity of Lbol erg s-1 and a corresponding Eddington ratio L/LEdd of have been obtained (Gu et al., 2007), similar to our inferred Eddington ratio of from the millimeter flux alone. Its jet has been observed numerous times over the years. Multiband VLBI imaging data are also available (Park et al., 2021). We adopt the 230 GHz flux density of 182 mJy from in the ALMA Calibrator Source Catalogue.
-
•
NGC 1218 (3C 78) is a FR I Seyfert 1 radio galaxy hosting a quasar. A one-sided arcsecond long jet, similar to that of M87 (although smaller in projected length) has been observed at radio and optical frequencies (e.g. Trussoni et al., 1999; Sparks et al., 1995; Saikia et al., 1986). The jet profile is approximately conical on pc to kpc scales, and three compact knots, in addition to the core, were observed (Roychowdhury et al., 2024). It is one of the three galaxies in this sample with high inferred Eddington ratios (i.e on the order of ), L/L. The 230 GHz flux density at 5″ resolution as measured by the IRAM 30m telescope is 110 mJy (Agudo et al., 2014), and the 23″ resolution 350 GHz flux is 278 mJy (Quillen et al., 2003).
-
•
NGC 5077 is an lenticular galaxy with LLAGN and LINER characteristics, the brightest of a small group of 8 galaxies (Sánchez-Portal et al., 2004; Tal et al., 2009). It has a stellar core counter-rotating with respect to its main stellar body, and properties of the misaligned gas suggests a past gas-rich merger (Raimundo, 2021). On arcsec-scales it hosts a flat spectrum radio core at frequences between 1.4 and 15 GHz (Nagar et al., 1999). Its 230 GHz flux density is variable: with values 60–200 mJy at 5″ resolution, over the period 2015-2019 (Chen et al., 2023). We adopt the flux of 68 mJy measured at 285 GHz listed in the ALMA Calibrator Source Catalogue.
=-1.6in
| Potential Horizon-scale Targets for an Enhanced EHT | |||||||||
| Galaxy | Distance [Mpc] | log( [M⊙]) | Mass Type | Galaxy Morphology | Radio Loud /Quiet | mm Flux Density [Jy] | Shadow size [as] n | log(Stellar Mass [M⊙]) m | Inferred [] (This Work) |
| SgrA* | 0.008 a | 6.6 a | Stellar | Spiral | RL | 2.4 b | 54 | 10.8 c | 0.056 |
| M87 | 17 d | 9.8 e | Stellar | Elliptical | RL | 0.50 f | 38 | 11.5 | 0.83 |
| IC 1459 | 29 | 9.4 g | Stellar | Elliptical | RL | 0.22 | 8.9 | 10.8 | 2.4 |
| NGC 4594 | 9.9 | 8.8 g | Stellar | Spiral | RQ | 0.20 | 7.0 | 11.3 | 1.8 |
| NGC 3998 | 14 | 8.9 g | Stellar | Lenticular | RQ | 0.13 | 6.2 | 10.2 | 1.7 |
| NGC 4261 | 31 | 9.2 h | CO | Elliptical | RQ | 0.2 | 5.6 | 10.7 | 4.1 |
| NGC 2663 | 28 | 9.2 i | M- | Elliptical | RL | 0.084 | 5.4 | 11.7 | 1.9 |
| NGC 3894 | 50 | 9.4 j | M- | Elliptical | RL | 0.058 | 5.4 | 10.7 | 1.9 |
| M84 | 19 | 9.0 g | Gas | Elliptical/ Lenticular | RL | 0.13 | 5.2 | 11.4 | 2.4 |
| NGC 4552 | 15 | 8.7 k | Stellar | Elliptical | RL | 0.027 | 3.4 | 10.3 | 1.0 |
| 3C 317 | 140 | 9.7 l | M- | Elliptical | RL | 0.034 | 3.3 | 11.2 | 3.5 |
| NGC 315 | 70 | 9.3 h | CO | Elliptical | RL | 0.18 | 3.1 | 11.2 | 14 |
| NGC 1218 | 120 | 9.5 j | M- | Lenticular | RL | 0.11 | 3.0 | 11.1 | 12 |
| NGC 5077 | 39 | 8.9 g | Gas | Lenticular | RL | 0.068 | 2.3 | 10.8 | 6.3 |
- a
-
b
From Event Horizon Telescope Collaboration et al. (2022c)
-
c
From Licquia & Newman (2015)
- d
- e
-
f
From Event Horizon Telescope Collaboration et al. (2019d).
-
g
From the compilation in Gültekin et al. (2019).
-
h
From Boizelle et al. (2021).
- i
- j
-
k
From SINFONI black hole survey (Saglia et al., 2016).
-
l
Mezcua et al. (2018) study of brightest cluster galaxies (BCGs).
-
m
All stellar masses are based on WISE photometry and taken from Hernández-Yévenes et al. (2024).
-
n
Computed analytically from and distance using Equation (1).
-
o
https://astrogeo.org/rfc/
-
p
The NASA/IPAC Extragalactic Database (NED) is funded by the National Aeronautics and Space Administration and operated by the California Institute of Technology
Several key properties of our sources are summarized in Table 1. While most reside in elliptical galaxies, several of them exhibit lenticular morphologies and one of them is a spiral. These galaxies are also located in a range of intergalactic environments: 3C 317 is a BCG, NGC 315, NGC 4261, and M84 are located within clusters, while IC 1459 is in a loose galaxy group. We provide radio-loud (RL) vs. radio-quiet (RQ) classifications using the definition of Wang et al. (2024), who propose a division between the populations at , where is the flux measured in the 5 GHz band, and is the hard X-ray flux. Our sample contains both types of objects, and it will be very interesting to test accretion models as a function of radio-loudness on event horizon scales. The most promising candidates are those with large black hole shadow size and mm flux density. Excluding Sgr A∗ and M87∗ which were observed by EHT, they are IC 1459, NGC 4594, and NGC 4261.
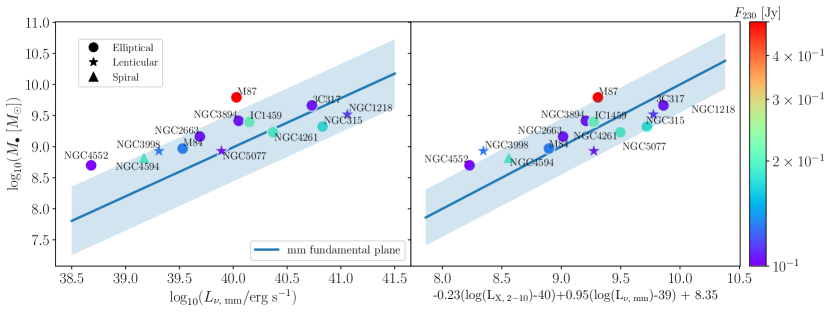
The recently reported “mm fundamental plane of accretion” offers a sanity check for our flux density values (Ruffa et al., 2024). This is an empirical correlation between the nuclear 1 mm luminosity (), the intrinsic 2-10 keV X-ray luminosity (), and the SMBH mass (), given by:
also significantly correlates solely with , although the correlation is tighter when is included:
Figure 1 shows that our sources444Sgr A∗ has much lower mass, higher flux density, and lower Eddington ratio compared to the rest of our objects. Since it is an outlier and its status as an EHT target is well-established, it is omitted from most of our figures. are consistent with the mm fundamental plane. The left panel shows the correlation between and and the right panel shows the correlation between , , and . All values are taken from González-Martín et al. (2009), with the exception of NGC 5077, taken from Gültekin et al. (2012) and 3C 317, taken from Mezcua et al. (2018). For NGC 2663, NGC 3894, and NGC 1218, is currently unavailable in literature. Our sources are broadly consistent with this relation, but may be biased mildly towards larger masses at the low-luminosity end, which would predict larger shadow sizes.
3 Generating Model Images with GRMHD
Given a mass, distance, and 230 GHz flux density, we generate astrophysical model images from SMBH accretion disk simulations (following, the Patoka pipeline Wong et al., 2022). We start with the MAD GRMHD simulations of Narayan et al. (2022), performed using the code koral (Sądowski et al., 2013, 2014), ray-traced for snapshots over the time range . Using these GRMHD snapshots, we perform General Relativistic Ray-Tracing (GRRT) using the code ipole (Mościbrodzka & Gammie, 2018), frequently utilized in EHT theoretical studies (Event Horizon Telescope Collaboration et al., 2021b, 2022e; Event Horizon Telescope Collaboration et al., 2023; Event Horizon Telescope Collaboration et al., 2024c). This code evolves all four Stokes parameters in a general relativistic framework, allowing us to compute images of both linear and circular polarization.
Because the mean free path of particles is much larger than the size of the system, ions and electrons are not believed to be in thermal equilibrium. Consequently, the ion-to-electron temperature ratio as a function of plasma conditions is a major uncertainty (Shapiro et al., 1976; Rees et al., 1982; Narayan & Yi, 1995). In this work, electron temperatures are assigned in post-processing assuming the phenomenological prescription of Mościbrodzka et al. (2016). That is,
| (2) |
where and . This prescription assigns an asymptotic temperature ratio of (often taken to be 1) to highly magnetized (low-) regions, and a temperature ratio of (usually varied between 1 and 160) to weakly magnetized (high-) regions. This is in qualitative agreement with simulations that evolve separate ion and electron temperatures explicitly, although this remains an active area of research (Ressler et al., 2015; Sądowski et al., 2017; Ryan et al., 2018; Chael et al., 2019; Dihingia et al., 2023).
Since GRMHD simulations are scale free, we use the exact same GRMHD fluid snapshots to produce images for each of our objects. For each source, the SMBH mass sets the length and time scales, the distance sets the angular size scale, and the 230 GHz flux density fixes the “mass unit” of the fluid. Following the procedure described in Qiu et al. (2023), we fit a slowly increasing555Slowly increasing with time acts to counteract the draining and relaxation of the torus, which would otherwise result in a systematic decline in the flux density as the simulation proceeds. , rescaling the density, internal energy, and magnetic field of the plasma to achieve the average 230 GHz flux density listed in Table 1.
Compared with other GRMHD model libraries (e.g., Event Horizon Telescope Collaboration et al., 2019e), we significantly limit the scope of our parameter space to enable us to model a variety of sources. All models have dimensionless spin parameter , , , a magnetic field polarity aligned with the disk angular momentum, and only two different inclinations. One set of images is computed with a viewing angle of , which may be appropriate for the typical SMBH, while another set is computed with , appropriate for M87∗. We include only MAD models, since they are preferred over their SANE counterparts by EHT studies of Sgr A∗ and M87∗ (Event Horizon Telescope Collaboration et al., 2021b, 2022e; Event Horizon Telescope Collaboration et al., 2023; Event Horizon Telescope Collaboration et al., 2024c). While this moderate value of is broadly consistent with simulations which evolve ion and electron temperatures explicitly, we note that it is lower than the values preferred when comparing Sgr A∗ and M87∗ models to EHT observations (Event Horizon Telescope Collaboration et al., 2023; Event Horizon Telescope Collaboration et al., 2024c). Finally, we model only thermal electron distribution functions. As a consequence, our models contain very little emission from their jets, which are expected to be dominated by non-thermal electrons (e.g., Fromm et al., 2022). We also neglect radiative transfer from cells with , where GRMHD floors may inject artificial material into the simulations. These assumptions are discussed in section 5.
4 Results
4.1 Higher Eddington Ratios
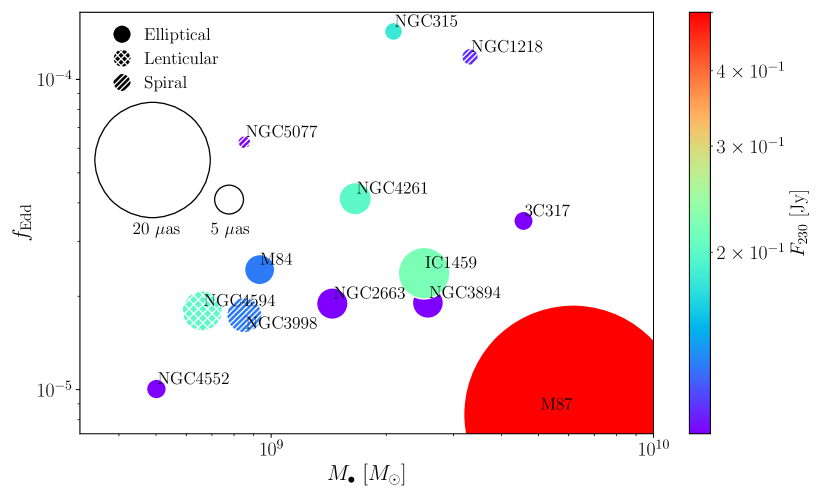
Fitting for for each source during ray-tracing gives us a model-dependent estimate of the Eddington ratio based on the 230 GHz flux density. These are listed in Table 1 and plotted as a function of in Figure 2. We predict larger Eddington ratios for all of our sources than for both M87∗ and Sgr A∗, reaching up to in the most extreme case of NGC 315. This is a selection effect, since more distant sources need to have larger accretion rates to achieve a given flux density and become detectable.
We caution that uncharacterized systematic errors dominate the error budget of our Eddington ratios on both the observational side (mass, distance, flux density, and compact flux fraction) and the theoretical side (MAD accretion, , ). An Eddington ratio estimate based solely on 230 GHz -fitting is likely only accurate to within an order of magnitude (see e.g., Figure 13 of Event Horizon Telescope Collaboration et al., 2021b). Nevertheless, our findings suggest that extensions to the EHT will enable imaging of sources in a previously unexplored regime of Eddington ratio: up to compared to and inferred for M87∗ and Sgr A∗ respectively. In this regime, radiative cooling effects (neglected in our simulations) will become more important, potentially lowering the temperature in the disk (e.g., Ryan et al., 2018; Chael et al., 2019; Yao et al., 2021; Dihingia et al., 2023).
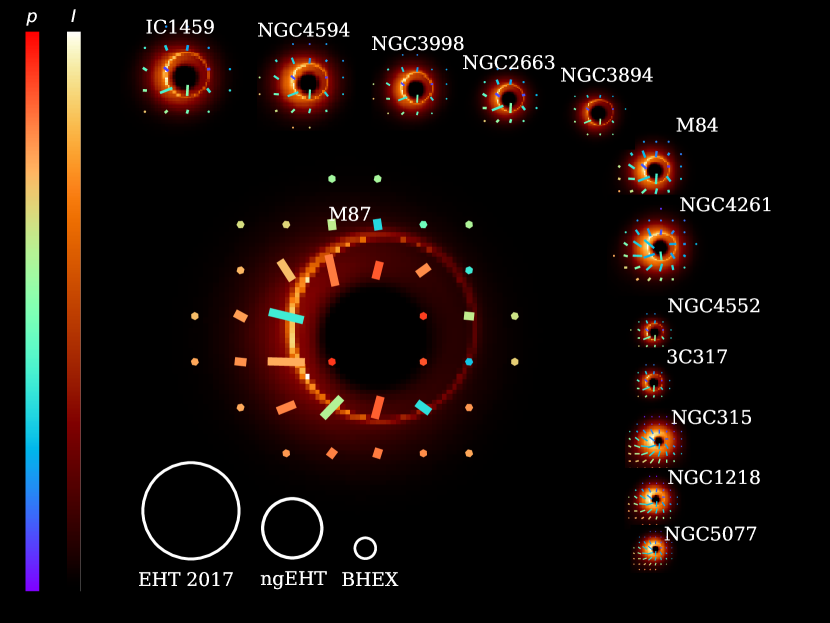
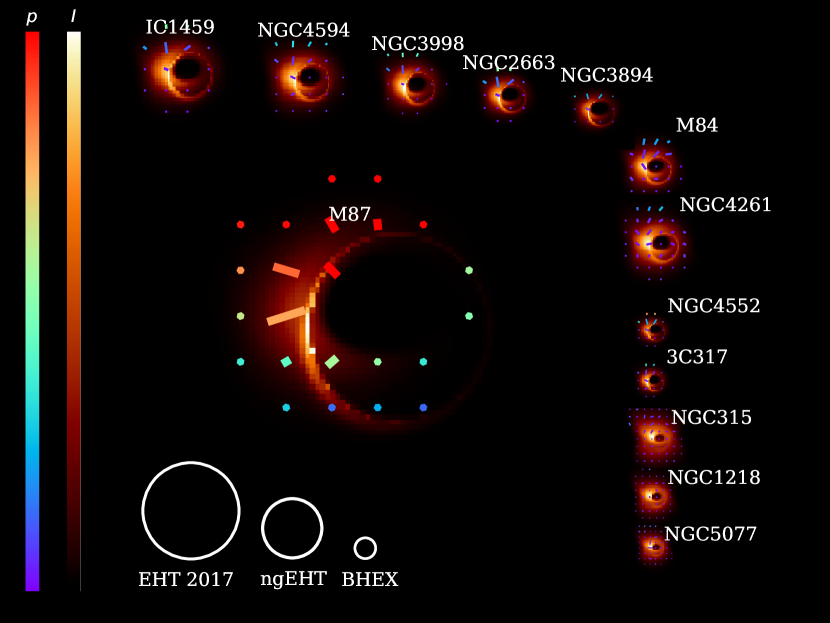
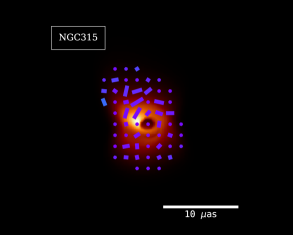
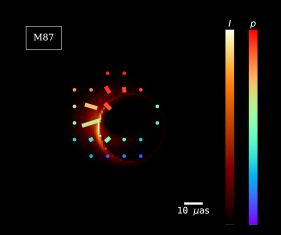
We plot time-averaged polarized images for each simulation set of our sources at and , in Figure 3 and Figure 4 respectively. All SMBH angular sizes are plotted to scale and the total intensity maps are scaled individually to the maximum specific intensity in each image. Recall, however, that sources may be up to an order of magnitude fainter than M87∗ (Table 1). Linear polarization is depicted with ticks whose lengths scale with the total amount of polarization () and whose colors scale with the fractional polarization () up to 70%. In the bottom left, we plot the beam sizes of several VLBI experiments: the current EHT 2017 array at 230 GHz (), the ngEHT at 345 GHz (), and BHEX () for comparison.
All of these sources are expected to subtend significantly smaller angles than M87∗, with shadow diameters in fact smaller than the nominal beam size of the present EHT. This implies that super-resolution and modeling techniques will be crucial for inferring horizon scale structure of these sources (e.g., Pesce et al., 2022). By eye, our images appear well-described by a polarized ring. However, the images may bear additional structures. More edge-on models appear to exhibit more source-dependent structural variation than more face-on models, implying that a modeling approach may not only need to support non-ring structures, but also contain sufficient flexibility to describe potentially qualitatively different source morphologies. In addition, the polarization in these more edge-on images is more asymmetric and suppressed overall. Some models (e.g., IC 1459∗), exhibit an offset between the total intensity and linearly polarized emission (discussed in Tsunetoe et al., 2022, and below). Because of these inclination-based effects, independent jet-based inclination constraints will be very important for interpreting VLBI observations of these sources.
The larger Eddington ratios in our sample explain the salient qualitative differences in image morphologies. We highlight the differences between our models of M87∗ and NGC 315 in Figure 5, where each is plotted at inclination. Larger inferred Eddington ratios result in visibly more extended and optically thick emission for the models of our other sources than for those of M87∗. However, the photon ring remains clearly visible in most images, while the flux depression due to the “inner shadow” (Chael et al., 2021) is visible in all of them.
 |
 |
We can quantify the effects of optical and Faraday depth. For a single pixel, the optical depth and Faraday depth are each given by
and
Here, is the opacity, is the Faraday rotation coefficient (e.g., Jones & Hardee, 1979), and is the affine parameter describing the geodesic. Averaging over the entire image and weighting by the total intensity of each image pixel,
and similarly
We plot the image-averaged optical depth and Faraday depth of our models as a function of in Figure 6. Values larger than unity are achieved by most models for both quantities. On the top row we plot (more inclined) models, and on the bottom row we plot (less inclined) models.
Faraday rotation is the dominant mechanism by which our GRMHD models are scrambled and depolarized (Mościbrodzka et al., 2017; Jiménez-Rosales & Dexter, 2018; Ricarte et al., 2020; Event Horizon Telescope Collaboration et al., 2021b), and these results suggest that these effects may be more significant for this sample. Both and are noticeably larger for the more inclined models. In the case of , when a model is more inclined, more of the colder and denser midplane intercepts our line-of-sight, increasing the Faraday rotation depth (Ricarte et al., 2020; Event Horizon Telescope Collaboration et al., 2024c).
Our models roughly adhere to and , plotted as dashed lines for reference. We expect because the Faraday rotation coefficient (Gardner & Whiteoak, 1966), is the electron number density and is the magnetic field strength. In our GRMHD models, , where , and . Therefore, . For an isolated blob of emitting gas, one would expect (e.g., Leung et al., 2011), leading to . We find a shallower slope however, likely because increasing the Eddington ratio introduces new optically thin emission in addition to making previously emitting regions more optically thick.
4.2 Predictions for Polarized Structure
Since and increase with Eddington ratio in our models, we anticipate quantitative changes in the polarimetric observables they produce. We compute and , the image-average linear and circular polarization fractions on resolved scales, weighted by the total intensity of each pixel:
Note that these resolved values depend on the imaging resolution (beam size). For our calculations, we report values where images are blurred with a Gaussian kernel with a FWHM equal to , where is the distance, is the mass, and values with the subscript correspond to M87 values. This is done to ensure that these values are computed at comparable scales (in gravitational units) for all objects.
EVPA angles around the emission ring typically follows an azimuthal pattern, and we quantify this pattern following the approach of Palumbo et al. (2020). For an image with complex linear polarization , the azimuthal modes have complex coefficients given by
Here, is the Stokes I flux density inside the annulus with radii and . We set and large enough to cover the entire image. We are particularly interested in the coefficient since it gives an image-averaged measurement of EVPA rotational symmetry (Palumbo et al., 2020).
We plot these quantities as a function of Eddington ratio in Figure 7, for in the left column and in the right column. As the Eddington ratio increases, larger optical and Faraday depths result in a downward trend in at . However, the linear polarization plateaus around % for . We find that, especially for more face-on inclinations, much of the polarized emission comes from the forward-jet and travels through an evacuated funnel region, unaffected by the large Faraday depth behind it. We do not find a clear trend of as a function of Eddington ratio. It is driven by intrinsic emission, Faraday rotation, Faraday conversion, as well as optical depth, each of which scale differently with Eddington ratio; simple evolution as a function of was unlikely (e.g., Mościbrodzka et al., 2021; Ricarte et al., 2021; Event Horizon Telescope Collaboration et al., 2023).
We are particularly interested in the evolution of as a function of . Numerous studies of this quantity have demonstrated its sensitivity to the underlying magnetic field geometry, which in turn is affected by the SMBH spin via frame dragging (Palumbo et al., 2020; Ricarte et al., 2022; Emami et al., 2023; Qiu et al., 2023; Chael et al., 2023). With our conventions, implies counterclockwise rotation, consistent with the underlying accretion flow. For , we find a dramatic evolution of as a function of , even flipping sign. That is, the sign of does not simply encode the flow direction for substantially inclined sources. The rapidity of this evolution is striking, considering that the underlying GRMHD snapshots and temperature prescriptions are exactly identical: the same fluid has been only rescaled to different masses and Eddington ratios.
Revisiting Figure 4 and Figure 6, the reasons for this effect can be understood. Models with higher Eddington ratio have larger optical depth. Thus, the emission region changes, and the polarization would therefore sample the magnetic field at a different location. Models with higher Eddington ratio also have larger Faraday rotation depths, and this affects the image asymmetrically. Polarization on the bottom of our image, which passes through the Faraday thick midplane, is suppressed. For both of these reasons, the region producing the polarization is not necessarily the same region producing the total intensity.
This result motivates caution when interpreting inferred from these sources, especially when lacking the spatial resolution to measure the offset of the linear polarization with respect to the total intensity. On the other hand, for , the evolution of with is less severe. From Figure 3, we can see that this is because the polarization continues to follow the total intensity, even at the largest Eddington ratios, due to the Faraday thin evacuated jet funnel. This implies that may be more easily interpretable for more face-on targets. Note that the range in spanned by our models corresponds to an EVPA shift of . This is comparable to the precision with which can even be measured in practice (Event Horizon Telescope Collaboration et al., 2021a, 2024b). Fortunately, most of the sources in our sample have jets from which the inclination angle can in principle be independently constrained.
4.3 Detectability with VLBI
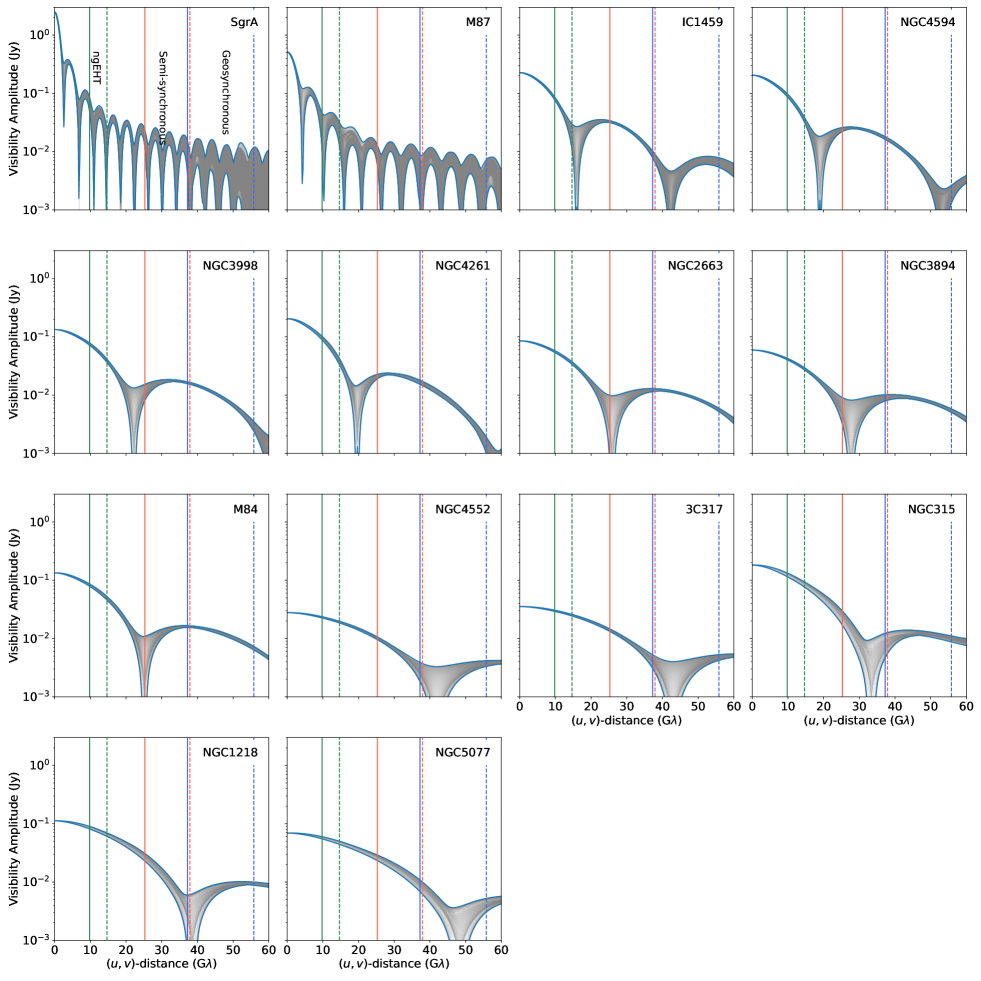
At present, VLBI observations of M87∗ and Sgr A∗ at 230 GHz contain baselines with a maximum (u,v) distance of approximately 8 G, with a sensitivity of approximately Jy on only the most sensitive baselines (Event Horizon Telescope Collaboration et al., 2024a). By increasing the number of stations, increasing their recording bandwidths, and increasing the frequency of observation to 345 GHz, continued developments of the ground-based array are expected to achieve 15 G where is the diameter of the Earth) (Johnson et al., 2023). To reach yet higher resolution, extensions of the array into space are necessary to achieve longer baselines. BHEX aims to augment the ground-based array with a single orbiter in semi-synchronous orbit (Johnson et al., 2024). Additional stations in space are being considered to further improve the (u,v)-coverage. (Kudriashov et al., 2021; Roelofs et al., 2021; Shlentsova et al., 2024).
Using our 345 GHz image models at , we assess the capability of extensions of the array to measure properties of our sources. By Fourier transforming our time-averaged images, we visualize the visibility amplitudes of each source in Figure 8. The vertical lines in both images mark the maximum (u,v) distance accessible to EHT/ngEHT, an array including a semi-synchronous satellite, and an array including a geosynchronous satellite. Scales accessible at 230 GHz and 345 GHz are shown with solid and dashed lines respectively. Note that these lines demarcate only spatial resolution without considering sensitivity requirements, which may be the limiting factor for observing some of these sources with ground-space baselines.
For none of our new sources is the first minimum directly accessible from the ground. This underscores the necessity of model-fitting for studying SMBH demographics with the ngEHT (Pesce et al., 2022). Assuming sufficient baseline sensitivity, the addition of a semi-synchronous satellite operating at 345 GHz would allow direct access to the first null for 8 of these sources, while a geosynchronous satellite allows access to all 12.
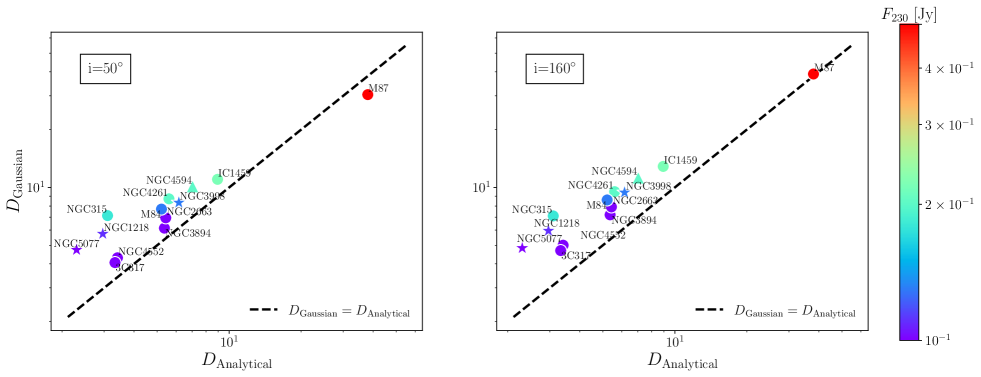
However, with precise enough measurements, it is possible to constrain the sizes of our sources with a solely ground-based array by extrapolating the falloff of the visibility amplitudes on short baselines as a function of distance (Issaoun et al., 2019). We find that simple Gaussian size constraints recover accurate source sizes to within a factor of two. To demonstrate this, we perform Gaussian fits in visibility space666Using the function “fit_gauss_empirical” in eht-imaging (Chael et al., 2022). on the time-averaged total intensity images of our sources at 230 GHz. Note that noise and realistic uv-sampling are neglected and will be explored in future work. The results are shown in Figure 9, where is the mean of the short and long axis FWHM values, and is the photon ring diameter from Equation 1. is systematically greater than by a factor of 40% on average. Overestimation is expected, since the emission is clearly of larger angular extent than the photon ring (Figure 3 and Figure 4), motivating GRMHD-based calibration as in previous works to more accurately estimate SMBH masses from ring sizes (Event Horizon Telescope Collaboration et al., 2019f, 2022f). This level of precision is competitive with even direct dynamical mass measurements: recall that the different dynamical mass measurements of our sources in the literature vary by 0.3 dex on average. Geometric ring model fitting is likely to perform even better (Pesce et al., 2022). Note, however, that extended jet emission that is not included in these models may affect these measurements, which should be investigated in future work. This may manifest as an offset or more rapidly declining component at the shortest baselines in (u,v)-space as observed for M87∗ (see Figure 2 of Event Horizon Telescope Collaboration et al., 2019a).
5 Discussion and Conclusions
The EHT has successfully imaged two supermassive black holes, and extensions to the array including ngEHT and BHEX aim to measure horizon-scale image properties for dozens more. In this work, we introduced and explored 12 of the next-most-promising sources for millimeter VLBI observations based on their millimeter flux density and shadow size. We performed GRRT to produce model images correctly scaled to the masses, distances, and 230 GHz flux densities of these objects. We then used these simulated images to forecast population-level trends. Our main results are as follows:
-
•
Future targets span a variety of host morphologies, and most, but not all, have known jets. This will allow us to study how jets are launched in a variety of environments.
-
•
We predict that future targets will typically have larger Eddington ratios (up to ) than either Sgr A∗ or M87∗, probing accretion and jet launching in a new regime. As Eddington ratio increases, so too does optical and Faraday rotation depth. As a result, we expect lower polarization fractions in higher Eddington ratio sources.
-
•
We modeled two different inclinations, similar to M87∗, and which may be more representative of the population as a whole. Evolution in the image as a function of Eddington ratio is less pronounced for face-on viewing angles.
-
•
For a fixed spin value, the morphology of the linear polarization (particularly ) evolves strongly with Eddington ratio for , but more weakly for . Inclination constraints will therefore be important for interpreting sparsely sampled and marginally resolved polarization structure for these sources.
-
•
By measuring the fall-off of the visibility amplitude as a function of (u,v)-distance, source sizes can be obtained for all of our sources using models with realistic optical depths, and even greater accuracy is expected from geometric model fitting (Pesce et al., 2022). From these analyses, mass measurements can be obtained for all sample sources from the ground with an accuracy that will typically exceed that of independent stellar or gas dynamical mass measurements (see e.g., Simon et al., 2024). For higher resolution imaging, which would be important if the underlying morphology is complex, extension of the EHT into space will be essential, provided such long baselines can achieve the necessary sensitivity.
The heterogeneity of these targets will allow us to probe the parameter space related to accretion and jet launching in several new ways. Compared to M87∗, these objects all have lower SMBH masses, lower galaxy stellar masses, and a variety of galaxy morphologies and environments. The greater variety of Eddington ratios and inclinations than provided solely by M87∗ and Sgr A∗ should enable us constrain the three-dimensional structure of the accretion disk as a function of Eddington ratio. Of particular interest will be the horizon scale polarization of more highly inclined targets, since EHT studies prefer for Sgr A∗ (Event Horizon Telescope Collaboration et al., 2022e, 2024c), and M87∗ jet studies constrain (Walker et al., 2018). At larger inclinations, models become more sensitive to Faraday rotation originating from otherwise invisible electrons, typically in the cold and dense mid-plane. Models predict an asymmetry in the linearly polarized image owing to Faraday depolarization that should be tested observationally (Ricarte et al., 2020; Qiu et al., 2023; Event Horizon Telescope Collaboration et al., 2024c).
While we highlight qualitative inferences based on GRMHD models, we caution that they are limited in numerous important ways, which we summarize here:
-
•
Electron Thermodynamics: Ideal GRMHD simulations neglect radiative heating and cooling by construction. While this is justifiable for very low Eddington ratio systems like Sgr A∗ and to a lesser extent M87∗, the larger Eddington ratios inferred for these objects motivate additional radiative simulations (e.g., Ryan et al., 2018; Chael et al., 2019; Yao et al., 2021; Dihingia et al., 2023). Our simulations also lack non-thermal electron distributions and emission from regions, and as a result, our images lack a significant jet component (Davelaar et al., 2019; Chatterjee et al., 2021; Emami et al., 2021; Cruz-Osorio et al., 2022; Fromm et al., 2022). As a spot-check, we refit and inferred Eddington ratios with non-thermal electron distribution functions instead of thermal, and found that that our Eddington ratios decreased to 37% of their original values on average.
-
•
Compact Flux: In the case of M87∗, the compact flux density associated with the accretion flow is only believed to be about 40% of the value obtained by ALMA (Event Horizon Telescope Collaboration et al., 2019d). Recall that we attribute all of the flux densities measured at the closest frequency to 230 GHz to the inner accretion flow. As a spot check, we also refit and inferred Eddington ratios assuming that only either 50% or 10% of the total flux density should be attributed to the compact component which we simulate. In these cases, the Eddington ratios decreased to 63% and 23% of their original values on average. This shallow dependence of Eddington ratio of compact flux density is expected, following the scalings described in subsection 4.1.
-
•
Parameter Limitations: We have restricted our work to MAD simulations with and . While MAD simulations fare best for EHT studies of Sgr A∗ and M87∗, the generality of this accretion state is an open area of research. It will be interesting to see how well MAD models can represent the radio-quiet sources on our list. We expect that more weakly magnetized models will be even more Faraday thick and have stronger jet emission relative to their disk emission (e.g., Event Horizon Telescope Collaboration et al., 2019e, 2021b). In such models, linear polarization structures like would likely evolve even more strongly than in Figure 7. The same holds for larger values of and , which would cool the model by construction and require larger accretion rates to match the 230 GHz flux densities. We do not expect qualitative changes in our results for models with different spin values, although the jet power will be strongly affected (e.g., Tchekhovskoy et al., 2011; Narayan et al., 2022).
Although horizon scale structure will be accessible for each of these sources, they will for the most part only be modestly resolved, even for baselines to space. This will make other sources of information important for interpreting VLBI data. For example, Pesce et al. (2022) used fits to geometric models of polarized rings, where mass and spin could be measured from the ring diameter and polarization structure respectively, to show that the ngEHT could realistically recover masses and spins for tens of sources from the ground. Our work reveals additional theoretical complications with respect to the inference of spin from the ring polarization structure in black hole images. We find that for our models, is not the dominant polarization mode due to optical and Faraday depth effects. While mass inferences will not be affected by this, spin inferences may only be trustworthy for images where for all . This likely necessitates (e.g., Qiu et al., 2023), which could be determined by e.g., jet inclination measurements.
Observing the sources described in this paper, and more, will allow studies of black hole demographics over a more expansive sample of masses, Eddington ratios, inclinations, and spins than currently accessible to the EHT. Imaging these sources should drive improvements in GRMHD simulations to better reproduce higher Eddington ratio sources, where radiative effects should become more important. In future work, refined algorithms to estimate mass and spin will be tested on the more realistic (and optically and Faraday thick) models computed in this work, as well as simulations that include the missing physical processes described above.
6 Acknowledgements
We thank George N. Wong for valuable feedback on the draft as well as Razieh Emami for useful discussions. This work was supported in part by the Black Hole Initiative at Harvard University, made possible through the support of grants from the Gordon and Betty Moore Foundation and the John Templeton Foundation. The opinions expressed in this publication are those of the author(s) and do not necessarily reflect the views of the Moore or Templeton Foundations. This work was also supported by the National Science Foundation (AST-2307887, AST-1935980, and AST-2034306), the Brinson Foundation, and the Gordon and Betty Moore Foundation (GBMF10423). We acknowledge funding from ANID Chile via Nucleo Milenio TITANs (NCN2023002), Fondecyt Regular (1221421) and Basal (FB210003).
This research has made use of data obtained from the Chandra Source Catalog, provided by the Chandra X-ray Center (CXC) as part of the Chandra Data Archive. This research has made use of the NASA/IPAC Extragalactic Database (NED), which is funded by the National Aeronautics and Space Administration and operated by the California Institute of Technology.
.
References
- Agudo et al. (2014) Agudo, I., Thum, C., Gómez, J. L., & Wiesemeyer, H. 2014, A&A, 566, A59, doi: 10.1051/0004-6361/201423366
- Antón et al. (2004) Antón, S., Browne, I. W. A., Marchã, M. J. M., Bondi, M., & Polatidis, A. 2004, MNRAS, 352, 673, doi: 10.1111/j.1365-2966.2004.07961.x
- Astropy Collaboration et al. (2013) Astropy Collaboration, Robitaille, T. P., Tollerud, E. J., et al. 2013, A&A, 558, A33, doi: 10.1051/0004-6361/201322068
- Astropy Collaboration et al. (2018) Astropy Collaboration, Price-Whelan, A. M., Sipőcz, B. M., et al. 2018, AJ, 156, 123, doi: 10.3847/1538-3881/aabc4f
- Balasubramaniam et al. (2021) Balasubramaniam, K., Stawarz, Ł., Cheung, C. C., et al. 2021, ApJ, 922, 84, doi: 10.3847/1538-4357/ac1ff5
- Bambic et al. (2023) Bambic, C. J., Russell, H. R., Reynolds, C. S., et al. 2023, MNRAS, 522, 4374, doi: 10.1093/mnras/stad824
- Bandyopadhyay et al. (2019) Bandyopadhyay, B., Xie, F.-G., Nagar, N. M., et al. 2019, MNRAS, 490, 4606, doi: 10.1093/mnras/stz2874
- Bird et al. (2010) Bird, S., Harris, W. E., Blakeslee, J. P., & Flynn, C. 2010, A&A, 524, A71, doi: 10.1051/0004-6361/201014876
- Bisnovatyi-Kogan & Ruzmaikin (1974) Bisnovatyi-Kogan, G. S., & Ruzmaikin, A. A. 1974, Ap&SS, 28, 45, doi: 10.1007/BF00642237
- Blakeslee et al. (2009) Blakeslee, J. P., Jordán, A., Mei, S., et al. 2009, ApJ, 694, 556, doi: 10.1088/0004-637X/694/1/556
- Blandford & Znajek (1977) Blandford, R. D., & Znajek, R. L. 1977, MNRAS, 179, 433, doi: 10.1093/mnras/179.3.433
- Boardman et al. (2016) Boardman, N. F., Weijmans, A.-M., van den Bosch, R., et al. 2016, MNRAS, 460, 3029, doi: 10.1093/mnras/stw1187
- Boizelle et al. (2021) Boizelle, B. D., Walsh, J. L., Barth, A. J., et al. 2021, ApJ, 908, 19, doi: 10.3847/1538-4357/abd24d
- Bower et al. (2017) Bower, G. C., Dexter, J., Markoff, S., Rao, R., & Plambeck, R. L. 2017, ApJ, 843, L31, doi: 10.3847/2041-8213/aa7b2e
- Brough et al. (2006) Brough, S., Forbes, D. A., Kilborn, V. A., & Couch, W. 2006, MNRAS, 370, 1223, doi: 10.1111/j.1365-2966.2006.10542.x
- Cantiello et al. (2018) Cantiello, M., Blakeslee, J. P., Ferrarese, L., et al. 2018, ApJ, 856, 126, doi: 10.3847/1538-4357/aab043
- Chael et al. (2021) Chael, A., Johnson, M. D., & Lupsasca, A. 2021, ApJ, 918, 6, doi: 10.3847/1538-4357/ac09ee
- Chael et al. (2023) Chael, A., Lupsasca, A., Wong, G. N., & Quataert, E. 2023, ApJ, 958, 65, doi: 10.3847/1538-4357/acf92d
- Chael et al. (2019) Chael, A., Narayan, R., & Johnson, M. D. 2019, MNRAS, 486, 2873, doi: 10.1093/mnras/stz988
- Chael et al. (2022) Chael, A., Chan, C.-K., Klbouman, et al. 2022, achael/eht-imaging: v1.2.4, v1.2.4, Zenodo, doi: 10.5281/zenodo.6519440
- Chatterjee et al. (2021) Chatterjee, K., Markoff, S., Neilsen, J., et al. 2021, MNRAS, 507, 5281, doi: 10.1093/mnras/stab2466
- Chen et al. (2023) Chen, B.-Y., Bower, G. C., Dexter, J., et al. 2023, ApJ, 951, 93, doi: 10.3847/1538-4357/acd250
- Clark et al. (1987) Clark, G., Plucinsky, P., & Ricker, G. 1987, in Structure and Dynamics of Elliptical Galaxies, ed. P. T. de Zeeuw, Vol. 127, 453–454, doi: 10.1007/978-94-009-3971-4_69
- Cruz-Osorio et al. (2022) Cruz-Osorio, A., Fromm, C. M., Mizuno, Y., et al. 2022, Nature Astronomy, 6, 103, doi: 10.1038/s41550-021-01506-w
- Davelaar et al. (2019) Davelaar, J., Olivares, H., Porth, O., et al. 2019, A&A, 632, A2, doi: 10.1051/0004-6361/201936150
- Dihingia et al. (2023) Dihingia, I. K., Mizuno, Y., Fromm, C. M., & Rezzolla, L. 2023, MNRAS, 518, 405, doi: 10.1093/mnras/stac3165
- Do et al. (2019) Do, T., Hees, A., Ghez, A., et al. 2019, Science, 365, 664, doi: 10.1126/science.aav8137
- Doeleman et al. (2023) Doeleman, S. S., Barrett, J., Blackburn, L., et al. 2023, Galaxies, 11, 107, doi: 10.3390/galaxies11050107
- Emami et al. (2021) Emami, R., Anantua, R., Chael, A. A., & Loeb, A. 2021, ApJ, 923, 272, doi: 10.3847/1538-4357/ac2950
- Emami et al. (2023) Emami, R., Ricarte, A., Wong, G. N., et al. 2023, ApJ, 950, 38, doi: 10.3847/1538-4357/acc8cd
- Evans et al. (2010) Evans, I. N., Primini, F. A., Glotfelty, K. J., et al. 2010, ApJS, 189, 37, doi: 10.1088/0067-0049/189/1/37
- Event Horizon Telescope Collaboration et al. (2019a) Event Horizon Telescope Collaboration, Akiyama, K., Alberdi, A., et al. 2019a, ApJ, 875, L1, doi: 10.3847/2041-8213/ab0ec7
- Event Horizon Telescope Collaboration et al. (2019b) —. 2019b, ApJ, 875, L2, doi: 10.3847/2041-8213/ab0c96
- Event Horizon Telescope Collaboration et al. (2019c) —. 2019c, ApJ, 875, L3, doi: 10.3847/2041-8213/ab0c57
- Event Horizon Telescope Collaboration et al. (2019d) —. 2019d, ApJ, 875, L4, doi: 10.3847/2041-8213/ab0e85
- Event Horizon Telescope Collaboration et al. (2019e) —. 2019e, ApJ, 875, L5, doi: 10.3847/2041-8213/ab0f43
- Event Horizon Telescope Collaboration et al. (2019f) —. 2019f, ApJ, 875, L6, doi: 10.3847/2041-8213/ab1141
- Event Horizon Telescope Collaboration et al. (2021a) Event Horizon Telescope Collaboration, Akiyama, K., Algaba, J. C., et al. 2021a, ApJ, 910, L12, doi: 10.3847/2041-8213/abe71d
- Event Horizon Telescope Collaboration et al. (2021b) —. 2021b, ApJ, 910, L13, doi: 10.3847/2041-8213/abe4de
- Event Horizon Telescope Collaboration et al. (2022a) Event Horizon Telescope Collaboration, Akiyama, K., Alberdi, A., et al. 2022a, ApJ, 930, L12, doi: 10.3847/2041-8213/ac6674
- Event Horizon Telescope Collaboration et al. (2022b) —. 2022b, ApJ, 930, L13, doi: 10.3847/2041-8213/ac6675
- Event Horizon Telescope Collaboration et al. (2022c) —. 2022c, ApJ, 930, L14, doi: 10.3847/2041-8213/ac6429
- Event Horizon Telescope Collaboration et al. (2022d) —. 2022d, ApJ, 930, L15, doi: 10.3847/2041-8213/ac6736
- Event Horizon Telescope Collaboration et al. (2022e) —. 2022e, ApJ, 930, L16, doi: 10.3847/2041-8213/ac6672
- Event Horizon Telescope Collaboration et al. (2022f) —. 2022f, ApJ, 930, L17, doi: 10.3847/2041-8213/ac6756
- Event Horizon Telescope Collaboration et al. (2023) —. 2023, ApJ, 957, L20, doi: 10.3847/2041-8213/acff70
- Event Horizon Telescope Collaboration et al. (2024a) —. 2024a, A&A, 681, A79, doi: 10.1051/0004-6361/202347932
- Event Horizon Telescope Collaboration et al. (2024b) —. 2024b, ApJ, 964, L25, doi: 10.3847/2041-8213/ad2df0
- Event Horizon Telescope Collaboration et al. (2024c) —. 2024c, ApJ, 964, L26, doi: 10.3847/2041-8213/ad2df1
- Fanaroff & Riley (1974) Fanaroff, B. L., & Riley, J. M. 1974, MNRAS, 167, 31P, doi: 10.1093/mnras/167.1.31P
- Filho et al. (2002) Filho, M. E., Barthel, P. D., & Ho, L. C. 2002, A&A, 385, 425, doi: 10.1051/0004-6361:20020138
- Fish et al. (2020) Fish, V. L., Shea, M., & Akiyama, K. 2020, Advances in Space Research, 65, 821, doi: 10.1016/j.asr.2019.03.029
- Frank et al. (2016) Frank, B. S., Morganti, R., Oosterloo, T., Nyland, K., & Serra, P. 2016, A&A, 592, A94, doi: 10.1051/0004-6361/201628282
- Fromm et al. (2022) Fromm, C. M., Cruz-Osorio, A., Mizuno, Y., et al. 2022, A&A, 660, A107, doi: 10.1051/0004-6361/202142295
- Gardner & Whiteoak (1966) Gardner, F. F., & Whiteoak, J. B. 1966, ARA&A, 4, 245, doi: 10.1146/annurev.aa.04.090166.001333
- Gebhardt et al. (2011) Gebhardt, K., Adams, J., Richstone, D., et al. 2011, ApJ, 729, 119, doi: 10.1088/0004-637X/729/2/119
- Gebhardt & Thomas (2009) Gebhardt, K., & Thomas, J. 2009, ApJ, 700, 1690, doi: 10.1088/0004-637X/700/2/1690
- Ghez et al. (2008) Ghez, A. M., Salim, S., Weinberg, N. N., et al. 2008, ApJ, 689, 1044, doi: 10.1086/592738
- Gillessen et al. (2009) Gillessen, S., Eisenhauer, F., Fritz, T. K., et al. 2009, ApJ, 707, L114, doi: 10.1088/0004-637X/707/2/L114
- Gillessen et al. (2017) Gillessen, S., Plewa, P. M., Eisenhauer, F., et al. 2017, ApJ, 837, 30, doi: 10.3847/1538-4357/aa5c41
- González-Martín et al. (2009) González-Martín, O., Masegosa, J., Márquez, I., Guainazzi, M., & Jiménez-Bailón, E. 2009, A&A, 506, 1107, doi: 10.1051/0004-6361/200912288
- GRAVITY Collaboration et al. (2018) GRAVITY Collaboration, Abuter, R., Amorim, A., et al. 2018, A&A, 615, L15, doi: 10.1051/0004-6361/201833718
- GRAVITY Collaboration et al. (2019) —. 2019, A&A, 625, L10, doi: 10.1051/0004-6361/201935656
- Gu et al. (2007) Gu, Q. S., Huang, J. S., Wilson, G., & Fazio, G. G. 2007, ApJ, 671, L105, doi: 10.1086/525018
- Gültekin et al. (2012) Gültekin, K., Cackett, E. M., Miller, J. M., et al. 2012, ApJ, 749, 129, doi: 10.1088/0004-637X/749/2/129
- Gültekin et al. (2019) Gültekin, K., King, A. L., Cackett, E. M., et al. 2019, ApJ, 871, 80, doi: 10.3847/1538-4357/aaf6b9
- Gültekin et al. (2011) Gültekin, K., Tremaine, S., Loeb, A., & Richstone, D. O. 2011, ApJ, 738, 17, doi: 10.1088/0004-637X/738/1/17
- Hada et al. (2013) Hada, K., Doi, A., Nagai, H., et al. 2013, ApJ, 779, 6, doi: 10.1088/0004-637X/779/1/6
- Haga et al. (2015) Haga, T., Doi, A., Murata, Y., et al. 2015, ApJ, 807, 15, doi: 10.1088/0004-637X/807/1/15
- Harris et al. (2020) Harris, C. R., Millman, K. J., van der Walt, S. J., et al. 2020, Nature, 585, 357, doi: 10.1038/s41586-020-2649-2
- Helmboldt et al. (2007) Helmboldt, J. F., Taylor, G. B., Tremblay, S., et al. 2007, ApJ, 658, 203, doi: 10.1086/511005
- Hernández-Yévenes et al. (2024) Hernández-Yévenes, J., Nagar, N., Arratia, V., & Jarrett, T. H. 2024, arXiv e-prints, arXiv:2405.18336, doi: 10.48550/arXiv.2405.18336
- Hunter (2007) Hunter, J. D. 2007, Computing in Science & Engineering, 9, 90, doi: 10.1109/MCSE.2007.55
- Igumenshchev et al. (2003) Igumenshchev, I. V., Narayan, R., & Abramowicz, M. A. 2003, ApJ, 592, 1042, doi: 10.1086/375769
- Issaoun et al. (2019) Issaoun, S., Johnson, M. D., Blackburn, L., et al. 2019, A&A, 629, A32, doi: 10.1051/0004-6361/201936156
- Jaffe et al. (1993) Jaffe, W., Ford, H. C., Ferrarese, L., van den Bosch, F., & O’Connell, R. W. 1993, Nature, 364, 213, doi: 10.1038/364213a0
- Jiménez-Rosales & Dexter (2018) Jiménez-Rosales, A., & Dexter, J. 2018, MNRAS, 478, 1875, doi: 10.1093/mnras/sty1210
- Johannsen & Psaltis (2010) Johannsen, T., & Psaltis, D. 2010, ApJ, 718, 446, doi: 10.1088/0004-637X/718/1/446
- Johannsen et al. (2012) Johannsen, T., Psaltis, D., Gillessen, S., et al. 2012, ApJ, 758, 30, doi: 10.1088/0004-637X/758/1/30
- Johnson et al. (2020) Johnson, M. D., Lupsasca, A., Strominger, A., et al. 2020, Science Advances, 6, eaaz1310, doi: 10.1126/sciadv.aaz1310
- Johnson et al. (2023) Johnson, M. D., Akiyama, K., Blackburn, L., et al. 2023, Galaxies, 11, 61, doi: 10.3390/galaxies11030061
- Johnson et al. (2024) Johnson, M. D., Akiyama, K., Baturin, R., et al. 2024, arXiv e-prints, arXiv:2406.12917, doi: 10.48550/arXiv.2406.12917
- Jones & Hardee (1979) Jones, T. W., & Hardee, P. E. 1979, ApJ, 228, 268, doi: 10.1086/156843
- Katsiyannis et al. (1998) Katsiyannis, A. C., Kemp, S. N., Berry, D. S., & Meaburn, J. 1998, A&AS, 132, 387, doi: 10.1051/aas:1998302
- Kudriashov et al. (2021) Kudriashov, V., Martin-Neira, M., Roelofs, F., et al. 2021, Chinese Journal of Space Science, 41, 211, doi: 10.3724/SP.J.0254-6124.2021.0202
- Laing & Bridle (1987) Laing, R. A., & Bridle, A. H. 1987, MNRAS, 228, 557, doi: 10.1093/mnras/228.3.557
- Leung et al. (2011) Leung, P. K., Gammie, C. F., & Noble, S. C. 2011, ApJ, 737, 21, doi: 10.1088/0004-637X/737/1/21
- Licquia & Newman (2015) Licquia, T. C., & Newman, J. A. 2015, The Astrophysical Journal, 806, 96, doi: 10.1088/0004-637x/806/1/96
- Macchetto et al. (1997) Macchetto, F., Marconi, A., Axon, D. J., et al. 1997, ApJ, 489, 579, doi: 10.1086/304823
- Malin (1979) Malin, D. F. 1979, Nature, 277, 279, doi: 10.1038/277279a0
- Mezcua et al. (2018) Mezcua, M., Hlavacek-Larrondo, J., Lucey, J. R., et al. 2018, MNRAS, 474, 1342, doi: 10.1093/mnras/stx2812
- Mingarelli et al. (2017) Mingarelli, C. M. F., Lazio, T. J. W., Sesana, A., et al. 2017, Nature Astronomy, 1, 886, doi: 10.1038/s41550-017-0299-6
- Mościbrodzka et al. (2017) Mościbrodzka, M., Dexter, J., Davelaar, J., & Falcke, H. 2017, MNRAS, 468, 2214, doi: 10.1093/mnras/stx587
- Mościbrodzka et al. (2016) Mościbrodzka, M., Falcke, H., & Shiokawa, H. 2016, A&A, 586, A38, doi: 10.1051/0004-6361/201526630
- Mościbrodzka & Gammie (2018) Mościbrodzka, M., & Gammie, C. F. 2018, MNRAS, 475, 43, doi: 10.1093/mnras/stx3162
- Mościbrodzka et al. (2021) Mościbrodzka, M., Janiuk, A., & De Laurentis, M. 2021, Unraveling circular polarimetric images of magnetically arrested accretion flows near event horizon of a black hole, doi: 10.1093/mnras/stab2790
- Nagar et al. (2002) Nagar, N. M., Falcke, H., Wilson, A. S., & Ulvestad, J. S. 2002, A&A, 392, 53, doi: 10.1051/0004-6361:20020874
- Nagar et al. (1999) Nagar, N. M., Wilson, A. S., Mulchaey, J. S., & Gallimore, J. F. 1999, ApJS, 120, 209, doi: 10.1086/313183
- Narayan et al. (2022) Narayan, R., Chael, A., Chatterjee, K., Ricarte, A., & Curd, B. 2022, MNRAS, 511, 3795, doi: 10.1093/mnras/stac285
- Narayan et al. (2003) Narayan, R., Igumenshchev, I. V., & Abramowicz, M. A. 2003, PASJ, 55, L69, doi: 10.1093/pasj/55.6.L69
- Narayan & Yi (1995) Narayan, R., & Yi, I. 1995, ApJ, 452, 710, doi: 10.1086/176343
- O’Sullivan et al. (2011) O’Sullivan, E., Worrall, D. M., Birkinshaw, M., et al. 2011, MNRAS, 416, 2916, doi: 10.1111/j.1365-2966.2011.19239.x
- Palumbo et al. (2020) Palumbo, D. C. M., Wong, G. N., & Prather, B. S. 2020, ApJ, 894, 156, doi: 10.3847/1538-4357/ab86ac
- Park et al. (2021) Park, J., Hada, K., Nakamura, M., et al. 2021, ApJ, 909, 76, doi: 10.3847/1538-4357/abd6ee
- Pesce et al. (2022) Pesce, D. W., Palumbo, D. C. M., Ricarte, A., et al. 2022, Galaxies, 10, 109, doi: 10.3390/galaxies10060109
- Pesce et al. (2021) Pesce, D. W., Palumbo, D. C. M., Narayan, R., et al. 2021, ApJ, 923, 260, doi: 10.3847/1538-4357/ac2eb5
- Prichard et al. (2019) Prichard, L. J., Vaughan, S. P., & Davies, R. L. 2019, MNRAS, 488, 1679, doi: 10.1093/mnras/stz1191
- Principe et al. (2020) Principe, G., Migliori, G., Johnson, T. J., et al. 2020, A&A, 635, A185, doi: 10.1051/0004-6361/201937049
- Qiu et al. (2023) Qiu, R., Ricarte, A., Narayan, R., et al. 2023, MNRAS, 520, 4867, doi: 10.1093/mnras/stad466
- Quillen et al. (2003) Quillen, A. C., Almog, J., & Yukita, M. 2003, AJ, 126, 2677, doi: 10.1086/379562
- Raimundo (2021) Raimundo, S. I. 2021, A&A, 650, A34, doi: 10.1051/0004-6361/202040248
- Ramakrishnan et al. (2023) Ramakrishnan, V., Nagar, N., Arratia, V., et al. 2023, Galaxies, 11, 15, doi: 10.3390/galaxies11010015
- Rees et al. (1982) Rees, M. J., Begelman, M. C., Blandford, R. D., & Phinney, E. S. 1982, Nature, 295, 17, doi: 10.1038/295017a0
- Ressler et al. (2015) Ressler, S. M., Tchekhovskoy, A., Quataert, E., Chandra, M., & Gammie, C. F. 2015, MNRAS, 454, 1848, doi: 10.1093/mnras/stv2084
- Ricarte et al. (2022) Ricarte, A., Palumbo, D. C. M., Narayan, R., Roelofs, F., & Emami, R. 2022, ApJ, 941, L12, doi: 10.3847/2041-8213/aca087
- Ricarte et al. (2020) Ricarte, A., Prather, B. S., Wong, G. N., et al. 2020, MNRAS, 498, 5468, doi: 10.1093/mnras/staa2692
- Ricarte et al. (2021) Ricarte, A., Qiu, R., & Narayan, R. 2021, MNRAS, 505, 523, doi: 10.1093/mnras/stab1289
- Ricarte et al. (2023) Ricarte, A., Tiede, P., Emami, R., Tamar, A., & Natarajan, P. 2023, Galaxies, 11, 6, doi: 10.3390/galaxies11010006
- Roelofs et al. (2021) Roelofs, F., Fromm, C. M., Mizuno, Y., et al. 2021, A&A, 650, A56, doi: 10.1051/0004-6361/202039745
- Roychowdhury et al. (2024) Roychowdhury, A., Meyer, E. T., Georganopoulos, M., & Kollmann, K. 2024, MNRAS, 527, 10262, doi: 10.1093/mnras/stad3867
- Ruffa et al. (2019) Ruffa, I., Prandoni, I., Laing, R. A., et al. 2019, MNRAS, 484, 4239, doi: 10.1093/mnras/stz255
- Ruffa et al. (2024) Ruffa, I., Davis, T. A., Elford, J. S., et al. 2024, MNRAS, 528, L76, doi: 10.1093/mnrasl/slad167
- Ryan et al. (2018) Ryan, B. R., Ressler, S. M., Dolence, J. C., Gammie, C., & Quataert, E. 2018, ApJ, 864, 126, doi: 10.3847/1538-4357/aad73a
- Saglia et al. (2016) Saglia, R. P., Opitsch, M., Erwin, P., et al. 2016, ApJ, 818, 47, doi: 10.3847/0004-637X/818/1/47
- Saikia et al. (1986) Saikia, D. J., Subrahmanya, C. R., Patnaik, A. R., et al. 1986, MNRAS, 219, 545, doi: 10.1093/mnras/219.3.545
- Sánchez-Portal et al. (2004) Sánchez-Portal, M., Díaz, Á. I., Terlevich, E., & Terlevich, R. 2004, MNRAS, 350, 1087, doi: 10.1111/j.1365-2966.2004.07720.x
- Shapiro et al. (1976) Shapiro, S. L., Lightman, A. P., & Eardley, D. M. 1976, ApJ, 204, 187, doi: 10.1086/154162
- Shlentsova et al. (2024) Shlentsova, A., Roelofs, F., Issaoun, S., Davelaar, J., & Falcke, H. 2024, arXiv e-prints, arXiv:2403.03327, doi: 10.48550/arXiv.2403.03327
- Simon et al. (2024) Simon, D. A., Cappellari, M., & Hartke, J. 2024, MNRAS, 527, 2341, doi: 10.1093/mnras/stad3309
- Sądowski et al. (2014) Sądowski, A., Narayan, R., McKinney, J. C., & Tchekhovskoy, A. 2014, MNRAS, 439, 503, doi: 10.1093/mnras/stt2479
- Sądowski et al. (2013) Sądowski, A., Narayan, R., Penna, R., & Zhu, Y. 2013, MNRAS, 436, 3856, doi: 10.1093/mnras/stt1881
- Sądowski et al. (2017) Sądowski, A., Wielgus, M., Narayan, R., et al. 2017, MNRAS, 466, 705, doi: 10.1093/mnras/stw3116
- Sparks et al. (1995) Sparks, W. B., Golombek, D., Baum, S. A., et al. 1995, ApJ, 450, L55, doi: 10.1086/316777
- Tal et al. (2009) Tal, T., van Dokkum, P. G., Nelan, J., & Bezanson, R. 2009, AJ, 138, 1417, doi: 10.1088/0004-6256/138/5/1417
- Taylor et al. (1998) Taylor, G. B., Wrobel, J. M., & Vermeulen, R. C. 1998, ApJ, 498, 619, doi: 10.1086/305586
- Tchekhovskoy et al. (2011) Tchekhovskoy, A., Narayan, R., & McKinney, J. C. 2011, MNRAS, 418, L79, doi: 10.1111/j.1745-3933.2011.01147.x
- Tingay & Edwards (2015) Tingay, S. J., & Edwards, P. G. 2015, MNRAS, 448, 252, doi: 10.1093/mnras/stu2756
- Tomar et al. (2021) Tomar, G., Gupta, N., & Prince, R. 2021, ApJ, 919, 137, doi: 10.3847/1538-4357/ac1588
- Trussoni et al. (1999) Trussoni, E., Vagnetti, F., Massaglia, S., et al. 1999, Mem. Soc. Astron. Italiana, 70, 141
- Tsunetoe et al. (2022) Tsunetoe, Y., Mineshige, S., Kawashima, T., et al. 2022, ApJ, 931, 25, doi: 10.3847/1538-4357/ac66dd
- van den Bosch (2016) van den Bosch, R. C. E. 2016, ApJ, 831, 134, doi: 10.3847/0004-637X/831/2/134
- Velović et al. (2022) Velović, V., Filipović, M. D., Barnes, L., et al. 2022, MNRAS, 516, 1865, doi: 10.1093/mnras/stac2012
- Venturi et al. (2004) Venturi, T., Dallacasa, D., & Stefanachi, F. 2004, A&A, 422, 515, doi: 10.1051/0004-6361:20040089
- Walker et al. (2018) Walker, R. C., Hardee, P. E., Davies, F. B., Ly, C., & Junor, W. 2018, ApJ, 855, 128, doi: 10.3847/1538-4357/aaafcc
- Walsh et al. (2013) Walsh, J., Barth, A. J., Ho, L. C., & Sarzi, M. 2013, in American Astronomical Society Meeting Abstracts, Vol. 221, American Astronomical Society Meeting Abstracts #221, 103.08
- Wang et al. (2024) Wang, Y., Wang, T., Ho, L. C., Zhong, Y., & Luo, B. 2024, arXiv e-prints, arXiv:2402.17991, doi: 10.48550/arXiv.2402.17991
- Wójtowicz et al. (2023) Wójtowicz, A., Stawarz, Ł., Cheung, C. C., Werner, N., & Rudka, D. 2023, ApJ, 944, 195, doi: 10.3847/1538-4357/acb498
- Wong et al. (2022) Wong, G. N., Prather, B. S., Dhruv, V., et al. 2022, ApJS, 259, 64, doi: 10.3847/1538-4365/ac582e
- Yan et al. (2023) Yan, X., Lu, R.-S., Jiang, W., Krichbaum, T. P., & Shen, Z.-Q. 2023, ApJ, 957, 32, doi: 10.3847/1538-4357/acf8c1
- Yan et al. (2024) Yan, X., Lu, R.-S., Jiang, W., et al. 2024, arXiv e-prints, arXiv:2403.04215, doi: 10.48550/arXiv.2403.04215
- Yao et al. (2021) Yao, P. Z., Dexter, J., Chen, A. Y., Ryan, B. R., & Wong, G. N. 2021, MNRAS, 507, 4864, doi: 10.1093/mnras/stab2462
- Zhao et al. (1993) Zhao, J.-H., Sumi, D. M., Burns, J. O., & Duric, N. 1993, ApJ, 416, 51, doi: 10.1086/173214