Stellar –process neutron capture cross section of Ce isotopes
Abstract
Stellar abundances of cerium are of high current interest based both on observations and theoretical models, especially with regard to the neutron–magic 140Ce isotope. A large discrepancy of process stellar models relative to cerium abundance observed in globular clusters was highlighted, pointing to possible uncertainties in experimental nuclear reaction rates. In this work, the stellar neutron capture cross section of the stable cerium isotopes 136Ce, 138Ce, 140Ce, and 142Ce, were re-measured. A natCe sample was irradiated with quasi-Maxwellian neutrons at keV using the 7Li() reaction. The neutron field with an intensity of n/s was produced by irradiating the liquid-lithium target (LiLiT) with a mA proton beam at an energy (1.92 MeV) just above the threshold at Soreq Applied Research Accelerator Facility (SARAF). The activities of the natCe neutron capture products were measured using a shielded High Purity Germanium detector. Cross sections were extracted relative to that of the 197Au(n,) reaction and the Maxwellian-averaged cross section (MACS) of the Ce isotopes were derived. The MACS values extracted from this experiment are generally consistent with previous measurements and show for 140Ce a value % smaller than most recent experimental values.
I Introduction
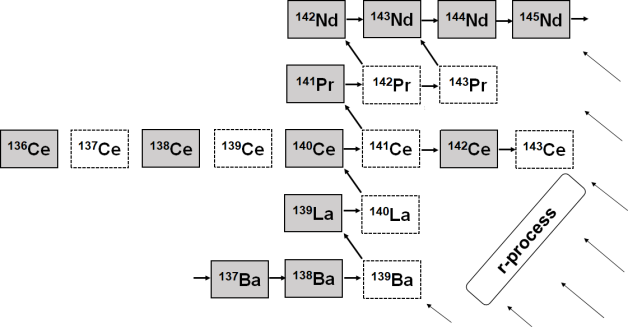
The four stable isotopes of cerium (Z = 58, Fig. 1) display a showcase of processes responsible for production of heavy elements. Since Cameron Cameron (1957) and Burbidge et al. Burbidge et al. (1957), neutron captures are considered the main production gateways for these nuclides via the slow () and the rapid () processes while very few proton-rich nuclides (two of those being Ce isotopes) belong to the so-called process. About half of the isotopes of the heavy elements () are produced by the slow () process. There, the time between consecutive neutron captures is long with respect to typical decay lifetimes along its path, resulting in an evolution close to the valley of stability. The process is further divided in a weak and main components. The weak process Käppeler et al. (2011) operates in massive stars, , before they explode as type II supernovae and produces nuclides in the mass range . The main component Käppeler et al. (2011); Lugaro et al. (2003), which produces nuclides in the range , takes place in low-mass asymptotic giant branch (AGB) stars, . It operates on a timescale of a few yr. In a simplified view, most of the neutron exposure experienced by seed nuclei is generated by the neutron source reaction, operating in pulses of a few yr. The reaction is activated at K ( keV) and generates a low neutron number density of cm-3.
At the end of such a pulse when the temperature reaches K ( keV), a much shorter pulse is activated for a few years during which the is the main neutron source. It generates a higher neutron number density of cm-3. Due to the short time it operates, the latter neutron source accounts for only a small fraction of the total exposure. However, the higher can affect branching points along the main -process path. The other about half of heavy nuclides are produced by the rapid () process, in which the time between consecutive neutron captures is short with respect to radioisotope decay lifetimes along its path. The process operates on a timescale of 1 sec under explosive conditions characterized by high temperature, K keV), and high neutron number density, cm-3 Freiburghaus et al. (1999). A third neutron capture process, termed the process, was proposed by Cowan and Rose (1977). The neutron number density in this process, cm-3, is intermediate between those the of and processes. It is considered to operate in some special cases Cowan and Rose (1977); Denissenkov et al. (2019); Choplin et al. (2021, 2022). Potential confirmation of the process comes from the chemical compositions of carbon-enhanced metal-poor (CEMP) stars, enriched in both and process elements. In addition to the neutron capture processes described above, the process produces 35 neutron-deficient stable isotopes. It operates in massive stars under explosive conditions by photonuclear reactions e.g. , on pre-existing and isotopes Meyer (1994); Choplin, A. et al. (2022).
Apart from the -nuclides 136Ce and 138Ce, Ce is considered a primarily (main) process element, with a small process fraction. Ce was indeed observed in process enhanced stars Abia et al. (2002); Aoki et al. (2002), and in the CEMP stars that may exhibit process composition Denissenkov et al. (2019); Choplin et al. (2021); Karinkuzhi et al. (2021). Cerium is however also observed in process enhanced stars Jonsell et al. (2006); Siqueira Mello et al. (2014); Holmbeck et al. (2018) and its presence was reported in the kilonova (AT 2017gfo) following the gravitational wave event GW170817 Domoto et al. (2022). A large body of high-quality spectrometric data on the Galactic content of cerium has been recently collected, see e.g. Contursi, G. et al. (2023) and references therein.
For a complete picture of the astronomical data of Ce, one needs to consider presolar grains Zinner (2014) in addition to abundances in solar material. Thermodynamic calculations show that Ce is refractory under both C-rich (C/O 1) conditions Lodders and Fegley (1995) and under O-rich (C/O 1) conditions Lodders (2003). The abundance of Ce was measured in single presolar SiC grains (which condense under C-rich conditions) of different subtypes, the source stars of which are believed to be mainly low-mass AGB stars of different metallicities and supernovae Amari et al. (1995). Recently, the Ce abundance was measured for the first time also in a presolar silicate grain (which condense under O-rich conditions), believed to originate in a low mass AGB star Leitner and Hoppe (2022). Also recently, Lugaro et al. Lugaro et al. (2020) proposed correlating Ce/Y ratios in Ba stars with 88Sr/86Sr ratios in large single presolar SiC grains to infer the type of their source stars.
In this paper we report new measurements of the radiative neutron capture Maxwellian-averaged cross sections (MACS) of the stable isotopes at energies relevant to the and processes; see Käppeler et al. (1996); Harnood et al. (2000); Amaducci et al. (2021) for previous measurements and a compilation in kad and references therein. Of special interest is the reaction on 140Ce which is a neutron-magic () nucleus with a typical high neutron binding energy and small neutron capture cross section. 140Ce feeds the potential and processes branching point 141Ce (terrestrial d, calculated not to change at and process temperatures Cosner K. and Truran J. W. (1981); Takahashi and Yokoi (1987)). Koloczek et al. Koloczek et al. (2016) calculated that this cross section affects the production of 33 other isotopes in the process. A discrepancy between the Ce abundance observed in the globular clusters M4 Young et al. (2003) and M22 Roederer et al. (2011) and that calculated by stellar models was recently pointed out by Straniero et al. Straniero et al. (2014) and was attributed possibly to insufficient experimental knowledge of the stellar 140Ce cross section.
The article is organized as follows: Section II recounts the irradiation of the natCe sample, Sec. III describes the detection of the radiation products by spectrometry, Sec. IV details the extraction of cross sections, Sec. V is a short discussion and Sec. VI is a summary. Preliminary results of this experiment were presented in Refs Sahoo, Rudra N. et al. (2023); Tessler et al. (2016).
II Ce sample irradiation
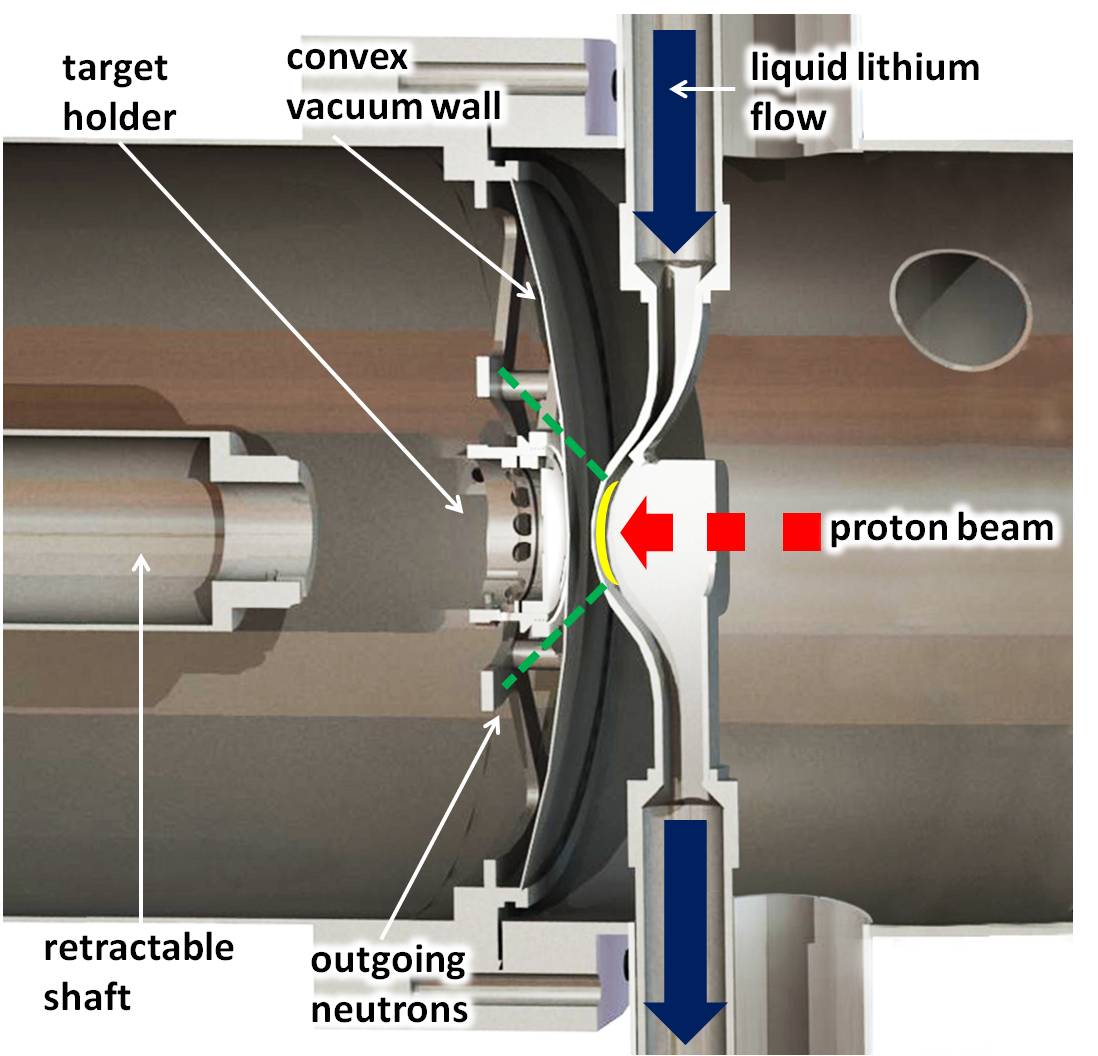
The neutron irradiation was performed using the Soreq Applied Research Accelerator Facility (SARAF) and the Liquid Lithium Target (LiLiT); see Mardor et al. (2018); Paul et al. (2019) for review articles. Quasi-maxwellian neutrons were produced by an intense proton beam (1-1.5 mA) from the SARAF superconducting linear accelerator bombarding the LiLiT target at an energy of 1.925 MeV, just above the threshold (1881 keV) of the 7Li(Be reaction, following the method introduced in Ratynski & Käppeler Ratynski and Käppeler (1988). The proton beam energy was measured by a Rutherford back scattering detector located after the accelerator modules, with a typical energy spread of 15 keV. The windowless LiLiT setup (Fig. 2), which consists of liquid lithium (at C) circulating in closed loop and producing a target film of mm thickness and 18 mm wide, allows for dissipation of the beam power (2-3 kW) by fast transport (2-3 m/s) to a heat exchanger. Neutrons, emitted mostly in the forward direction due to the reaction kinematics, bombarded secondary activation targets located in an experimental chamber at rough vacuum separated by a 0.5 mm thick convex stainless steel wall from the LiLiT chamber and accelerator vacuum. A high-purity metallic natCe target (Ce-I, 25 mm diameter, 2.114(1) g) was sandwiched between two Au foils labeled Au(1) and Au(2) (0.110(1) g and 0.119(1) g, respectively), used as neutron fluence monitors (Table 1).
| Stable Isotopes | Abundance | Ce-I | Ce-II |
|---|---|---|---|
| natCe, Au | () | (atoms/cm2) | (atoms/cm2) |
| 136Ce | 0.185(2) | 3.52(4)1018 | 3.46(4)1018 |
| 138Ce | 0.251(2) | 4.63(4)1018 | 4.55(4)1018 |
| 140Ce | 88.45(5) | 1.640(1)1021 | 1.612(1)1021 |
| 142Ce | 11.11(5) | 2.05(1)1020 | 2.02(1)1020 |
| 197Au(1) | 100 | 6.831019 | 7.241019 |
| 197Au(2) | 100 | 7.401019 | 7.021019 |
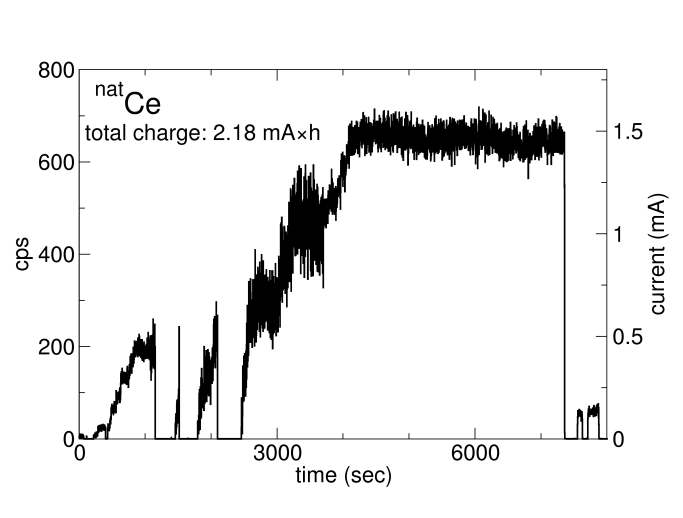
Figure 3 illustrates the time profile of the proton current during the irradiation process monitored by a commercial fission detector located in the neutron field at 0∘ relative to the incident proton beam at cm downstream (in air) of the experimental chamber. The time profile was used to calculate a correction for the decay of reaction products during the irradiation, significant for the shortest-lived reaction product 137gCe (t h).
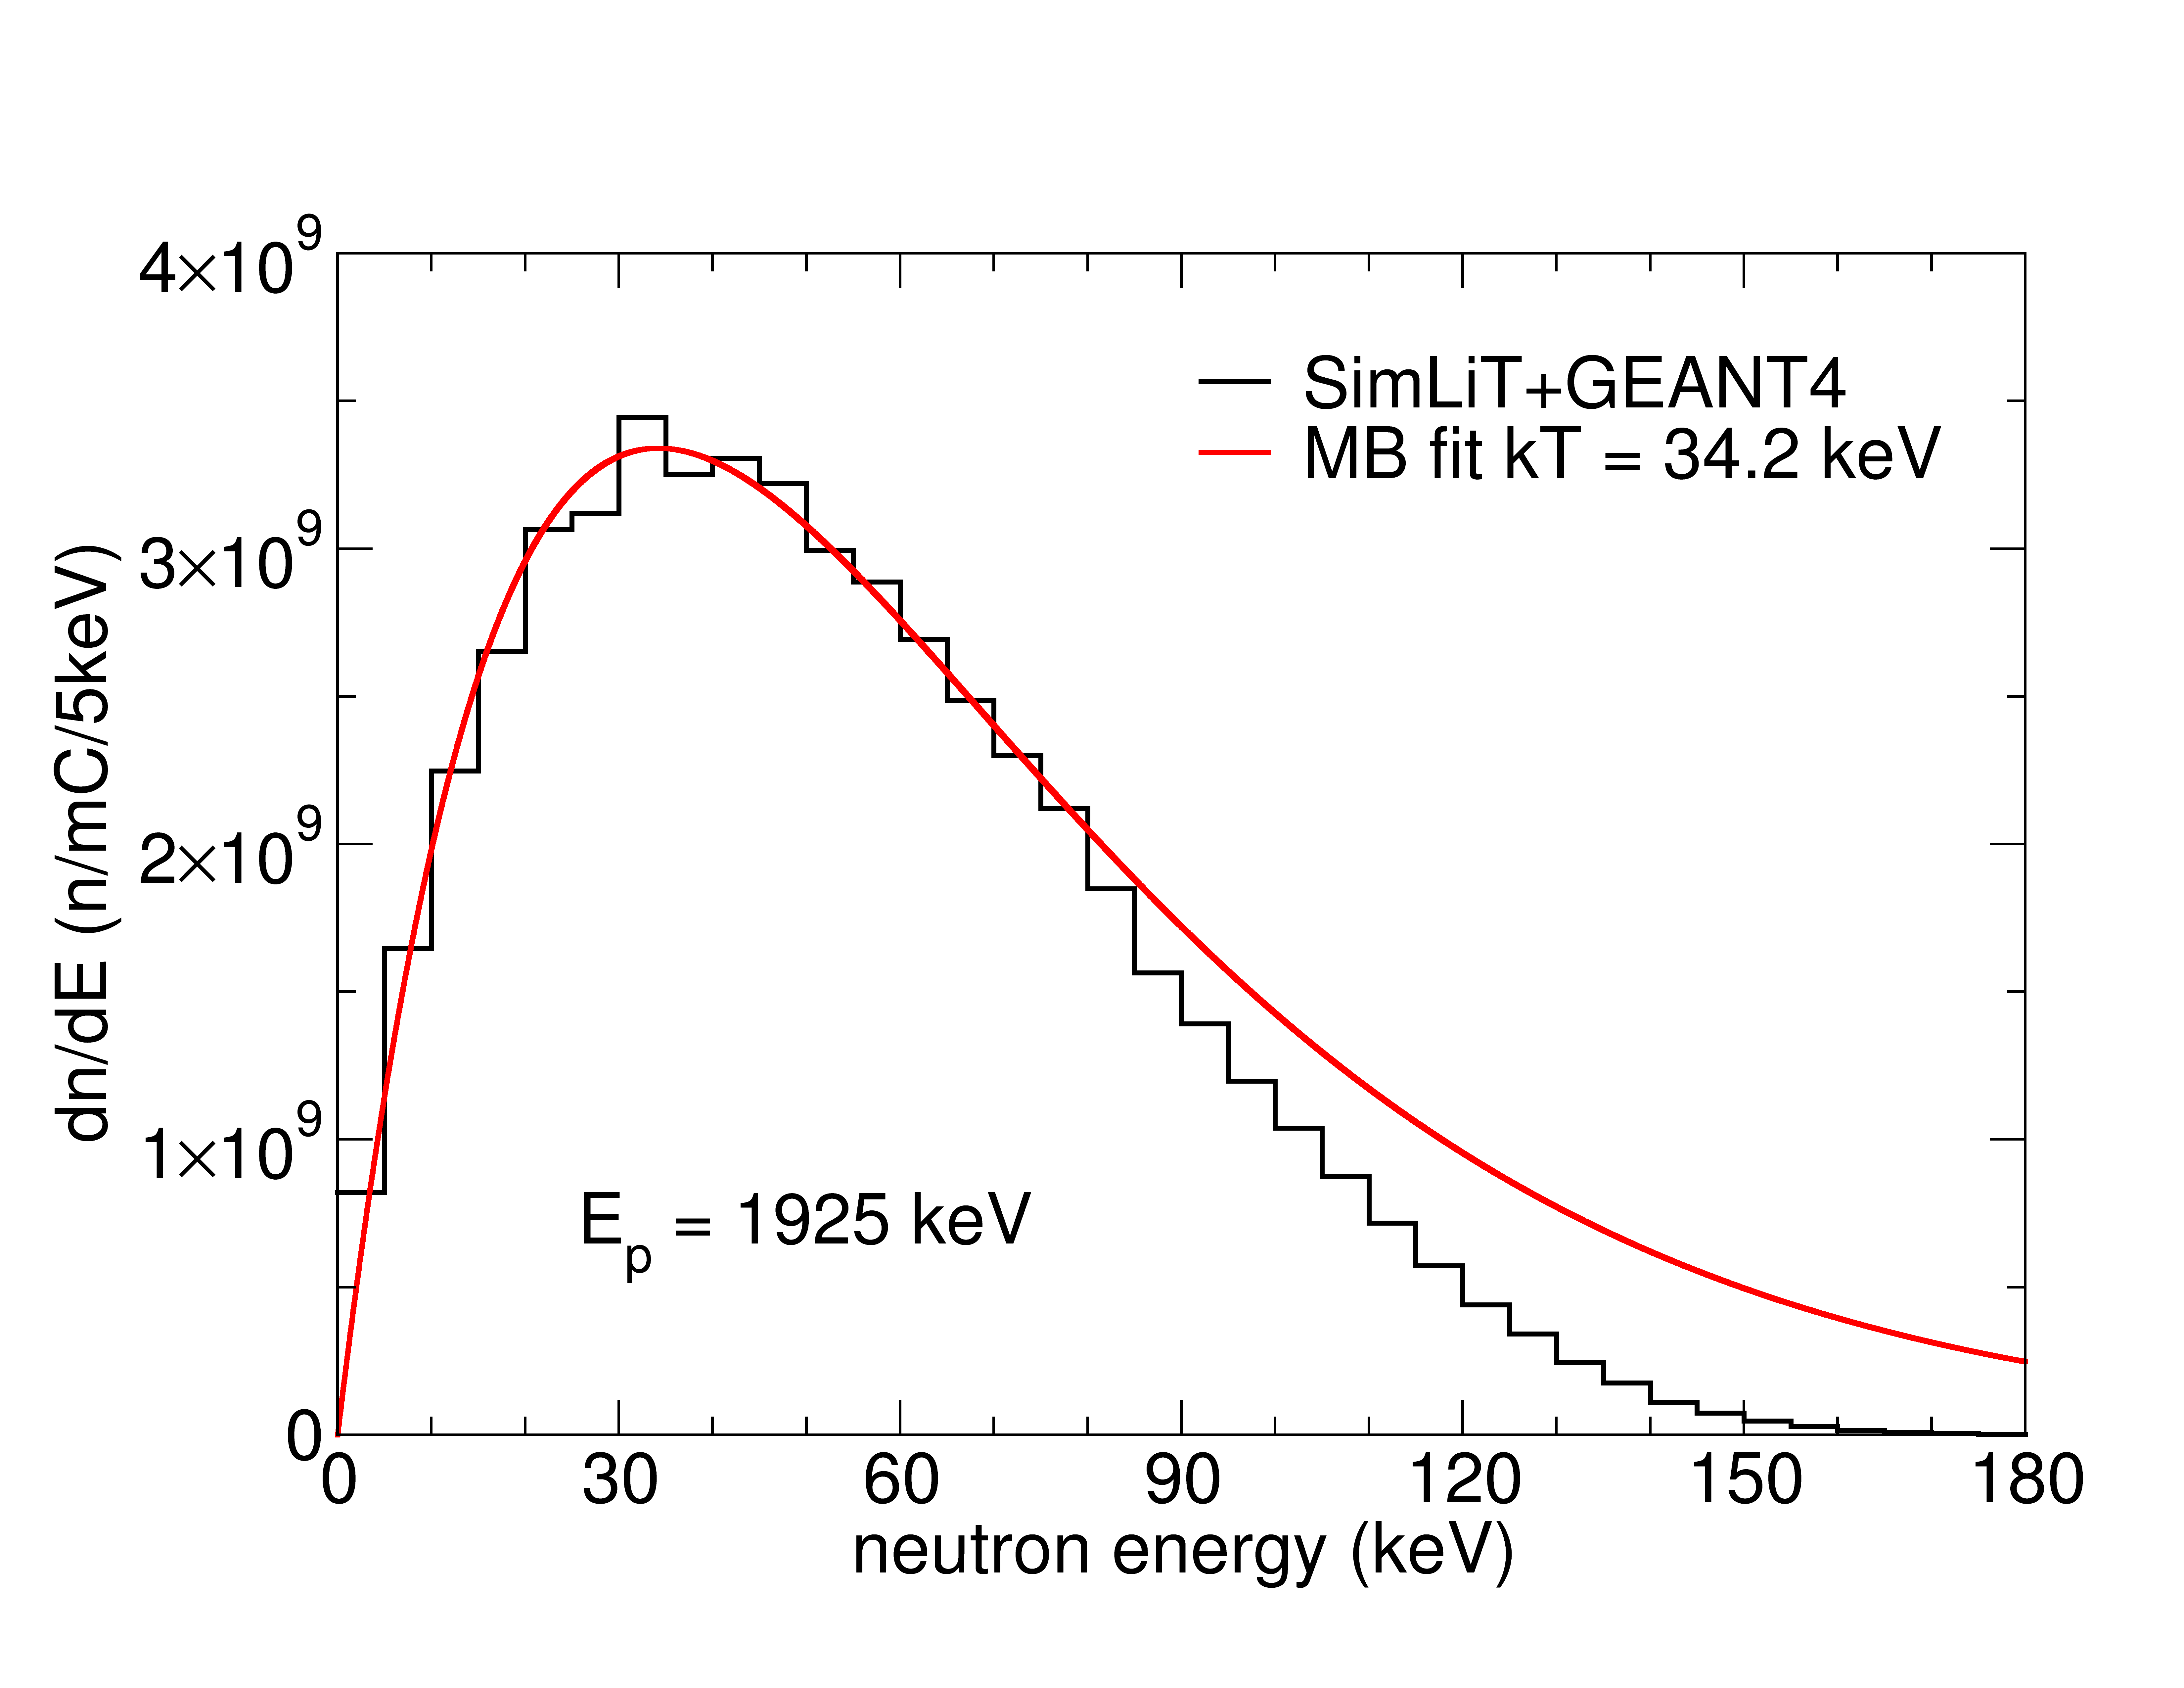
The energy spectrum of the neutron field seen by the target sandwich could not be experimentally determined and was calculated with the aid of the Monte Carlo code SimLiT Friedman et al. (2013) and the transport code GEANT4 Agostinelli et al. (2003) using a detailed model of the LiLiT chamber and target geometry. The SimLiT-GEANT4 codes were carefully benchmarked in previous experiments using the same setup Tessler et al. (2015); Paul et al. (2019). The simulated spectrum of the neutrons subtending the Ce target is shown in Fig. 4 together with a Maxwell-Boltzmann flux distribution fitted to the simulated spectrum for keV. The simulated experimental spectrum (histogram in Fig. 4) includes 85% of the fitted Maxwell-Boltzmann distribution at = 34.2 keV The validity of the simulated spectrum is further demonstrated by the fact that the experimental and simulated number of activated Au nuclei (denoted respectively by and (see below Eq. (8)) agree with each other within 1% after normalization to proton charge.
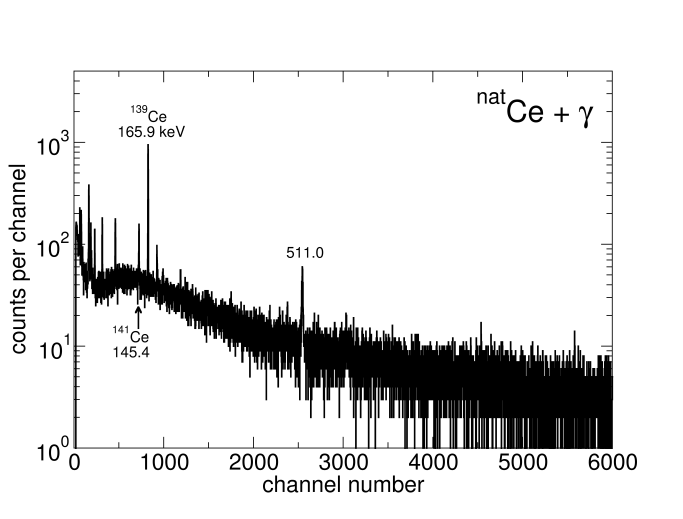
It had been noted in previous experiments Tessler et al. (2015); Paul et al. (2019) that in the LiLiT setup using a thick Li target, high-energy rays (17.6 and 14.6 MeV) due to the 7LiBe proton capture reaction, produce reactions in the irradiated target which could interfere with the reaction products. In the present case for example, the 140CeCe reaction can interfere with the 139Ce production via the 138CeCe investigated in this work. In order to correct quantitatively for this effect, a separate Ce target (Ce-II, Table 1) was irradiated with a pure ray field from the 7LiBe reaction at a proton energy (1.810 MeV) below the neutron threshold (no neutrons present). A Au foil monitored the fluence via the 197AuAu and 196Au(6.2 d) activity, of well-established cross section. Results of the and irradiations are presented in the next section.
III Detection of activated A+1Ce nuclei
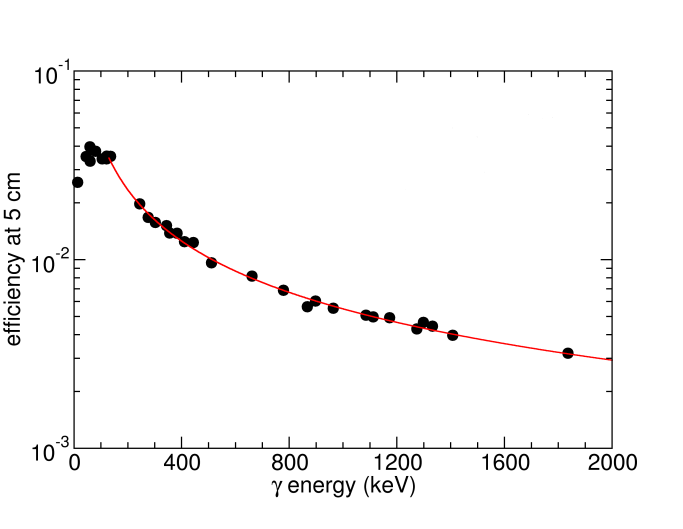
Detailed information on the identified Ce isotopes, including their half-lives, gamma-ray transitions, and intensities are given in Table 2. A shielded HPGe detector was employed to identify and measure the induced activities of reaction products. Prior to the activity measurement, the detector was calibrated, and its efficiency was determined using a standard multi-gamma radioactive source, including 22Na, 60Co, 88Y, 133Ba, 137Cs, 241Am, 152Eu, and 155Eu isotopes, positioned at a distance of 5 cm from the detector end-cap. The efficiency curve obtained from this measurement is depicted in Fig. 5.
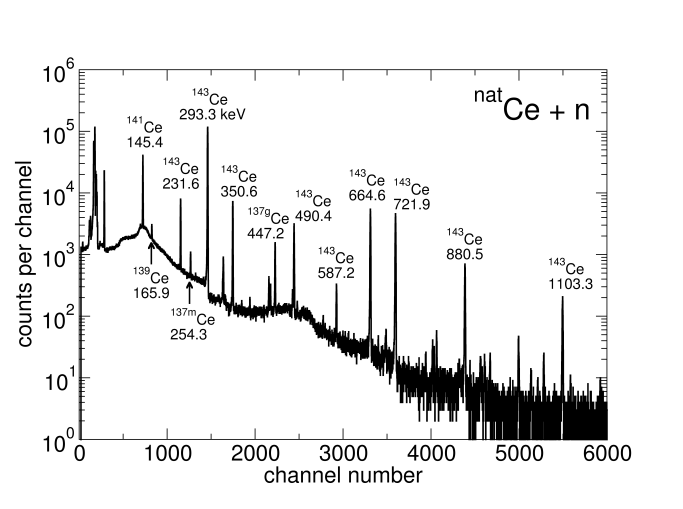
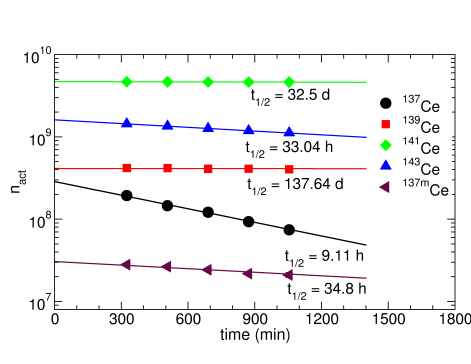
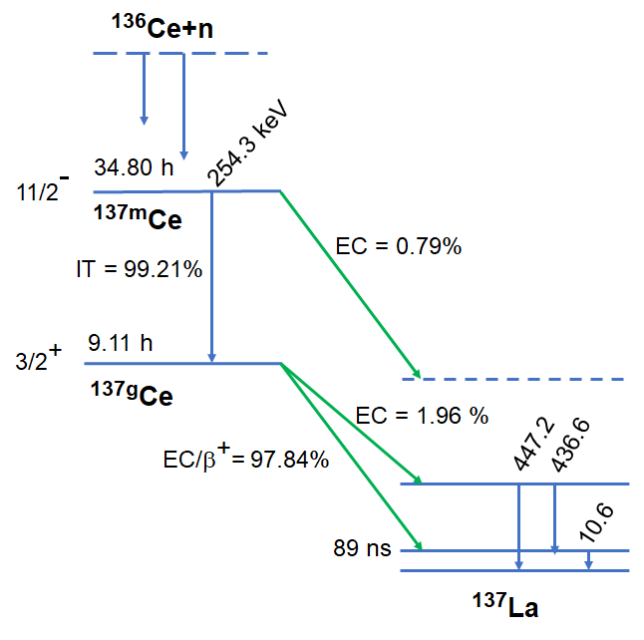
The spectrum of irradiated natCe above neutron threshold, measured at 5 cm distance, is presented in Fig. 6, revealing the identification of lines corresponding to 137,139,141,143Ce isotopes and of a metastable state of 137Ce isotope (137mCe, , see Fig. 11). Figure 8 represents the ray spectrum Au(1) (upstream monitor) obtained in above threshold irradiation.
For either irradiation (above- or under-threshold), the residual number of activated nuclei at time after end of irradiation is obtained using the following equation:
| (1) |
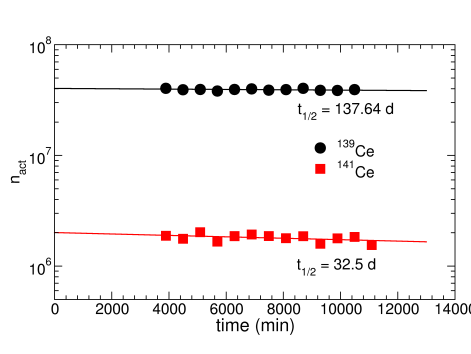
see decay curves of in Figs. 9, 10 for above-threshold and under-threshold irradiation, respectively.
In Eq. (1), C is the number of counts in the full-energy peak of a line; , Iγ, and Kγ are the full-energy peak efficiency (Fig. 5), transition intensity and self-absorption coefficient calculated from the target thickness data and the different -ray energies, respectively (Table 2); , and are the decay constant of the transition, real and live counting time, respectively. The notation refers to a correction for nuclei decaying during the irradiation time, including a minor contribution for 137gCe due to feeding from the isomeric state 137mCe, and is explained below. We note here that the 447.2 keV -transition (Fig. 11), which characterizes the decay of the 137Ce ground state, is practically degenerate with the 447.45 keV (0.06%) transition in
143Ce decay within the resolution of the HPGe detector. In order to correct for this contribution, the counts expected from the 447.45 keV transition were estimated as follows, relative to those of the 293.26 (42.8 ) keV line in the decay of the same nucleus 143Ce:
| (2) |
, , and in Eq. (2) represent the counts, intensity, efficiency of the detector and self-absorption coefficient of the corresponding transition, respectively. The contribution of the 447.45 keV transition in 143Ce decay corresponds to 15% of the full-energy peak observed at this energy and is subtracted from the total peak counts.
The fraction of activated nuclei decaying during the irradiation time is calculated via the expression
| (3) |
where represents the time profile of the neutron intensity on target, taken as proportional to the (neutron-induced) fission chamber yield (e.g Fig. 6 for above-threshold irradiation). Small additional corrections, overall of the order of 1%, need to be applied in the case of 137gCe to take into account feeding from the isomeric state 137mCe (Fig. 11) during irradiation, cooling and counting; the expressions used for these corrections are given in the Appendix. The final values of are given in Table 2.
| Identified | Half-life | Detected - | Intensity | Kγ | |
|---|---|---|---|---|---|
| Isotopes | trans (keV) | () | |||
| 137gCe | 9.11(3) h | 447.15(8) | 1.68(6) | 0.987 | 0.937 |
| 436.59(9) | 0.26(1) | 0.985 | 0.937 | ||
| 137mCe | 34.80(3) h | 254.29(5) | 11.1(4) | 0.966 | 0.982 |
| 139Ce | 137.64(2) d | 165.86(1) | 79.90(13) | 0.923 | 1.000 |
| 141Ce | 32.51(1) d | 145.443(1) | 48.30(7) | 0.912 | 0.999 |
| 143Ce | 33.039(6) h | 231.550(2) | 2.05(5) | 0.957 | 0.981 |
| 293.226(2) | 42.8(4) | 0.977 | 0.981 | ||
| 350.619(3) | 3.23(4) | 0.979 | 0.981 | ||
| 447.45(2) | 0.060(3) | 0.977 | 0.981 | ||
| 490.368(5) | 2.16(3) | 0.989 | 0.981 | ||
| 664.57(1) | 5.69(7) | 0.991 | 0.981 | ||
| 721.93(1) | 5.39(7) | 0.992 | 0.981 | ||
| 880.46(1) | 1.031(13) | 0.994 | 0.981 | ||
| 198Au | 2.6941(2) d | 411.80 | 95.62 | 0.999 | 0.990 |
The number () of activated ACe nuclei produced during the irradiations above (under) neutron threshold (Table 3) was extracted from an extrapolation of the respective decay curves to end of irradiation (time , Figs. 9, 10). The net yield of the ACe reactions was obtained by subtracting the yield produced by reactions during the irradiation above threshold from the measured yield . The subtracted yield, significant only in the case of the 139Ce product, was obtained from after normalization of the respective target thicknesses and incident proton charges (Table 3). We note here that the intensity of the high-energy rays produced by the 7LiBe reaction, responsible from the yield in our experiment, is dominated by a strong low-energy resonance at E keV Zahnow et al. (1995); Munch et al. (2018). The difference between the thick-target average cross section for production of high-energy rays in the above-threshold ( MeV) and under-threshold ( MeV) irradiations is therefore considered negligible.
| Reaction | ||||
|---|---|---|---|---|
| Product | (108) | (108) | (108) | (108) |
| 137gCe | 3.04(7) | 3.04(7) | ||
| 137mCe | 0.310(6) | 0.310(6) | ||
| 139Ce | 4.14(8) | 0.403(2) | 1.57(2) | 2.57(6) |
| 141Ce | 47.0(7) | 0.020(1) | 0.078(2) | 46.96(7) |
| 143Ce | 16.43(4) | 16.43(4) | ||
| 198Au(1) | 138.8(2) | 138.8(2) | ||
| 198Au(2) | 135.5(3) | 135.5(3) |
IV ACe experimental cross section and Maxwellian-averaged cross sections
IV.1 Experimental cross sections
The net number of activated ACe nuclei can be written as
| (4) |
where (x) is our experimental cross section, sometimes termed the spectrum-averaged cross section, is the time-integrated neutron rate and (x) is the areal density of target nuclei . In our experiment the experimental cross section of cerium isotopes is determined relative to that of 197Au used as monitor in the same irradiation via the equation
| (5) |
The spectrum-averaged cross section of the 197AuAu reaction is calculated via the expression
| (6) |
where the excitation function is taken from the ENDF/B-VIII.0 library Brown et al. (2018). The ENDF/B-VIII.0 library was found to reproduce closely experimental data Lederer et al. (2011); Massimi et al. (2014) of the 197AuAu reaction. The neutron spectrum, , is obtained as described in Section II from the SimLiT-GEANT4 simulation code Friedman et al. (2013); Feinberg et al. (2012) for each of the Au monitors. The average cross section (Au) for Au(1) is 571.9 mb and for Au(2) is 563.6 mb and the value taken in Eq. (5) is 568(4) mb. The experimental cross sections of the ACe isotopes using Eq. (5) and their uncertainty are given in Table 4.
| Reaction | Cross section |
|---|---|
| () mb | |
| 136Ce(n,)137Ce | 262(10) |
| 136Ce(n,)137mCe | 26.7(9) |
| 138Ce(n,)139Ce | 163(6) |
| 140Ce(n,)141Ce | 8.4(2) |
| 142Ce(n,)143Ce | 23.5(9) |
IV.2 MACS calculation
The Maxwellianaveraged cross section is defined Ratynski and Käppeler (1988) as,
| (7) |
where is the true energy-dependent ) cross section. Our measurements of the experimental cross sections of Section IV.1 allow us to calibrate evaluated neutron cross section libraries, corrected to match the measured ’s. Following the method described in Tessler et al. (2015); Paul et al. (2019), the SimLiT-GEANT4 code Friedman et al. (2013) is used to calculate simultaneously the numbers of activated nuclei for the two gold foils, Au(1) and Au(2), and the Ce target using a neutron capture cross section library and the detailed setup of our experiment. The correction factor for is then defined as follows:
| (8) |
where (Ce) and (Au) are the number of activated Ce-isotopes and Au nuclei determined experimentally. (Ce) are the number of activated Ce-isotopes and Au nuclei determined from the SimLiT-GEANT4 simulation using the cross section from a given library. The ENDF/B-VIII.0 library was consistently used in the simulation to calculate the number of 198Au activated nuclei (Au). The Clib values derived for several evaluated libraries are given in Table 5. Using this definition of , our experimental MACS at temperature T is then determined as
| (9) |
and the extracted values are given in Table 6 for keV for the respective libraries.
| Target nucleus: | 136Ce | 138Ce | 140Ce | 142Ce |
|---|---|---|---|---|
| JENDL-5 | 1.04 | 1.23 | 1.06 | 1.29 |
| JEFF-3.3 | 0.97 | 1.04 | 1.11 | 1.29 |
| CENDL-3.2 | 0.85 | 3.93 | 1.06 | 1.29 |
| ENDF/B-VIII.0 | 0.85 | 0.87 | 1.23 | 1.33 |
| ROSFOND-10 | 0.85 | 0.87 | 1.23 | 1.29 |
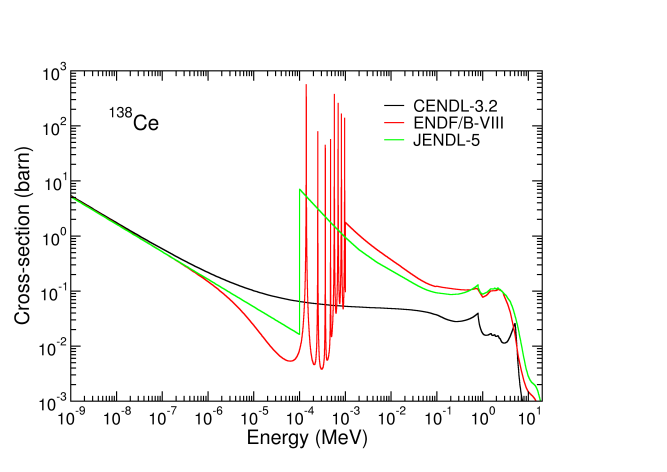
Fluctuations in the values are observed in Table 5, notably for the outlying value of (138Ce), reflecting different evaluated excitation functions (see Fig. 12 for 138Ce showing an energy dependence of different from other libraries). Nevertheless, the MACS(30 keV) values listed in Table 6 are remarkably stable; the standard deviations are taken as representing the uncertainty in the extrapolation of to a MACS at 30 keV. Table 7 summarizes all uncertainties involved in our experimental MACS values.
| Product nucleus: | 137gCe | 137mCe | 139Ce | 141Ce | 143Ce |
|---|---|---|---|---|---|
| JENDL-5 | 291.0 | 29.7 | 181.6 | 9.60 | 25.80 |
| JEFF-3.3 | 290.4 | 29.6 | 181.5 | 10.5 | 25.82 |
| CENDL-3.2 | 289.3 | 29.5 | 185.2 | 9.61 | 25.82 |
| ENDF/B-VIII.0 | 289.3 | 29.5 | 181.6 | 9.59 | 24.90 |
| ROSFOND | 289.3 | 29.5 | 181.6 | 9.59 | 25.90 |
| Mean(std. dev.) | 290.0(8) | 29.6(1) | 182(2) | 9.7(4) | 25.8(4) |
| Uncertainty are in | |||||
|---|---|---|---|---|---|
| Source of uncertainty | 137Ce | 137mCe | 138Ce | 140Ce | 142Ce |
| Target thickness | 0.4 | 0.4 | 0.4 | 0.4 | 0.4 |
| Activated nuclei(Ce) | 2.0 | 1.8 | 2.9 | 0.2 | 2.9 |
| Activated nuclei(Au) | 0.2 | 0.2 | 0.2 | 0.2 | 0.2 |
| HPGe efficiencya | 1.5 | 1.5 | 1.5 | 1.5 | 1.5 |
| Intensity (Iγ) | 0.03 | 0.03 | 0.01 | 0.01 | 0.01 |
| Simulationb | 1.8 | 1.8 | 1.8 | 1.8 | 1.8 |
| (Au) | 1.0 | 1.0 | 1.0 | 1.0 | 1.0 |
| MACS c | 0.3 | 0.3 | 1.2 | 4.1 | 1.6 |
| Total uncertainty | 3.3 | 3.2 | 4.1 | 4.9 | 4.2 |
-
•
a systematic error on calibration sources.
-
•
b includes beam energy, energy spread and geometric positioning of the activation targets.
-
•
c standard deviation of MACS values from the different libraries (Table 6).
Table 8 lists our final value and overall uncertainty of the the ) cross section measured for all stable isotopes of cerium along with the isomeric 137mCe state. The total 136CeCe (isomeric ground state feeding) of astrophysical significance is also listed. Table 9 lists the MACS values extrapolated to a larger range of temperatures relevant to different astropysical sites, using the evaluated library JENDL-5; no uncertainties are assigned for .
| Reaction | This work | Käppeler et al. (1996) | Harnood et al. (2000) | kad |
|---|---|---|---|---|
| 136Ce(n,)137gCe | 290(11) | 300(21) | ||
| 136Ce(n,)137mCe | 29.6(10) | 28.2(12) | 28.2(16) | |
| 136Ce(n,)137(g+m)Ce | 320(17) | 328(21) | ||
| 138Ce(n,)139Ce | 182(8) | 179(5) | 179(5) | |
| 140Ce(n,)141Ce | 9.7(5) | 11.0(4) | 11.5(5) | 11.73(44) |
| 142Ce(n,)143Ce | 25.8(11) | 28.3(10) | 29.9(10) |
| Temp(kT) | 136g+mCe | 138Ce | 140Ce | 142Ce |
|---|---|---|---|---|
| keV | MACS | MACS | MACS | MACS |
| 10 | 542 | 299 | 14.8 | 53.9 |
| 20 | 381 | 215 | 11.4 | 32.5 |
| 30 | 320(17) | 182(8) | 9.7(5) | 25.8(11) |
| 40 | 289 | 164 | 8.47 | 22.6 |
| 50 | 270 | 153 | 7.74 | 20.6 |
| 60 | 258 | 147 | 7.26 | 19.3 |
| 70 | 250 | 142 | 6.92 | 18.4 |
| 80 | 245 | 139 | 6.68 | 17.7 |
| 90 | 240 | 137 | 6.51 | 17.1 |
| 100 | 238 | 135 | 6.38 | 16.7 |
| 110 | 236 | 134 | 6.30 | 16.3 |
| 120 | 234 | 134 | 6.25 | 16.0 |
-
•
—
V Discussion
Our results are in general agreement with the previous experimental studies of Kaeppeler et al. Käppeler et al. (1996) and Harnood et al. Harnood et al. (2000) with slightly lower uncertainties on the MACS of 136Ce. The MACS value determined at 30 keV for the important case of 140Ce is lower by 15% than reported in previous experimental studies Käppeler et al. (1996); Harnood et al. (2000) and in the Kadonis data base kad . This lower value partially alleviates the discrepancy highlighted by Straniero et al. Straniero et al. (2014) for cerium in their study of the abundance of heavy elements in globular clusters. We note however that the resonance shape analysis done in Amaducci et al. (2021) for an isolated wave resonance at 5.64 keV leads to a resonance strength larger than those extracted from the evaluations JENDL-5 and ENDF/B-VIII.0 pointing to a possible conflict with the trend of reduced MACS of 140Ce observed in our experiment.
VI Summary
We have determined the experimental cross section of neutron capture reactions on the stable isotopes of cerium, averaged over a quasi-Maxwellian neutron spectrum at 34.2 keV. The experiment used the mA proton beam of the SARAF facility incident on the high-power Liquid-Lithium Target (LiLiT). In conjunction with detailed simulations of the experimental system, the experimental cross sections were extrapolated to MACS values at 30 keV and other temperatures relevant to the stellar process. The MACS values obtained for the important neutron-magic nucleus 140Ce is 15% smaller than previous experimental determinations, partially resolving the discrepancy in the Ce abundance observed in globular cluster stars.
VII Acknowledgments
The SARAF and LiLiT (Soreq NRC) staff is gratefully acknowledged for their dedicated help during the experiments. We thank S. Cristallo and D. Vescovi for an enlightening discussion. This work is supported in part by the Pazy Foundation (Israel) and the German Israeli Foundation (GIF) under Grant No. I-1500-303.7/2019. MP acknowledges support by the European Union (ChETEC-INFRA).
VIII Appendix
The 137mCe isomer decays predominantly (99.2%) by internal transition to the 137gCe ground state as illustrated in Fig. 11. The additional feeding of the ground state by decay of the isomeric state during irradiation, cooling, and counting time leads to small corrections of the measured yield of 137gCe decay to obtain its prompt feeding yield from the reaction.
During irradiation, the correction factor for 137gCe production can is expressed by
| (10) |
where are the respective decay constants of 137g,mCe, and the beam irradiation time and the to branching ratio, respectively. The correction to is of 0.17.
A fraction of the 137mCe nuclei produced during irradiation decays to the ground state during the cooling time tcool between end of irradiation and start of counting, given by the following expression:
| (11) |
where = e. The correction to the counted 137gCe decays is of 0.27%.
Similarly, a fraction of the 137mCe states decays to the ground state during the counting time, expressed by
| (12) |
where and are the respective number 137gCe and 137mCe activated nuclei using Eq. (1) and represents counting time. In each measurement, the contribution of the isomeric state varies from 0.4% to 0.7% of the total 137gCe population.
The corrections above are included in the coefficients listed in Table 2.
References
- Cameron (1957) A. G. W. Cameron, Publ. Astron. Soc. of the Pacific 69, 201 (1957).
- Burbidge et al. (1957) E. M. Burbidge, G. R. Burbidge, W. A. Fowler, and F. Hoyle, Rev. Mod. Phys. 29, 547 (1957).
- Käppeler et al. (2011) F. Käppeler, R. Gallino, S. Bisterzo, and W. Aoki, Reviews of Modern Physics 83, 157 (2011).
- Lugaro et al. (2003) M. Lugaro, F. Herwig, J. C. Lattanzio, R. Gallino, and O. Straniero, The Astrophysical Journal 586, 1305 (2003).
- Freiburghaus et al. (1999) C. Freiburghaus, J. F. Rembges, T. Rauscher, E. Kolbe, F. K. Thielemann, K. L. Kratz, B. Pfeiffer, and J. J. Cowan, The Astrophysical Journal 516, 381 (1999).
- Cowan and Rose (1977) J. J. Cowan and W. K. Rose, The Astrophysical Journal 212, 149 (1977).
- Denissenkov et al. (2019) P. A. Denissenkov, F. Herwig, P. Woodward, R. Andrassy, M. Pignatari, and S. Jones, Monthly Notices of the Royal Astronomical Society 488, 4258 (2019).
- Choplin et al. (2021) A. Choplin, L. Siess, and S. Goriely, Astronomy & Astrophysics 648, A119 (2021).
- Choplin et al. (2022) A. Choplin, L. Siess, and S. Goriely, Astronomy & Astrophysics 667, A155 (2022).
- Meyer (1994) B. S. Meyer, Annual Review of Astronomy and Astrophysics 32, 153 (1994).
- Choplin, A. et al. (2022) Choplin, A., Goriely, S., Hirschi, R., Tominaga, N., and Meynet, G., A&A 661, A86 (2022).
- Abia et al. (2002) C. Abia, I. Domínguez, R. Gallino, M. Busso, S. Masera, O. Straniero, P. de Laverny, B. Plez, and J. Isern, The Astrophysical Journal 579, 817 (2002).
- Aoki et al. (2002) W. Aoki, S. G. Ryan, J. E. Norris, T. C. Beers, H. Ando, and S. Tsangarides, The Astrophysical Journal 580, 1149 (2002).
- Karinkuzhi et al. (2021) D. Karinkuzhi, S. Van Eck, S. Goriely, L. Siess, A. Jorissen, T. Merle, A. Escorza, and T. Masseron, Astronomy & Astrophysics 645, A61 (2021).
- Jonsell et al. (2006) K. Jonsell, P. S. Barklem, B. Gustafsson, N. Christlieb, V. Hill, T. C. Beers, and J. Holmberg, Astronomy & Astrophysics 451, 651 (2006).
- Siqueira Mello et al. (2014) C. Siqueira Mello, V. Hill, B. Barbuy, M. Spite, F. Spite, T. C. Beers, E. Caffau, P. Bonifacio, R. Cayrel, P. François, H. Schatz, and S. Wanajo, Astronomy & Astrophysics 565, A93 (2014).
- Holmbeck et al. (2018) E. M. Holmbeck, T. C. Beers, I. U. Roederer, V. M. Placco, T. T. Hansen, C. M. Sakari, C. Sneden, C. Liu, Y. S. Lee, J. J. Cowan, and A. Frebel, The Astrophysical Journal Letters 859, L24 (2018).
- Domoto et al. (2022) N. Domoto, M. Tanaka, D. Kato, K. Kawaguchi, K. Hotokezaka, and S. Wanajo, The Astrophysical Journal 939, 8 (2022).
- Contursi, G. et al. (2023) Contursi, G., de Laverny, P., Recio-Blanco, A., Spitoni, E., Palicio, P. A., Poggio, E., Grisoni, V., Cescutti, G., Matteucci, F., Spina, L., Álvarez, M. A., Kordopatis, G., Ordenovic, C., Oreshina-Slezak, I., and Zhao, H., A&A 670, A106 (2023).
- Zinner (2014) E. Zinner, in Meteorites and Cosmochemical Processes, Vol. 1, edited by A. M. Davis (2014) pp. 181-213.
- Lodders and Fegley (1995) K. Lodders and J. Fegley, B., Meteoritics 30, 661 (1995).
- Lodders (2003) K. Lodders, The Astrophysical Journal 591, 1220 (2003).
- Amari et al. (1995) S. Amari, P. Hoppe, E. Zinner, and R. S. Lewis, Meteoritics 30, 679 (1995).
- Leitner and Hoppe (2022) J. Leitner and P. Hoppe, in LPI Contributions, LPI Contributions, Vol. 2695 (2022) p. 6252.
- Lugaro et al. (2020) M. Lugaro, B. Cseh, B. Világos, A. I. Karakas, P. Ventura, F. Dell’Agli, R. Trappitsch, M. Hampel, V. D’Orazi, C. B. Pereira, G. Tagliente, G. M. Szabó, M. Pignatari, U. Battino, A. Tattersall, M. Ek, M. Schönbächler, J. Hron, and L. R. Nittler, The Astrophysical Journal 898, 96 (2020).
- Käppeler et al. (1996) F. Käppeler, K. A. Toukan, M. Schumann, and A. Mengoni, Phys. Rev. C 53, 1397 (1996).
- Harnood et al. (2000) S. Harnood, M. Igashira, T. Matsumoto, S. Mizuno, and T. Ohsaki, Journal of Nuclear Science and Technology 37, 740 (2000), https://doi.org/10.1080/18811248.2000.9714952 .
- Amaducci et al. (2021) S. Amaducci, N. Colonna, L. Cosentino, S. Cristallo, and et al., Universe 7 (2021), 10.3390/universe7060200.
- (29) “Karlsruhe astrophysical database of nucleosynthesis in stars (kadonis v1.0),” .
- Cosner K. and Truran J. W. (1981) Cosner K. and Truran J. W., Astrophysics and Space Science 78, 85 (1981).
- Takahashi and Yokoi (1987) K. Takahashi and K. Yokoi, At. Data Nucl. Data Tables 36, 375 (1987).
- Koloczek et al. (2016) A. Koloczek, B. Thomas, J. Glorius, R. Plag, M. Pignatari, R. Reifarth, C. Ritter, S. Schmidt, and K. Sonnabend, Atomic Data and Nuclear Data Tables 108, 1 (2016).
- Young et al. (2003) P. A. Young, K. A. Knierman, J. R. Rigby, and D. Arnett, The Astrophysical Journal 595, 1114 (2003).
- Roederer et al. (2011) I. U. Roederer, A. F. Marino, and C. Sneden, The Astrophysical Journal 742, 37 (2011).
- Straniero et al. (2014) O. Straniero, S. Cristallo, and L. Piersanti, The Astrophysical Journal 785, 77 (2014).
- Sahoo, Rudra N. et al. (2023) Sahoo, Rudra N., Tessler, Moshe, Halfon, Shlomi, Kijel, Dani, Kreisel, Arik, Paul, Michael, Shor, Asher, and Weissman, Leo, EPJ Web Conf. 279, 06002 (2023).
- Tessler et al. (2016) M. Tessler, M. Paul, T. Palchan, S. Halfon, L. Weissman, N. Hazenshprung, A. Kreisel, T. Makmal, A. Shor, I. Silverman, Y. Kashiv, and R. Purtschert, in Proceedings of the 26th Int. Nuclear Physics Conf. (Adelaide, Australia, 2016) p. 139, url = https://pos.sissa.it/281/139/pdf.
- Mardor et al. (2018) I. Mardor, O. Aviv, M. Avrigeanu, D. Berkovits, A. Dahan, T. Dickel, I. Eliyahu, M. Gai, I. Gavish-Segev, S. Halfon, M. Hass, T. Hirsh, B. Kaiser, D. Kijel, A. Kreisel, Y. Mishnayot, I. Mukul, B. Ohayon, M. Paul, A. Perry, H. Rahangdale, J. Rodnizki, G. Ron, R. Sasson-Zukran, A. Shor, I. Silverman, M. Tessler, S. Vaintraub, and L. Weissman, Eur. Phys. J. A 54, 91 (2018).
- Paul et al. (2019) M. Paul, M. Tessler, M. Friedman, S. Halfon, T. Palchan, L. Weissman, A. Arenshtam, D. Berkovits, Y. Eisen, I. Eliahu, G. Feinberg, D. Kijel, A. Kreisel, I. Mardor, G. Shimel, A. Shor, and I. Silverman, Eur. Phys. J. A 55, 44 (2019).
- Ratynski and Käppeler (1988) W. Ratynski and F. Käppeler, Phys. Rev. C 37, 595 (1988).
- Friedman et al. (2013) M. Friedman, D. Cohen, M. Paul, D. Berkovits, Y. Eisen, G. Feinberg, G. Giorginis, S. Halfon, A. Krása, A. Plompen, and A. Shor, Nucl. Instrum. Methods Phys. Res. A 698, 117 (2013).
- Agostinelli et al. (2003) S. Agostinelli et al., Nucl. Instrum. Methods Phys. Res. Sect. A 506, 250 (2003).
- Tessler et al. (2015) M. Tessler, M. Paul, A. Arenshtam, G. Feinberg, M. Friedman, S. Halfon, D. Kijel, L. Weissman, O. Aviv, D. Berkovits, Y. Eisen, I. Eliyahu, G. Haquin, A. Kreisel, I. Mardor, G. Shimel, A. Shor, I. Silverman, and Z. Yungrais, Phys. Lett. B 751, 418 (2015).
- (44) https://www.nndc.bnl.gov/nudat3/ .
- Zahnow et al. (1995) D. Zahnow, C. Angulo, C. Rolfs, S. Schmidt, W. H. Schulte, and E. Somorjai, Zeitschrift für Physik A Hadrons and Nuclei 351, 229 (1995).
- Munch et al. (2018) M. Munch, O. Sølund Kirsebom, J. A. Swartz, K. Riisager, and H. O. U. Fynbo, Physics Letters B 782, 779 (2018).
- Brown et al. (2018) D. Brown, M. Chadwick, R. Capote, A. Kahler, A. Trkov, M. Herman, A. Sonzogni, Y. Danon, A. Carlson, M. Dunn, D. Smith, G. Hale, G. Arbanas, R. Arcilla, C. Bates, B. Beck, B. Becker, F. Brown, R. Casperson, J. Conlin, D. Cullen, M.-A. Descalle, R. Firestone, T. Gaines, K. Guber, A. Hawari, J. Holmes, T. Johnson, T. Kawano, B. Kiedrowski, A. Koning, S. Kopecky, L. Leal, J. Lestone, C. Lubitz, J. M. Damián, C. Mattoon, E. McCutchan, S. Mughabghab, P. Navratil, D. Neudecker, G. Nobre, G. Noguere, M. Paris, M. Pigni, A. Plompen, B. Pritychenko, V. Pronyaev, D. Roubtsov, D. Rochman, P. Romano, P. Schillebeeckx, S. Simakov, M. Sin, I. Sirakov, B. Sleaford, V. Sobes, E. Soukhovitskii, I. Stetcu, P. Talou, I. Thompson, S. van der Marck, L. Welser-Sherrill, D. Wiarda, M. White, J. Wormald, R. Wright, M. Zerkle, G. Zerovnik, and Y. Zhu, Nucl. Data Sheets 148, 1 (2018).
- Lederer et al. (2011) C. Lederer, N. Colonna, C. Domingo-Pardo, F. Gunsing, Käppeler, et al., Phys. Rev. C 83, 034608 (2011).
- Massimi et al. (2014) C. Massimi, B. Becker, E. Dupont, S. Kopecky, C. Lampoudis, R. Massarczyk, M. Moxon, V. Pronyaev, P. Schillebeeckx, I. Sirakov, and R. Wynants, Eur. Phys. J. A 50, 124 (2014).
- Feinberg et al. (2012) G. Feinberg, M. Friedman, A. Krása, A. Shor, Y. Eisen, D. Berkovits, D. Cohen, G. Giorginis, T. Hirsh, M. Paul, A. J. M. Plompen, and E. Tsuk, Phys. Rev. C 85, 055810 (2012).