Lower Quantity, Higher Quality: Auditing News Content and User Perceptions on Twitter/X Algorithmic versus Chronological Timelines
Abstract.
Social media personalization algorithms increasingly influence the flow of civic information through society, resulting in concerns about “filter bubbles”, “echo chambers”, and other ways they might exacerbate ideological segregation and fan the spread of polarizing content. To address these concerns, we designed and conducted a sociotechnical audit (STA) to investigate how Twitter/X’s timeline algorithm affects news curation while also tracking how user perceptions change in response. We deployed a custom-built system that, over the course of three weeks, passively tracked all tweets loaded in users’ browsers in the first week, then in the second week enacted an intervention to users’ Twitter/X homepage to restrict their view to only the algorithmic or chronological timeline (randomized). We flipped this condition for each user in the third week. We ran our audit in late 2023, collecting user-centered metrics (self-reported survey measures) and platform-centered metrics (views, clicks, likes) for 243 users, along with over 800,000 tweets. Using the STA framework, our results are two-fold: (1) Our algorithm audit finds that Twitter/X’s algorithmic timeline resulted in a lower quantity but higher quality of news — less ideologically congruent, less extreme, and slightly more reliable — compared to the chronological timeline. (2) Our user audit suggests that although our timeline intervention had significant effects on users’ behaviors, it had little impact on their overall perceptions of the platform. Our paper discusses these findings and their broader implications in the context of algorithmic news curation, user-centric audits, and avenues for independent social science research.
1. Introduction
Social media algorithms increasingly mediate civic information for digital users (Newman et al., 2023). Platforms such as Twitter/X 111N.B.: For consistency throughout this paper and with prior research, and because its name was changed during the course of this research, we refer to the platform formerly known as Twitter, now known as X, with both names, as Twitter/X ., Facebook, and YouTube not only afford users agency in selecting content based on their preferences, but also act as algorithmic intermediaries by ranking, filtering and recommending content to users (Thorson and Wells, 2015), significantly influencing their online engagement (Munger and Phillips, 2022; Guess et al., 2023). Yet despite a majority of the platform’s 200+ million daily users using Twitter/X as a source of news information (News, 2022), how Twitter/X ’s feed ranking algorithm affects news curation remains opaque, with open questions surrounding its effects on users’ behaviors and perceptions. This raises several concerns for the general public and for democracy, as algorithms may exacerbate asymmetric exposure to radical or unreliable information (Roose, [n. d.]; Lazer et al., 2018), reinforce people’s selectivity bias for news consumption (Pariser, 2011), and thereby play a role in undermining social cohesion in democratic societies (González-Bailón and Lelkes, 2023).
This study aims to address a set of questions surrounding Twitter/X ’s algorithm by comparing the effects of the algorithmic timeline and the chronological timeline on the news content available on Twitter/X , and also on users’ experiences with their news information environment. By intervening in the web browsing experience of participants and enforcing a week of algorithmic and chronological timeline displays, we audit (1) the effect that each condition has on the algorithm’s outputs, in terms of news density, ideological congruence, extremity, and reliability; and (2) the effect of these different algorithmic environments on user behaviors and perceptions — users’ exposure to news, engagement with news, and attitudes and beliefs about their information environment and the platform itself.
We address these questions through a sociotechnical audit (Lam et al., 2023) with N=243 participants, conducting a three week web-based experiment during which we collect the tweets loaded in participants’ browser viewports, and make in situ interventions on their Twitter/X timelines. We also deploy four surveys throughout the study to measure participants’ changing perceptions over the course of the study, which was deployed in late 2023. Modeled after other sociotechnical audits (Lam et al., 2023), our experiment consists of a one week observational phase during which no alterations are made to users’ browsing experience, and a two week intervention phase during which our system intervenes on webpage content, enforcing that each user only sees the algorithmic or chronological timeline when visiting the Twitter/X homepage for one week, then flips this condition for each participant in the following week.
Our paper extends the sociotechnical audit method to study the effect that different types of algorithm-curated social media feeds have on (1) the news content output of the timeline, and (2) the user, in terms of behavioral and perceptual changes driven by different content. Over our three-week study we collect over 800,000 tweets seen by our 243 participants. We report findings from the observational phase that corroborate prior work: the algorithmic timeline reduces the number of tweets with external news links, and partisans on different sides of the aisle show differences in terms of exposure to cross-cutting news. We also present experimental evidence from the intervention phase showing that the algorithmic timeline exposes users to less news content, but that the sources of that content are significantly less ideologically congruent, significantly less extreme, and marginally more reliable than those shown in the chronological timeline. This suggests that although Twitter/X ’s timeline curation algorithm decreases the amount of news users see, the algorithm may also have a politically moderating effect on the news content shown on the platform. Through behavioral and survey data we also find that although users are sensitive to differences in the ideological bias of the news they are exposed to (and despite our intervention making swift and sizeable changes to their Twitter/X content), their self-reported perceptions and attitudes largely remain stable throughout the experiment. In other words, we identify a gap between behavior and perception in response to algorithmic changes, which suggests that attitudes are more resilient to interventions in algorithmic content. Our paper discusses this divergence in user behavior and perception in response to algorithmic change, and we conclude by suggesting opportunities for future user-centered research to evaluate not just the technical output, but also the user effects of algorithmic systems.
2. Related Work
Our study aligns with the existing body of research investigating the impact of algorithmic curation on individuals’ online information behaviors, following scholarly concerns of ideological segregation and misinformation on social media sites (González-Bailón and Lelkes, 2023; Lazer et al., 2018). However, this area of study has encountered two primary challenges — an inability to experimentally manipulate algorithms for real users (Bruns, 2019) and restricted access to user metrics data (Davidson et al., 2023) — which have limited the capacity of researchers to directly address algorithmic effects on users. Motivated by existing work in algorithm auditing and algorithmic bias, this study aims to advance methodology and examine how algorithms affect users’ behaviors and perceptions in the Twitter/X ecosystem. We first review the existing research on algorithm audits followed by that on personalization algorithms before articulating the research questions and hypotheses.
2.1. Algorithm Audits
Algorithm audits are empirical studies that systematically investigate potential biases inherent in socio-technical systems through iterative input queries and observations of algorithmic outputs (Metaxa et al., 2021). Such methods have been widely employed to study social media platforms such as YouTube, Facebook, Twitter/X , and search engines such as Google and Bing (Bandy, 2021). Through algorithmic audits, studies have investigated societal problems including social discrimination (Lambrecht and Tucker, 2019; Sandvig et al., 2014), radicalization (Ribeiro et al., 2021), ideological amplification (Huszár et al., 2022), and political polarization (Metaxa et al., 2019; Robertson et al., 2018) on these platforms.
2.1.1. Sock puppet audits
A large body of the previous work audits algorithms with sock puppet accounts: artificial user accounts created for research purposes (Sandvig et al., 2014). For instance, Haroon et al. (2023) trained sock puppets into one of the five ideologies from left to right to examine the ideological bias and radicalization in YouTube recommendations.
Auditing Twitter/X , Bartley et al. (2021) examined the personalization algorithms with eight bot accounts, finding that the platform’s algorithms display recency and popularity biases when curating friends’ posts. Similarly, researchers have emulated archetypal users to investigate how the Twitter/X timeline curates news and political content, finding that algorithmic curation deprioritized external links but slightly favored low-quality news sources (Bandy and Diakopoulos, 2021a, b). Moreover, they found that algorithmic curation increased source diversity but amplified topical clusters of political content.
2.1.2. Audits with real users
Recent audits have increasingly begun involving real users in data collection (Huszár et al., 2022; Guess et al., 2023; Robertson et al., 2023). Since researchers often lack access to modify platforms’ algorithms, institutional support and/or collaboration are usually essential for these studies. For example, Twitter/X randomly excluded 1% of all users as a control group whose timelines remained in chronological order, such that researchers were able to conduct a quasi-experiment, finding Twitter/X amplified political content with an asymmetric effect for right-wing sources (Huszár et al., 2022). In another example, Guess et al. (2023) collaborated with Meta to examine the algorithmic effects on users’ behaviors and attitudes, randomly assigning Facebook and Instagram users to either the algorithmic or chronological feed condition. Using this powerful experimental setup at large scale, researchers found some behavioral differences between users in the algorithmic and chronological feed conditions, but did not detect attitudinal changes during the period (Guess et al., 2023).
Such collaborations with companies can draw criticism regarding researcher independence (Wagner, 2023), and are also largely out of reach for most research teams. To overcome these issues, some research groups have developed custom software to collect users’ platform activities and conduct audits (Lam et al., 2023; Robertson et al., 2023, 2018). In such studies, which inform our own, researchers have invited crowdworkers to install browser extensions that automatically collect data like HTML snapshots of specific pages (Robertson et al., 2023) or ad content loaded in the browser (Lam et al., 2023).
2.1.3. Sociotechnical auditing
One recent algorithm audit with real users by Lam et al. (2023) coined the term “sociotechnical audit” or STA, to describe audits that combine a traditional algorithm audit’s focus on understanding algorithmic content with user-focused methods like randomized controlled experiments (they term the latter “user audits”). Motivated by a lack of prior work at the intersection of algorithmic content and its effects on users, we conduct a sociotechnical audit of Twitter/X . In keeping with prior work, we recruit crowdworkers who install our custom software (as described in Section 4), after which we both collect a baseline of their Twitter/X timeline. We then conduct an intervention to causally explore the impact on algorithmic content (timeline news content) and on users (measures like news trust and engagement) comparing chronological and algorithmic feeds.
2.2. Online News Environments and Algorithmic Effects
Understanding online news behaviors is a major research agenda in multiple fields, including political science (Guess, 2021; Peterson et al., 2021; Guess et al., 2023; Messing and Westwood, 2014); information science (Bakshy et al., 2015; Cinelli et al., 2021); communication (Yang et al., 2020; Zhou et al., 2023; González-Bailón et al., 2023); economics (Gentzkow and Shapiro, 2011); and computer science (Haroon et al., 2023; Robertson et al., 2023), specifically including CSCW (Robertson et al., 2018; Metaxa et al., 2019; Bandy and Diakopoulos, 2021b). The theoretical foundation of this line of study is rooted in democratic norms, and the idea that obtaining unbiased and reliable news is necessary for citizens to engage in civic life (Carpini and Keeter, 1996). Correspondingly, the rise of personalization algorithms raises several scholarly concerns regarding biases in online news ecosystems, including filter bubbles (algorithms that only show users ideologically congruent content) (Pariser, 2011; Bakshy et al., 2015; González-Bailón et al., 2023), extreme content (Ribeiro et al., 2021; Haroon et al., 2023), and misinformation (Lazer et al., 2018; Hussein et al., 2020). Below, we explore those three areas, as well as prior work on news engagement and user perceptions in order to situate our later findings, which investigate each.
2.2.1. Ideological congruence
One of the major concerns of algorithmic curation is its potential to create filter bubbles — silos where users see information that is aligned with their preexisting beliefs (Pariser, 2011). Research to date has shown mixed evidence regarding this concern, finding that people are exposed to considerable cross-cutting information online (Bakshy et al., 2015; Flaxman et al., 2016), but that personalization algorithms do amplify like-minded content (Guess et al., 2023; Haroon et al., 2023). While previous studies have shown YouTube and Facebook’s algorithms favor ideologically congruent content, direct evidence is missing for Twitter/X , especially in the time following the platform’s takeover by Elon Musk. Indirect evidence from the previous work suggests Twitter/X algorithms tended to amplify partisan content, especially for right-wing sources (Huszár et al., 2022). In a sock puppet audit, researchers also found some evidence suggesting the partisan differences would be exacerbated by Twitter/X’s algorithms (Bandy and Diakopoulos, 2021b). Inspired by sock puppet results, we hypothesize that personalization algorithms will increase users’ exposure to ideologically congruent news sources on Twitter/X .
2.2.2. Extreme content
Radicalization refers to the concern that algorithmic curation constantly exposes users to extreme or resentful information (Roose, [n. d.]). Many studies have investigated YouTube video recommendations in response to such concerns, finding consistent radicalization results for a small proportion of politically extreme users (Haroon et al., 2023; Ribeiro et al., 2021; Ledwich and Zaitsev, 2019). When probing other platforms, researchers also found some evidence indicating algorithmic bias in terms of extreme content. For instance, researchers showed that content in the Facebook algorithmic feed condition came from less moderate sources and contained more uncivil content and slur words (Guess et al., 2023). Research on Twitter/X remains open; some researchers have found that the platform does not amplify far-right or -left content (Huszár et al., 2022) while others have found that it does amplify emotional content and outgroup animosity (Milli et al., [n. d.]). Based on prior work on other platforms, as well as the public perception in the post-Musk era (Ray and Anyanwu, 2022), we hypothesize that users with the algorithmic Twitter/X feed will also see more extreme news sources.
2.2.3. News reliability
A third line of study is misinformation, concerning whether algorithmic curation propagates unreliable news content (Hussein et al., 2020; Srba et al., 2023; Pathak et al., 2023; Fernández et al., 2021). Audit studies on YouTube have documented feedback loop effects, in which users who view misinformation videos are recommended more in the future (Hussein et al., 2020; Srba et al., 2023). Other work has investigated how different recommendation algorithms amplify misinformation based on Twitter/X user metrics (Fernández et al., 2021; Pathak et al., 2023). However, little work on the platform takes a user-centric approach to this question; in this work, we examine whether Twitter/X’s algorithmic feed amplifies real users’ exposure to unreliable news.
2.2.4. News exposure and engagement
Fourth, we attempt to characterize user exposure to news on Twitter/X . Since social media algorithms tend to deprioritize political content and news (Guess et al., 2023; Huang and Yang, 2024), specifically tweets with external links on Twitter/X (Kirshner, 2023), we hypothesize that people will see less news in Twitter/X ’s algorithmic timeline condition. In addition to the concerns regarding news exposure, research interest also focuses on users’ engagement with news content online. Engagement behaviors are defined as comments, likes, and reshares of social media posts (Lee et al., 2018). Guess et al. (2023) found Facebook and Instagram users had significantly more news engagement on the platform under the algorithmic feed condition than in the chronological feed condition. The recent code release of Twitter/X’s recommendation algorithms also suggests engagement data is heavily prioritized (Twitter, 2023a). Given this emphasis on engagement — a central logic of the audience attention economy — we hypothesize that this will also affect news delivery, with Twitter/X’s algorithmic feed increasing people’s engagement with news on the platform.
2.2.5. Users’ perceptions
Our final area of focus is users’ perceptions related to social media algorithms, since these perceptions may be even more important than reality in shaping their attitudes and behaviors (van Setten et al., 2017). Existing work suggests laypeople are aware of personalization algorithms and able to make sense of them from day-to-day interactions, though these perceptions may not always be factually true (Eslami et al., 2015; DeVito et al., 2017; Rieder et al., 2018; Bandy and Diakopoulos, 2021b). To investigate this topic in the context of Twitter/X and news media, we collect content and behavioral data on users’ perceptions of different timelines alongside surveys asking users about their perceptions of the system.
3. Research Questions & Hypotheses
Structuring our study as a sociotechnical audit as established in prior work, we separate our research questions and hypotheses into three key segments: first, results from our observation-only control week; second, from our two weeks of intervention, algorithm audit results (focusing on the different timelines’ impacts on news content on Twitter/X ), and user audit results (speaking to the timelines’ impacts on users’ behaviors and perceptions). Having described our motivations for these questions and hypotheses above (Section 2), we enumerate them below for clarity and ease of reference. Each of these research questions and hypotheses were also pre-registered before the study. 222Anonymized preregistration is available at https://osf.io/5gbfd?view_only=b56b4bae74a5417d902efc95e24a060e
Observational Results
The following research questions (for which we did not have explicit hypotheses) pertain to our observational data collection, and users’ normal pre-intervention browsing behavior:
-
RQ1
What fraction of tweets normally viewed come from the algorithmic and chronological timelines, respectively?
-
RQ2
How much news do users normally see, and how biased are the news sources?
Intervention Results: Algorithm Audit
The following hypotheses pertain to our algorithm audit, which speaks to the effect of different feeds (algorithmic and chronological) on Twitter/X news content:
-
H1
(News density) The algorithmic timeline has a lower density of news content relative to chronological.
-
H2
(Ideological congruence) Algorithmic curation amplifies ideologically congruent news content relative to chronological.
-
H3
(News extremity) Algorithmic curation amplifies extreme news content relative to chronological.
-
H4
(News reliability) Algorithmic curation amplifies unreliable news content relative to chronological.
Intervention Results: User Audit
Finally, the remaining hypotheses and questions speak to differences in users’ experiences driven by the different feeds, including behavioral differences (for which we had explicit hypotheses) and perceptual ones (for which we did not):
-
H5
(User exposure) Users will see less news content on the algorithmic timeline compared to chronological.
-
H6
(User engagement) Users will engage more with news content on the algorithmic timeline compared to chronological.
-
RQ3
(User perceptions) How do different timelines affect users’ perceptions of the platform’s algorithmic curation and news ecosystem?
4. Method
Our method includes infrastructure for our sociotechnical audit, study design, participant recruitment, and surveys.
4.1. Sociotechnical Audit and Infrastructure
To investigate our research questions, we followed the sociotechnical audit (STA) method as defined in prior work (Lam et al., 2023). Sociotechnical audits combine a standard algorithm audit with a user audit, to understand algorithmic content alongside the effects of that content on users. In our STA, we collected the web browsing content of consenting, compensated participants and exposed them to varied algorithmic content on the Twitter/X home timeline to observe the impact on their behaviors and perceptions. This structure, and the infrastructure we describe in the sections that follow, allow us to collect fine-grained information about the content users encounter in naturalistic settings, and to enact in situ interventions on the Twitter/X timeline without internal access to the platform, over an extended period of time.
4.1.1. Infrastructure
To execute our STA, we developed browser-based infrastructure that allowed us to collect participants’ web browsing behavior, deploy custom surveys and conduct experiments on their Twitter/X timeline. The system is composed of a web application, a Chrome browser extension and a data analysis pipeline.
The web application was developed in Python as a Django web app hosted on Heroku, a cloud application platform. Data was stored in an Amazon RDS Postgres database. The web app serves as the server and database from which we managed the experiment details and deployed logic to enact interventions for participants at the right time. The web app also has a participant-facing interface with which participants can provide consent, onboard, take surveys and view key information about their enrollment in the study throughout the study period.
The custom Google Chrome browser extension captures tweets that load into the participant’s viewport as well as URLs embedded in the tweet and participants’ engagement (whether they liked, commented on, or retweeted). The browser extension enacts the logic to alter Twitter/X webpage code and enforce the chronological or algorithmic timeline when users view their Twitter/X homepage. Data is sent to and received from the web app described above.
The data analysis pipeline consists of a Python script hosted on an Amazon EC2 instance. Because Twitter/X shortens all external URLs appearing in tweets to a t.co domain, we configured our script to run periodically and resolve all collected URLs to their final domain, before annotating each resolved domain with bias and reliability scores published by Ad Fontes Media, a commonly-used dataset in such studies (Ad Fontes Media, 2023).
4.2. Study Design
Next we provide details of our study design, including the study phases and participant recruitment, management, and compensation. The study, as described below, was approved by both the University of Pennsylvania and Stanford University Institutional Review Boards.
4.2.1. Study Phases

[short]long
Our study was designed in three phases, each lasting one week: observation, a first intervention, and a second intervention, as visualized in Figure 1. During the observation week we made no alterations to the user experience on Twitter/X (or elsewhere) and passively collected all tweets that scrolled into view in participants’ browser viewports. We also collected views, likes, retweets, and comments on — as well as external URLs within — all tweets.
Twitter/X currently offers users two different timelines: a reverse-chronological one comprised only of tweets from those the user follows, called “Following”, and an algorithmically-curated one that also includes content from others the user does not follow, called “For You”. During the first intervention phase, we randomly assigned each participant to one of two conditions: algorithmic (the “For You” timeline) and chronological (the “Following” timeline). Our software enforced that participants in the algorithmic condition could only see the algorithmic timeline when visiting their Twitter/X homepage (twitter.com), while participants in the chronological condition could only view the chronological one. In the second intervention phase we switched the randomly-assigned condition for each participant.
4.3. Participants
We recruited participants from Prolific once a week during November and December 2023. A total of 822 participants onboarded and completed the background survey; of those, 243 participants were promoted to and completed the first intervention phase and therefore have their data included in our analyses. Participants from whom we did not collect any tweets during the observation phase were not promoted in the study beyond the first week observation phase. A total of 218 participants reached the end of the second intervention phase and completed all accompanying surveys. For our analysis we consider all participants who provided at least some data during the observational and intervention periods thus arriving at a final total of N=243 Twitter/X users. Our sample was 68% male, 62.5% lean Democrat, with 85% reporting some level of college education. A visual breakdown of our users’ demographics can be found in Appendix A.3.
4.3.1. Participant Recruitment and Management
We first recruited participants on the Prolific academic crowdsourcing platform to take a 1-minute pre-screening survey to identify participants eligible for the main study. To be eligible, we asked that users live in the United States, be at least 18 years old, use Google Chrome as a main web browser, use Twitter/X , and access Twitter/X from their main web browser at least a few times per week. All participants who completed the pre-screen survey were compensated $0.25 (approximately $15/hour), regardless of eligibility for the main study. Eligible participants were then directed to another page notifying them of the main study hosted on our own website (https://intervenr.stanford.edu/).
When onboarding to the main study, participants were presented with a consent page asking whether they were interested in participating in a research study that would entail sharing their browsing behavior. Consenting participants then completed a first survey in which they self-reported their partisan identification on 7-point scales consistent with ANES measures (‘strong Democrat’ to ‘strong Republican’ as well as ‘extremely liberal’ to ‘extremely conservative’) and other demographic information including age, race, gender, household income, and level of education.
During the full three-week study, we compensated participants $5 for each milestone requiring their active effort in the study. These were the four surveys, as visualized in Figure 1: onboarding (survey 1), a survey after the observation week (survey 2), a survey after the first intervention week (survey 3), and a final survey (survey 4). Each survey required about 10-15 minutes to complete, so this amounted to an estimated rate of $20/hr. Participants received compensation via payment on Prolific. We also used Prolific’s direct messaging system to communicate with participants during the study and notify them of survey tasks and offboarding procedures. We also assisted participants experiencing technical issues throughout the study, and notified participants when 72 hours elapsed without any data collected to ensure correct study enrollment.
4.4. Survey Design
Several of our research questions and hypotheses pertain to users’ perceptions. In addition to the technical infrastructure we developed to capture behavioral methods, described above, we surveyed participants to measure these. We surveyed participants a cumulative three times (surveys 2, 3, and 4) (see Figure 1). In each survey we asked questions about user perceptions in the following main categories, briefly described below. For the full survey, see Appendix A.1.
Perceived echo chambers
While there has been extensive research on echo chambers, the literature on perceived echo chambers is still sparse. Therefore, the following conceptualization of perceived echo chambers is in line with the measures of echo chambers from observational studies: We measured participants’ perceptions of echo chambers by asking them to roughly estimate the ideological bias of the news on Twitter/X in the past week for their own timeline, for a typical Democrat’s timeline, for a typical Republican’s timeline, and overall on Twitter/X . All were answered on a 100-point feeling thermometer ranging from “extremely liberal” to “extremely conservative”.
Media satisfaction
We measured users’ satisfaction with news content by asking whether they were satisfied with the news information they saw on Twitter/X in the last week, and with their experience on the platform overall, both on 5-point Likert scales (“extremely unsatisfied” to “extremely satisfied”).
Perceived news credibility and media trust
We asked participants to estimate the credibility of the news information they see on Twitter/X (from “extremely low credibility” to “extremely high credibility”) and their trust of that information (from “extremely distrust” to “extremely trust”), both measured on 5-point Likert scales.
Perception of the platform
To measure their perceptions about the platform, we asked participants whether Twitter/X is generally neutral, or whether it instead tends to support liberals or conservatives, answered on a 5-point Likert scale (”primarily supports liberals’ posts” to ”primarily supports conservatives’ posts”). We also asked about the extent of their support for the regulation of social media companies like Twitter/X on a 5-point Likert scale (”strongly agree” to ”strongly disagree”).
4.5. Final Dataset
Over the course of the study period we collected a total of 952,787 tweets, which resulted in 846,494 tweets from our final pool of participants after accounting for attrition; we conduct all further analyses with this dataset. Of those, 313,517 tweets were collected in the observational phase; 253,471 were collected in the first intervention phase; and 279,506 were collected in the second intervention phase. Users engaged (liked, commented, retweeted) with 1.89% (16,014) of all tweets collected. A majority of our tweet collection (70.5%, 596,763 tweets) were unique as determined by tweet ID, and 1.89% (14,817) tweets contained external news URLs identified using media-bias and reliability labels provided by Ad Fontes Media (Ad Fontes Media, 2023). Ad Fontes Media evaluates the U.S. media ecosystem and produces a proprietary media bias product that rates 2,796 information services’ ideological slants (ranging from the most liberal at -42 to the most conservative at +42) and news credibility (ranging from the least credible at 0 to the most credible at 64). The rating has been used and validated in various HCI, communication, and general-interest publications (Zhou et al., 2023; Huszár et al., 2022; Haq et al., 2022).
Our data includes tweets collected on the Twitter/X timeline, as well as on other Twitter/X surfaces (e.g. Profile, Explore feed, Communities), in order to fully capture the impact of our interventions. For instance, enforcing that a user see a feed that shows tweets from users they do not follow (as we did in the algorithmic condition) may prompt them to view some new users’ profiles and consume many more tweets in the process. This whole consumption pattern is inextricable from the intervention, so we consider all tweets seen during the study rather than restricting to timeline-only content.
4.6. Ethics
We took care throughout the deployment of our tool, as well as in the design and roll-out of our study, to prioritize participants’ privacy and agency during their participation. This included a webpage for participants to view and redact data they did not want us to have, and fair payment (compensating over $15 per hour by estimates of the time users would spend enrolling, onboarding, answering surveys, and offboarding). By the same motivation, although we understand the value in open science, in favor of preserving user privacy we will not be releasing any data collected from participants, since our data document their entire Twitter/X timelines as well as their browsing behavior on the platform. Finally, although we are considering open-sourcing the software for other researchers to use, we are still in the process of analyzing possible risks of doing so, and thus have not included it with this paper.
5. Results
We report our study results next, beginning first with initial results from the observation-only week in Section 5.1, and then describing our algorithm auditing results and user audit results. Each subsection that follows corresponds to a research question or hypothesis with the same name, as laid out in Section 3.
5.1. Observation Week Results
We first characterize at a high level users’ general information behaviors on Twitter/X using results from the week-long observational phase of our study. On average, users saw 1,306 tweets during the observational phase; 24.0% of their tweets were loaded in the algorithmic timeline, 9.4% in the chronological timeline and 66.6% in other, non-timeline surfaces on Twitter/X . Somewhat surprisingly, although users tended to get their timeline content in the engagement-optimized algorithmic feed, which is also the default when visiting the Twitter/X website, their behavior reflected a tendency by many users to switch back and forth between the two: 43% of participants saw tweets from both timelines during the observational phase. Also notable was the high proportion of tweets users saw outside of their Twitter/X timelines, which contrasts with the predominant focus of most prior work studying only the timeline (Bandy and Diakopoulos, 2021b; Bartley et al., 2021; Milli et al., [n. d.]).
In terms of differences in exposure to news domains, 1.6% of tweets in the average algorithmic timeline contained a news URL, 7.5% in the average chronological timeline and 1.0% in non-timeline contexts. This is consistent with prior work showing that Twitter/X ’s algorithmic timeline deprioritizes external links (Bandy and Diakopoulos, 2021b), and is also supported by the recent open-sourcing of Twitter/X ’s algorithm which suggests that tweets containing external links are filtered and deprioritized in the algorithmic “for you” timeline (Twitter, 2023b).
Examining differences in partisans’ cross-cutting news exposure: in the chronological timeline, right-leaning users (those answering “extremely” to “slightly” conservative) saw a moderate amount of news links from left-leaning news domains (13.5% of all news links). Meanwhile, left-leaning users saw very little news from right-leaning domains (1.5%). We saw similar patterns in users’ algorithmic timeline content; right-leaning users saw 11.8% of their news links from left-leaning domains while only 2.7% of news links for left-leaning users were from right-leaning news domains. This asymmetry is consistent with older work on other platforms suggesting that right-leaning users are more exposed to ideologically cross-cutting content than left-leaning users (Bakshy et al., 2015).
5.2. Algorithm Audit Results
Moving on to our two weeks of intervention data and accompanying surveys, we first present algorithm auditing results that compare the algorithmic and chronological feeds in terms of news-related metrics, including the amount of news to which users were exposed, the partisan bias of that content, and its reliability. We statistically test each of these outcome measures using mixed-effects models, in which we include participant ID as the random effect to control for differences between participants. All following analyses use user as the unit of analysis, so that each user has three observations in the dataset, corresponding to their behavioral and perceptual indicators across the three weeks.
[short]long
H1. News density
Normalizing by the number of tweets seen in each condition, we confirm our hypothesis that the chronological condition has a greater density of news content (3.26%) than the algorithmic condition (0.94%).
H2. Ideological congruence
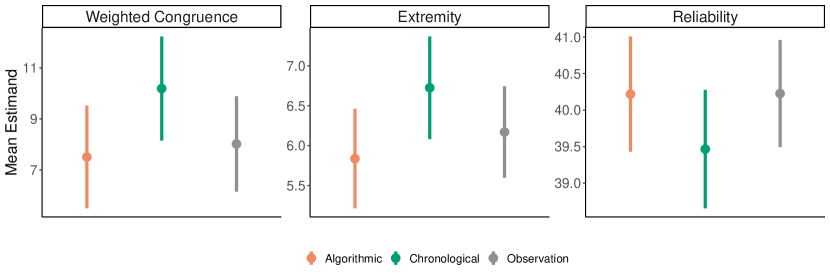
To measure user exposure to like-minded content, we compute the weighted congruence score for each user’s exposure to news content by multiplying the news domain’s media bias and the user’s ideological leaning. For example, when an “extremely liberal” user (ideology labeled as -3) is exposed to a news link from the New York Times (media bias labeled as -8.13 by Ad Fontes Media), we quantify the level of congruence as . Similarly, if a “slightly conservative” user (ideology labeled as +1) is exposed to the same link, such instance will be quantified as congruence. We find that participants were exposed to significantly more ideologically congruent news content in the chronological condition than in the algorithmic (, , ). In other words, contrary to our hypothesis, we find that the algorithmic condition causes users to see less ideologically congruent news sources (Figure 2).
H3. News extremity
To evaluate the extremity of news sources, we compute the mean absolute bias. For example, the bias of a news link from the left-leaning New York Times, which Ad Fontes labels at -8.13 will be converted to 8.13, and a link from the far-right news site NewsMax (media bias labeled as +21.17 by Ad Fontes Media) will be kept as 21.17. We average these absolute bias scores for each user’s three weeks and analyze how they have changed across the three weeks. Contrary to our hypothesis, we find that participants are exposed to more extreme news sources when in the chronological condition than in the algorithmic condition (, , ) (Figure 2).
H4. News reliability
Consistent with prior work on conservatives’ news environments, our data also showed that conservatives see significantly more unreliable news at the user level, regardless of experimental condition (, , ). We had hypothesized that the algorithmic feed would show less reliable news content; however, comparing the different timelines, we did not see statistically significant differences of news reliability between the two experimental conditions (Figure 2).
5.3. User Audit Results
To better understand the impact of the different feeds on users, we conducted our study as a sociotechnical audit, that pairs a user audit with a more traditional algorithm audit. Next, we outline the findings of our user audit, comparing the impact of algorithmic and chronological timelines on users’ engagement with news and their perceptions of the platform from various survey measures.
[short]long
H5. User exposure
We used mixed effect models to analyze our data, including participant ID as the random effect to control for differences between participants. Analyzing for the number of tweets seen by participants between the two experimental conditions, we found that the number of tweets containing news URLs was significantly higher in the chronological condition compared to the algorithmic condition (, , ). In other words, we confirm our hypothesis the algorithmic timeline seems to de-prioritize showing tweets with news links to our participants (Figure 3).
H6. User engagement
Results showed that the number of tweets participants loaded in their browsers was significantly higher when participants were in the algorithmic condition, compared to the chronological condition (, , ). Similarly, users also engaged (i.e., liked, commented, and retweeted) more with tweets when in the algorithmic condition, compared to the chronological condition (, , ). In other words, confirming our hypothesis, users use Twitter/X and engage with tweets more when they are in the algorithmic condition (Figure 3).
Turning to engagement with tweets containing news links, however, there was no significant main effect of the different conditions on participants’ like, comment, or retweet behaviors (, , n.s.). In other words, while the algorithmic timeline led to greater user engagement overall (and fewer news links, as we saw above), user engagement with these news tweets did not significantly differ between the two conditions (Figure 3).
RQ3. User perceptions
We report findings on user perceptions: their reported satisfaction, perceptions of the platform, and perceptions of other users’ experiences.
User satisfaction.
We conducted exploratory analyses (without explicit hypotheses) to test the effect of our timeline intervention on Twitter users’ perceptions and attitudes toward the platform and media content. A repeated-measure ANOVA showed that the overall satisfaction of user experience on Twitter differed among the three conditions (observation, chronological , and algorithmic ) (, ). Users were significantly more satisfied with their user experiences during the observation (i.e., no treatment) stage (), compared to both chronological () or algorithmic (), which did not significantly differ between each other.
User perceptions of Twitter/X . To test whether participants who see tweets with more biased news links adjust their perceptions of the bias of their own timelines, we employed a within-subject mixed-effects model, where we regressed their perceptions (i.e., the self-reported estimate of ideological bias of news on one’s own timeline) on users’ behaviors (i.e., the actual mean ideological bias of news they saw on their timeline). We again include participant ID as a random effect. We found that there was a significant association between the perceptions of bias and actual news bias on Twitter/X (, , ). User exposure to biased news links, however, did not change their perceptions of the average bias of all news links available on Twitter (, , n.s.). Such exposure also did not change their perceptions of whether the Twitter/X algorithm favors conservatives or liberals (, , n.s.).
We also investigated users’ assessments of news credibility and media trust in the news content they see on Twitter/X . With participant ID as a random effect, we regressed participants’ self-reported news credibility and media trust across all three conditions on the mean reliability of the news links to which they were exposed. We found a significant and negative association, indicating that participants who saw more reliable news actually perceived lower news credibility (, , ) and reported less trust (, , ) in the news they saw. The conditions themselves, however, did not significantly change self-reported media trust (, n.s.) and user perceptions of news credibility (, n.s.).
Users’ perceptions of other users. Next, we test how users’ exposure to news links changes their perceptions of how biased an average Democrat’s or Republican’s Twitter/X timeline is. We regressed such perceptions on the mean ideological bias of the news links users were personally exposed to, controlling their own partisanship affiliation and with participant ID as a random effect. We found a significant negative main effect of the ideological bias of news exposure on their estimation of news bias on Republican timelines (, , ). In other words, exposure to more conservative news links is associated with the perception that a typical Republican’s timeline was less conservative than participants previously thought. On the other hand, we found a significant and positive main effect of the ideological bias of news exposure on their estimation of news bias on Democrat timelines (, , ). Put differently, exposure to more liberal news links is associated with the perception that a typical Democrat’s timeline was more liberal than participants previously thought. Our association tests, by connecting news exposure during the week with news perceptions at the end of the week, cannot constitute true causal claims. However, these divergent patterns do implicate such causal possibilities in the Twitter/X news ecosystem.
6. Discussion
The study we present here provided a sociotechnical audit of Twitter/X timelines. By using a browser extension to collect real users’ data and intervene in the display order of their timeline tweets (showing them one week of their algorithmic and chronological timelines each, in random sequence), we offer the first systematic and up-to-date exploration of users’ experiences using Twitter/X in a post-Musk age. Notably, this study follows the recent development of methods for obtaining ecologically valid exposure data, i.e., measuring the content that real users are exposed to during natural platform use (Robertson et al., 2023; Guess et al., 2023). Based on our observational data, we reported where and what people saw on Twitter/X — on average, the sampled users saw more than a thousand tweets during the observation week, with more than half of those tweets coming from non-timeline surfaces. By pairing users’ self-reported ideology with the bias of news sources they were exposed to, we were able to corroborate past findings of partisan differences in news exposure (Section 5.1). Such observational results, we believe, are valuable supplementary observations to prior work on Twitter/X ’s information ecosystem (Pfeffer et al., 2023). Also of note, given platforms’ increasingly tight control over their data, including placing restrictions on data collection (Davidson et al., 2023; Freelon, 2018), this study contributes valuable post-API methodology for researchers seeking to conduct external experiments on proprietary social media algorithms.
Besides these overall and observational notes, our study also revealed significant findings pertaining to both algorithmic curation and user-level effects, which we discuss below.
6.1. Algorithm Audit Results
Contrary to theoretical concerns and sock puppet audit results, the evidence we present suggests that the algorithmic timeline actually played a moderating role in shaping the news content users encountered on Twitter/X . Specifically, the news sources users were exposed to in the algorithmic timeline condition showed characteristics of being less ideologically congruent to the user, less extreme, and slightly more reliable compared to the chronological timeline condition. This suggests that the users’ ideological congruence with the news shared by those they follow is greater compared with the news prioritized by Twitter/X ’s algorithm. Considering the institutional changes in Twitter/X in the past two years, it is unclear to what extent these findings are due to intentional platform-level algorithm adjustment, and to what extent these algorithms will remain stable in the coming months and years. However, in in the event that they do remain stable, these results optimistically suggest that the algorithmic biases observed by prior work on the system may not translate into tangible real-world consequences. This point emphasizes the importance of our sociotechnical, ecologically valid study design, and the importance of considering the interconnected dynamics of human-algorithm interactions.
Also of note, our findings diverge from those reported for Facebook, where recent prior work (also with real users) has found the algorithm does not play a moderating effect on users’ news exposure (Guess et al., 2023). As we observe in comparing these two studies, recommendation algorithms may operate dissimilarly across different platforms, even when they serve comparable functions. This divergence serves as a reminder for researchers to exercise caution when generalizing algorithm audit results to other online platforms.
6.2. User Audit Results
In our study, we also collected user-centric metrics regarding participants’ experiences across timeline settings. Behavioral evidence revealed that users tended to see more tweets but less news in the algorithmic timeline condition, suggesting this timeline is better able to hold users’ attention but less likely to show them news content. This finding is partially consistent with the recent open-sourcing of Twitter/X ’s recommendation algorithm (Twitter, 2023a) which explicitly claims to optimize for user engagement with algorithm-curated content. Our other major finding on user perceptions pertained to perceptions concerning both the platform and content amidst the real differences in exposure caused by our experimental interventions. Here we found that although users’ perceptions of the content bias were aligned with the changes in their timelines, overall attitudes towards broader concepts such as platform bias and news trust remained the same.
The implications drawn from our user audit results are threefold. The first point is methodological. This study, unlike most prior work, investigates user-level changes in perceptions as well as behaviors. When users make active choices, like deciding what timeline to view in their daily browsing, they are likely making those choices based on their beliefs about those feeds, rather than any hard evidence about their contents. The reality, according to our findings, that the algorithmic timeline actually measures favorably against the chronological one in terms of information quality is likely unknown to most users. In particular, skeptical or mistrustful users basing their choices on their own perceptions (rather than our data) may therefore be making choices that inadvertently expose them to lower-quality content. Understanding how real users react both attitudinally and behaviorally to the algorithmic environment is crucial for improving overall outcomes; we advocate for further research to explore such algorithmic effects.
Second, while we saw swift and sizable changes in user behavior and information supplies, we also observed tremendous stability of user perceptions self-reported in surveys. This suggests that human attitude is more resilient to algorithmic interventions than human behavior. Admittedly, it is quite possible that a longer-duration intervention is needed to move the needle, and that our three-week experiment is simply not long enough to make a significant change on user perceptions. However, an alternative and more pessimistic interpretation might be that people’s perceptions of social media platforms, of political news, and of partisan others have been disconnected from objective information realities, instead becoming entrenched due to socio-psychological factors (Fiske, 1993), with the result being that external interventions will have a difficult time changing people’s minds. While this conclusion may soothe the concern surrounding digital news environments and their impact on democratic outcomes — changes in information ecosystems can rapidly influence users’ online behaviors but cannot significantly change their belief systems within a short period of time — it begets another concern: that if user perceptions are so hard to change, the solution to the series of thorny social problems in the United States will require a much bigger systematic revamp than mere algorithmic changes of the variety tested in empirical studies like ours.
Third, and finally, the notable decrease in users’ overall satisfaction in both experimental conditions compared to the observation week indicates users’ distaste towards our timeline-enforcement intervention. Taking observational results into account, people exhibited a high level of agency in switching between the algorithmic and chronological timelines in their everyday, pre-intervention use of Twitter/X , and they became disappointed when losing that agency. This finding offers insights for social media researchers and designers, highlighting that users should not be viewed as passive subjects merely influenced by the system and algorithms. Instead, they do possess autonomy in their interface usage and react sensitively to technical changes. Overall, this underscores the importance of the user-centric aspect sociotechnical audits for comprehending the social consequences of algorithmic systems.
6.3. Limitations
We wish to recognize several limitations of this research. First, the sample we obtained would ideally be larger and more representative of Twitter/X ’s user base. However, the former proved very challenging and expensive to access, and the latter may be impossible to achieve given the lack of solid statistics from the company. A related concern is that the crowdworkers we recruited from Prolific were not nationally representative (Litman et al., 2021). Driven by the research purpose of this study, we instead prioritized the creation of an ideologically balanced sample in our pre-screenings. While we tried to overcome these limitations with novel experimental designs and statistical inferences based on within-subject comparisons, the representativeness of the sample (or lack thereof) remains a point for improvement.
Second, this study did not probe into content-level analysis but only focused on the source level. We relied on Ad Fontes media bias scores, assigning source-based values to news URLs. Despite the high correspondence of available domain-level lists (Lin et al., 2023), this study would benefit from a robustness check with other lists of media bias labels. Our analysis also excluded users’ exposure to other forms of political content — for example if a news source was not listed in the Ad Fontes database, or if a tweet contained political discussions without any external news link. This is a common limitation in related work (Huszár et al., 2022; Zhou et al., 2023), one that will require additional methods and further research to resolve.
Third, although we did not inform users about the precise goal of the study, we cannot guarantee whether intervention effects were undermined by users’ awareness, by the impact of payments on users’ organic browsing behavior, or by carryover effects across weeks. This limitation is inherent to experimental designs with obtrusive interventions; although we believe user behavior is largely organic due to the length of the experiment, more research is needed to address the exact risk of such interventions on users’ compliance and internal validity of this project.
Fourth, this study is limited in time and space: to only three weeks (perhaps not long enough to capture significant changes in user perceptions), and to desktop use of Twitter/X . As a result, it does not account for mobile browsing data or changes over longer periods of time, which limits the generalization scope of our results (Yang et al., 2020). Future work may involve overcoming the technical difficulties of collecting browsing data and enacting interventions on mobile devices to study the effects on mobile Twitter/X users.
7. Conclusion
Building on prior work from a range of disciplines on the state of the social media ecosystem with regards to news, we conduct a sociotechnical audit of news content on Twitter/X . Recruiting Twitter/X users (N=243) from across the political spectrum, we first passively observe user behavior and news exposure for one week on the platform, and subsequently conduct an intervention, enforcing that users spend another week restricted to the algorithmic “For You” timeline and a third week restricted to the chronological “Following” timeline (randomizing the order of interventions). Analyzing our results, we find that (1) while the algorithmic timeline decreases user exposure to news, it also has a moderating effect and users see less extreme, less like-minded and slightly more reliable news sources; and (2) despite our intervention having significant effects on users’ behaviors, and users reporting sensitivity to the bias of content that they see, their broader attitudes and beliefs remained largely stable.
Our first major take-away from this work was the surprise (especially in the era of Elon Musk) that the algorithmic timeline on Twitter/X did not prioritize engagement at the expense of news quality; instead, engagement and quality were both higher (though the amount of news did decrease for users in this condition). While many have decried the algorithmic amplification of political content or hate speech, we found little evidence supporting these claims. While algorithms decrease the quantity of news available, some may simultaneously increase its quality. Our second major conclusion is that, while our algorithm audit shows that the system may perform well technically, our user-centered audit showed users remained stubborn in their beliefs about the system. This suggests a need to re-calibrate technical performance and user perceptions so they match more closely, beginning with centering and studying users.
Acknowledgements.
We thank our study participants for making this work possible. We thank Michelle Lam for her helpful guidance on the Intervenr system and its codebase. We thank Yphtach Lelkes, Sandra González-Bailón and CIND participants for their constructive comments and suggestions. We also thank our anonymous reviewers for their valuable feedback on our paper. Author Stephanie Wang is supported by a gift from AWS AI to Penn Engineering’s ASSET Center for Trustworthy AI.References
- (1)
- Ad Fontes Media (2023) Ad Fontes Media. 2023. Methodology. https://adfontesmedia.com/how-ad-fontes-ranks-news-sources/
- Bakshy et al. (2015) Eytan Bakshy, Solomon Messing, and Lada A. Adamic. 2015. Exposure to ideologically diverse news and opinion on Facebook. Science 348, 6239 (June 2015), 1130–1132. https://doi.org/10.1126/science.aaa1160 Publisher: American Association for the Advancement of Science.
- Bandy (2021) Jack Bandy. 2021. Problematic Machine Behavior: A Systematic Literature Review of Algorithm Audits. Proc. ACM Hum.-Comput. Interact. 5, CSCW1, Article 74 (apr 2021), 34 pages. https://doi.org/10.1145/3449148
- Bandy and Diakopoulos (2021a) Jack Bandy and Nicholas Diakopoulos. 2021a. Curating Quality? How Twitter’s Timeline Algorithm Treats Different Types of News. Social Media + Society 7, 3 (2021), 20563051211041648. https://doi.org/10.1177/20563051211041648 arXiv:https://doi.org/10.1177/20563051211041648
- Bandy and Diakopoulos (2021b) Jack Bandy and Nicholas Diakopoulos. 2021b. More Accounts, Fewer Links: How Algorithmic Curation Impacts Media Exposure in Twitter Timelines. Proc. ACM Hum.-Comput. Interact. 5, CSCW1, Article 78 (apr 2021), 28 pages. https://doi.org/10.1145/3449152
- Bartley et al. (2021) Nathan Bartley, Andres Abeliuk, Emilio Ferrara, and Kristina Lerman. 2021. Auditing Algorithmic Bias on Twitter. In 13th ACM Web Science Conference 2021. ACM, Virtual Event United Kingdom, 65–73. https://doi.org/10.1145/3447535.3462491
- Bruns (2019) Axel Bruns. 2019. Are filter bubbles real? John Wiley & Sons.
- Carpini and Keeter (1996) Michael X. Delli Carpini and Scott Keeter. 1996. What Americans Know about Politics and why it Matters. Yale University Press. Google-Books-ID: b2ZUquOLrzoC.
- Cinelli et al. (2021) Matteo Cinelli, Gianmarco De Francisci Morales, Alessandro Galeazzi, Walter Quattrociocchi, and Michele Starnini. 2021. The echo chamber effect on social media. Proceedings of the National Academy of Sciences 118, 9 (March 2021), e2023301118. https://doi.org/10.1073/pnas.2023301118 Publisher: Proceedings of the National Academy of Sciences.
- Davidson et al. (2023) Brittany I Davidson, Darja Wischerath, Daniel Racek, Douglas A Parry, Emily Godwin, Joanne Hinds, Dirk van der Linden, Jonathan F Roscoe, Laura Ayravainen, and Alicia G Cork. 2023. Platform-controlled social media APIs threaten Open Science. Nature Human Behaviour (2023), 1–4.
- DeVito et al. (2017) Michael A. DeVito, Darren Gergle, and Jeremy Birnholtz. 2017. ”Algorithms ruin everything”: #RIPTwitter, Folk Theories, and Resistance to Algorithmic Change in Social Media. In Proceedings of the 2017 CHI Conference on Human Factors in Computing Systems (CHI ’17). Association for Computing Machinery, New York, NY, USA, 3163–3174. https://doi.org/10.1145/3025453.3025659
- Eslami et al. (2015) Motahhare Eslami, Aimee Rickman, Kristen Vaccaro, Amirhossein Aleyasen, Andy Vuong, Karrie Karahalios, Kevin Hamilton, and Christian Sandvig. 2015. ”I always assumed that I wasn’t really that close to [her]”: Reasoning about Invisible Algorithms in News Feeds. In Proceedings of the 33rd Annual ACM Conference on Human Factors in Computing Systems (CHI ’15). Association for Computing Machinery, New York, NY, USA, 153–162. https://doi.org/10.1145/2702123.2702556
- Fernández et al. (2021) Miriam Fernández, Alejandro Bellogín, and Iván Cantador. 2021. Analysing the Effect of Recommendation Algorithms on the Amplification of Misinformation. https://doi.org/10.48550/arXiv.2103.14748 arXiv:2103.14748 [cs].
- Fiske (1993) Susan T. Fiske. 1993. Social Cognition and Social Perception. Annual Review of Psychology 44, 1 (1993), 155–194. https://doi.org/10.1146/annurev.ps.44.020193.001103 _eprint: https://doi.org/10.1146/annurev.ps.44.020193.001103.
- Flaxman et al. (2016) Seth Flaxman, Sharad Goel, and Justin M. Rao. 2016. Filter Bubbles, Echo Chambers, and Online News Consumption. Public Opinion Quarterly 80, S1 (Jan. 2016), 298–320. https://doi.org/10.1093/poq/nfw006
- Freelon (2018) Deen Freelon. 2018. Computational Research in the Post-API Age. Political Communication 35, 4 (Oct. 2018), 665–668. https://doi.org/10.1080/10584609.2018.1477506 Publisher: Routledge.
- Gentzkow and Shapiro (2011) Matthew Gentzkow and Jesse M. Shapiro. 2011. Ideological Segregation Online and Offline. The Quarterly Journal of Economics 126, 4 (Nov. 2011), 1799–1839. https://doi.org/10.1093/qje/qjr044
- González-Bailón et al. (2023) Sandra González-Bailón, David Lazer, Pablo Barberá, Meiqing Zhang, Hunt Allcott, Taylor Brown, Adriana Crespo-Tenorio, Deen Freelon, Matthew Gentzkow, Andrew M. Guess, Shanto Iyengar, Young Mie Kim, Neil Malhotra, Devra Moehler, Brendan Nyhan, Jennifer Pan, Carlos Velasco Rivera, Jaime Settle, Emily Thorson, Rebekah Tromble, Arjun Wilkins, Magdalena Wojcieszak, Chad Kiewiet de Jonge, Annie Franco, Winter Mason, Natalie Jomini Stroud, and Joshua A. Tucker. 2023. Asymmetric ideological segregation in exposure to political news on Facebook. Science 381, 6656 (July 2023), 392–398. https://doi.org/10.1126/science.ade7138 Publisher: American Association for the Advancement of Science.
- González-Bailón and Lelkes (2023) Sandra González-Bailón and Yphtach Lelkes. 2023. Do social media undermine social cohesion? A critical review. Social Issues and Policy Review 17, 1 (2023), 155–180. https://doi.org/10.1111/sipr.12091 _eprint: https://spssi.onlinelibrary.wiley.com/doi/pdf/10.1111/sipr.12091.
- Guess (2021) Andrew Guess. 2021. (Almost) Everything in Moderation: New Evidence on Americans’ Online Media Diets. American Journal of Political Science 65, 4 (Oct. 2021), 1007–1022. https://doi.org/10.1111/ajps.12589
- Guess et al. (2023) Andrew M. Guess, Neil Malhotra, Jennifer Pan, Pablo Barberá, Hunt Allcott, Taylor Brown, Adriana Crespo-Tenorio, Drew Dimmery, Deen Freelon, Matthew Gentzkow, Sandra González-Bailón, Edward Kennedy, Young Mie Kim, David Lazer, Devra Moehler, Brendan Nyhan, Carlos Velasco Rivera, Jaime Settle, Daniel Robert Thomas, Emily Thorson, Rebekah Tromble, Arjun Wilkins, Magdalena Wojcieszak, Beixian Xiong, Chad Kiewiet de Jonge, Annie Franco, Winter Mason, Natalie Jomini Stroud, and Joshua A. Tucker. 2023. How do social media feed algorithms affect attitudes and behavior in an election campaign? Science 381, 6656 (July 2023), 398–404. https://doi.org/10.1126/science.abp9364 Publisher: American Association for the Advancement of Science.
- Haq et al. (2022) Ehsan-Ul Haq, Yang K. Lu, and Pan Hui. 2022. It’s All Relative! A Method to Counter Human Bias in Crowdsourced Stance Detection of News Articles. Proc. ACM Hum.-Comput. Interact. 6, CSCW2, Article 523 (nov 2022), 25 pages. https://doi.org/10.1145/3555636
- Haroon et al. (2023) Muhammad Haroon, Magdalena Wojcieszak, Anshuman Chhabra, Xin Liu, Prasant Mohapatra, and Zubair Shafiq. 2023. Auditing YouTube’s recommendation system for ideologically congenial, extreme, and problematic recommendations. Proceedings of the National Academy of Sciences 120, 50 (Dec. 2023), e2213020120. https://doi.org/10.1073/pnas.2213020120 Publisher: Proceedings of the National Academy of Sciences.
- Huang and Yang (2024) Shengchun Huang and Tian Yang. 2024. Auditing Entertainment Traps on YouTube: How Do Recommendation Algorithms Pull Users Away from News. Political Communication 0, 0 (2024), 1–19. https://doi.org/10.1080/10584609.2024.2343769 Publisher: Routledge _eprint: https://doi.org/10.1080/10584609.2024.2343769.
- Hussein et al. (2020) Eslam Hussein, Prerna Juneja, and Tanushree Mitra. 2020. Measuring Misinformation in Video Search Platforms: An Audit Study on YouTube. Proceedings of the ACM on Human-Computer Interaction 4, CSCW1 (May 2020), 1–27. https://doi.org/10.1145/3392854
- Huszár et al. (2022) Ferenc Huszár, Sofia Ira Ktena, Conor O’Brien, Luca Belli, Andrew Schlaikjer, and Moritz Hardt. 2022. Algorithmic amplification of politics on Twitter. Proceedings of the National Academy of Sciences 119, 1 (Jan. 2022), e2025334119. https://doi.org/10.1073/pnas.2025334119 Publisher: Proceedings of the National Academy of Sciences.
- Kirshner (2023) Alex Kirshner. 2023. Twitter’s Was forNews. https://slate.com/technology/2023/10/elon-musk-x-twitter-news-links-headlines-why.html
- Lam et al. (2023) Michelle S. Lam, Ayush Pandit, Colin H. Kalicki, Rachit Gupta, Poonam Sahoo, and Danaë Metaxa. 2023. Sociotechnical Audits: Broadening the Algorithm Auditing Lens to Investigate Targeted Advertising. Proc. ACM Hum.-Comput. Interact. 7, CSCW2, Article 360 (oct 2023), 37 pages. https://doi.org/10.1145/3610209
- Lambrecht and Tucker (2019) Anja Lambrecht and Catherine Tucker. 2019. Algorithmic bias? An empirical study of apparent gender-based discrimination in the display of STEM career ads. Management science 65, 7 (2019), 2966–2981.
- Lazer et al. (2018) David M. J. Lazer, Matthew A. Baum, Yochai Benkler, Adam J. Berinsky, Kelly M. Greenhill, Filippo Menczer, Miriam J. Metzger, Brendan Nyhan, Gordon Pennycook, David Rothschild, Michael Schudson, Steven A. Sloman, Cass R. Sunstein, Emily A. Thorson, Duncan J. Watts, and Jonathan L. Zittrain. 2018. The science of fake news. Science 359, 6380 (March 2018), 1094–1096. https://doi.org/10.1126/science.aao2998 Publisher: American Association for the Advancement of Science.
- Ledwich and Zaitsev (2019) Mark Ledwich and Anna Zaitsev. 2019. Algorithmic extremism: Examining YouTube’s rabbit hole of radicalization. arXiv preprint arXiv:1912.11211 (2019).
- Lee et al. (2018) Dokyun Lee, Kartik Hosanagar, and Harikesh S. Nair. 2018. Advertising Content and Consumer Engagement on Social Media: Evidence from Facebook. Management Science 64, 11 (Nov. 2018), 5105–5131. https://doi.org/10.1287/mnsc.2017.2902 Publisher: INFORMS.
- Lin et al. (2023) Hause Lin, Jana Lasser, Stephan Lewandowsky, Rocky Cole, Andrew Gully, David G Rand, and Gordon Pennycook. 2023. High level of correspondence across different news domain quality rating sets. PNAS Nexus 2, 9 (Sept. 2023), pgad286. https://doi.org/10.1093/pnasnexus/pgad286
- Litman et al. (2021) Leib Litman, Aaron Moss, Cheskie Rosenzweig, and Jonathan Robinson. 2021. Reply to MTurk, Prolific or panels? Choosing the right audience for online research. https://doi.org/10.2139/ssrn.3775075
- Liu et al. (2010) Jiahui Liu, Peter Dolan, and Elin Rønby Pedersen. 2010. Personalized news recommendation based on click behavior. In Proceedings of the 15th international conference on Intelligent user interfaces. ACM, Hong Kong China, 31–40. https://doi.org/10.1145/1719970.1719976
- Messing and Westwood (2014) Solomon Messing and Sean J. Westwood. 2014. Selective Exposure in the Age of Social Media: Endorsements Trump Partisan Source Affiliation When Selecting News Online. Communication Research 41, 8 (Dec. 2014), 1042–1063. https://doi.org/10.1177/0093650212466406 Publisher: SAGE Publications Inc.
- Metaxa et al. (2019) Danaë Metaxa, Joon Sung Park, James A Landay, and Jeff Hancock. 2019. Search media and elections: A longitudinal investigation of political search results. Proceedings of the ACM on Human-Computer Interaction 3, CSCW (2019), 1–17.
- Metaxa et al. (2021) Danaë Metaxa, Joon Sung Park, Ronald E. Robertson, Karrie Karahalios, Christo Wilson, Jeff Hancock, and Christian Sandvig. 2021. Auditing Algorithms: Understanding Algorithmic Systems from the Outside In. Foundations and Trends® in Human–Computer Interaction 14, 4 (Nov. 2021), 272–344. https://doi.org/10.1561/1100000083 Publisher: Now Publishers, Inc..
- Milli et al. ([n. d.]) Smitha Milli, Micah Carroll, Sashrika Pandey, Yike Wang, and Anca Dragan. [n. d.]. Twitter’s Algorithm: Amplifying Anger, Animosity, and Affective Polarization. ([n. d.]).
- Munger and Phillips (2022) Kevin Munger and Joseph Phillips. 2022. Right-Wing YouTube: A Supply and Demand Perspective. The International Journal of Press/Politics 27, 1 (2022), 186–219. https://doi.org/10.1177/1940161220964767 arXiv:https://doi.org/10.1177/1940161220964767
- Newman et al. (2023) Nic Newman, Richard Fletcher, Kirsten Eddy, Craig T. Robertson, and Rasmus Kleis Nielsen. 2023. Reuters Institute Digital News Report 2023. https://reutersinstitute.politics.ox.ac.uk/sites/default/files/2023-06/Digital_News_Report_2023.pdf
- News (2022) Twitter News. 2022. How many people come to Twitter for news? As it turns out, a LOT. https://blog.twitter.com/en_us/topics/insights/2022/how-many-people-come-twitter-for-news
- Pariser (2011) Eli Pariser. 2011. The Filter Bubble: How the New Personalized Web Is Changing What We Read and How We Think. Penguin. Google-Books-ID: wcalrOI1YbQC.
- Pathak et al. (2023) Royal Pathak, Francesca Spezzano, and Maria Soledad Pera. 2023. Understanding the Contribution of Recommendation Algorithms on Misinformation Recommendation and Misinformation Dissemination on Social Networks. ACM Trans. Web 17, 4, Article 35 (oct 2023), 26 pages. https://doi.org/10.1145/3616088
- Peterson et al. (2021) Erik Peterson, Sharad Goel, and Shanto Iyengar. 2021. Partisan selective exposure in online news consumption: evidence from the 2016 presidential campaign. Political Science Research and Methods 9, 2 (April 2021), 242–258. https://doi.org/10.1017/psrm.2019.55
- Pfeffer et al. (2023) Juergen Pfeffer, Daniel Matter, Kokil Jaidka, Onur Varol, Afra Mashhadi, Jana Lasser, Dennis Assenmacher, Siqi Wu, Diyi Yang, Cornelia Brantner, Daniel M. Romero, Jahna Otterbacher, Carsten Schwemmer, Kenneth Joseph, David Garcia, and Fred Morstatter. 2023. Just Another Day on Twitter: A Complete 24 Hours of Twitter Data. https://doi.org/10.48550/arXiv.2301.11429 arXiv:2301.11429 [cs].
- Ray and Anyanwu (2022) Rashawn Ray and Joy Anyanwu. 2022. Why is Elon Musk’s Twitter takeover increasing hate speech? https://www.brookings.edu/articles/why-is-elon-musks-twitter-takeover-increasing-hate-speech/
- Ribeiro et al. (2021) Manoel Horta Ribeiro, Raphael Ottoni, Robert West, Virgílio A. F. Almeida, and Wagner Meira. 2021. Auditing Radicalization Pathways on YouTube. arXiv:1908.08313 [cs] (Oct. 2021). http://arxiv.org/abs/1908.08313 arXiv: 1908.08313.
- Rieder et al. (2018) Bernhard Rieder, Ariadna Matamoros-Fernández, and Òscar Coromina. 2018. From ranking algorithms to ‘ranking cultures’: Investigating the modulation of visibility in YouTube search results. Convergence 24, 1 (Feb. 2018), 50–68. https://doi.org/10.1177/1354856517736982 Publisher: SAGE Publications Ltd.
- Robertson et al. (2023) Ronald E. Robertson, Jon Green, Damian J. Ruck, Katherine Ognyanova, Christo Wilson, and David Lazer. 2023. Users choose to engage with more partisan news than they are exposed to on Google Search. Nature 618, 7964 (June 2023), 342–348. https://doi.org/10.1038/s41586-023-06078-5
- Robertson et al. (2018) Ronald E. Robertson, Shan Jiang, Kenneth Joseph, Lisa Friedland, David Lazer, and Christo Wilson. 2018. Auditing Partisan Audience Bias within Google Search. Proceedings of the ACM on Human-Computer Interaction 2, CSCW (Nov. 2018), 148:1–148:22. https://doi.org/10.1145/3274417
- Roose ([n. d.]) Kevin Roose. [n. d.]. The Making of A YouTube Radical. https://www.nytimes.com/interactive/2019/06/08/technology/youtube-radical.html
- Sandvig et al. (2014) Christian Sandvig, Kevin Hamilton, Karrie Karahalios, and Cedric Langbort. 2014. Auditing algorithms: Research methods for detecting discrimination on internet platforms. Data and discrimination: converting critical concerns into productive inquiry 22, 2014 (2014), 4349–4357.
- Srba et al. (2023) Ivan Srba, Robert Moro, Matus Tomlein, Branislav Pecher, Jakub Simko, Elena Stefancova, Michal Kompan, Andrea Hrckova, Juraj Podrouzek, Adrian Gavornik, and Maria Bielikova. 2023. Auditing YouTube’s Recommendation Algorithm for Misinformation Filter Bubbles. ACM Trans. Recomm. Syst. 1, 1, Article 6 (jan 2023), 33 pages. https://doi.org/10.1145/3568392
- Thorson and Wells (2015) Kjerstin Thorson and Chris Wells. 2015. Curated Flows: A Framework for Mapping Media Exposure in the Digital Age. Communication Theory 26, 3 (11 2015), 309–328. https://doi.org/10.1111/comt.12087 arXiv:https://academic.oup.com/ct/article-pdf/26/3/309/21955206/jcomthe0309.pdf
- Twitter (2023a) Twitter. 2023a. Twitter’s Recommendation Algorithm. https://blog.twitter.com/engineering/en_us/topics/open-source/2023/twitter-recommendation-algorithm
- Twitter (2023b) Twitter. 2023b. Twitter’s Recommendation Algorithm: OutOfNetworkCompetitorURLFilter. https://github.com/twitter/the-algorithm/blob/72eda9a24f815f6d566818cbf8518138e29d83e9/home-mixer/server/src/main/scala/com/twitter/home_mixer/product/scored_tweets/filter/OutOfNetworkCompetitorURLFilter.scala#L15
- van Setten et al. (2017) Menno van Setten, Peer Scheepers, and Marcel Lubbers. 2017. Support for restrictive immigration policies in the European Union 2002–2013: the impact of economic strain and ethnic threat for vulnerable economic groups. European Societies 19, 4 (Aug. 2017), 440–465. https://doi.org/10.1080/14616696.2016.1268705 Publisher: Routledge _eprint: https://doi.org/10.1080/14616696.2016.1268705.
- Wagner (2023) Michael W. Wagner. 2023. Independence by permission. Science 381, 6656 (2023), 388–391. https://doi.org/10.1126/science.adi2430 arXiv:https://www.science.org/doi/pdf/10.1126/science.adi2430
- Yang et al. (2020) Tian Yang, Sílvia Majó-Vázquez, Rasmus K. Nielsen, and Sandra González-Bailón. 2020. Exposure to news grows less fragmented with an increase in mobile access. Proceedings of the National Academy of Sciences 117, 46 (Nov. 2020), 28678–28683. https://doi.org/10.1073/pnas.2006089117 Publisher: Proceedings of the National Academy of Sciences.
- Zarouali et al. (2021) Brahim Zarouali, Sophie C. Boerman, and Claes H. de Vreese. 2021. Is this recommended by an algorithm? The development and validation of the algorithmic media content awareness scale (AMCA-scale). Telematics and Informatics 62 (Sept. 2021), 101607. https://doi.org/10.1016/j.tele.2021.101607
- Zhou et al. (2023) Alvin Zhou, Tian Yang, and Sandra González-Bailón. 2023. The puzzle of misinformation: Exposure to unreliable content in the United States is higher among the better informed. New Media & Society (Sept. 2023), 14614448231196863. https://doi.org/10.1177/14614448231196863 Publisher: SAGE Publications.
Appendix A Appendix
A.1. Method: Survey Questions
-
(1)
We’d like you to roughly estimate the ideological bias of the news on Twitter (X) on a 100-point scale for the past week. 0 means extremely liberal, 50 means ideologically neutral and 100 means extremely conservative.
-
(a)
”Recall the news on your Twitter (X) timeline in the past week:” range 0 -100
-
(b)
All news available on Twitter (X) (including for you and other users) in the past week: range 0 -100
-
(c)
News on a typical conservative user’s Twitter (X) timeline in the past week: range 0 -100
-
(d)
News on a typical liberal user’s Twitter (X) timeline in the past week: range 0 -100
-
(a)
-
(2)
Thinking back on the last week, how satisfied are you with the user experience on Twitter (X) overall?
5-point Likert scale (“extremely unsatisfied” to “extremely satisfied”).
-
(3)
How satisfied are you with the news environment on Twitter (X) in the last week?
5-point Likert scale (“extremely unsatisfied” to “extremely satisfied”).
-
(4)
This is an attention check. Please select ’Neither agree nor disagree’ to indicate you are paying attention to survey questions.
5-point Likert scale (”strongly disagree” to ”strongly agree”)
-
(5)
Please estimate the credibility of the news information you see on Twitter (X):
5-point Likert scale (”extremely low credibility” to ”extremely high credibility”)
-
(6)
Please indicate the extent to which you trust the news information you see on Twitter (X):
5-point Likert scale (”extremely distrust” to ”extremely trust”)
-
(7)
Do you think the Twitter (X) algorithm is generally neutral, or primarily supports posts from liberals or conservatives?
5-point Likert scale (”primarily supports liberals’ posts” to ”primarily supports conservatives’ posts”)
-
(8)
To what extent do you agree with the following statement: There should be more government regulation of social media companies like Twitter (X)
5-point Likert scale (”strongly disagree” to ”strongly agree”)
-
(9)
To what extent are you aware that algorithms are used to recommend content to the user on social media? 5-point Likert scale (”not at all aware” to ”completely aware”)
-
(10)
To what extent are you aware that algorithms are used to prioritize certain content above others on social media?
5-point Likert scale (”not at all aware” to ”completely aware”)
-
(11)
To what extent are you aware that algorithms are used to tailor certain content to the user on social media?
5-point Likert scale (”not at all aware” to ”completely aware”)
-
(12)
To what extent are you aware that algorithms are used to show someone else different news than you get to see on social media?
5-point Likert scale (”not at all aware” to ”completely aware”)
-
(13)
Most news online is distorted by social media algorithms.
5-point Likert scale (”strongly disagree” to ”strongly agree”)
-
(14)
News delivered through social media algorithms is harmful to democracy.
5-point Likert scale (”strongly disagree” to ”strongly agree”)
-
(15)
Social media algorithms deliver news that tends to be slanted against my views.
5-point Likert scale (”strongly disagree” to ”strongly agree”)
A.2. Summary Statistics
Perceived echo chamber measures are on a scale from 0 (extremely liberal) to 100 (extremely conservative). All other measures are on a 5-point likert scale (for details refer to Appendix A.1). We merged survey items (9) to (12) from Appendix A.1 as a multi-item measure of algorithmic media content awareness (Zarouali et al., 2021) (Cronbach’s across all surveys).
| Democrat | Independent | Republican | ||||
| Mean | SD | Mean | SD | Mean | SD | |
| Perceived Echo Chambers Own Timeline | 36.83 | 24.82 | 45.68 | 27.91 | 63.95 | 20.77 |
| Perceived Echo Chambers Overall | 53.20 | 20.19 | 53.51 | 18.39 | 50.91 | 17.82 |
| Perceived Echo Chambers Rep Timeline | 82.00 | 20.37 | 74.06 | 17.21 | 69.17 | 18.48 |
| Perceived Echo Chambers Dem Timeline | 25.77 | 19.24 | 31.65 | 22.34 | 27.86 | 23.67 |
| Satisfaction with User Experience | 3.13 | 1.15 | 3.31 | 0.80 | 4.04 | 0.92 |
| Satisfaction with News | 2.79 | 1.10 | 3.06 | 0.92 | 3.82 | 0.91 |
| Perceived News Credibility | 2.75 | 0.95 | 3.03 | 0.86 | 3.46 | 0.91 |
| Trust in News | 2.85 | 1.04 | 2.96 | 0.98 | 3.53 | 0.86 |
| Perceived Neutrality of Platform | 3.55 | 1.03 | 3.51 | 0.73 | 2.97 | 0.69 |
| Support for Regulation | 3.10 | 1.27 | 2.27 | 1.30 | 1.93 | 1.26 |
| Algorithmic Media Content Awareness | 4.23 | 0.86 | 3.85 | 1.23 | 4.08 | 0.91 |
| Algorithms Distort News | 3.96 | 0.86 | 3.58 | 0.98 | 3.64 | 1.00 |
| Algorithm-delivered News Harm Democracy | 3.23 | 1.07 | 2.82 | 1.07 | 2.60 | 1.11 |
| Algorithm-delivered News is Slanted Against My Views | 2.79 | 1.06 | 3.03 | 0.86 | 3.02 | 0.91 |
| Democrat | Independent | Republican | ||||
| Mean | SD | Mean | SD | Mean | SD | |
| Perceived Echo Chambers Own Timeline | 39.76 | 22.29 | 47.06 | 24.57 | 65.84 | 19.23 |
| Perceived Echo Chambers Overall | 55.96 | 18.23 | 49.48 | 23.47 | 49.33 | 18.25 |
| Perceived Echo Chambers Rep Timeline | 81.11 | 20.86 | 72.37 | 19.49 | 73.48 | 14.56 |
| Perceived Echo Chambers Dem Timeline | 28.57 | 19.46 | 36.37 | 27.20 | 29.26 | 24.28 |
| Satisfaction with User Experience | 2.91 | 1.19 | 3.17 | 0.88 | 3.93 | 1.07 |
| Satisfaction with News | 2.82 | 1.12 | 3.13 | 0.95 | 3.73 | 1.05 |
| Perceived News Credibility | 2.74 | 0.99 | 3.06 | 0.92 | 3.44 | 1.01 |
| Trust in News | 2.75 | 1.05 | 2.89 | 1.01 | 3.42 | 0.91 |
| Perceived Neutrality of Platform | 3.60 | 1.01 | 3.48 | 0.82 | 2.93 | 0.57 |
| Support for Regulation | 3.28 | 1.21 | 2.44 | 1.52 | 1.88 | 1.15 |
| Democrat | Independent | Republican | ||||
| Mean | SD | Mean | SD | Mean | SD | |
| Perceived Echo Chambers Own Timeline | 43.00 | 24.43 | 50.60 | 22.21 | 64.02 | 15.77 |
| Perceived Echo Chambers Overall | 54.27 | 20.16 | 57.12 | 16.25 | 50.28 | 17.92 |
| Perceived Echo Chambers Rep Timeline | 81.08 | 17.49 | 68.60 | 22.26 | 68.88 | 20.28 |
| Perceived Echo Chambers Dem Timeline | 34.88 | 21.64 | 31.96 | 23.91 | 33.77 | 27.23 |
| Satisfaction with User Experience | 2.93 | 1.21 | 3.16 | 0.98 | 4.13 | 0.86 |
| Satisfaction with News | 2.75 | 1.16 | 3.04 | 0.84 | 3.73 | 1.00 |
| Perceived News Credibility | 2.60 | 0.95 | 3.04 | 1.05 | 3.42 | 1.03 |
| Trust in News | 2.70 | 1.12 | 3.04 | 1.01 | 3.55 | 0.96 |
| Perceived Neutrality of Platform | 3.59 | 0.95 | 3.36 | 0.86 | 3.08 | 0.79 |
| Support for Regulation | 3.15 | 1.33 | 2.32 | 1.40 | 1.88 | 1.19 |
| Algorithmic Media Content Awareness | 4.23 | 0.88 | 3.90 | 1.06 | 4.04 | 0.99 |
| Perceptions of Algorithmic News Bias | 3.43 | 1.13 | 3.01 | 1.12 | 3.10 | 1.13 |
| Algorithms Distort News | 4.05 | 0.84 | 3.56 | 1.08 | 3.62 | 1.00 |
| Algorithm-delivered News Harm Democracy | 3.32 | 1.09 | 2.52 | 1.08 | 2.53 | 1.19 |
| Algorithm-delivered News is Slanted Against My Views | 2.91 | 1.12 | 2.96 | 0.97 | 3.13 | 0.89 |
A.3. Participant Demographics
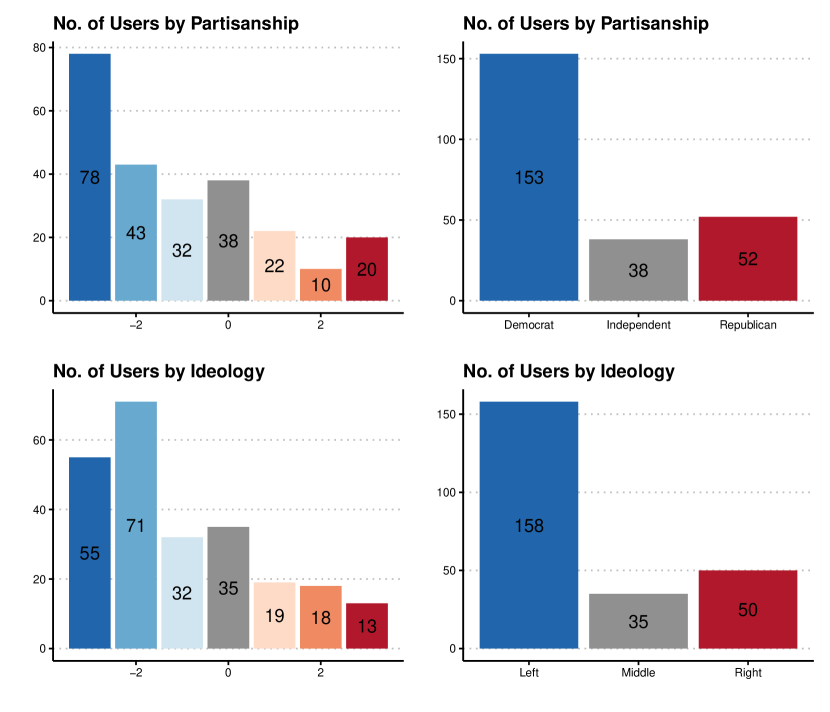
Four bar charts breaking down participant numbers by self-reported partisanship and ideology. The two left-most charts show the distribution over 7-point categories. The two right-most charts show the distribution bucketed into 3-point categories.
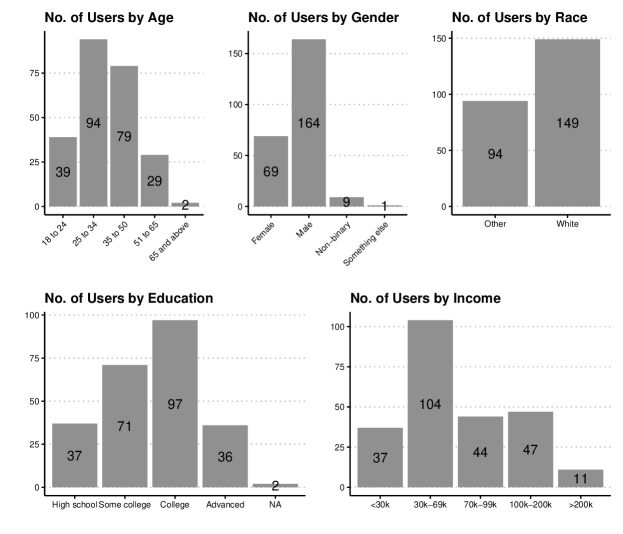
Five bar charts showing participant demographics by age, gender, race, education level and income level.