PRIMORDIAL LITHIUM FROM GLOBULAR CLUSTER TURN-OFF STARS: M13 AND M71
Abstract
During Big Bang nucleosynthesis (BBN) in the first 15 minutes of the Universe some 7Li was created along with isotopes of H and He. The determination of that primordial value of Li can help constrain the conditions at that time. The oldest stars with known ages can be found in globular clusters which have well-determined ages through stellar evolution models. High-resolution spectra have been obtained with the Keck I telescope and HIRES of Li in several unevolved stars in the clusters M13 and M71 with V magnitudes of 17.6 – 17.9. Abundances of Li have been determined with spectrum synthesis techniques and show a range of a factor of 4. We attribute that spread to differences in initial angular momentum resulting in different amounts of spin-down, related mixing, and destruction of Li. Our results are compared with similar results for main-sequences and turn-off stars in other globular clusters. The range in age of these clusters is 11.2 to 14.2 Gyr for an age span of 3 Gyr. These clusters range in [Fe/H] from 0.75 to 2.24 corresponding to a factor of 30 in metallicity. The maximum in the Li abundance for these unevolved stars in all eight clusters is the same corresponding to Li/H = 3.16 x 10⁻¹⁰ while the predicted Li abundance, based on the deuterium abundance and the BBN predictions, is 5.24 x 10⁻¹⁰.
1 INTRODUCTION
At the very high temperatures and densities during the first 15 minutes of the Big Bang neutrons and protons combine to form 2H, 3He, 4He, 7Li in what is referred to as Bang nucleosynthesis (BBN). That original Li can be destroyed in stars most commonly by fusion with a proton at temperatures of 2.5 x 10⁶ K. And additional Li can be created in various ways: by energetic cosmic rays interacting with abundant atoms of He, C, N, O in the interstellar medium, by runaway thermonuclear reactions in novae explosions, in supernovae explosions either by the outward shock waves or by neutrino processes, and in AGB stars through the Cameron-Fowler 7Be-transport mechanism. Models of Galactic chemical evolution explore how such mechanisms might have raised the Big Bang Li abundance to the present (local) Galactic value (see Romano et al. 1999).
The best way to find how much primordial Li was created is to look in the oldest, first-generation stars. The oldest stars with known ages can be found in globular clusters where the ages are determined from stellar evolution models. The stars with primordial Li would be those first-generation cluster stars that have not evolved beyond the main-sequence phase of evolution. Such stars have faint apparent magnitudes so some studies have looked at Li in somewhat brighter unevolved turn-off stars. The most metal-poor star-clusters are likely to be the oldest and thus potentially have the original Li content that was made during Big Bang Nucleosynthesis.
A prime example of a globular cluster fitting these criteria is M92. It has an age of 13.30 0.60 Gyr (Valcin et al. 2020) and [Fe/H] = 2.239 0.028 (Bailin 2019). We reported on our Keck/hires results on three subgiant stars and one turn-off star in M92 in 1995 (Deliyannis, Boesgaard & King 1995). Then in 1998 we discussed the Li results for seven stars near the turn-off (Boesgaard et al. 1998) where we showed the range in Li of a factor of three, with values of A(Li) = log N(Li)/N(H) + 12.00 ranging from 2.01 to 2.45 even as specific line strengths of other elements - Fe, Ca, Cr, Ti, Ba - were similar as seen in their Figure 7.
We have determined Li abundances in five virtually identical turn-off stars in the 12.7 Gyr old globular cluster M5 (Boesgaard & Deliyannis 2023) also from high resolution Keck/HIRES observations. We found a range in Li abundances of a factor of 2 in those five stars. That spread is five times the error in an individual determination. The maximum Li abundance in M5 of A(Li) = 2.47 is similar to that in M92.
Here we add Li in two more two more globular clusters, M13 and M71. The old globular cluster, M13, has an age of 13.49 Gyr while M71 is one of the younger ones at 11.21 Gyr (Valcin et al. 2020). We found [Fe/H] = 0.80 for M71 (Boesgaard et al. (2005a) and it is one of the more metal-rich globular clusters in the catalog of Bailin (2019). That catalog gives [Fe/H] = 1.443 for M13 and 0.736 for M71. Preliminary results for Li in M13 and M71 were presented at an SPIE meeting (Boesgaard et al. 2000) and at an IAU symposium (Boesgaard et al. 2005b).
2 OBSERVATIONS
In order to find the pristine Li content of globular clusters we need to observe unevolved stars. Stellar evolution toward the red giant branch will reduce the surface abundance of Li due to convective dilution effects as first shown by Iben (1965, 1967). This was dilution effect was explored by Deliyannis, Demarque & Kawaler (1990) in metal-poor stars. Such unevolved stars are faint, however, and long exposures are required. Our high-resolution spectra were taken with HIRES on the Keck I 10-m telescope on Mauna Kea. Our spectral resolution is 45,000. Each night multiple flat fields were obtained, typically 20, along with some 20 bias frames. Wavelength calibration spectra of Th-Ar were taken at the beginning and the end of each night.
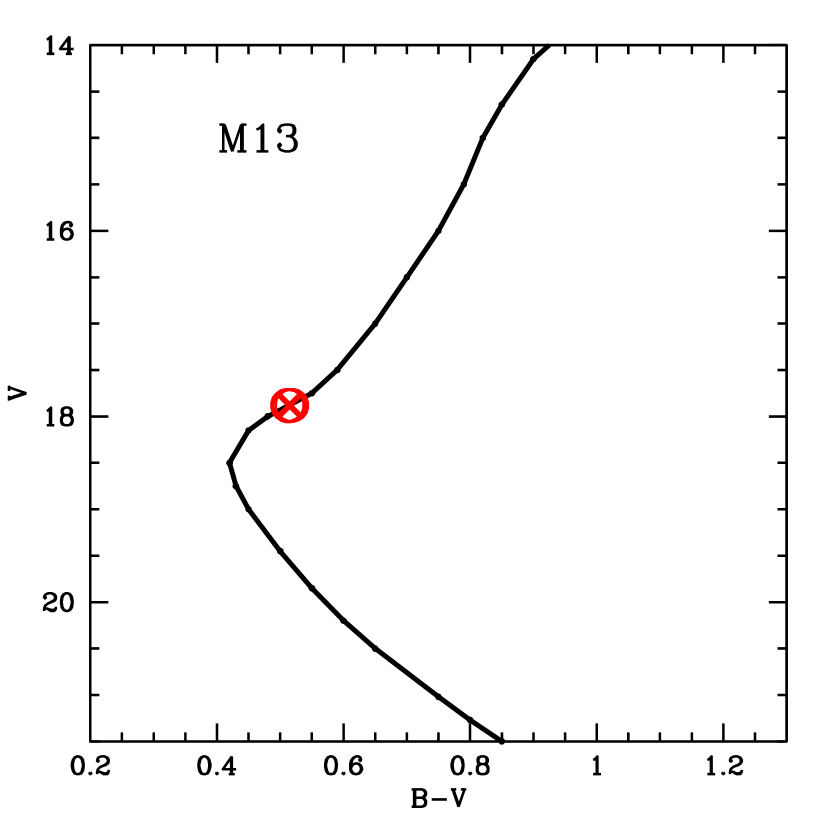
For M13 we observed four stars that are virtually identical in their position in the color-magnitude diagram with V = 17.88 and B-V = 0.51 as seen in Figure 1, left. Our star selection was based on photometry by Stetson (priv. comm. 1996); the photometry is now registered in a catalog by Stetson et al. (2019). Spectra of our turn-off stars were obtained on four different observing nights with individual exposures of 45 minutes. Some details are given in Table 1. The values for the combined signal-to-noise ratios (S/N) in the Li I region are given in the last column, ranging from 36 to 72.
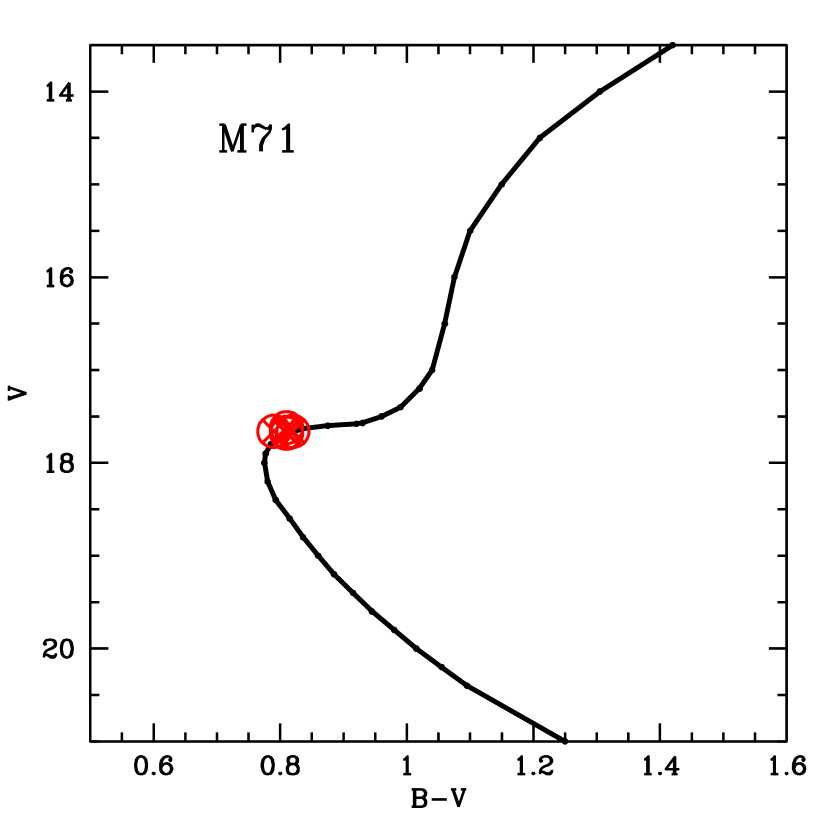
We could obtain spectra of five turn-off stars in M71 with V = 17.6 – 17.7. The positions of these stars in the color-magnitude diagram are shown in Figure 1, right. The specifics of the observational data for M71 are given in Table 2. There are five stars with very similar values of V and B-V with spectra taken over seven nights with multiple exposures of typically 45 minutes each. The combined spectra have S/N values of 48 to 60.
The data reductions for the M71 stars can be found in the paper by Boesgaard et al. (2005a); we did not do a Li analysis in that paper. The procedure for the M13 turn-off stars was similar to that used for M71 stars. It involved IRAF111IRAF is distributed by the National Optical Astronomy Observatories which are operated by NOIRLab, under cooperative agreement with the National Science Foundation. routines with bias-subtraction, flat-fielding with division by a normalized flat, and wavelength calibration for each order from the Th-Ar spectra. This is similar to the procedures we used in our papers on Li abundances for M92 (Boesgaard et al. (1998) and for M5 (Boesgaard & Deliyannis 2023).
3 ABUNDANCE DETERMINATIONS
Stellar parameters that we used in our paper on abundances in M71 (Boesgaard et al. (2005a) are the ones we have used here to find Li abundances. For M13 stars we used temperatures derived on the scale of Carney (1983), log g = 3.80 and microturbulent velocity, , of 1.0 km sec-1. The stellar parameters that we used are listed for M13 in Table 3 and for M71 in Table 4. In our previous work on M92 and M5 we have used this Carney temperature scale and this same analysis method.
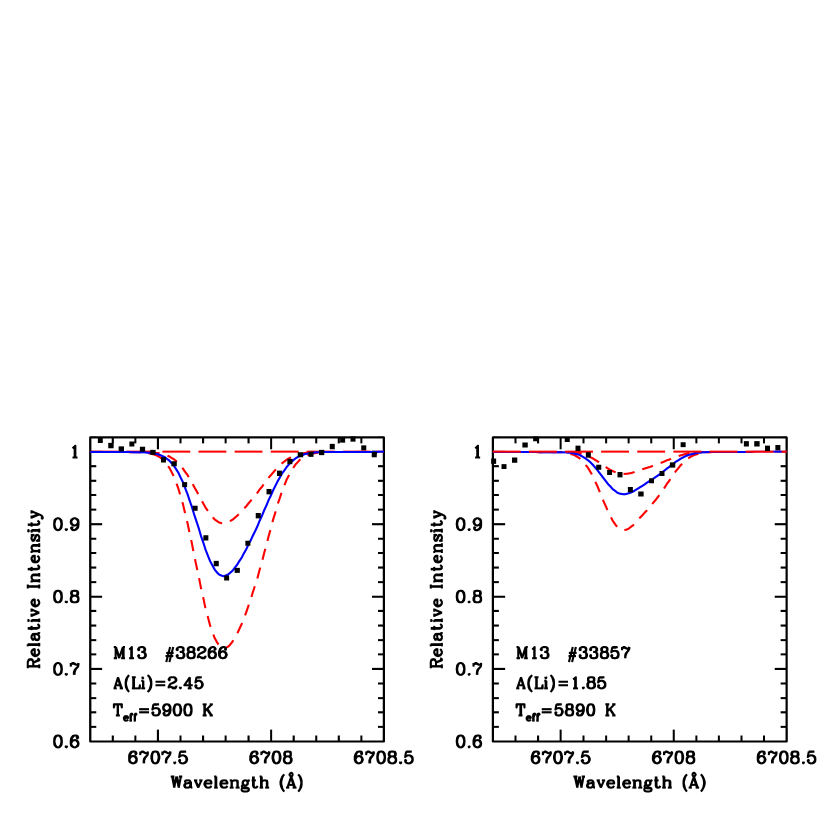
We have used the program MOOG222http://www.as.utexas.edu/ chris/moog.html Sneden (1973), Sneden et al. (2012) to conduct a spectrum synthesis of the Li I region near 6707 Å. The synthesized region covers from 6703.354 to 6711.014 and the linelist has 94 lines, including 39 lines of CN.
Examples of the synthesis fits for two stars in M13 are shown in Figure 2. Although the stellar temperature of these two stars agree within 10 K, their Li abundances differ by a factor of 4: A(Li) = 2.45 vs 1.85. The star with the weak Li line has a depth of 0.94 while the the line in 38266 has a depth of 0.82. The other two stars we observed in M13 are intermediate between these two values for A(Li). Values of A(Li) are given in the last column of Table 3 and span that range from 1.85 to 2.45.
Also given in Table 3 are the measured equivalent widths of the Li I feature for each star. We used the “blends” feature in MOOG, including the Li hyperfine lines and an Fe I line at 6707.44, to determine A(Li). That line strength and Li determination are also given in Table 3. Although we prefer the Li abundances found from the synthesis method, we see that the abundances are very similar when done by the blends method. The mean difference is +0.01 in A(Li). The star-to-star spread in A(Li) is still dramatic at a factor of 4-5.
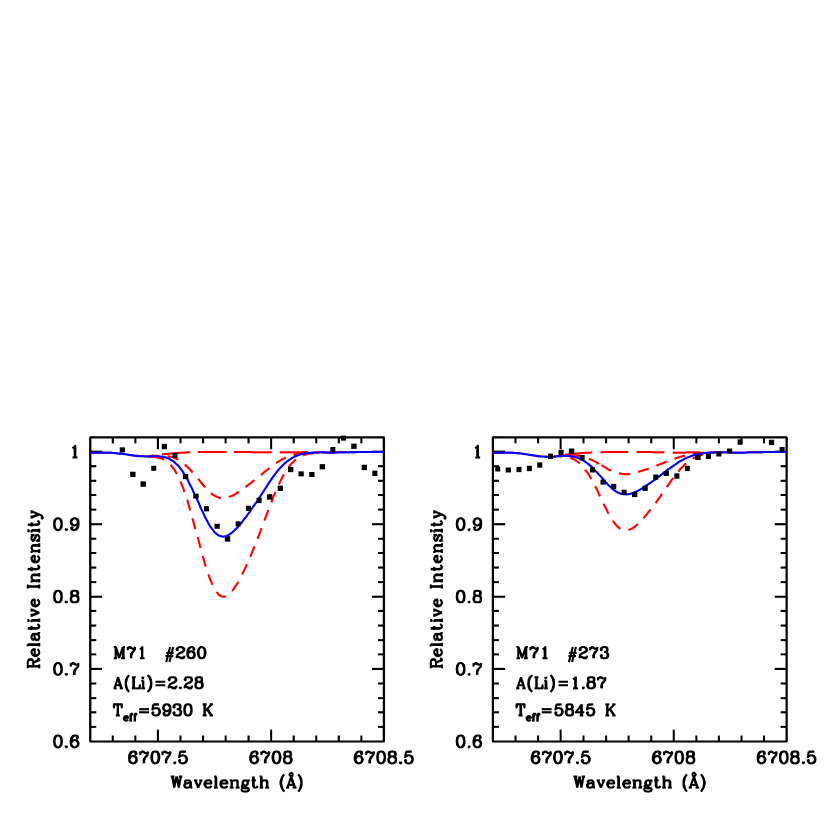
There is also a range in A(Li) for the five virtually identical stars in M71. The Li syntheses for two stars are shown in Figure 3. These two stars also show a large difference in the strength of the Li I lines; the determined abundances are different by a factor of 2.6. As we found for the M13 stars, the Li abundances for the M71 stars were very close for the determinations by the synth and the blends techniques. The mean difference between the two methods for the five stars equal to 0.03. The equivalent widths and blends value for A(Li) are given in Table 4 for the M71 stars, but the determinations by synth are preferred.
For these stars the value of A(Li) is only dependent on the stellar temperature and not the other atmospheric parameters. An uncertainty of 50 K corresponds to an uncertainty in A(Li) of 0.04. This has no effect on the relative Li abundances. A large change in [Fe/H] of +0.5 could change A(Li) by only +0.01.
4 DISCUSSION
The relatively metal-rich cluster, M71, is one of the youngest clusters at 11.2 Gyr, while M13 is more like a classical globular cluster with [Fe/H] = 1.44 and an age of 13.5 Gyr. These two clusters extend the results for Li abundances in unevolved stars in the Galaxy’s globular cluster system. We use the consistently-determined ages of Valcin et al. (2020) and [Fe/H] values of Bailin (2019).
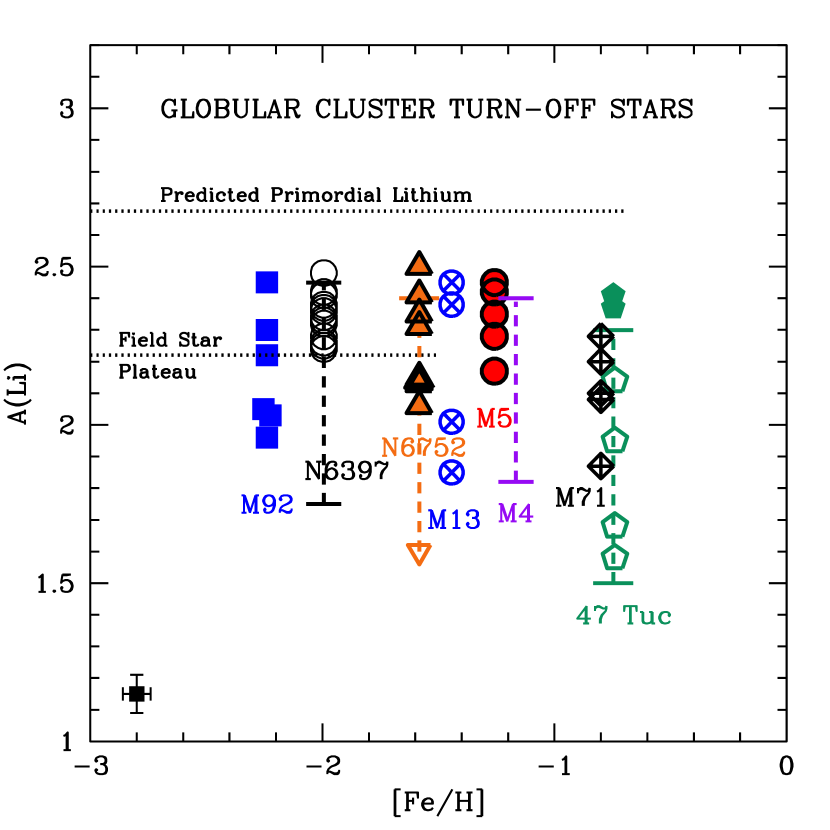
Figure 4 shows a compilation of A(Li) in turnoff stars in eight globular clusters with the references given in the figure caption. This is an expanded view of Figure 5 in Boesgaard & Deliyannis (2023). For comparison we show the field-star plateau which is from Charbonnel & Primas (2005). This plateau is for unevolved field stars in their “clean” sample with temperatures above 6000 K and [Fe/H] less than -1.5. (These are important restrictions on the sample.) For those field stars, however, there is also a range in A(Li) of at least 0.5 at a given [Fe/H]. The spread is also seen in the Li results of Roederer et al. 2014 and Bandyopadhyay et al. 2022), the latter is focused on Li abundances. There are also upper limits on Li abundances found in the field star samples. There is an expectation that the more metal-rich of the field stars would have formed from gas that has been enriched in Li over time by spallation reactions in the interstellar gas as proposed by Reeves et al. (1970) and developed by Meneguzzi et al. (1971), referred to as galactic cosmic ray spallation (GCR). Other sources of new Li include novae, supernovae explosions, mass loss from super-Li-rich AGB stars. That figure reveals that the Li abundances show a large spread in each of the eight globular cluster star samples of unevolved stars. The range in A(Li) can be a factor of 10 or more.
It is not surprising that none of the main-sequence field stars has an upper limit on Li because they have not evolved to where the surface convection zone has deepened enough to have diluted the Li in the outer layers. In the case of the globular cluster stars, however, if they are second or later generation stars their Li content might be expected to have been affected by the gas that previous generations of stars spewed into the newer stars. That gas would be depleted of some Li during the course of stellar evolution. For the globular clusters only NGC6752 has any stars with Li upper limits.
The conclusions we drew from this same plot for six clusters in our paper about Li in turn-off stars in M5 by Boesgaard & Deliyannis (2023) are strengthened by the addition of these two clusters, M13 and M71.
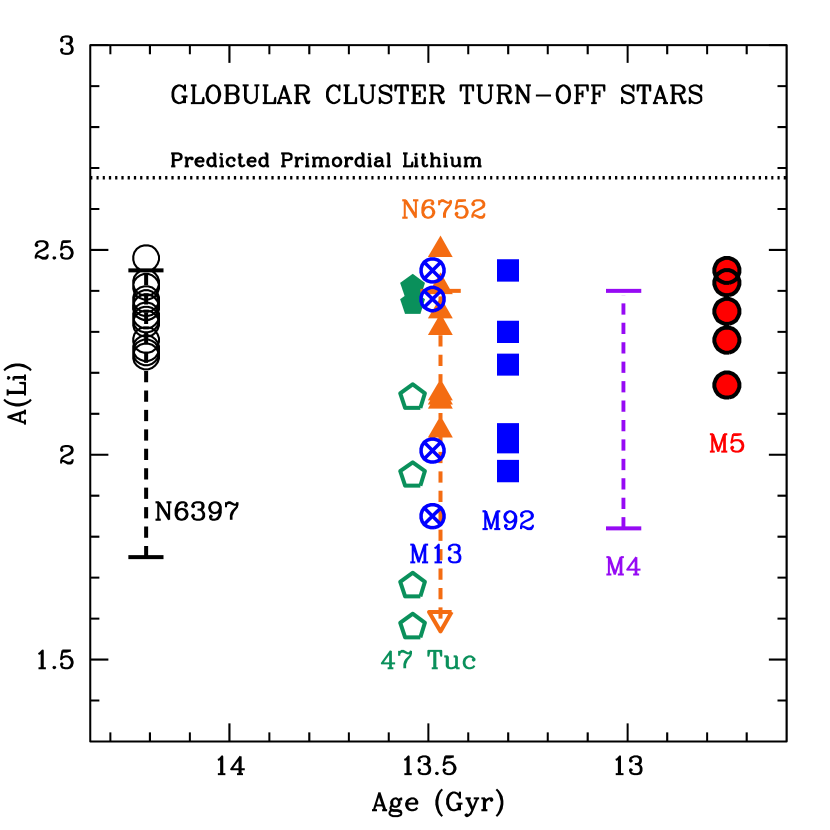
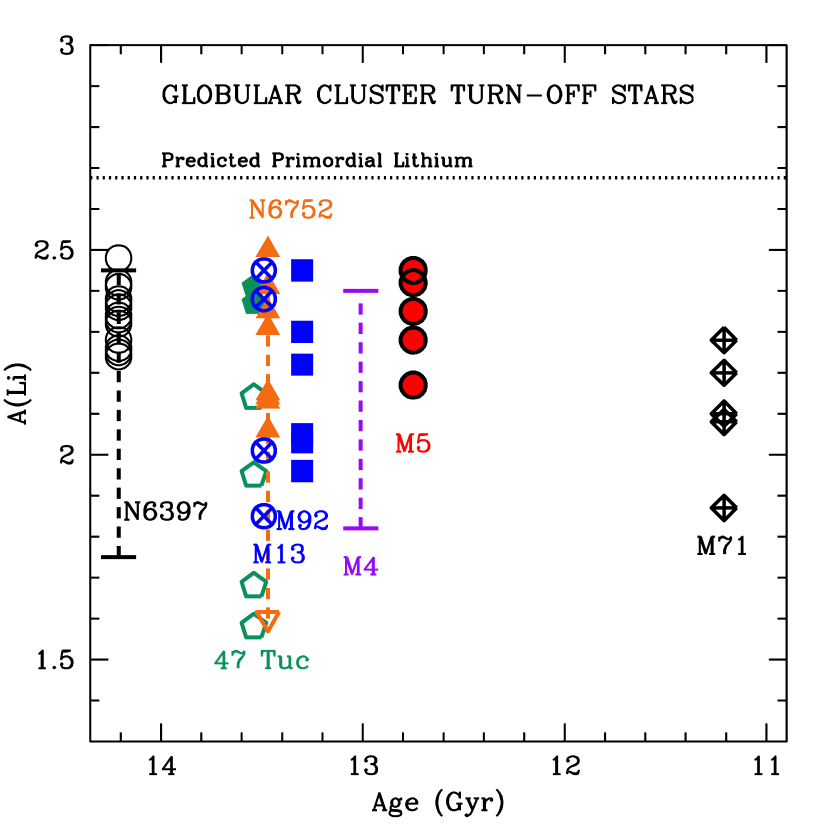
The ages of clusters can be determined well through stellar evolution models. The association of age with A(Li) can be seen In Figure 5. There does not seem to be any connection with age other than for the youngest cluster, M71. It has a lower Li maximum in the five turn-off stars that we investigated.
For each of the eight clusters there is a large range in A(Li). The range is a factor of four for M13 and a factor of 2.4 for M71, while the old but more metal-rich cluster, 47 Tuc, shows a span of a factor of 10. Upper limits on A(Li) have been found only in NGC6752 (Gonzales Hernandez et al. (2009) and indicates a range of 10 or more. For the field stars values for A(Li) cover a range of about a factor 4 at a given Fe abundance and a factor 10 with over the full range in [Fe/H] from 4 to 1 (Deliyannis, Pinsonneault & Duncan 1993), Bandyopadhyay et al. 2020). Individual field stars may have formed in gas that had been enriched by GCR and other mechanisms of Li production. This is unlikely to explain the Li range in a given cluster.
We note that some studies of Li in globular clusters have found an anti-correlation of Na and Li (e.g. for (only) four stars in 47 Tuc by Bonifacio et al. 2007). This could arise from inclusion of later-generation of stars that might have been formed in part with pristine material that contains a normal abundance of Li and in part by material expelled from first generation AGB stars that is devoid of Li and enriched in Na. This is not the situation for our clusters. Abundance results for many elements in M 71 have been published by Boesgaard et al. (2005) including Na. Those Na results and these Li results show that Li and Na are correlated for these stars in M 71, not anti-correlated. (We used 4 weak Na lines to find the Na abundances.) For M13 the Na lines are too weak to measure because of the lower metal content, [Fe/H] = -1.44. However, we took care to select identical, unevolved stars in M13 with V = 17.88 and (B-V)0 = 0.47.
For the other clusters in our Figure 4 there are two others, in addition to M71, with no measurements of Na lines: M92 and M5. Lind et al. (2009) looked at Li and Na in 100 stars in NGC6397 and found three with low A(Li), below 2.0 and high A(Na) above 4.25. The other 97 stars appear to be randomly distributed with A(Li) between 2.05 to 2.45 and A(Na) between 3.5 and 4.3. In fact, they found no significant anti-correlation for A(Na) values below 4.1. They suggest that the stars with A(Na) below 3.9 are first generation, non-polluted stars. For NGC6752 Gruyters et al. (2014) show an anti-correlation of Li and Na for the low Li stars. The anti-correlation of Li and Na is very weak for M4; Spite et al. (2016) show that for a span of [Na/Fe] from -0.2 to +0.4 , the change in A(Li) is only 2.22 to 2.10.
Fields et al. (2020) have made calculations for the nuclei created during Big Bang nucleosynthesis incorporating the results from the Planck data. The source of deuterium (2H) is only primordial; however, it can be destroyed during stellar and galactic evolution. That primordial D can be measured well in high-Z quasar absorption systems. They use a weighted mean of 11 D measurements and find primordial D/H = 2.55 (0.03) x 10-5. This determines a precise baryon-to-photon ratio in the standard model of Big Bang Nucleosynthesis, which in turn predicts that A(Li)p would be near 2.7. The value they calculate for Li/Hp is 4.72 4.76 x 10⁻¹⁰ (0.74). This corresponds to A(Li) = 2.67 2.68 in A(Li). This is shown as the predicted primordial Li in Figures 4 and 5.
In our study of Li in turn-off stars in M92 (Boesgaard et al. 1998) we found a spread in A(Li) in otherwise similar stars and attributed it to a diversity in initial angular momenta. Pinsonneault, Deliyannis & Demarque (1992) showed the effects of initial rotation on Li and Li depletion. They calculated Li (and Be) values as a function of mass, (turn-off) age, metallicity, rotation, temperature. They showed the effects of the rotational evolution of stars, for the case of metal-poor stars. Their models are based on the approach of Endal & Sofia (1976, 1981) as updated by Pinsonneault et al. (1989). Population I stars are known to spin up as they contract during the pre-main sequence, and then spin down as they lose angular momentum during the main sequence. In the models the latter creates differential rotation with depth, which sets off a secular shear instability, which leads to mixing of surface material with regions where it is hot enough to destroy Li, and thus surface Li depletion. Stars forming with a larger initial angular momentum lose more angular momentum as they evolve, and thus deplete more Li. So one test of these models is their prediction that stars of identical Teff should exhibit different Li abundances due to differences in the initial angular momenta.
It is important to note that these (and updated) “Yale”-type models have passed a number of varied tests in their predictions of the evolution of surface stellar Li, Be, and B abundances. Since Li, Be, and B survive to different depths (temperatures) , knowledge of their ratios provide extremely sensitive tests of how physical mechanisms act as a function of depth. So, for example, the correlated depletion of Li and Be in F dwarfs strongly support such models that predict rotational mixing (Deliyannis 1994, Deliyannis & Pinsonneault 1997) and other similar ones (Charbonnel et al. 1994) as the physical cause of the Li Dip (Boesgaard & Tripicco 1986), while also arguing strongly against other mechanisms proposed to create the Li Dip such as diffusion, mass loss, and slow mixing due to gravity waves (Deliyannis et al. 1998, Boesgaard et al. 2004). Other example tests of the “Yale”-type models include the correlated depletion of Be and B observed in F dwarfs (Boesgaard et al. 2005, 2016); the main sequence Li depletion in G dwarfs (Boesgaard et al. 2022, Sun et al. 2023); the higher than average A(Li) seen in short period tidally locked binaries (Thorburn et al. 1993, Deliyannis et al. 1994, Ryan & Deliyannis 1995); the correlation between Li depletion and spindown in late A/early F dwarfs (Deliyannis et al. 2019); and the declining Li abundances with lower Teff in M67 subgiants evolving out of the Li Dip whose deepening surface convection zones reveal the Li profile (dependence of Li with depth) created during the main sequence, and especially the Li/Be ration in these stars (Sills & Deliyannis 2000; Boesgaard et al. 2020). The depletion of Li in late G and K dwarfs may require the additional ingredient of magnetically-induced radius inflation (Somers & Pinsonneault 2015; Jeffries et al. 2021). It is also worth noting that “Yale”-type models have enough core rotation to explain rapidly-rotating horizontal branch stars while also maintaining very slow surface rotation of these stars main sequence progenitors (Pinsonneault et al. 1991).
Given these and other successes of the “Yale”-type models, it is reasonable to infer that these types of models should also apply to halo dwarfs, so that Li differences might be reasonably tied to differences in the initial angular momenta. However, it is more challenging to infer what the predicted Li depletion should be because we lack key information about halo stars, all of which are old. Such information is empirically determined in Population I stars: from very young stars we know the initial angular momenta as a function of mass, and from open clusters of different ages we also know how stars of different masses lose angular momentum over time. So, for example, some “Yale” models predict Li depletion by 1 dex (Pinsonneault et al. 1992, Chaboyer & Demarque 1994) whereas others with different assumptions about the missing information predict as little depletion as 0.3-0.5 dex (Deliyannis 1990, Pinsonneault at el. 1999). So while a precise prediction of Li depletion in halo dwarfs from “Yale” models is not yet possible, in the context of such models a depletion of 0.5 dex from a Big Bang value of A(Li) 2.7 to the observed Spite plateau near 2.2, including significant Li dispersion, is at least quite reasonable.
All of our observed stars are now now rotating slowly, in fact so slowly that we can not measure v sin i from our spectra. The stars with the highest initial angular momentum would destroy more Li as they spin down while those with low initial angular momentum would be able to preserve more Li. The range in initial angular momenta would result in the observed range in Li. Slow rotation would allow atmospheric diffusion of Li to occur and that could play a role in decreasing the Li abundance (Deliyannis 1990, Grutyers, Nordlander & Korn 2014).
These unevolved cluster stars all have Li detections with the exception of a few in NGC 6752. This seems to put restrictions on the idea of multiple generations of star formation. Stars formed later from material that has passed through the giant phase would have had its Li diluted; new stars would have reduced or undetectable Li.
We have noticed that the sample size in most of the these clusters is is only a few, less than ten, yet a range in Li abundance is found in these otherwise identical unevolved stars.
5 SUMMARY AND CONCLUSIONS
We were able to obtain high-resolution spectra of unevolved stars in two additional globular clusters, M13 and M71. One major purpose was to ascertain the Li content which is thought to reflect the primordial Li formed during the first 15 minutes of the Big Bang. The stars observed for this project in those two clusters and have V magnitudes of 17.6 to 17.9 and required multi-hour exposures of the Keck I telescope with HIRES. The four stars we chose to observe in M 13 are virtually identical to each other with V at 17.9 and (B-V)0 of 0.47. The same is true of the of the five stars in M71 which have V at 17.7 and (B-V)0 of 0.53.
We have determined their Li abundances with spectrum synthesis techniques. The Li abundances are sensitive to temperature where an uncertainty of 50 K gives an uncertainty of 0.04 in A(Li). As can be seen in Figures 2 and 3 the Li lines can be weak and there is uncertainty in the fit resulting from that and from the S/N ratio of the original data. Even so, those figures also show a clear range in the Li line strengths and abundances.
Main sequence and turn-off stars have been measured for Li abundances in eight globular clusters and we have shown those Li results in Figure 4 with Fe abundance where [Fe/H] ranges from 2.24 for M92 to 0.75 for 47 Tuc (Bailin 2019). It is very striking that the unevolved stars in all eight clusters, including M13 and M71, and also unevolved field stars, show a wide range in A(Li). The range can be explained by differences in the initial angular momentum of the individual stars with the most rapid rotators losing more of their initial Li during the spin-down to the main sequence, thereby creating a dispersion in Li abundances.
All of the clusters have stars with Li abundances above those found in the field-star Li plateau. And the clusters all have stars with Li below that plateau. Only one cluster, NGC 6752, has any unevolved stars with no detectable Li.
The maximum amount of Li in each cluster – in these unevolved stars – is very similar at A(Li) = 2.5. This amount of Li, however, is less than the predictions for the amount of primordial Li produced during nucleosynthesis during the Big Bang of 2.72 according to Fields et al. (2020). This has been called “The Lithium Problem.” Although this problem is now smaller, a factor of 1.66, it still persists.
We also show the Li abundances with cluster age in these unevolved stars in the same eight clusters in Figure 5. The ages ranges from 14.21 Gyr for NGC 6397 to 11.21 Gyr for M71 according to Valcin et al. (2020). The ages of globular clusters can be well-estimated with stellar evolution models as opposed to field stars where there can be a large age spread at a given metallicity. The samples of stars studied in each of these clusters have a uniform age as first-generation stars, and presumably a uniform initial composition.
We can reasonably attribute the spread in Li content in stars that are otherwise virtually identical in each cluster to differences in the initial angular momentum of the protostars in each star-forming proto-cluster. During the stellar spin-down the surface Li is mixed to deeper layers and destroyed by nuclear reactions with a proton at a temperature of 2.5 x 10⁶ K. All the stars are now slow rotators but those with the greatest initial rotation have had the largest reduction in initial Li. Effects such as atmospheric diffusion may also contribute to the observed spread in Li abundances.
References
- (1) Aoki, M., Primas, F., Pasquini, L. et al. 2021, A&A, 653, A13
- (2) Bailin, J. 2019, ApJS, 245, 5
- (3) Bandyopadhyay, A., Sivarani, T., Beers, T.C. et al. 2022, ApJ, 937, 52
- (4) Boesgaard A. M., Armengaud E., King J. R., Deliyannis C. P., & Stephens A., 2004, ApJ, 613, 1202
- (5) Boesgaard, A.M. & Deliyannis, C.P. 2023, ApJ, 954, 91
- (6) Boesgaard, A.M., Deliyannis, C.P., Stephens, A. et al. 1998, ApJ, 493, 206
- (7) Boesgaard, A.M., King, J.K., Cody, A.M. et al. 2005, ApJ, 629, 832
- (8) Boesgaard, A.M., Novicki, M.C. & Stephens, A., 2005, Proceedings IAU Sym. 228, ed. V. Hill, Francois, P. & Primas, F. (Cambridge Univ. Press: Cambridge UK) p. 29
- (9) Boesgaard, A.M., Stephens, A., King, J.R. et al. 2000, Proc. SPIE, 4005, 274
- (10) Boesgaard, A. M., & Tripicco, M. J. 1986, ApJ, 302, L49
- (11) Boesgaard, A. M., Deliyannis, C. P., & Steinhauer, A. 2005, ApJ, 621, 991
- (12) Boesgaard, A. M., Lum, M. G., Deliyannis, C. P., et al. 2016, ApJ, 830, 49
- (13) Boesgaard, A. M., Lum, M. G., & Deliyannis, C. P. 2020, ApJ, 888, 28
- (14) Boesgaard, A. M., Lum, M. G., Chontos, A., & Deliyannis, C. P. 2022, ApJ, 927, 118
- (15) Bonifacio, P., Pasquini, L., Molaro, P. et al. 2007, A&A, 470, 153
- (16) Bonifacio, P., Pasquini, L., Spite, F. et al. 2002, A&A, 390, 91
- (17) Carney, B.W. 1983, AJ, 88, 610
- (18) Charbonnel, C. & Primas, F. 2005, A&A, 442, 961
- (19) Charbonnel, C., Vauclair, S., Maeder, A., et al. 1994, A&A, 283, 155
- (20) Deliyannis, C. P. 1990, PhD Dissertation, Yale University.
- (21) Deliyannis, C. P., “Using Beryllium to Explore Stellar Structure and Evolution invited review; summary in The Light Element Abundances, Proceedings of an ESO/EIPC Workshop Held in Marciana Marina, Isola d’Elba, 21-26 May 1994 (Italy), ed. P. Crane (Springer-Verlag), p. 395.
- (22) Deliyannis, C. P., Anthony-Twarog, B. J., Lee-Brown, D. B., & Twarog, B. A. 2019, AJ, 158, 163
- (23) Deliyannis, C.P. 1990 PhDT
- (24) Deliyannis, C.P., Boesgaard, A.M. & King, J.R. 1995, ApJ, 425, L13
- (25) Deliyannis, C.P., Boesgaard, A.M., Stephens, A., et al. 1998, ApJ, 498, L147
- (26) Deliyannis, C.P., Demarque, P. & Kawaler, S. 1990 ApJS, 73, 21
- (27) Deliyannis, C. P., & Pinsonneault, M. H., 1997, ApJ, 488, 836
- (28) Endal, A. S., & Sofia, S. 1976, ApJ, 210, 184
- (29) Endal, A. S., & Sofia, S. 1981, ApJ, 243, 625
- (30) Fields, B.D., Olive, K.A., Yeh, T-H. et al 2020, JCAP, 03, 010
- (31) Gonzalez Hernandez, J.I., Bonifacio, P., Caffau, E. et al. 2009, A&A, 505, L13
- (32) Gruyters, P., Nordlander, T., & Korn, A. J. 2014, A&A, 567, A72
- (33) Hodder, P.J.C., Nemec, J.M., Richer, H.P. et al. 1992, AJ, 103, 460
- (34) Iben, I., Jr. 1965, ApJ, 142, 1447
- (35) Iben, I., Jr. 1967, ApJ, 147, 624
- (36) Jeffries, R. D., Jackson, R. J., Sun, Q., & Deliyannis, C. P. 2021, MNRAS, 500, 1158
- (37) Lind, K., Primas, F., Charbonnel, C. et al. 2009, A&A, 503, 545
- (38) Meneguzzi, M., Audouze, J, & Reeves, H, 1971, A&A, 15, 337
- (39) Monaco, S., Villanova, S., Bonifacio, P. et al. 2012, A&A, 539, A157
- (40) Pasquini, L. Bonifacio, P., Molaro, P. et al. 2005, A&A, 441, 549
- (41) Pasquini, L. & Molaro, P. 1996, A&A, 307, 761
- (42) Pasquini, L. & Molaro, P. 1997, A&A, 322, 109
- (43) Pinsonneault, M.H., Deliyannis, C.P. & Demarque, P. 1992, ApJS, 78, 179
- (44) Pinsonneault, M. H., Kawaler, S. D., Sofia, S., & Demarque, P. 1989, ApJ, 338, 424
- (45) Pinsonneault, M. H., Walker, T. P., Steigman, G., et al. 1999, ApJ, 527, 180
- (46) Reeves, H., Fowler, W.A., & Hoyle, F. 1970, Nature, 226, 727
- (47) Roederer, I.U., Preston, G.W., Thompson, I.B. et al. 2014, ApJ, 147, 136
- (48) Romano, D., Matteucchi, F., Molaro, P. et al. 1999, A&A, 352, 177
- (49) Ryan, S. G., & Deliyannis, C. P. 1995, ApJ, 453, 819
- (50) Sandage, A. R. 1970, ApJ, 162, 841
- (51) Schiappacasse-Ulloa, J., Lucatello, S., Rain, M.J. et al. 2022, MNRAS, 511, 231
- (52) Sills, A., & Deliyannis, C. P. 2000, ApJ, 544, 944
- (53) Sneden, S. 1973, ApJ, 184, 839
- (54) Sneden, C., Bean, J., Ivans, I et al. 2012, MOOG: LTE line analysis and spectrum synthesis, Astrophysics Source Code Library, ascl: 1202.009
- (55) Somers, G., & Pinsonneault, M. H. 2015a, MNRAS, 449, 4131
- (56) Spite, F. & Spite, M. 1982 A&A, 115, 357
- (57) Spite, M., Spite, F., Gallagher, A.J. et al. 2016, A&A, 594, A79
- (58) Stetson, P.B., Pancino, E., Zocchi, A. et al. 2019, MNRAS, 485, 3042
- (59) Sun, Q., Deliyannis, C. P., Steinhauer, A., et al. 2023, ApJ, 952, 71
- (60) Thorburn, J. A., Hobbs, L. M., Deliyannis, C. P., & Pinsonneault, M. H. 1993, ApJ, 415, 150
- (61) Valcin, D., Bernal, J.L., Jimenez, R. et al. 2020, JCAP, 12, 002 V
- (62)
| Star (PS) | V | B-V | (B-V)o | Date (UT) | Exp(min) | Total(min) | S/N |
|---|---|---|---|---|---|---|---|
| 33857 | 17.884 | 0.513 | 0.470 | 1997 May 27 | 245 | ||
| 1998 Jun 21 | 345 | 225 | 45 | ||||
| 38266 | 17.885 | 0.513 | 0.470 | 1997 May 27 | 445 | ||
| 1998 Jun 21 | 445 | 360 | 65 | ||||
| 45212 | 17.880 | 0.512 | 0.463 | 1997 May 27 | 345 | ||
| 1997 Aug 30 | 345 | ||||||
| 1998 Jun 21 | 245 | ||||||
| 1998 Jun 22 | 445 | 540 | 72 | ||||
| 45588 | 17.880 | 0.518 | 0.475 | 1998 Jun 22 | 345 | 135 | 36 |
| Star | V | B-V | (B-V)0 | Date(UT) | Exp(min) | Total(min) | S/N |
|---|---|---|---|---|---|---|---|
| 239 | 17.62 | 0.81 | 0.53 | 1997 Aug 31 | 245 | ||
| 1998 Sep 10 | 160 | ||||||
| 1998 Sep 11 | 145 | 195 | 60 | ||||
| 259 | 17.66 | 0.82 | 0.54 | 1996 Jul 26 | 160 | ||
| 1996 Jul 27 | 145 | ||||||
| 1997 Aug 30 | 245 | ||||||
| 1998 Sep 11 | 145 | 240 | 50 | ||||
| 260 | 17.66 | 0.79 | 0.51 | 1997 Aug 31 | 245 | ||
| 1997 Aug 31 | 130 | ||||||
| 1998 Sep 11 | 160 | 180 | 50 | ||||
| 264 | 17.67 | 0.81 | 0.53 | 1997 Aug 31 | 345 | 135 | 48 |
| 273 | 17.68 | 0.81 | 0.53 | 1996 Jul 27 | 145 | ||
| 1997 Aug 30 | 245 | ||||||
| 1998 Jun 23 | 145 | ||||||
| 1998 Sep 10 | 160 | ||||||
| 1998 Sep 10 | 145 | 225 | 60 |
| Star | Temperature | [Fe/H] | EQW(Li) | A(Li) | A(Li) | ||
|---|---|---|---|---|---|---|---|
| (K) | (dex) | (km s-1) | (dex) | (mÅ) | (blends) | (synth) | |
| 33857……… | 5890 | 3.80 | 1.50 | 1.44 | 14.2 | 1.79 | 1.85 |
| 38266……… | 5900 | 3.80 | 1.50 | 1.44 | 50.5 | 2.43 | 2.45 |
| 45212……… | 5840 | 3.80 | 1.50 | 1.44 | 21.0 | 1.94 | 2.01 |
| 45588……… | 5910 | 3.80 | 1.50 | 1.44 | 56.0 | 2.49 | 2.38 |
| Star | Temperature | [Fe/H] | EQW(Li) | A(Li) | A(Li) | ||
|---|---|---|---|---|---|---|---|
| (K) | (dex) | (km s-1) | (dex) | (mÅ) | (blends) | (synth) | |
| 239……… | 5845 | 4.01 | 1.00 | 0.80 | 30.0 | 2.12 | 2.20 |
| 259……… | 5800 | 3.98 | 1.00 | 0.80 | 28.1 | 2.05 | 2.10 |
| 260……… | 5930 | 4.08 | 1.00 | 0.80 | 43.3 | 2.38 | 2.28 |
| 264……… | 5845 | 4.01 | 1.00 | 0.80 | 29.5 | 2.11 | 2.05 |
| 273………. | 5845 | 4.01 | 1.00 | 0.80 | 24.0 | 2.01 | 1.87 |