The true nature of HE 0057-5959, the most metal-poor Li-rich star
The Li-rich stars are a class of rare objects with a surface lithium abundance, A(Li), that exceeds that of other stars in the same evolutionary stage. The origin of these stars is still debated and valuable routes are the Cameron-Fowler mechanism, mass transfer process in a binary system or engulfment of rocky planets or brown dwarfs. Metal-poor ([Fe/H]–1 dex) stars are only a small fraction of the entire population of Li-rich stars. We observed with MIKE at the Magellan Telescope the metal-poor ([Fe/H]=–3.950.11 dex) giant star HE 0057-5959, deriving =+2.090.07 dex. Such Li abundance is significantly higher by about 1 dex than that of other stars in the same evolutionary stage. A previous analysis of the same target suggested that its high A(Li) reflects a still ongoing First Dredge-Up process. We revise the nature of HE 0057-5959 by comparing its stellar parameters and A(Li) with appropriate stellar evolution models describing Li depletion due to the deepening of the convective envelope. This comparison rules out that HE 0057-5959 is caught during its First Dredge-Up, being this latter already ended according to the parameters of this star. Its A(Li), remarkably higher than the typical lithium plateau drawn by similar giant stars, demonstrates that HE 0057-5959 joins the class of the rare metal-poor Li-rich stars. HE 0057-5959 is the most metal-poor Li-rich star discovered so far. We consider different scenarios to explain this star also comparing it with the other metal-poor Li-rich stars. No internal mixing able to activate the Cameron-Fowler mechanism is known for metal-poor stars at this evolutionary stage. Also the engulfment of planets is disfavoured because such metal-poor stars should not host planets. Finally, HE 0057-5959 is one of the most Na-rich among the Li-rich stars and we found that a strong excess of Na abundance is common to all the three Li-rich stars with [Fe/H]-3 dex. This finding could support the scenario of mass transfer from a massive companion star (able to simultaneously produce large amounts of both elements) in a binary system, even if we found no evidence of radial velocity variations.
Key Words.:
stars: abundances; techniques: spectroscopic; Galaxy: abundances1 Introduction
Lithium is one of the few nuclei produced during the Big Bang nucleosynthesis. Because of its fragility, the Li nuclei are immediately destroyed in stellar layers exceeding temperatures of K. In a low-mass star, the surface lithium abundance A(Li) changes with the time and its changes reflect the main episodes of mixing occurring during the evolution of the star. When the convective envelope deepens into the stellar interior reaching stellar layers hot enough to burn Li, Li-free material is brought to the surface reducing A(Li). The evolution of A(Li) with the luminosity (or the gravity) can be described as two phases with constant A(Li), namely the Spite Plateau (Spite & Spite 1982; Bonifacio & Molaro 1997; Aoki et al. 2009) and the lower red giant branch (RGB) Plateau (Mucciarelli et al. 2012, 2022), both followed by an abrupt drop corresponding to the First Dredge-Up (FDU) and the RGB bump (RGBb) mixing episode, respectively. The A(Li) depletion at the FDU is a natural consequence of the standard stellar evolution (Iben 1967) while to explain the second drop at the RGBb non-canonical mixing processes have to be included, the most popular one being the thermohaline mixing (see e.g. Charbonnel et al. 2020).
Within this framework, the so-called Li-rich stars are a class of peculiar and rare objects whose A(Li) significantly exceeds that measured in stars of similar evolutionary stage. In some cases (see e.g. Koch et al. 2011; Kowkabany et al. 2022), metal-poor stars have A(Li) higher than the abundance formed during the Big Bang and inferred by the baryon density obtained from Wilkinson Microwave Anisotropy Probe (WMAP) and Planck satellites (A(Li)=+2.720.04 dex, Coc & Vangioni 2017), while some metal-rich stars have A(Li) higher than that of the interstellar medium (A(Li)+3.3 dex, Asplund et al. 2009). These very high A(Li) values suggest that lithium is not preserved but other mechanisms of production should be at work. Their frequency is 1 % or less of all the stars (Kirby et al. 2016; Casey et al. 2016; Gao et al. 2019; Deepak et al. 2020). They have been observed at any metallicity (Ruchti et al. 2011; Martell & Shetrone 2013; Gao et al. 2019; Sitnova et al. 2023), in any evolutionary stages (Kirby et al. 2016; Li et al. 2018), in the Milky Way halo (Ruchti et al. 2011; Li et al. 2018), thick disc (Monaco et al. 2011), thin disc (Casey et al. 2016; Deepak et al. 2020) and bulge (Gonzalez et al. 2009), and dwarf spheroidal galaxies (Kirby et al. 2012), as well as in globular clusters (GCs, Smith et al. 1999; Ruchti et al. 2011; Koch et al. 2011; Monaco et al. 2012; D’Orazi et al. 2015; Kirby et al. 2016; Mucciarelli et al. 2019; Sanna et al. 2020) and in open clusters (Monaco et al. 2014).
Li-rich stars could be explained invoking different classes of processes, namely internal production or external origin of the extra Li. Three main groups of processes have been proposed to explain the existence of these stars, namely the Cameron-Fowler mechanism, mass transfer in binary systems and engulfment of small bodies.
(a) Cameron (1955) and Cameron & Fowler (1971) proposed a mechanism to produce fresh Li in Asymptotic Giant Branch (AGB) stars experiencing the hot bottom burning. 7Li is produced after the decay of 7Be. However the temperatures needed to produce 7Be from -capture on 3He are one order of magnitude higher than the temperature of Li burning. Therefore, new Li is immediately destroyed but if 7Be is fast transported toward cooler regions, Li can survive. The Cameron-Fowler mechanism, originally proposed for intermediate-mass AGB stars (indicatively in the mass range 4-8 , see e.g. Sackmann & Boothroyd 1992; Ventura & D’Antona 2011), can work whenever a mechanism carries 7Be to cooler stellar regions. In the case of AGB stars, this process is driven by the convection, being the bottom of the convective envelope hot enough to produce 7Be. The existence of Li-rich stars at different metallicity, mass and evolutionary stage can be explained with the Cameron-Fowler mechanism only invoking extra mixing, i.e. thermohaline mixing (Charbonnel & Primas 2005), magneto-thermohaline (Denissenkov et al. 2009), mass-loss mechanisms occurring in RGB (de La Reza et al. 1996). An additional mechanism able to trigger the Cameron-Fowler mechanism is the ingestion of sub-stellar companions, like rocky planets or brown dwarfs causing an increase of angular momentum and a rotationally induced mixing (Denissenkov & Herwig 2004).
(b) Accretion of matter from a companion with an enhancement of Li, for instance any star able to trigger the Cameron-Fowler mechanism. Intermediate-mass AGB stars are the natural candidates, assuming that the low-mass Li-rich star belongs to a binary system with a massive companion (now evolved as a white dwarf). Possible additional signatures of this process could be an enhancement of those elements produced in the interiors of AGB stars (i.e., carbon and slow neutron-capture elements) and radial velocity variability.
(c) engulfment of sub-stellar companions, like rocky planets, hot Jupiters, brown dwarfs, having high Li enhancement (Siess & Livio 1999). This process should be coupled with infrared excess, possible strong magnetic fields and X-ray activities.
In this paper, we discuss the metal-poor, giant star HE 0057-5959 (Gaia EDR3 4903905598859396480) whose A(Li) has been previously derived by Jacobson et al. (2015) and interpreted as a normal giant star caught during its still ongoing FDU.
2 MIKE Observations and chemical analysis
2.1 Observations and radial velocity
The target star HE 0057-5959 was observed with the Magellan Ianmori Kyocera Echelle (MIKE) spectrograph (Bernstein et al. 2003) mounted at the Magellan II Telescope at Las Campanas Observatory, under the program CN2017B-54 (PI: Monaco) during the night 2017 October 6th. We adopted a 0.7”X5.0” slit corresponding to spectral resolution of 53,000 and 42,000, in the blue and red arm respectively and covering the spectral range between 3400 Å and 9400 Å. A total exposure time of 3 by 3000 sec was adopted, providing a signal-to-noise ratio for pixel of 80 around the Li line at 6708 Å. The spectral reduction, including bias-subtraction, flat-fielding, spectral extraction and wavelength calibration was performed with the dedicated CarPy pipeline (Kelson 2003). The heliocentric radial velocity (RV) was measured through a cross-correlation against a synthetic spectrum as template, obtaining +376.20.2 km s-1 , in agreement with the previous estimates by Norris et al. (2013, +375.3 km s-1), Jacobson et al. (2015, +376.7 km s-1) and Arentsen et al. (2019, +377.903.98 and +378.231.47 km s-1). No RV values are provided by Gaia.
2.2 Atmospheric parameters
The effective temperature () and the surface gravity () were estimated by the photometry in order to avoid significant biases affecting the spectroscopic determinations of these parameters in metal-poor giant stars (see Mucciarelli & Bonifacio 2020). We adopted magnitudes from the early third data release of the ESA/ mission (Prusti et al. 2016; Gaia Collaboration et al. 2020) and a colour excess of E(B-V)= 0.017 mag by Schlafly & Finkbeiner (2011). The extinction coefficients of the three Gaia bands were derived adopting the iterative procedure described in Lombardo et al. (2021). Effective temperature was estimated using the - transformation by Mucciarelli, Bellazzini & Massari (2021), deriving = 542080 K, where the uncertainty includes those arising from the photometric color, the colour excess and the adopted colour- transformation. We check that derived from the other two Gaia colours, and , are in excellent agreement with that by , =5477 and 5426 K, respectively.
Stellar luminosity () was calculated adopting the photogeometric distance posterior from the Gaia parallax provided by Bailer-Jones et al. (2021) and the bolometric correction calculated from a new grid of synthetic fluxes (Mucciarelli et al. in prep.) computed with the code ATLAS9 (Kurucz 2005). Surface gravity (= –10.32 + log(M) +4- log(L) ) was obtained adopting the photometric and the stellar luminosity described above and a stellar mass equal to 0.76 that is a reasonable value for RGB stars with old ages and low metallicities, according to theoretical isochrones by Pietrinferni et al. (2021). Ages in the range of 11-13 Gyr, reasonable for a very metal-poor star like HE 0057-5959 , provide very similar stellar masses along the RGB, lower than 0.82 with a negligible impact (less than 0.04 dex) on . In the quoted uncertainty we accounted for uncertainties in , luminosity and adopted stellar mass.
Microturbulent velocity was estimated spectroscopically by minimising any trend between the abundances from Fe I lines and their reduced equivalent widths. The final parameters for HE 0057-5959 are = 542080 K, = 3.050.10, = 1.180.14, and = 1.50.2 km s-1see Table 1. These values well agree with those estimated by Jacobson et al. (2015), = 5413 K, = 3.41, and =1.4 km s-1. On the other hand, the temperature provided by Norris et al. (2013) is cooler (5257 K) and derived as the average of temperatures from spectrophotometric flux and Balmer lines. For the chemical analysis of this star, Yong et al. (2013) adopted by Norris et al. (2013), while a new value of (2.65 dex) was derived based on the stellar temperature and a theoretical isochrone with appropriate metallicity and age of 10 Gyr. Their lower reflects mainly the difference in between our and their analysis.
| Parameter | Value |
|---|---|
| 542080 K | |
| 3.050.10 | |
| 1.50.2 km s-1 | |
| 1.180.14 |
2.3 Chemical analysis
Abundances of Mg, Al, Si, Ca, Ti and Fe were obtained from measured equivalent widths (EWs) using the code
GALA (Mucciarelli et al. 2013a), while for atomic transitions affected by blending and/or isotopic/hyperfine splittings
(Li, Na, Sr and Ba) and molecular features (G-band for C), the abundances were derived
through a -minimisation between the observed lines and grids of synthetic spectra
calculated with SYNTHE (Kurucz 2005).
For other species, spectral lines are too weak and undetectable because of the very low metallicity
of the target star, coupled with its relatively high , preventing also useful upper limits.
We checked also the possibility to measure N and 12C/13C but we cannot identify 13C transitions
or CN molecular bands at 3870-3885 Å . Despite the importance of N and 12C/13C, the derived
upper limits are not meaningful ([N/Fe]+3.5 dex, 12C/13C5) and they do not provide useful insights
for the interpretation of the target star.
In this analysis, we adopted an ATLAS9 model atmosphere (Kurucz 1993, 2005)
calculated with a new opacity distribution function (Mucciarelli et al. in prep.) with [Fe/H]=–4.0 dex
and [/Fe]=+0.4 dex.
Abundance ratios scaled on the solar abundances by Lodders (2010) and Caffau et al. (2011) are
listed in Table 2, together with the number of measured lines and the total uncertainty.
The latter was computed by adding in quadrature the internal error and that arising from the adopted
atmospheric parameters (uncertainties in the derived parameters are discussed in Section 2.2).
The internal error is estimated as the standard error of the mean ()
when at least two lines are measured, while for element with one only transition we consider
the uncertainty on the abundance as obtained from the EW error or from Montecarlo simulations,
for lines measured from EWs and spectral synthesis respectively (see details in Mucciarelli et al. 2013b).
We report in Table 2 both LTE and NLTE abundances, in the latter case adopting the corrections
by Wang et al. (2021) for Li, by Lind et al. (2011) for Na, by Nordlander & Lind (2017) for Al, by Bergemann et al. (2013)
for Si and by Mashonkina et al. (2023) for the other elements.
The atomic data of the measured atomic lines are listed in Appendix B.
We derived [Fe/H]=–3.950.11 dex. Departures from LTE increase the Fe abundance of this star by +0.22 dex
(Mashonkina et al. 2023). In the following discussion we refer to the LTE [Fe/H] for consistency with the [Fe/H] values
derived for all the other Li-rich metal-poor stars known so far but the use of NLTE [Fe/H] does not change
our conclusion about the nature of HE 0057-5959 .
The star is enhanced in [/Fe] (Mg, Si, Ca and Ti) and characterised by sub-solar [Sr/Fe] and [Ba/Fe].
Also, the star is enhanced in [C/Fe] (+1.07 dex), indicating that it can be labelled as CEMP-no (enhanced in C but
not in s-process elements), as already suggested by Jacobson et al. (2015).
The comparison with the abundances measured by Yong et al. (2013) and Jacobson et al. (2015) is discussed
in Appendix C.
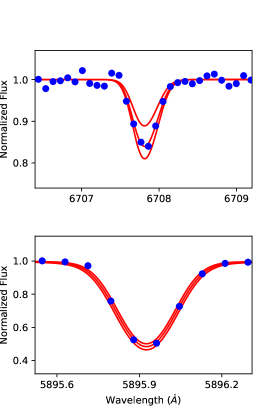
Lithium abundance was derived from the resonance line at 6708 Å , while the subordinated Li
line at 6103 Å is not detected.
The 3D-NLTE correction by Wang et al. (2021) was applied to the Li abundance, leading to a final abundance
of =+2.090.07, consistent with the value quoted by Jacobson et al. (2015), =+1.97 dex.
The NLTE correction for this star is of +0.04 dex.
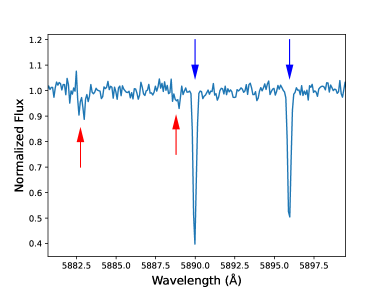
Sodium abundance is derived from the Na D lines at 5890 and 5896 Å that are the only Na transitions
visible in the spectrum because of the very low metallicity of the star (also Yong et al. (2013) and Jacobson et al. (2015)
derived the Na abundance of HE 0057-5959 measuring these two lines only).
We checked that the Na D lines are not contaminated by Na interstellar lines because of the high RV of the star (see Figure 9).
The NLTE corrections for Na abundance by Lind et al. (2011) were applied, leading to [Na/Fe]=+1.920.08 dex,
in agreement with the values listed by Yong et al. (2013) and Jacobson et al. (2015).
The Na doublet at 5682-88 Å is too weak to be observed and we can only derive an upper limit, [Na/Fe]2.1 dex.
Fig. 1 shows as examples the best-fit synthetic spectra obtained for Li and Na lines.
| Ion | LTE | NLTE | ||
|---|---|---|---|---|
| (dex) | (dex) | (dex) | ||
| A(Li) | 1 | +2.05 | 2.09 | 0.07 |
| [C/Fe] | 1 | +1.07 | — | 0.10 |
| [Na/Fe] | 2 | +1.92 | +1.17 | 0.08 |
| [Mg/Fe] | 4 | +0.54 | +0.41 | 0.05 |
| [Al/Fe] | 2 | –0.11 | +0.29 | 0.16 |
| [Si/Fe] | 1 | +0.85 | +0.63 | 0.15 |
| [Ca/Fe] | 1 | +0.44 | +0.22 | 0.07 |
| [Ti II/Fe] | 3 | +0.44 | +0.41 | 0.10 |
| [Fe/H] | 21 | –3.95 | –3.75 | 0.11 |
| [Sr II/Fe] | 1 | –1.11 | –1.12 | 0.15 |
| [Ba II/Fe] | 1 | –1.47 | –1.49 | 0.20 |
3 The evolutionary stage of HE0057-5959
Jacobson et al. (2015) derived for a sample of 24 metal-poor giant stars, including HE 0057-5959.
All these stars are fainter than that of the RGBb (with between 4700 and 5400 K)
and therefore they are not affected by the extra-mixing episode associated to the RGBb.
The sample stars have very similar , around +1.0 dex, well matching the values observed by Mucciarelli et al. (2022)
for stars in the same evolutionary stage. In the Jacobson et al. (2015) sample HE 0057-5959 is a clear outlier, with
a significantly higher lithium abundance (=+1.97 dex)
despite having only a slightly higher and lower than the other sample stars.
Jacobson et al. (2015) quoted for this star = 5413 K, while the hottest star in the remaining sample
has = 5260 K and = 1.21 dex. They do not recognise HE 0057-5959 as a Li-rich star, claiming that
this star has a A(Li) depletion level appropriate to its . In other words, they interpret this star as a Li-normal star
with an high due to a still ongoing FDU, the only mechanism able to justify the measured without invoking
an anomalous enhancement of lithium.
Stellar parameters and from our new analysis agree with those by Norris et al. (2013) and Jacobson et al. (2015) and
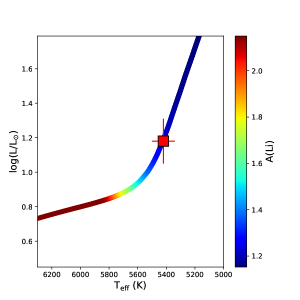
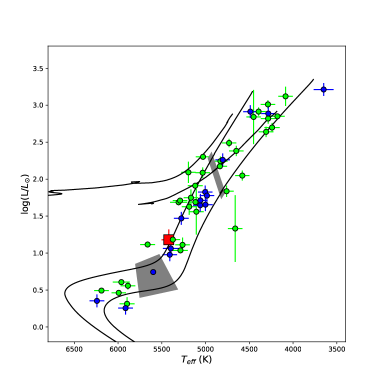
we confirm that HE 0057-5959 belongs to the first ascent of the RGB (see left panel of Fig. 2).
The luminosity of the target is fainter than the RGBb (occurring at 2.35 for the metallicity of the star,
see left panel of Fig. 2.)
confirming that HE 0057-5959 is not affected by the extra-mixing episode associated to the RGBb.
In order to establish whether its is compatible with an ongoing FDU,
we compared the of HE 0057-5959 with that predicted by a theoretical model
(calculated with the same code and input physics as in Pietrinferni et al. 2021)
of a star with 0.76 and Z=3.3 (corresponding to [Fe/H]=–4.0 dex
and [/Fe]=+0.4 dex) and without atomic diffusion.
As clearly visible in left panel of Fig. 2, at this metallicity the drop of A(Li) due to the FDU occurs at the end of the
sub-giant branch and it is confined in a narrow region in , 5500–5800 K, and , 0.8–1.0.
The stellar parameters of HE 0057-5959, within their uncertainties, are not compatible with the position of the FDU
and they indicate that the star has already finished the FDU. The same conclusion is reached whether
the stellar parameters derived by Norris et al. (2013) and Jacobson et al. (2015) are adopted, see Section 2.2.
If we assume that this star before the FDU had similar to that of the Spite Plateau stars (2.2-2.3 dex),
the measured abundance ( =+2.09 dex) should be observed when the star starts its FDU,
at hotter by 300-400 K and fainter by 0.4 dex with respect to those of HE 0057-5959.
Therefore, the measured of HE 0057-5959 is not compatible
with what we expect for a star in that evolutionary stage starting from the Spite Plateau.
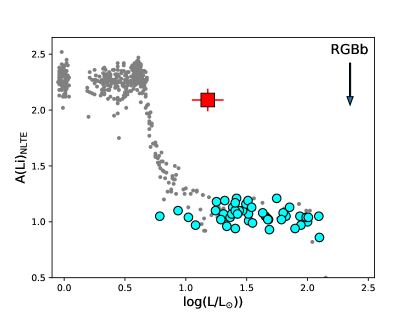
Also, of HE 0057-5959 is clearly incompatible with the abundances of lower RGB stars that share a very similar A(Li) close to +1.0 dex
(see right panel of Fig. 2).
Hence, we revise the nature of HE 0057-5959, claiming that it is a genuine Li-rich star, having
a lithium abundance significantly higher than those measured in stars at the same evolutionary stage
and not compatible with a still ongoing FDU.
This is the most metal-poor Li-rich star discovered so far, followed by the giant star LAMOST J070542.30+255226.6
with [Fe/H]=–3.12 dex (Li et al. 2018).
4 Metal-poor Li-rich stars in the literature
In order to properly compare the properties of HE 0057-5959 with those of other Li-rich stars, we collected a database of all the metal-poor ([Fe/H]–1.0 dex) Li-rich stars discovered so far in our Galaxy, performing an effort to homogenise their stellar parameters and . Adopting for each star the literature stellar parameters and LTE A(Li) derived from the 6708 Å line, we calculated the corresponding synthetic profile and its equivalent width by integration. After that, we calculated the curve of growth for the Li line assuming the new stellar parameters and we derived the new A(Li) based on the previous equivalent width. The average difference between the LTE A(Li) values obtained with the new and literature parameters are +0.010.03 dex (=0.18 dex) with only three stars with an absolute discrepancy larger than 0.3 dex. Excluding these three stars the average difference is +0.040.02 dex (=0.12 dex). For all the stars we applied the 3D-NLTE corrections by Wang et al. (2021). Table 3 and 4 list for all the targets the new , , , and the literature values of [Fe/H] and [Na/Fe]. The position of all the metal-poor Li-rich stars in the Hertzsprung-Russell diagram is shown in Fig. 3 where we highlight the mean loci of the FDU and RGBb. We show also two theoretical isochrones with age of 13 Gyr and [Fe/H]=–3.2 and –1.2 dex (Pietrinferni et al. 2021) as a reference to identify the evolutionary stage of the Li-rich stars.
4.1 Galactic field Li-rich stars
Aside HE 0057-5959, 34 metal-poor Li-rich stars (all of them with higher than the average A(Li) measured in stars with the same evolutionary stage) have been discovered in the Milky Way field, covering a range of metallicity between [Fe/H]–3.1 and –1.4 dex. All these stars were recovered in the Gaia eDR3 catalogue and their parameters (, and ) were derived using the same approach described in Section 2. We adopted the colour excess from the latest 3-dimensional dust extinction maps by Lallement et al. (2022) for the closest targets, and values from Schlafly & Finkbeiner (2011) for those targets whose distance is outside the maps by Lallement et al. (2022). The uncertainties in are dominated by the precision of the adopted colour- transformation (80 K, see Mucciarelli, Bellazzini & Massari 2021), with a negligible contribution arising from photometric error and reddening. The uncertainties in are smaller than 0.1 dex and dominated by the distance error. Only for four stars (namely SDSS J093627.44+293535.7, 2MASS J10122548-2030068, 2MASS J16070923+0447126 and SDSS J143207.14+081406.1) errors in are higher than 0.2 dex, reflecting their large uncertainty in the Gaia parallaxes. For seven stars with lower than 1.3 (the boundary of the grid by Wang et al. 2021) we adopted =1.3 to calculate the 3D-NLTE correction. The new parameters well agree with the literature ones, with average differences (this study - literature) of +1923 K (=137 K) for and +0.020.03 (=0.20) for . The largest differences are in for the stars LAMOST J055408.54+523559.0, LAMOST J075816.39+470343.3 (Li et al. 2018), 2MASS J05241392-0336543 (Kowkabany et al. 2022) and UCAC4 212-183136 (Susmitha et al. 2024), with differences of –330, –254, –300 K and +228 K, respectively.
4.2 Galactic globular clusters Li-rich stars
16 Li-rich stars have been discovered so far in Galactic GCs.
We recovered 15 of them in the Gaia catalogue, excluding the cepheid star V42 in M5 (Carney et al. 1998)
because its variability leads to large uncertainties in the stellar parameters.
Three Li-rich stars have a double identification: Stet-M68-S232 in M68 (Ruchti et al. 2011; Kirby et al. 2016),
M3-IV 101 in M3 (Kraft et al. 1999; Ruchti et al. 2011) and 132 in M30 (Kirby et al. 2016; Gruyters et al. 2016).
Their stellar parameters were derived adopting [Fe/H], distance and E(B-V) by Harris (1996, 2010 edition)
but for the two Li-rich stars in Centauri (Mucciarelli et al. 2019) for which we adopted their proper [Fe/H] values.
For the Li-rich stars in NGC 1261 and NGC 6397 we assumed A(Li)=4.0 dex to avoid extrapolation
in the 3D-NLTE grids. For other three stars (namely M3-IV in M3, Stet-M68-S232 in M68 and V2 in NGC 362)
we assumed = 1.3 as explained above for the field Li-rich stars.
The Gaia well agree with the values quoted in the literature, with an average difference
of +1130 K (=116 K) and no relevant outliers but the cold star V2 in NGC 362 (Smith et al. 1999)
that we found 250 K cooler.
Concerning the average difference is +0.060.04 (=0.17); most of the targets have
differences in within 0.1 with three main exceptions: V2 in NGC 362 that has lower by 0.4 dex
than the Smith et al. (1999) value, 97812 in NGC 3201 (Aguilera-Gómez et al. 2022) and M3-IV in M3 (Ruchti et al. 2011) that
have higher than the literature by 0.4 dex.
5 Discussion
5.1 The Li-rich star HE 0057-5959
The star HE 0057-5959 discussed in this work is the most metal-poor Li-rich star identified so far. What is the origin of its Li enhancement? We consider the main mechanisms previously proposed to explain Li-rich stars.
Concerning the scenario of internal Li production, the main issue for this star is the lack of an internal mixing process able to activate the Cameron-Fowler mechanism. Due to the low metallicity of the star, its shallow convective envelope cannot reach the layers where 7Be is produced through -captures on 3He and this region is not in contact with the surface, preventing any internal mixing. Possible extra-mixing mechanisms can occur in low-mass stars but at the RGBb (Charbonnel & Balachandran 2000; Palacios et al. 2001) or close to the He-flash (Silva Aguirre et al. 2014), while this star is located at the base of the RGB.
Mass transfer process from a more massive, now evolved, companion star able to produce fresh Li from the Cameron-Fowler mechanism is a valuable and simple route to explain Li-rich stars. The measured RV from our MIKE spectrum nicely matches the previous estimates indicating no large RV variations. The RUWE value of the star is 0.98, indicating a well-behaved single star astrometric solution. However, wide binary systems can have too long periods to be identified with the Gaia observations. We cannot totally rule out that the star belongs to a long-period or highly inclined binary. In this case, the enhancement of Li could be explained as the result of a mass transfer process from a more massive companion star during its AGB stage. We note that none of the Li-rich stars for which multiple epochs are available has shown evidence of variability, with the only exception of 25664 in Centauri (Mucciarelli et al. 2021).
The Li overabundance in a giant star can be the result of engulfment of a planet as the star evolves on the RGB, increasing its radius. This seems to be the most likely explanation for the solar metallicity Li-rich giant BD+48 740 (Adamów et al. 2012). However the extremely low metallicity of HE 0057-5959 makes it unlikely that it hosts, or has hosted planets. In spite of early claims that the frequency of planets around giant stars is not correlated to metallicity (Pasquini et al. 2007), subsequent investigations found that the higher the metallicity, the higher the probability of hosting a planet (Wolthoff et al. 2022, and references therein), similar to what found for dwarf stars (Adibekyan 2019, and references therein). To our knowledge the two planet-host stars with the lowest metallicity are BD+20 2457 (Maldonado et al. 2013) and 24 Boo (Takarada et al. 2018), both of metallicity around –0.8 dex. Clearly if we were to extrapolate this metallicity dependence of hosting planets down to –4.0 dex we would found a very small number, practically zero. One should however keep in mind that the stars with metallicity below –3.0 dex are not represented in any of the planet search surveys, thus such an extrapolation cannot be supported by any data. We nevertheless believe that, based on our current knowledge, the possibility that the high Li abundance in HE 0057-5959 is due to planet engulfment can be discarded.
In conclusion, the mass transfer scenario remains the most promising one, lacking a well established mechanism able to induce a Cameron-Fowler mechanism in a low-mass, very metal-poor star like HE 0057-5959. Whatever mechanism is able of generating a Li-rich star, that mechanism must also occur down to [Fe/H]–4 dex.
5.2 An overview on the metal-poor Li-rich stars
We discuss the properties of HE 0057-5959 in comparison with the other metal-poor ([Fe/H]–1 dex) Li-rich stars (see Section 4). The vast majority of the dwarf, low-mass stars in the metallicity range between [Fe/H]–3 and –1 dex share a similar abundance, 2.2-2.3 dex. At higher metallicities two effects operate, destroying the plateau and significantly increasing the star-to-star scatter. The first one is the presence in these stars of more massive convective envelopes, leading to more efficient surface A(Li) depletion (Meléndez et al. 2014). The second effect is the occurrence of novae that produce fresh Li and contribute to the chemical enrichment of the Galaxy for [Fe/H]–1 dex (see e.g. Izzo et al. 2015; Romano et al. 2021; Izzo et al. 2023). Actually after the detection in RS Oph (Molaro et al. 2023) we know that also recurrent novae contribute to the Li production. In this way, the interpretation of metal-poor Li-rich stars has the advantages to remove from the discussion the effects of the extra-dilution due to massive convective envelope and the effect of novae producing additional Li.
In principle, A(Li) of a Li-rich star (regardless of its origin) should follow the same evolutionary path of a Li-normal star, with a significant reduction at the FDU and the RGBb. For this reason, Li-rich stars should be discussed considering their evolutionary stage and the possible occurrence of the mixing episodes.
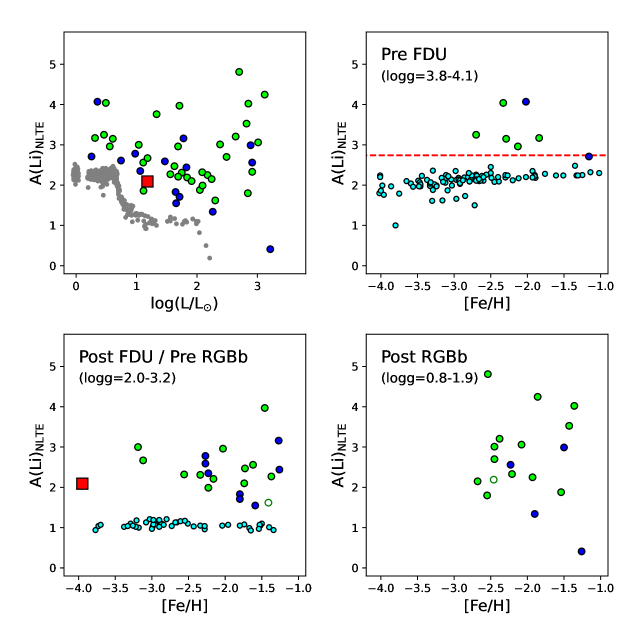
The upper-left panel of Fig. 4 shows the run of as a function of for HE 0057-5959 and all the other metal-poor Li-rich stars discovered so far. Despite a significant star-to-star scatter, it is possible to recognise some sequences where A(Li) decreases with increasing . Some of the field Li-rich stars draw a clear sequence starting from A(Li)3.2 dex at +0.5 down to A(Li)2.2 dex at +2. The GC Li-rich stars in the same luminosity range seem to draw a parallel sequence but shifted by 0.4 dex toward lower A(Li). Finally, some field and GC stars define a super Li-rich sequence, with values higher by 1 dex than the other Li-rich of similar . Two sequences of A(Li) as a function of for the GC Li-rich stars have been already proposed by Sanna et al. (2020). Note that the Li-rich stars show a decrease of A(Li) less steep than that expected by the FDU.
The other panels of Fig. 4 show the behaviour of as function of [Fe/H] for the stars grouped according to their evolutionary stages. In particular, we consider stars located before the FDU (corresponding to the Spite Plateau for Li-normal stars), after the FDU and before the RGBb (corresponding to the lower RGB Plateau for Li-normal stars) and after the RGBb (stars experienced the extra-mixing episode at the luminosity level of the RGBb). One only Li-rich star, namely 132 in the GC M30, is clearly located during the FDU (see Fig. 2 and Table 4) and excluded from this discussion. Also, two field stars (namely GSC 03797-00204 and 2MASS J19524490-6008132) are close the RGBb and we propose an attempt at classification (they are marked as empty symbols in Fig. 4, see Table 3). Finally, for two stars (namely SDSS J143207.14+081406.1 and 2MASS J04315411-0632100) the attribution is too uncertain due to their anomalous position in the Hertzsprung-Russell diagram (see Fig. 3).
Seven Li-rich stars (two of them members of GCs) are located before the occurrence of the FDU. Six of them have exceeding the primordial value obtained from the standard Big Bang nucleosynthesis model and the Planck/WMAP measures of the baryon density. Among them, four stars have 3-3.2 dex (about 1 dex higher than the Spite Plateau), and other two stars have 4 dex (about 2 dex higher than the Spite Plateau). Only the Li-rich star in M4 (Monaco et al. 2012) has a value compatible with the primordial value.
Twenty-one stars are located between the completion of the FDU and before the RGBb. They show a large A(Li) scatter and a typical value around +2.4 dex, 1.4 dex higher than the abundances measured along the lower RGB Plateau. However, their average value is lower than that measured in the previous group, suggesting that a dilution due to the FDU occurred.
Eighteen stars (4 of them members of GCs) are located after the RGBb. In this group we found the Li-rich stars with the lowest (Smith et al. 1999) and the highest (Kowkabany et al. 2022) of the entire sample. The average value of these stars well matches that of the stars between the FDU and the RGBb.
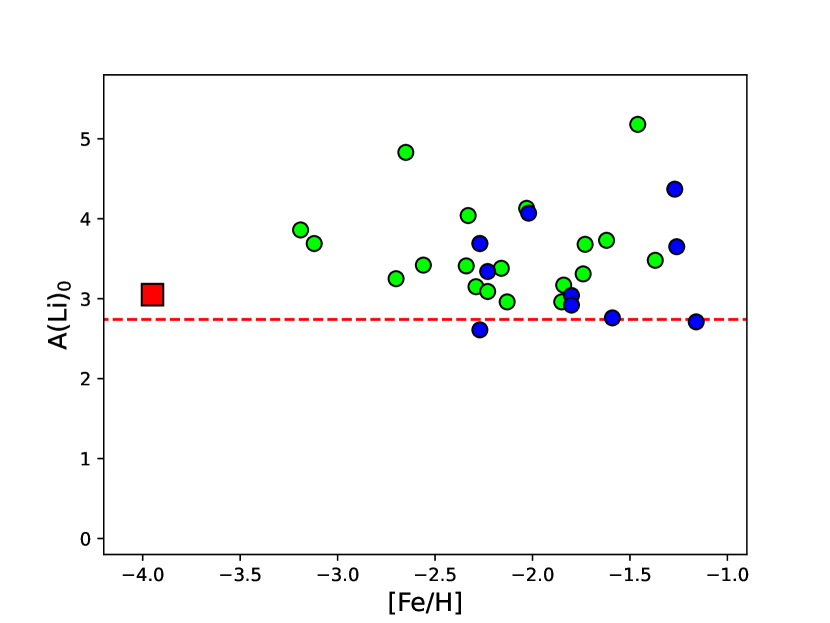
For the stars between FDU and the RGBb, we corrected the measured to take into account the effect of the Li dilution due to the FDU, following the method described in Mucciarelli et al. (2012). In particular, for each star in this evolutionary stage, we consider the stellar model with the appropriate metallicity that provides the amount of A(Li) dilution as a function of the stellar luminosity. The A(Li) dilution to be added to the measured value is computed according to the value of each star. This approach is restricted to stars experiencing the FDU but fainter than the RGBb, because the standard stellar evolution models that we adopted do not account for non canonical mixing processes.
Fig. 5 shows the run of the corrected A(Li) with [Fe/H] for these stars, together with the (uncorrected) abundances for stars before the FDU. No evident trend between the initial A(Li) and [Fe/H] is found. The derived distribution exhibits a large star-to-star scatter and almost all the stars (assuming that they formed with a high A(Li)) have abundances higher than the cosmological value. For the target star HE 0057-5959 the predicted initial A(Li) should be +3.05 dex, 0.3 dex higher than the cosmological value. Only a few stars could have an initial A(Li) compatible with the cosmological value (and therefore explainable by invoking some preservation of the pristine lithium), while for most of the Li-rich stars processes able to produce or enhance the surface lithium abundance should occur.
5.3 HE 0057-5959: a Na-rich Li-rich metal-poor star
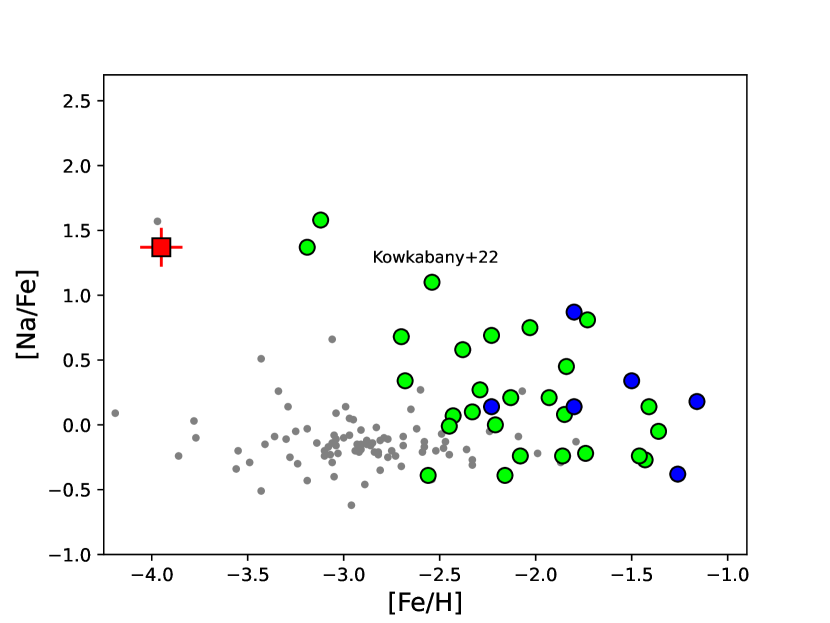
Previous works about metal-poor Li-rich stars highlight significant over-abundances of [Na/Fe] in some of these stars (see e.g. Kowkabany et al. 2022; Sitnova et al. 2023) but this chemical signature has not been properly discussed. Na abundances are available for 23 field stars, shown in Fig. 6 in comparison with the metal-poor Milky Way field stars (Andrievsky et al. 2007; Lombardo et al. 2022). We show also the 6 GC Li-rich stars with [Na/Fe] abundances even if the discussion of these stars is complicated by the self-enrichment processes occurring in the early epochs of the GC life and likely able to form new stars with excess of [Na/Fe] (see e.g. Bastian & Lardo 2018). In the following we refer only to the field Li-rich stars.
The [Na/Fe] distribution of the metal-poor Li-rich stars does not match that of the Milky Way field stars. For [Fe/H]–2.0 dex, the field stars have a constant value of [Na/Fe]–0.2 dex, while the Li-rich stars exhibit a significant star-to-star scatter in [Na/Fe], reaching very high values, up to [Na/Fe]+1.6 dex. In particular, the three Li-rich stars with [Fe/H]–3.0 dex have [Na/Fe]+1.3 dex and are the most Na-rich Li-rich stars: HE 0057-5959 with [Na/Fe]=+1.37 dex, Gaia EDR3 883042050539140992 with [Na/Fe]=+1.37 dex (Li et al. 2018) and Gaia EDR3 2604066644687553792 with [Na/Fe]=+1.58 dex (Roederer et al. 2014). In this comparison and in Fig. 6 we used for HE 0057-5959 [Na/Fe]=+1.37 obtained by adopting NLTE Na abundance and LTE Fe abundance, similar to the analyses of other Li-rich stars, where only the Na abundances are corrected for NLTE effects.
Even if only three Li-rich stars with [Fe/H]–3 dex have been discovered so far, their extremely high [Na/Fe] abundance ratios could be a new characteristic feature of this class of rare objects not explored before. Sodium is produced both in massive stars during the hydrostatic C and Ne burning, and in AGB stars during the hot bottom burning phase. In particular, super-AGB stars, with initial masses larger than 6-7 should be able to produce large amount of both Li and Na, at least for [Fe/H]–2.5 dex (Ventura & D’Antona 2011; D’Antona et al. 2012; Doherty et al. 2014). In these stars Li is produced through the Cameron-Fowler mechanism and Na through the Ne-Na cycle. The evidence that all the three Li-rich stars with [Fe/H]–3 dex have an excess of [Na/Fe] could be an important hint to support the scenario of a mass transfer process occurring in binary systems where the companion was a massive star able to produce simultaneously Li and Na. Unfortunately, theoretical models for AGB stars at [Fe/H]=–4 dex are not available so far.
6 Conclusions
We revised the nature of the metal-poor star HE 0057-5959, demonstrating that it is a genuine Li-rich star, joining the limited class of the metal-poor Li-rich stars. Its very low metallicity demonstrates that at least one of the proposed mechanisms able to produce Li-rich stars should work down to [Fe/H]–4 dex.
However, we are not yet able to surely identify the process capable of producing the excess of lithium observed in this star and generally in other metal-poor stars. This is due both to our still partial understanding of the properties of these stars and to the lack of a sound mechanism able of triggering the Cameron-Fowler mechanism in many of these stars (especially those fainter than the RGBb). For the star HE 0057-5959, we can only speculate that the excess of lithium may be attributable to a mass transfer process in a binary system, despite not having strong evidence, except perhaps the very high [Na/Fe], supporting this hypothesis. The extremely high Li and Na abundances could be compatible with a mass transfer from a companion in the stellar range of 6-8 , while the lack of RV variations from the available three epochs and the RUWE Gaia parameter close to the unity do not support the binary nature of the star (but neither rule out a long-period binary system). On the other hand, HE 0057-5959 does not exhibit enhancement of neutron-capture elements (Sr and Ba) usually associated to the mass transfer process from AGB stars. However, it is important to bear in mind that AGB stars with 2-4 produce a large amount of neutron capture elements while stars with 6-8 are extremely less efficient to produce these elements (see e.g. Fishlock et al. 2014; Shingles et al. 2015). Therefore, all the chemical evidence collected so far for HE 0057-5959 agree with this scenario.
Detailed chemical abundances of the main groups of elements are limited to a few stars, in particular elements tracer of mass transfer from AGB stars (i.e., CNO, 12C/13C and neutron capture processes) are simultaneously available only for 9 Li-rich stars. Another missing piece of evidence are dedicated surveys of RV in order to monitor possible variability and establish the binary nature of some of these stars. In the same way, systematic studies of other diagnostics of interactions (chromospheric activity, stellar rotation…) are still lacking. Metal-poor Li-rich stars are therefore an unexplored field of research that still deserves deep investigations.
| [Na/Fe] | stage | ||||||||
|---|---|---|---|---|---|---|---|---|---|
| (K) | (dex) | (dex) | (dex) | (dex) | (dex) | ||||
| 29184921251610880 | LAMOST J030209.33+135656.3 | 5118 | 2.22 | –1.74 | 1.910.03 | 2.10 | –0.22 | 3 | 1 |
| 215823657109094528 | LAMOST J055408.54+523559.0 | 5308 | 2.51 | –2.03 | 1.690.04 | 2.95 | 0.75 | 3 | 1 |
| 673258221256238464 | LAMOST J074102.07+213246.6 | 6189 | 3.97 | –2.33 | 0.490.02 | 4.05 | 0.10 | 1 | 1 |
| 691015471484504704 | LAMOST J085208.07+262730.1 | 5887 | 3.82 | –2.13 | 0.560.05 | 2.96 | 0.21 | 1 | 1 |
| 696658714913856640 | SDSS J093627.44+293535.7 | 5263 | 3.07 | –1.62 | 1.110.20 | 2.55 | — | 3 | 2 |
| 883042050539140992 | LAMOST J070542.30+255226.6 | 5287 | 3.15 | –3.19 | 1.040.02 | 3.01 | 1.37 | 3 | 1 |
| 932683488703778048 | LAMOST J075816.39+470343.3 | 5897 | 4.06 | –1.84 | 0.310.09 | 3.16 | 0.45 | 1 | 1 |
| 1005288880051257088 | LAMOST J062647.91+603254.0 | 5962 | 3.79 | –2.29 | 0.610.02 | 3.16 | 0.27 | 1 | 1 |
| 1030551568447702400 | GSC 03797-00204 | 4760 | 2.16 | –2.46 | 1.840.08 | 2.19 | — | 4(?) | 2 |
| 1162478360892154112 | 2MASS J15221187+0655551 | 5167 | 2.40 | –2.34 | 1.750.11 | 2.31 | — | 3 | 2 |
| 1172619465872571776 | SDSS J143207.14+081406.1 | 4661 | 2.62 | –2.65 | 1.350.45 | 3.75 | — | N/A | 2 |
| 1181606805198585472 | LAMOST J145500.04+125106.2 | 4830 | 1.78 | –2.68 | 2.250.06 | 2.15 | 0.34 | 4 | 1 |
| 1522817217854702592 | LAMOST J131457.78+374110.7 | 5992 | 3.94 | –2.70 | 0.460.02 | 3.26 | 0.68 | 1 | 1 |
| 1800137243204885120 | LAMOST J214610.13+273200.8 | 5187 | 2.52 | –1.73 | 1.630.11 | 2.47 | 0.81 | 3 | 1 |
| 1918529631627603072 | — | 4649 | 1.58 | –2.43 | 2.380.07 | 3.01 | 0.07 | 4 | 3 |
| 2604066644687553792 | BPS CS22893-010 | 5374 | 3.03 | –3.12 | 1.180.07 | 2.68 | –0.05 | 3 | 4 |
| 3199294789168393600 | 2MASS J04315411-0632100 | 5662 | 3.19 | –1.85 | 1.120.01 | 1.86 | 0.08 | N/A | 5 |
| 3210839729979320064 | 2MASS J05241392-0336543 | 4240 | 1.10 | –2.54 | 2.700.06 | 4.79 | 1.10 | 4 | 6 |
| 3360259919923274496 | LAMOST J071422.66+160042.5 | 5116 | 2.44 | –2.16 | 1.690.02 | 2.21 | –0.39 | 3 | 1 |
| 3665949720385847040 | LAMOST J141412.27+001618.7 | 5033 | 2.01 | –2.56 | 2.090.07 | 2.32 | –0.39 | 3 | 1 |
| 3687632330203892352 | GSC 04958-01069 | 4580 | 1.87 | –1.54 | 2.070.07 | 1.88 | — | 4 | 2 |
| 3926388527100945920 | UCAC2 37720962 | 5196 | 2.06 | –2.23 | 2.090.14 | 1.99 | 0.69 | 3 | 7 |
| 4425538154386975616 | 2MASS J16070923+0447126 | 5105 | 2.56 | –1.37 | 1.560.31 | 2.28 | — | 3 | 2 |
| 4903905598859396480 | HE0057-5959 | 5420 | 3.05 | –3.98 | 1.180.14 | 2.09 | — | 3 | 8 |
| 5441530913278761088 | UCAC4 253-045343 | 4285 | 1.00 | –1.43 | 2.820.07 | 3.53 | –0.27 | 4 | 9 |
| 5668925276702015872 | 2MASS J10122548-2030068 | 4451 | 1.05 | –2.55 | 2.840.36 | 1.77 | — | 4 | 5 |
| 6142572036722901504 | TYC 7262-250-1 | 4179 | 0.92 | –1.36 | 2.850.02 | 4.02 | –0.05 | 4 | 9 |
| 6221353316163376768 | UCAC4 308-077592 | 4086 | 0.62 | –1.86 | 3.120.13 | 4.25 | –0.24 | 4 | 9 |
| 6298610530751953920 | 2MASS J14254628-1546301 | 4287 | 0.81 | –2.08 | 3.010.06 | 2.96 | –0.24 | 4 | 5 |
| 6381456605897426560 | UCAC4 099-098976 | 5291 | 2.48 | –1.46 | 1.710.01 | 3.97 | –0.24 | 3 | 9 |
| 6425395014689839744 | TYC 9112-00430-1 | 4394 | 0.95 | –2.21 | 2.910.05 | 2.27 | 0.00 | 4 | 5 |
| 6443920273789215872 | 2MASS J19524490-6008132 | 5029 | 1.79 | –1.41 | 2.300.02 | 1.62 | 0.14 | 3(?) | 5 |
| 6529464133855343872 | TYC 8448-00121-1 | 4731 | 1.50 | –2.45 | 2.490.06 | 2.71 | –0.01 | 4 | 5 |
| 6668577437377879424 | UCAC4 212-183136 | 4308 | 1.19 | –2.38 | 2.640.07 | 3.21 | +0.58 | 3 | 9 |
| 6816797308517921792 | TYC 6953-00510-1 | 4836 | 1.85 | –1.93 | 2.180.03 | 2.25 | 0.21 | 4 | 5 |
| CLUSTER | [Na/Fe] | stage | ||||||||
|---|---|---|---|---|---|---|---|---|---|---|
| (K) | (dex) | (dex) | (dex) | (dex) | (dex) | |||||
| N362 | 4690838559145577728 | V2 | 3651 | 0.33 | -1.26 | 3.21 | 0.41 | –0.38 | 4 | 1 |
| N362 | 4690838726645395840 | 15370 | 5004 | 2.27 | -1.26 | 1.82 | 2.44 | — | 3 | 2 |
| N1261 | 4733703810220702976 | GES J03115070-5514001 | 4984 | 2.31 | -1.27 | 1.78 | 3.16 | — | 3 | 3 |
| N3201 | 5413582186704791168 | 97812 | 5001 | 2.44 | -1.59 | 1.65 | 1.55 | — | 3 | 4 |
| M68 | 3496374958317915648 | Stet-M68-S232 | 4488 | 0.99 | -2.23 | 2.91 | 2.56 | 0.14 | 4 | 5,6 |
| M68 | 3496399735985613312 | Stet-M68-S534 | 5397 | 3.16 | -2.23 | 1.06 | 2.35 | — | 3 | 6 |
| N5053 | 3938494188778278272 | N5053-S79 | 5277 | 2.71 | -2.27 | 1.47 | 2.59 | — | 3 | 6 |
| OCen | 6083508196239683968 | 25664 | 5061 | 2.46 | -1.80 | 1.65 | 1.83 | 0.87 | 3 | 7 |
| OCen | 6083703428274945280 | 126107 | 5059 | 2.40 | -1.80 | 1.71 | 1.71 | 0.14 | 3 | 7 |
| M3 | 1454783694639968384 | M3-IV101 | 4283 | 0.93 | -1.50 | 2.89 | 2.99 | 0.34 | 4 | 5,8 |
| N5897 | 6252666548333610624 | Tes01-WF4-703 | 4804 | 1.76 | -1.90 | 2.26 | 1.34 | — | 4 | 6 |
| M4 | 6045462826174755328 | 37934 | 5914 | 4.13 | -1.16 | 0.25 | 2.71 | 0.18 | 2 | 9 |
| N6397 | 5921744197274599040 | 6282 | 6241 | 4.12 | -2.02 | 0.36 | 4.07 | — | 2 | 10 |
| M30 | 6816582040462535552 | 132 | 5598 | 3.54 | -2.27 | 0.74 | 2.61 | — | 1 | 6,11 |
| M30 | 6816574859276974336 | 7229 | 5409 | 3.25 | -2.27 | 0.98 | 2.78 | — | 3 | 6 |
Acknowledgements.
We thanks the anonymous referee for the useful and constructive suggestions. A.M. acknowledges support from the project ”LEGO – Reconstructing the building blocks of the Galaxy by chemical tagging” (P.I. A. Mucciarelli). granted by the Italian MUR through contract PRIN 2022LLP8TK_001. M.M. acknowledges support from the ERC Consolidator Grant funding scheme (project ASTEROCHRONOMETRY, https://www. asterochronometry.eu, G.A. n. 772293). This work has made use of data from the European Space Agency (ESA) mission Gaia (https://www. cosmos.esa.int/gaia), processed by the Gaia Data Processing and Anal- ysis Consortium (DPAC, https://www.cosmos.esa.int/web/gaia/dpac/ consortium). Funding for the DPAC has been provided by national institutions, in particular the institutions participating in the Gaia Multilateral Agreement. This research has made use of the SIMBAD database, operated at CDS, Strasbourg, France.References
- Adamów et al. (2012) Adamów, M., Niedzielski, A., Villaver, E., et al. 2012, ApJ, 754, L15. doi:10.1088/2041-8205/754/1/L15
- Adibekyan (2019) Adibekyan, V. 2019, Geosciences, 9, 105. doi:10.3390/geosciences9030105
- Aguado et al. (2018) Aguado, D. S., Allende Prieto, C., González Hernández, J. I., et al. 2018, ApJ, 854, L34. doi:10.3847/2041-8213/aaadb8
- Aguilera-Gómez et al. (2022) Aguilera-Gómez, C., Monaco, L., Mucciarelli, A., et al. 2022, A&A, 657, A33. doi:10.1051/0004-6361/202141750
- Andrievsky et al. (2007) Andrievsky, S. M., Spite, M., Korotin, S. A., et al. 2007, A&A, 464, 1081. doi:10.1051/0004-6361:20066232
- Arentsen et al. (2019) Arentsen, A., Starkenburg, E., Shetrone, M. D., et al. 2019, A&A, 621, A108. doi:10.1051/0004-6361/201834146
- Asplund et al. (2006) Asplund, M., Lambert, D. L., Nissen, P. E., et al. 2006, ApJ, 644, 229. doi:10.1086/503538
- Asplund et al. (2009) Asplund, M., Grevesse, N., Sauval, A. J., et al. 2009, ARA&A, 47, 481. doi:10.1146/annurev.astro.46.060407.145222
- Aoki et al. (2008) Aoki, W., Beers, T. C., Sivarani, T., et al. 2008, ApJ, 678, 1351. doi:10.1086/533517
- Aoki et al. (2009) Aoki, W., Barklem, P. S., Beers, T. C., et al. 2009, ApJ, 698, 1803. doi:10.1088/0004-637X/698/2/1803
- Bailer-Jones et al. (2021) Bailer-Jones, C. A. L., Rybizki, J., Fouesneau, M., et al. 2021, AJ, 161, 147. doi:10.3847/1538-3881/abd806
- Bastian & Lardo (2018) Bastian, N. & Lardo, C. 2018, ARA&A, 56, 83. doi:10.1146/annurev-astro-081817-051839
- Bergemann et al. (2013) Bergemann, M., Kudritzki, R.-P., Würl, M., et al. 2013, ApJ, 764, 115. doi:10.1088/0004-637X/764/2/115
- Bernstein et al. (2003) Bernstein, R., Shectman, S. A., Gunnels, S. M., et al. 2003, Proc. SPIE, 4841, 1694. doi:10.1117/12.461502
- Bonifacio & Molaro (1997) Bonifacio, P. & Molaro, P. 1997, MNRAS, 285, 847. doi:10.1093/mnras/285.4.847
- Bonifacio et al. (2015) Bonifacio, P., Caffau, E., Spite, M., et al. 2015, A&A, 579, A28. doi:10.1051/0004-6361/201425266
- Bonifacio et al. (2018) Bonifacio, P., Caffau, E., Spite, M., et al. 2018, A&A, 612, A65. doi:10.1051/0004-6361/201732320
- Caffau et al. (2011) Caffau, E., Ludwig, H.-G., Steffen, M., et al. 2011, Sol. Phys., 268, 255
- Cameron (1955) Cameron, A. G. W. 1955, ApJ, 121, 144. doi:10.1086/145970
- Cameron & Fowler (1971) Cameron, A. G. W. & Fowler, W. A. 1971, ApJ, 164, 111. doi:10.1086/150821
- Carney et al. (1998) Carney, B. W., Fry, A. M., & Gonzalez, G. 1998, AJ, 116, 2984. doi:10.1086/300630
- Casey et al. (2016) Casey, A. R., Ruchti, G., Masseron, T., et al. 2016, MNRAS, 461, 3336. doi:10.1093/mnras/stw1512
- Charbonnel & Balachandran (2000) Charbonnel, C. & Balachandran, S. C. 2000, A&A, 359, 563. doi:10.48550/arXiv.astro-ph/0005280
- Charbonnel & Primas (2005) Charbonnel, C. & Primas, F. 2005, A&A, 442, 961. doi:10.1051/0004-6361:20042491
- Charbonnel et al. (2020) Charbonnel, C., Lagarde, N., Jasniewicz, G., et al. 2020, A&A, 633, A34. doi:10.1051/0004-6361/201936360
- Coc & Vangioni (2017) Coc, A. & Vangioni, E. 2017, International Journal of Modern Physics E, 26, 1741002. doi:10.1142/S0218301317410026
- D’Antona et al. (2012) D’Antona, F., D’Ercole, A., Carini, R., et al. 2012, MNRAS, 426, 1710. doi:10.1111/j.1365-2966.2012.21663.x
- de La Reza et al. (1996) de La Reza, R., Drake, N. A., & da Silva, L. 1996, ApJ, 456, L115. doi:10.1086/309874
- Denissenkov & Herwig (2004) Denissenkov, P. A. & Herwig, F. 2004, ApJ, 612, 1081. doi:10.1086/422575
- Denissenkov et al. (2009) Denissenkov, P. A., Pinsonneault, M., & MacGregor, K. B. 2009, ApJ, 696, 1823. doi:10.1088/0004-637X/696/2/1823
- Deepak et al. (2020) Deepak, Lambert, D. L., & Reddy, B. E. 2020, MNRAS, 494, 1348. doi:10.1093/mnras/staa729
- Doherty et al. (2014) Doherty, C. L., Gil-Pons, P., Lau, H. H. B., et al. 2014, MNRAS, 441, 582. doi:10.1093/mnras/stu571
- Domínguez et al. (2004) Domínguez, I., Abia, C., Straniero, O., et al. 2004, A&A, 422, 1045. doi:10.1051/0004-6361:20040289
- D’Orazi et al. (2015) D’Orazi, V., Gratton, R. G., Angelou, G. C., et al. 2015, ApJ, 801, L32. doi:10.1088/2041-8205/801/2/L32
- Fischer & Valenti (2005) Fischer, D. A. & Valenti, J. 2005, ApJ, 622, 1102. doi:10.1086/428383
- Fishlock et al. (2014) Fishlock, C. K., Karakas, A. I., Lugaro, M., et al. 2014, ApJ, 797, 44. doi:10.1088/0004-637X/797/1/44
- Gaia Collaboration et al. (2020) Gaia Collaboration, Brown, A. G. A., Vallenari, A., et al. 2021, A&A, 649, A1. doi:10.1051/0004-6361/202039657
- Gao et al. (2019) Gao, Q., Shi, J.-R., Yan, H.-L., et al. 2019, ApJS, 245, 33. doi:10.3847/1538-4365/ab505c
- Gonzalez et al. (2009) Gonzalez, O. A., Zoccali, M., Monaco, L., et al. 2009, A&A, 508, 289. doi:10.1051/0004-6361/200912469
- Gruyters et al. (2016) Gruyters, P., Lind, K., Richard, O., et al. 2016, A&A, 589, A61. doi:10.1051/0004-6361/201527948
- Jacobson et al. (2015) Jacobson, H. R., Keller, S., Frebel, A., et al. 2015, ApJ, 807, 171. doi:10.1088/0004-637X/807/2/171
- Johnson et al. (2010) Johnson, J. A., Aller, K. M., Howard, A. W., et al. 2010, PASP, 122, 905. doi:10.1086/655775
- Handberg et al. (2021) Handberg, R., Lund, M. N., White, T. R., et al. 2021, AJ, 162, 170. doi:10.3847/1538-3881/ac09f1
- Hansen et al. (2014) Hansen, T., Hansen, C. J., Christlieb, N., et al. 2014, ApJ, 787, 162. doi:10.1088/0004-637X/787/2/162
- Harris (1996, 2010 edition) Harris, W. E. 1996, AJ, 112, 1487. doi:10.1086/118116
- Hatt et al. (2023) Hatt, E., Nielsen, M. B., Chaplin, W. J., et al. 2023, A&A, 669, A67. doi:10.1051/0004-6361/202244579
- Hon et al. (2021) Hon, M., Huber, D., Kuszlewicz, J. S., et al. 2021, ApJ, 919, 131. doi:10.3847/1538-4357/ac14b1
- Huang et al. (2020) Huang, C. X., Vanderburg, A., Pál, A., et al. 2020, Research Notes of the American Astronomical Society, 4, 204. doi:10.3847/2515-5172/abca2e
- Kelson (2003) Kelson, D. D. 2003, PASP, 115, 688. doi:10.1086/375502
- Kirby et al. (2012) Kirby, E. N., Fu, X., Guhathakurta, P., et al. 2012, ApJ, 752, L16. doi:10.1088/2041-8205/752/1/L16
- Kirby et al. (2016) Kirby, E. N., Guhathakurta, P., Zhang, A. J., et al. 2016, ApJ, 819, 135. doi:10.3847/0004-637X/819/2/135
- Koch et al. (2011) Koch, A., Lind, K., & Rich, R. M. 2011, ApJ, 738, L29. doi:10.1088/2041-8205/738/2/L29
- Kowkabany et al. (2022) Kowkabany, J., Ezzeddine, R., Charbonnel, C., et al. 2022, arXiv:2209.02184. doi:10.48550/arXiv.2209.02184
- Kraft et al. (1999) Kraft, R. P., Peterson, R. C., Guhathakurta, P., et al. 1999, ApJ, 518, L53. doi:10.1086/312061
- Kurucz (1993) Kurucz, R. L. 1993, VizieR Online Data Catalog, VI/39
- Kurucz (2005) Kurucz, R. L. 2005, Memorie della Societa Astronomica Italiana Supplementi, 8, 14
- Iben (1967) Iben, I. 1967, ApJ, 147, 624. doi:10.1086/149040
- Ito et al. (2013) Ito, H., Aoki, W., Beers, T. C., et al. 2013, ApJ, 773, 33. doi:10.1088/0004-637X/773/1/33
- Ivans et al. (2005) Ivans, I. I., Sneden, C., Gallino, R., et al. 2005, ApJ, 627, L145. doi:10.1086/432465
- Izzo et al. (2015) Izzo, L., Della Valle, M., Mason, E., et al. 2015, ApJ, 808, L14. doi:10.1088/2041-8205/808/1/L14
- Izzo et al. (2023) Izzo, L., Molaro, P., Bonifacio, P., et al. 2023, Experimental Astronomy, 55, 191. doi:10.1007/s10686-022-09876-3
- Lallement et al. (2022) Lallement, R., Vergely, J. L., Babusiaux, C., et al. 2022, A&A, 661, A147. doi:10.1051/0004-6361/202142846
- Li et al. (2015) Li, H., Aoki, W., Zhao, G., et al. 2015, PASJ, 67, 84. doi:10.1093/pasj/psv053
- Li et al. (2018) Li, H., Aoki, W., Matsuno, T., et al. 2018, ApJ, 852, L31. doi:10.3847/2041-8213/aaa438
- Lightkurve Collaboration et al. (2018) Lightkurve Collaboration, Cardoso, J. V. de M., Hedges, C., et al. 2018, Astrophysics Source Code Library. ascl:1812.013
- Lind et al. (2009) Lind, K., Primas, F., Charbonnel, C., et al. 2009, A&A, 503, 545. doi:10.1051/0004-6361/200912524
- Lind et al. (2011) Lind, K., Asplund, M., Barklem, P. S., et al. 2011, A&A, 528, A103. doi:10.1051/0004-6361/201016095
- Lodders (2010) Lodders, K. 2010, Astrophysics and Space Science Proceedings, 16, 379
- Lombardo et al. (2021) Lombardo, L., François, P., Bonifacio, P., et al. 2021, A&A, 656, A155. doi:10.1051/0004-6361/202141408
- Lombardo et al. (2022) Lombardo, L., Bonifacio, P., François, P., et al. 2022, A&A, 665, A10. doi:10.1051/0004-6361/202243932
- Lomb (1976) Lomb, N. R. 1976, Ap&SS, 39, 447. doi:10.1007/BF00648343
- Lucatello et al. (2003) Lucatello, S., Gratton, R., Cohen, J. G., et al. 2003, AJ, 125, 875. doi:10.1086/345886
- Lund et al. (2021) Lund, M. N., Handberg, R., Buzasi, D. L., et al. 2021, ApJS, 257, 53. doi:10.3847/1538-4365/ac214a
- Mackereth et al. (2021) Mackereth, J. T., Miglio, A., Elsworth, Y., et al. 2021, MNRAS, 502, 1947. doi:10.1093/mnras/stab098
- Maldonado et al. (2013) Maldonado, J., Villaver, E., & Eiroa, C. 2013, A&A, 554, A84. doi:10.1051/0004-6361/201321082
- Martell & Shetrone (2013) Martell, S. L. & Shetrone, M. D. 2013, MNRAS, 430, 611. doi:10.1093/mnras/sts661
- Matsuno et al. (2017) Matsuno, T., Aoki, W., Beers, T. C., et al. 2017, AJ, 154, 52. doi:10.3847/1538-3881/aa7a08
- Mashonkina et al. (2023) Mashonkina, L., Pakhomov, Y., Sitnova, T., et al. 2023, MNRAS, 524, 3526. doi:10.1093/mnras/stad2114
- Masseron et al. (2012) Masseron, T., Johnson, J. A., Lucatello, S., et al. 2012, ApJ, 751, 14. doi:10.1088/0004-637X/751/1/14
- Meléndez et al. (2014) Meléndez, J., Schirbel, L., Monroe, T. R., et al. 2014, A&A, 567, L3. doi:10.1051/0004-6361/201424172
- Molaro et al. (2023) Molaro, P., Izzo, L., Selvelli, P., et al. 2023, MNRAS, 518, 2614. doi:10.1093/mnras/stac2708
- Monaco et al. (2011) Monaco, L., Villanova, S., Moni Bidin, C., et al. 2011, A&A, 529, A90. doi:10.1051/0004-6361/201016285
- Monaco et al. (2012) Monaco, L., Villanova, S., Bonifacio, P., et al. 2012, A&A, 539, A157. doi:10.1051/0004-6361/201117709
- Monaco et al. (2014) Monaco, L., Boffin, H. M. J., Bonifacio, P., et al. 2014, A&A, 564, L6. doi:10.1051/0004-6361/201323348
- Mucciarelli et al. (2012) Mucciarelli, A., Salaris, M., & Bonifacio, P. 2012, MNRAS, 419, 2195. doi:10.1111/j.1365-2966.2011.19870.x
- Mucciarelli et al. (2013a) Mucciarelli, A., Pancino, E., Lovisi, L., et al. 2013, ApJ, 766, 78
- Mucciarelli et al. (2013b) Mucciarelli, A., Bellazzini, M., Catelan, M., et al. 2013, MNRAS, 435, 3667. doi:10.1093/mnras/stt1558
- Mucciarelli et al. (2019) Mucciarelli, A., Monaco, L., Bonifacio, P., et al. 2019, A&A, 623, A55. doi:10.1051/0004-6361/201834497
- Mucciarelli & Bonifacio (2020) Mucciarelli, A. & Bonifacio, P. 2020, A&A, 640, A87. doi:10.1051/0004-6361/202037703
- Mucciarelli, Bellazzini & Massari (2021) Mucciarelli, A., Bellazzini, M., & Massari, D. 2021, A&A, 653, A90. doi:10.1051/0004-6361/202140979
- Mucciarelli et al. (2021) Mucciarelli, A., Monaco, L., Bonifacio, P., et al. 2021, A&A, 652, A139. doi:10.1051/0004-6361/202140796
- Mucciarelli et al. (2022) Mucciarelli, A., Monaco, L., Bonifacio, P., et al. 2022, A&A, 661, A153. doi:10.1051/0004-6361/202142889
- Nordlander & Lind (2017) Nordlander, T. & Lind, K. 2017, A&A, 607, A75. doi:10.1051/0004-6361/201730427
- Norris et al. (2013) Norris, J. E., Bessell, M. S., Yong, D., et al. 2013, ApJ, 762, 25. doi:10.1088/0004-637X/762/1/25
- Palacios et al. (2001) Palacios, A., Charbonnel, C., & Forestini, M. 2001, A&A, 375, L9. doi:10.1051/0004-6361:20010903
- Pasquini et al. (2007) Pasquini, L., Döllinger, M. P., Weiss, A., et al. 2007, A&A, 473, 979. doi:10.1051/0004-6361:20077814
- Pietrinferni et al. (2021) Pietrinferni, A., Hidalgo, S., Cassisi, S., et al. 2021, ApJ, 908, 102. doi:10.3847/1538-4357/abd4d5
- Placco et al. (2016) Placco, V. M., Beers, T. C., Reggiani, H., et al. 2016, ApJ, 829, L24. doi:10.3847/2041-8205/829/2/L24
- Prusti et al. (2016) Gaia Collaboration, Prusti, T., de Bruijne, J. H. J., et al. 2016, A&A, 595, A1
- Ricker et al. (2015) Ricker, G. R., Winn, J. N., Vanderspek, R., et al. 2015, Journal of Astronomical Telescopes, Instruments, and Systems, 1, 014003. doi:10.1117/1.JATIS.1.1.014003
- Ryan et al. (1999) Ryan, S. G., Norris, J. E., & Beers, T. C. 1999, ApJ, 523, 654. doi:10.1086/307769
- Roederer et al. (2008) Roederer, I. U., Frebel, A., Shetrone, M. D., et al. 2008, ApJ, 679, 1549. doi:10.1086/587794
- Roederer et al. (2014) Roederer, I. U., Preston, G. W., Thompson, I. B., et al. 2014, AJ, 147, 136. doi:10.1088/0004-6256/147/6/136
- Romano et al. (2021) Romano, D., Magrini, L., Randich, S., et al. 2021, A&A, 653, A72. doi:10.1051/0004-6361/202141340
- Ruchti et al. (2011) Ruchti, G. R., Fulbright, J. P., Wyse, R. F. G., et al. 2011, ApJ, 743, 107. doi:10.1088/0004-637X/743/2/107
- Sackmann & Boothroyd (1992) Sackmann, I.-J. & Boothroyd, A. I. 1992, ApJ, 392, L71. doi:10.1086/186428
- Sanna et al. (2020) Sanna, N., Franciosini, E., Pancino, E., et al. 2020, A&A, 639, L2. doi:10.1051/0004-6361/202038435
- Sbordone et al. (2010) Sbordone, L., Bonifacio, P., Caffau, E., et al. 2010, A&A, 522, A26. doi:10.1051/0004-6361/200913282
- Scargle (1982) Scargle, J. D. 1982, ApJ, 263, 835. doi:10.1086/160554
- Schlafly & Finkbeiner (2011) Schlafly, E. F. & Finkbeiner, D. P. 2011, ApJ, 737, 103. doi:10.1088/0004-637X/737/2/103
- Shingles et al. (2015) Shingles, L. J., Doherty, C. L., Karakas, A. I., et al. 2015, MNRAS, 452, 2804. doi:10.1093/mnras/stv1489
- Siess & Livio (1999) Siess, L. & Livio, M. 1999, MNRAS, 308, 1133. doi:10.1046/j.1365-8711.1999.02784.x
- Silva Aguirre et al. (2014) Silva Aguirre, V., Ruchti, G. R., Hekker, S., et al. 2014, ApJ, 784, L16. doi:10.1088/2041-8205/784/1/L16
- Sitnova et al. (2023) Sitnova, T. M., Matsuno, T., Yuan, Z., et al. 2023, MNRAS, 526, 5976. doi:10.1093/mnras/stad3141
- Sivarani et al. (2006) Sivarani, T., Beers, T. C., Bonifacio, P., et al. 2006, A&A, 459, 125. doi:10.1051/0004-6361:20065440
- Smith et al. (1999) Smith, V. V., Shetrone, M. D., & Keane, M. J. 1999, ApJ, 516, L73. doi:10.1086/312011
- Spite & Spite (1982) Spite, M. & Spite, F. 1982, Nature, 297, 483. doi:10.1038/297483a0
- Susmitha et al. (2024) Susmitha, A., Mallick, A., & Reddy, B. E. 2024, ApJ, 966, 109. doi:10.3847/1538-4357/ad35b9
- Takarada et al. (2018) Takarada, T., Sato, B., Omiya, M., et al. 2018, PASJ, 70, 59. doi:10.1093/pasj/psy052
- Thompson et al. (2008) Thompson, I. B., Ivans, I. I., Bisterzo, S., et al. 2008, ApJ, 677, 556. doi:10.1086/529016
- Ventura & D’Antona (2011) Ventura, P. & D’Antona, F. 2011, MNRAS, 410, 2760. doi:10.1111/j.1365-2966.2010.17651.x
- Yong et al. (2013) Yong, D., Norris, J. E., Bessell, M. S., et al. 2013, ApJ, 762, 26. doi:10.1088/0004-637X/762/1/26
- Wang et al. (2021) Wang, E. X., Nordlander, T., Asplund, M., et al. 2021, MNRAS, 500, 2159. doi:10.1093/mnras/staa3381
- Wolthoff et al. (2022) Wolthoff, V., Reffert, S., Quirrenbach, A., et al. 2022, A&A, 661, A63. doi:10.1051/0004-6361/202142501
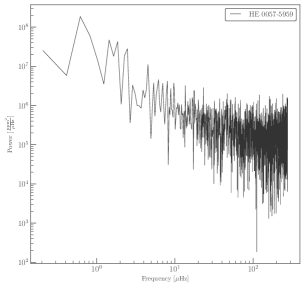
Appendix A Asteroseismic data
Here we discuss asteroseismic observations of metal-poor Li-rich stars (Table 3). Our sample of stars has been observed by TESS (Transiting Exoplanet Survey Satellite; Ricker et al. 2015), but only 16 stars have available light curves in the Mikulski archive for space telescopes (MAST111https://archive.stsci.edu). We apply a Lomb–Scargle transform (Lomb 1976; Scargle 1982) to these lightcurves by means of the Python package Lightkurve v2.4.1222Lightkurve Collaboration et al. (2018); https://github.com/lightkurve/lightkurve. We do not find evidence of solar-like oscillations in any of these stars even with lightcurves based on the MIT quick-look pipeline (QLP; Huang et al. 2020), or the TESS data for asteroseismology light curves pipeline (TASOC; Handberg et al. 2021; Lund et al. 2021). Fig. 7 shows as example of the power spectral density for HE 0057-5959 based on TESS observations. Indeed, we could not find any of these stars in catalogues of solar-like oscillators observed with TESS (Hon et al. 2021; Mackereth et al. 2021; Hatt et al. 2023), and a similar result is shown in Kowkabany et al. (2022) for the star Gaia DR3 3210839729979320064. Finally, these results suggest that more than 130 days (corresponding to longest observations made in our sample, that is those for Gaia DR3 3360259919923274496) are needed to observe solar-like oscillations in such stars.
Appendix B Information about the measured atomic lines
Table 5 lists the main atomic data (wavelength, oscillator strength, excitation potential and ion) for all the measured transitions used in the analysis.
| Wavelength | log gf | Ion | |
|---|---|---|---|
| (Å) | (dex) | (eV) | |
| 6707.*** | –0.002 | 0.00 | Li I |
| 5889.9** | 0.108 | 0.00 | Na I |
| 5895.9** | –0.194 | 0.00 | Na I |
| 3838.292 | 0.397 | 2.72 | Mg I |
| 5167.321 | –0.870 | 2.71 | Mg I |
| 5172.684 | –0.393 | 2.71 | Mg I |
| 5183.604 | –0.167 | 2.72 | Mg I |
| 3944.*** | –0.635 | 0.00 | Al I |
| 3961.5** | –0.333 | 0.01 | Al I |
| 3905.523 | –1.041 | 1.91 | Si I |
| 4226.728 | 0.244 | 0.00 | Ca I |
| 4300.043 | –0.460 | 1.18 | Ti II |
| 4563.758 | –0.795 | 1.22 | Ti II |
| 4571.971 | –0.310 | 1.57 | Ti II |
| 3820.425 | 0.119 | 0.86 | Fe I |
| 3840.437 | –0.506 | 0.99 | Fe I |
| 3841.048 | –0.045 | 1.61 | Fe I |
| 3849.966 | –0.871 | 1.01 | Fe I |
| 3878.018 | –0.914 | 0.96 | Fe I |
| 3878.573 | –1.379 | 0.09 | Fe I |
| 3886.282 | –1.076 | 0.05 | Fe I |
| 3895.656 | –1.670 | 0.11 | Fe I |
| 3902.945 | –0.466 | 1.56 | Fe I |
| 3906.479 | –2.243 | 0.11 | Fe I |
| 4005.241 | –0.610 | 1.56 | Fe I |
| 4202.029 | –0.708 | 1.48 | Fe I |
| 4250.786 | –0.714 | 1.56 | Fe I |
| 4260.474 | 0.077 | 2.40 | Fe I |
| 4271.760 | –0.164 | 1.48 | Fe I |
| 4325.762 | 0.006 | 1.61 | Fe I |
| 5227.188 | –1.228 | 1.56 | Fe I |
| 5269.537 | –1.321 | 0.86 | Fe I |
| 5270.356 | –1.339 | 1.61 | Fe I |
| 5371.489 | –1.645 | 0.96 | Fe I |
| 5397.127 | –1.993 | 0.91 | Fe I |
| 5405.774 | –1.844 | 0.99 | Fe I |
| 5446.916 | –1.914 | 0.99 | Fe I |
| 4215.519 | –0.173 | 0.00 | Sr II |
| 4554.0** | 0.140 | 0.00 | Ba II |
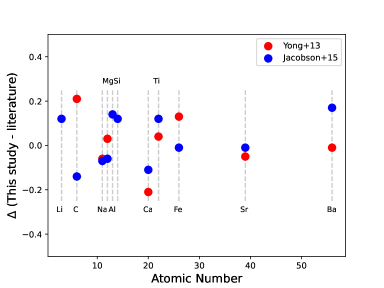
Appendix C Comparison with previous chemical analyses
The chemical composition of HE 0057-5959 has been already investigated by Yong et al. (2013) and Jacobson et al. (2015) both analysing MIKE spectra. Fig. 8 shows the comparison between our analysis and those by Yong et al. (2013) and Jacobson et al. (2015) for the elements in common among the three studies. We consider our LTE abundances but for Li and Na because these two studies provided NLTE abundances only for these two elements. Our analysis well agrees with the previous ones, with differences that do not exceed 0.2 dex. The largest differences are for the [C/Fe] and [Ca/Fe] by Yong et al. (2013), 0.21 dex lower and higher than our values, respectively. The differences with respect to these two studies can be ascribable to several differences in the chemical analyses, in particular, both the works adopted solar abundances by Asplund et al. (2009), Jacobson et al. (2015) used MARCS model atmospheres, while Yong et al. (2013) adopted ATLAS9 model atmospheres like our analysis, and Yong et al. (2013) adopted a value 200 K cooler than our one (see Section 2.2).
Appendix D Contamination of the Na D lines by interstellar features
The photospheric Na D lines at 5889.9 and 5895.9 Å can be contaminated by the same transitions arising from the interstellar medium along the line of sight. We checked that the Na D lines in the spectrum of HE 0057-5959 are not contaminated by interstellar features (see Fig. 9) because of the large RV of the star. Also the interstellar lines are very weak because of the low colour excess of HE 0057-5959 .