An Initial Study of Human-Scale Blockage in sub-THz Radio Propagation
with Application to Indoor Passive Localization ††thanks: Funded by the European Union. Views and opinions expressed are however
those of the author(s) only and do not necessarily reflect those of
the European Union or European Innovation Council and SMEs Executive
Agency (EISMEA). Neither the European Union nor the granting authority
can be held responsible for them. Grant Agreement No: 101099491 (project HOLDEN).
The measurement setup has been partially developed in the framework of SoBigData.it (Smart Radio Environment). SoBigData.it receives funding from European Union —NextGenerationEU-National Recovery and Resilience Plan (Piano Nazionale di Ripresa e Resilienza, PNRR) —Project: “SoBigData.it —Strengthening the Italian RI for Social Mining and Big Data Analytics” —Prot. IR0000013 —Avviso n. 3264 del 28/12/2021.
Abstract
This paper empirically investigates the body induced electromagnetic (EM) effects, namely the human body blockage, by conducting indoor measurement campaigns in the unexplored sub-THz W-band (75–110 GHz) and G-band (170–260 GHz). The proposed analysis focuses on both the alterations of channel frequency response induced by body presence, fully or partially obstructing the line-of-sight (LoS) between transmitter and recevier, as well as on the channel impulse response (CIR) for selected movements of the target, i.e. crossing the LoS of the radio link. The proposed study has applications in device-free radio localization and radio frequency (RF) sensing scenarios where the EM radiation or environmental radio signals are collected and processed to detect and locate people without requiring them to wear any electronic devices. Although preliminary, the study reveals that discrimination of the blockage micro-movements is possible, achieving higher precision compared to classical RF sensing and localization using cm-scale wavelengths (2.4–6 GHz bands).
Index Terms:
sub-THz radiation, channel impulse response integrated sensing and communication, EM body models.I Introduction
Radio frequency (RF) sensing consists of an opportunistic set of techniques capable to detect, locate, and track people in a monitored area covered by ambient RF signals [1]. Targeting the Integrated Sensing and Communication paradigm [2], device free localization (DFL) systems can transform each RF node of the wireless network covering the monitored area into a virtual sensor capable of performing sensing operations. RF sensing methods typically employ frequencies in the unlicensed – GHz ISM bands [3], and up to – GHz [4]. In both cases RF signals are characterized by wavelengths of only a few centimeters (cm-scale). However, multipath effects strongly limit their accuracy, thus reducing their widespread acceptance. On the contrary, sub-terahertz (sub-THz) radiation, generally characterized by mm-scale wavelengths (mmWave), can be viewed as much better suited for high-resolution body occupancy detection and vision applications due to its very short wavelength and reduced multipath effects. The diffusion of THz radios for 6G and beyond communication systems [5] is thus expected to pave the way towards novel joint communication, sensing and computing paradigms.
Most of the sensing and vision techniques proposed for localization, and behavior recognition [6] such as Bayesian filtering, tomography and holography [7, 8, 9], require a detailed understanding of the effects of human/object blockage and its physical/EM properties. While body effects are well understood for classical ISM bands [10, 11, 12] and up to – GHz [13, 14], the human body blockage at frequencies beyond GHz has been insufficiently analyzed so far [15]. Although there are several studies proposing physical and statistical models for assessing the impact of human blockage on communication performance [16, 17], a limited body of knowledge exists regarding the EM and physical characterization of body-induced fading effects. This includes characterization in terms of both time and frequency domains, which is critical for human-scale sensing applications.
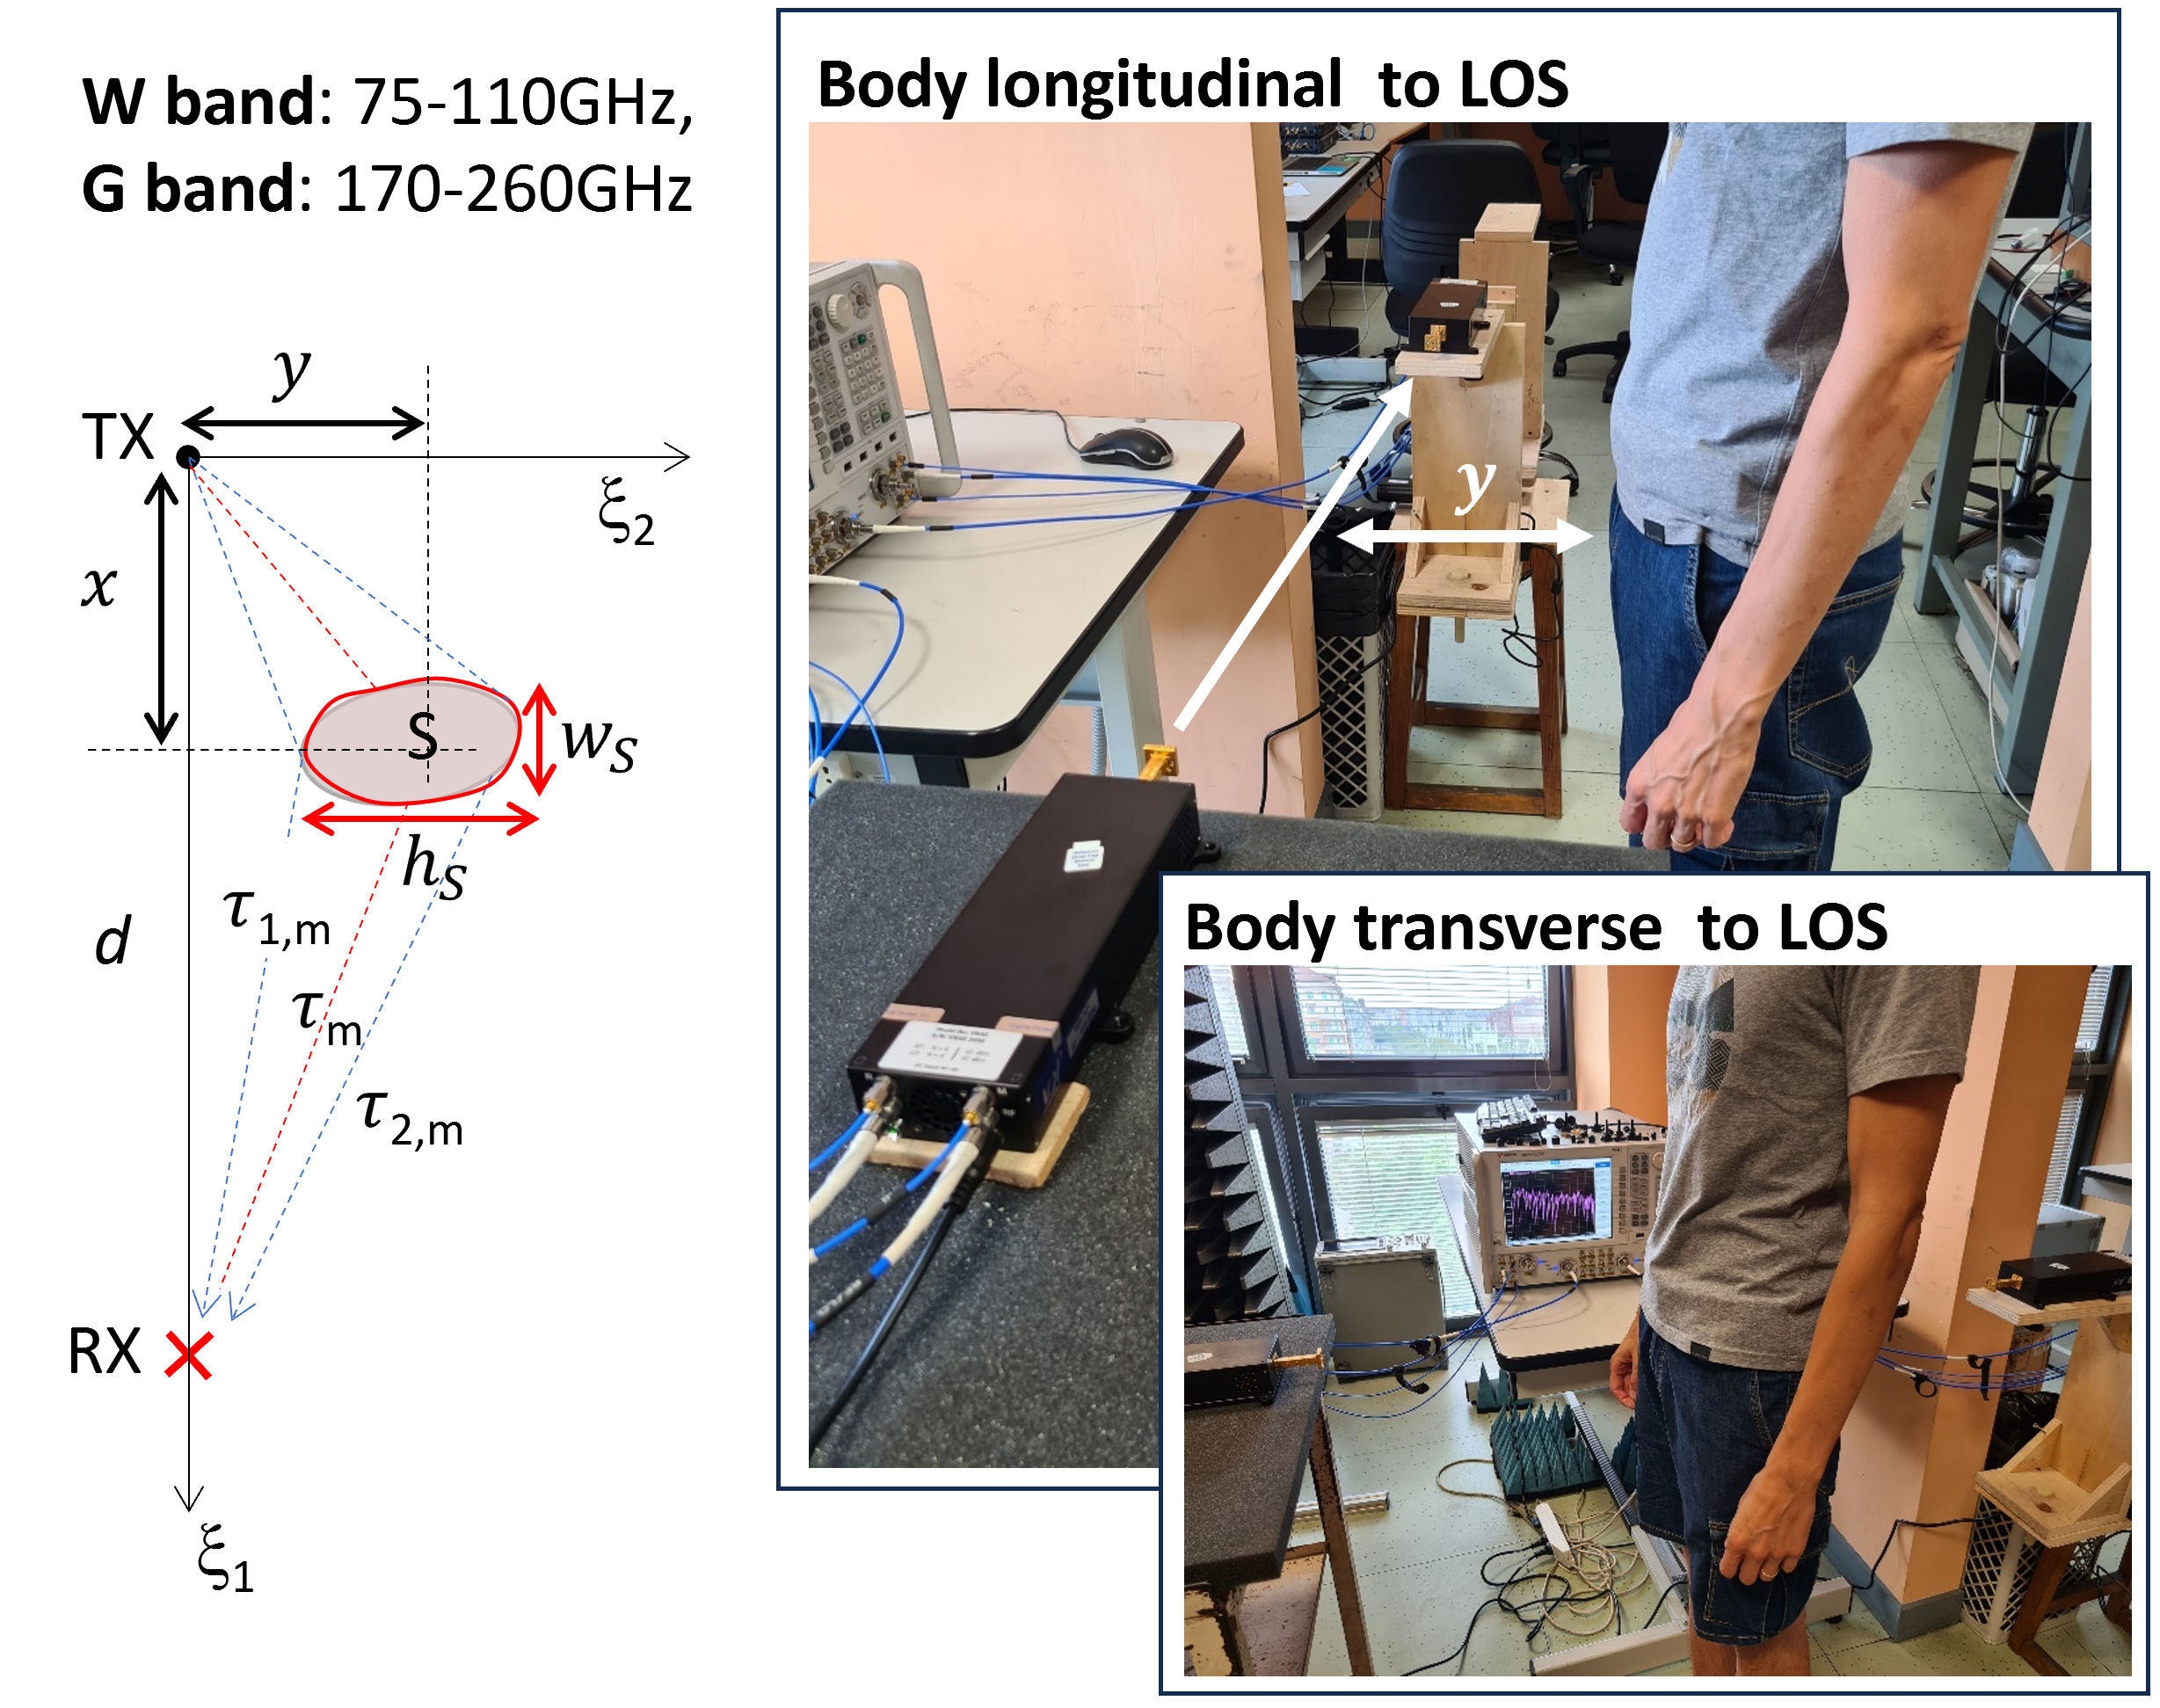
In this paper, we provide a first study targeting the characterization of human blockage in the unexplored W-band (– GHz) and G-band (– GHz). To this aim, we carried out an indoor measurement campaign collecting the target-induced RF footprints for different offsets to the blocker crossing the LoS path. Small movements of the target as traversing the link are represented here by using a full-body phantom, which accurately simulates a human subject in the blockage study. The main contributions of the proposed study are:
-
•
empirical measurements of human body blockage process in the indoor environment considering the dual (full) bands of – GHz and – GHz;
-
•
frequency and time domain analysis of the blockage effects, considering the channel frequency response and the impulse response (CIR) for different offsets to the target crossing the LoS path;
-
•
characterization of the area around the link that is most sensitive to the blocker when approaching the LoS, for both the considered bands.
The paper is organized as follows. Section III focuses on frequency domain analysis considering the W and G bands separately. The study reveals that simple statistical analysis of the received power is not sufficient to reconstruct the blocker location. Next, in Section IV we consider the more challenging G band and characterize the CIR as an optimized set of power/amplitude and delay features. Perturbations of CIR features induced by the blockage are analyzed. Planned future experiments and the general approach to CIR characterization are summarized in the Section V.
| Network Analyzer settings | Antenna specs | |||
| W | Start/Stop Freq. | 75/110 GHz | Type | Truncated Waveguide |
| Freq. spacing | 35 MHz | FHPBW | about 90∘ | |
| Resolution BW | 1 kHz | Polarization | Vertical | |
| G | Start/Stop Freq. | 170/260 GHz | Antenna gain | 6-8 dBi |
| Freq. spacing | 90 MHz | TX power | 4-18 dBm | |
| Resolution BW | 1 kHz | |||
II Measurement setup and environment
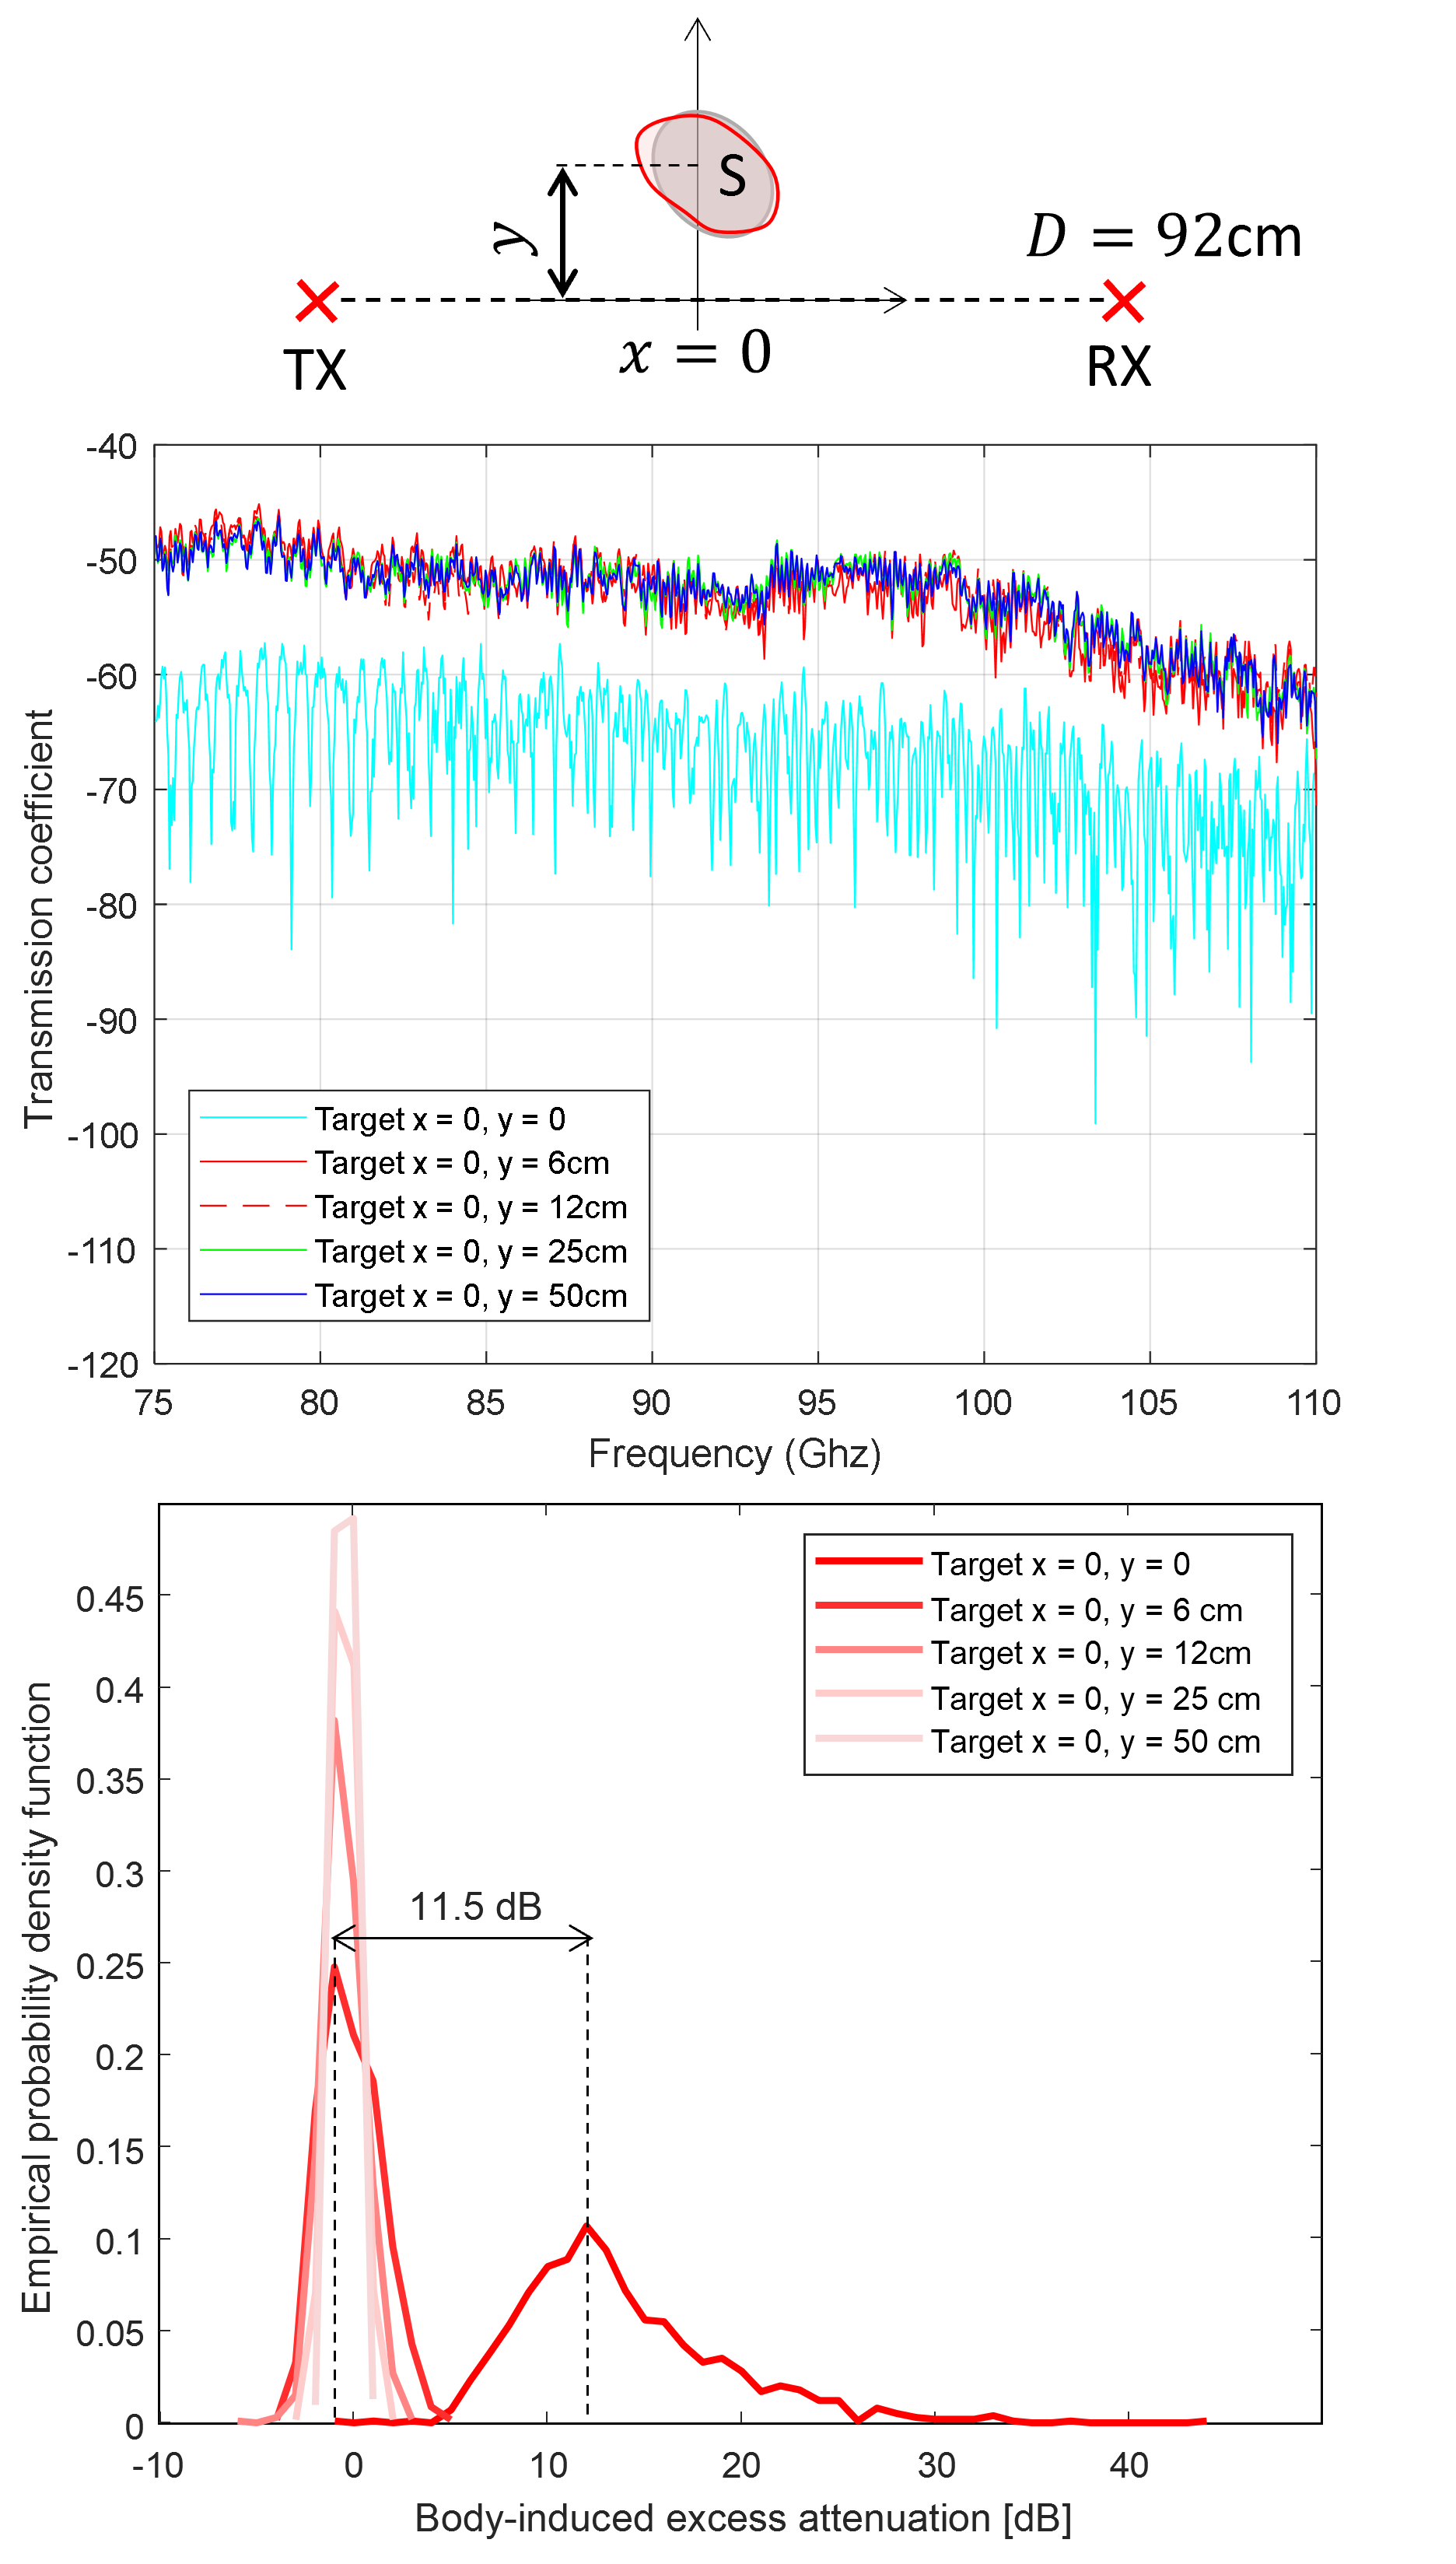
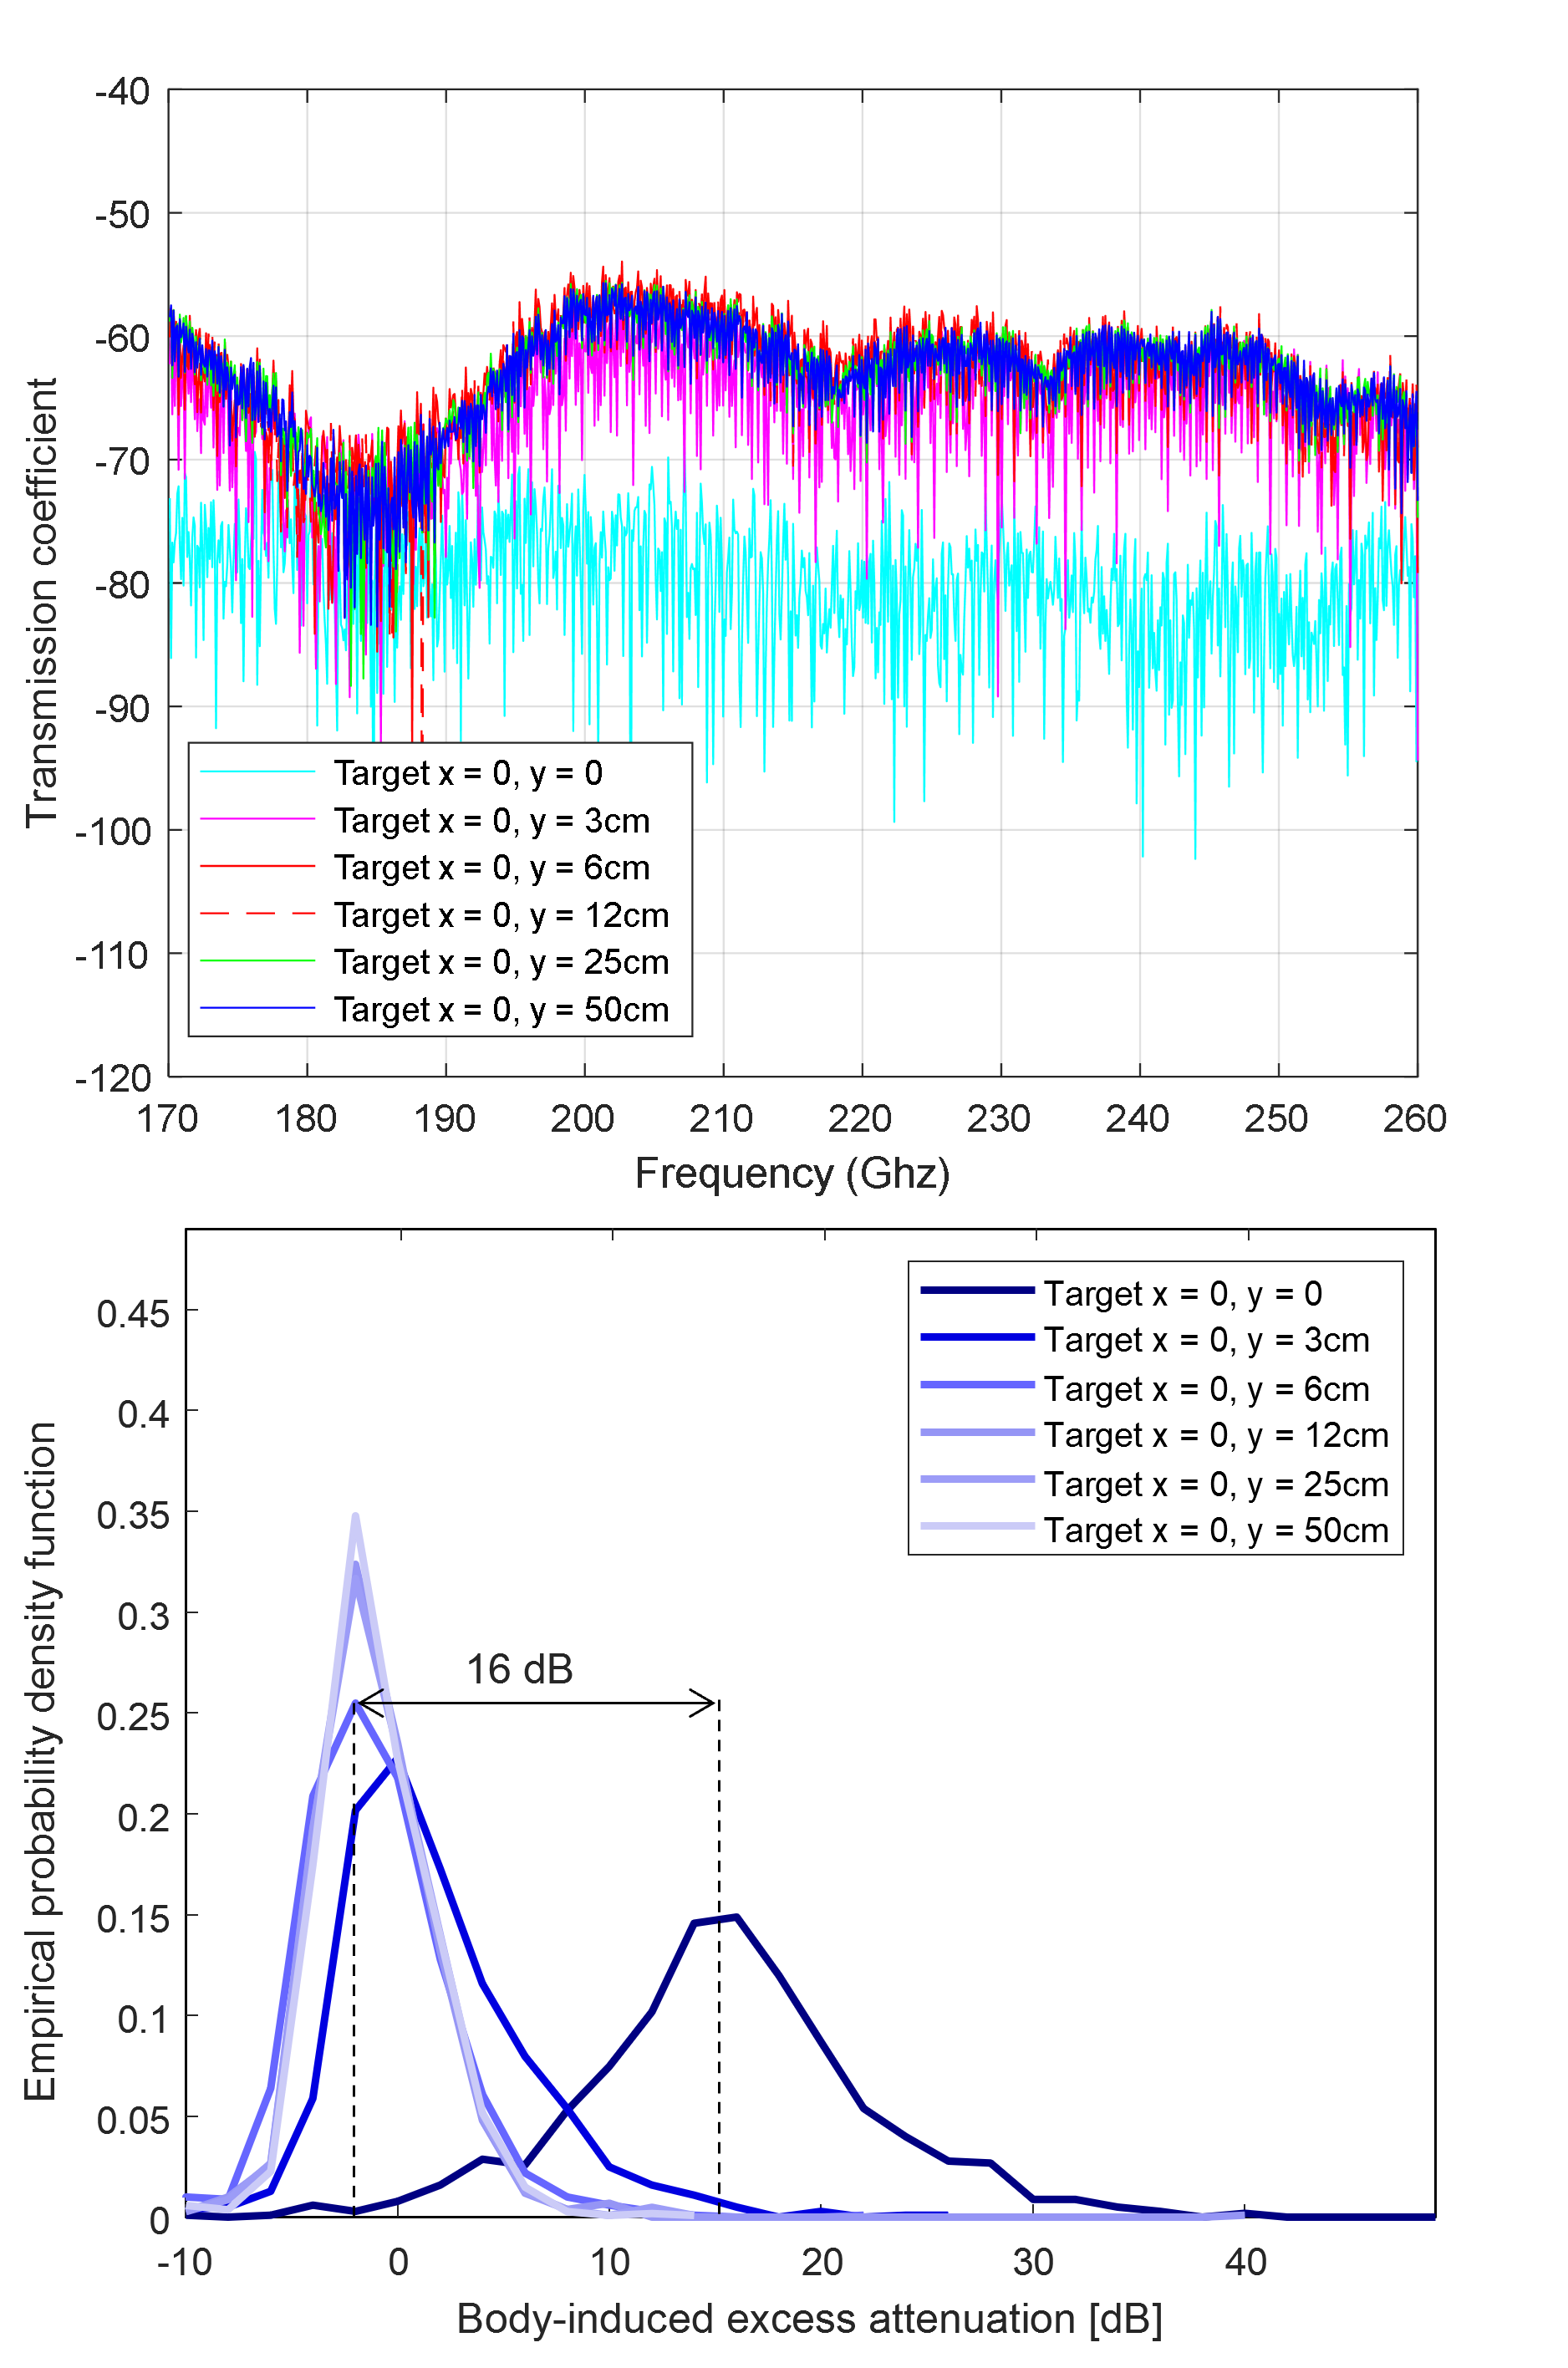
The measurement sessions were conducted in an indoor laboratory environment with an approximate size of m and a floor-to-ceiling height of m. To describe the system geometry we considered the 2D Cartesian coordinate system depicted in Fig. 1 whose origin coincides with the transmitter (TX). This coordinate system identifies an horizontal plane placed at about m from the floor. As shown in the figure, TX and RX nodes are spaced by m apart, along the axis. The target obstructing the LoS link is represented by a simplified phantom (metal cylinder with height 50 cm and diameter 6 cm) which is used to replace the human body. The projection of the target baricenter on the coordinate system has coordinates . The complex frequency domain channel coefficient [19] were measured using a vector network analyzer (VNA) connected to a pair of mmWave extenders for both W and G bands. For both bands we conducted 6 experiments, by varying the target offset w.r.t. the LoS path connecting the TX and RX, namely we considered cm. Note that, in the case the target is completely obstructing the LoS path. For each band and target offset, the VNA collected the transmission coefficients, measured at equally spaced frequencies, as detailed in Tab. I. Furthermore, we also measured the channel frequency response in the target’s absence with the purpose of calibrating the system.
| W band (,) | G band (,) | |
|---|---|---|
| cm | ( dB, dB) | ( dB, dB) |
| cm | n.a. | ( dB, dB) |
| cm | ( dB, dB) | ( dB, dB) |
| cm | ( dB, dB) | ( dB, dB) |
| cm | ( dB, dB) | ( dB, dB) |
| cm | ( dB, dB) | ( dB, dB) |

III Frequency-domain analysis
In this Section we focus on frequency domain analysis and we aim to verify the possibility of discriminating the target position by monitoring the channel frequency response. In particular we discuss the problem of passive detection of the target considering the set of hypotheses , where the index is the identifier of the experiments previously described, and refers to the target offset . The frequency responses in the W and G bands are evaluated separately. Specifically, each band was sampled at equally spaced frequencies , where is the number of sampling points.
During calibration, carried out with no target, we measured and stored the free-space transmission coefficient , for . We then denoted by the transmission coefficient measured during experiment at frequency , with target offset . The RF attenuation due to the target at offset and measured at frequency is given by . The term can be considered a random variable with average and standard deviation . We also denote by the sample distribution of , conditioned to the hypothesis . The detection of the target offset can be obtained by one-vs-all classification using the log-likelihood-ratios (LLRs) for each hypotheses pair:
| (1) |
and applying a majority voting policy.
In Figure 2 and in Table II we show the results obtained in the W band. Specifically, the table reports the mean, , and the standard deviation , for all the monitored target positions whereas in the figure we plotted the amplitude of the transmission coefficient and the sample distribution .
We observe that, excluding the case , where the target is completely blocking the LoS link, the sample distributions do not significantly differ, except for negligible variations of the standard deviation. This causes the decision regions of the LLR tests (1) for the cases to be almost overlapped, with average separation less than dB, thus penalizing the detection performance. Instead, the body induced average RF attenuation for the target blocking the LoS, i.e., and , is dB, which is consistent with conventional scalar diffraction theory models [10]. A similar situation is observed when analyzing the G band (see Figure 3 and Table II). Compared to the W band, much stronger variations of the RF attenuation, (up to 10 dB) are observed, for target offset cm. The body induced average RF attenuation for cm is dB. Fron the figure, the only clearly recognizable target positions offsets are cm and cm.
IV Channel Impulse Response characterization and analysis
In the following, we model the CIR as a discrete set of power/amplitude and delay features. The presence of the blockage introduces new multi-path components and may enhance or attenuate existing ones. The target effects on propagation are here modelled as alterations of selected multipath features. These alterations can be further processed to reveal the unknown position of the target with respect to the LoS link.
The CIR features are obtained from the power delay profile (PDP) that is estimated from the complex measurements of the frequency response. PDPs are used in several motion sensing and localization-based applications [18], combined with Direction of Arrival estimation [20]. In what follows, and according to previous analysis, we focus on the measurements in the G band.
IV-A CIR response
The CIR response, , in absence of the target is represented by a discrete dataset of amplitude and delay features as
| (2) |
where is the number of main observable multipath components, while and are the amplitude and delay of path , respectively. According to the previously described blockage scenario, we assume that the target presence causes “perturbations” of the multipath components, in both amplitude and delay. Such perturbations can be isolated from noisy observations of the PDPs so as to estimate the target offset .
When the target is located at position , , the CIR can be modelled as
| (3) |
and be represented by an augmented dataset comprising multipath components, whose amplitude and delays are
| (4) | ||||
where and the parameter models the amplitude perturbation with respect to that observed in the target’s absence (2). The terms, and model the additional multipath components the target might give rise to.
IV-B Analysis in the G band
Figure 4 shows the estimated PDP response, plotted versus the path length (in cm), where is the speed of light for target offset cm (top) and cm (bottom). The corresponding PDP measured without the target is represented by solid black lines. By analyzing the results, we identify main multipath components in absence of the target.
However, the target presence can introduce up to new components, i.e., . The new CIR components also loosely depend on the target offset w.r.t. the LoS path, thus enabling the localization of the obstruction.
We observe that for cm (i.e., ), no additional multipath components are introduced, w.r.t. . Therefore, for , . On the other hand, a significant attenuation of the existing paths is observed, namely . Excluding the first component, the CIR power features () are subject to an attenuation , ranging between and dB.
For larger offsets ( cm) we observe that the target presence gives rise to new paths. In such case the value of can be inferred from the average path length of the new components.
V Conclusions
This paper provides an initial study of the characterization of human blockage in the sub-THz band. We conducted a measurement campaign focused on the collection of complex transmission coefficients for different offsets of the blocker crossing the line-of-sight (LoS) path. Frequency and time domain analysis of the blockage effects are considered. In particular, we analyzed the channel frequency response and the impulse response (CIR) for different blockage offsets. Our experiments highlighted that the RF attenuation due to the target presence are much stronger in the G band (– GHz) than in the W band (– GHz). From the CIR response we also observed that the presence of the blockage gives rise to new multi-path components, while enhancing or attenuating the existing ones. The target effects on the signal propagation are modelled as alterations of selected CIR multipath features. Importantly, the additional path components introduced by the target are characterized by a path length which depends on the target location. This allows to estimate the target offset w.r.t. the LoS link. These results are promising and are expected to open new opportunities towards precise passive radio localization as well as targeting integrated sensing and communication applications.
References
- [1] J. Wilson, et al., ”Radio tomographic imaging with wireless networks,” IEEE Trans. on Mobile Comp., vol. 9, no. 5, pp. 621–632, May 2010.
- [2] S. Savazzi, S. Sigg, F. Vicentini, S. Kianoush and R. Findling, "On the Use of Stray Wireless Signals for Sensing: A Look Beyond 5G for the Next Generation of Industry," Computer, vol. 52, no. 7, pp. 25-36, July 2019.
- [3] R.C. Shit, et al., ”Ubiquitous Localization (UbiLoc): A Survey and Taxonomy on Device Free Localization for Smart World,” IEEE Communications Surveys & Tutorials, vol. 21, no. 4, pp. 3532–3564, Fourthquarter 2019.
- [4] V. Ojeda, et al., ”Rx position effect on Device Free Indoor Localization in the 28 GHz band,” Proc. of the IEEE Sensors Applications Symposium (SAS’2022), Sundsvall, pp. 1–6, Aug. 2022.
- [5] C. Chaccour, M. N. Soorki, W. Saad, M. Bennis, P. Popovski, M. Debbah, “Seven defining features of Terahertz (THz) wireless systems: A fellowship of communication and sensing,” IEEE Communication Surveys and Tutorials, to appear 2024. DOI 10.1109/COMST.2022.3143454.
- [6] B. Guo, Y. J. Chen, N. Lane, Y. Liu and Z. Yu, "Behavior recognition based on Wi-Fi CSI: Part 1 and 2", IEEE Commun. Mag., vol. 55, no. 10, pp. 90, Oct. 2017.
- [7] O. Kaltiokallio, et al. "A Novel Bayesian Filter for RSS-Based Device-Free Localization and Tracking," IEEE Transactions on Mobile Computing, vol. 20, no. 3, pp. 780-795, March 2021.
- [8] S. Kianoush, S. Savazzi, F. Vicentini, V. Rampa and M. Giussani, "Leveraging RF signals for human sensing: Fall detection and localization in human-machine shared workspaces," Proc. of IEEE 13th International Conference on Industrial Informatics (INDIN), Cambridge, UK, 2015, pp. 1456-1462, doi: 10.1109/INDIN.2015.7281947.
- [9] P. M. Holl and F. Reinhard, "Holography of Wi-Fi radiation", Phys. Rev. Lett., vol. 118, pp. 183901-May, 2017.
- [10] V. Rampa, G. G. Gentili, S. Savazzi and M. D’Amico, "Electromagnetic Models for Passive Detection and Localization of Multiple Bodies," in IEEE Transactions on Antennas and Propagation, vol. 70, no. 2, pp. 1462-1475, Feb. 2022, doi: 10.1109/TAP.2021.3111405.
- [11] A. Abdelgawwad, et al. "A Trajectory-Driven 3D Channel Model for Human Activity Recognition," IEEE Access, vol. 9, pp. 103393-103406, 2021.
- [12] M. Mohamed, et al., ”Physical-statistical channel model for off-body area network,” IEEE Antennas and Wireless Propagation Letters, vol. 16, pp. 1516–1519, 2017.
- [13] H. Dembele, M. LeBot, F. Gallee, P. Pajusco “Impact of Human Blockage on 5G Communication System in the 26GHz Band,” Proc of EuCAP, Mar. 2021.
- [14] M. F. Khajeim, G. Moradi, R. S. Shirazi and S. Zhang, “A Body-Blockage Analysis and Comparison Between Humans and a Full-Body Phantom: Using measurements at 28 GHz,” IEEE Antennas and Propagation Magazine, vol. 64, no. 6, pp. 50-61, Dec. 2022, doi: 10.1109/MAP.2021.3089988.
- [15] M. Lotti, M. Caillet and R. D’Errico, “Multiband Sub-THz Double Angular Characterization in Indoor Scenario,” IEEE Transactions on Antennas and Propagation, vol. 71, no. 2, pp. 1747-1756, Feb. 2023, doi: 10.1109/TAP.2022.3227474.
- [16] Y. Xing, T. S. Rappaport and A. Ghosh, “Millimeter Wave and Sub-THz Indoor Radio Propagation Channel Measurements, Models, and Comparisons in an Office Environment,” IEEE Communications Letters, vol. 25, no. 10, pp. 3151-3155, Oct. 2021, doi: 10.1109/LCOMM.2021.3088264.
- [17] A. Shurakov et al. “Empirical blockage characterization and detection in indoor sub-THz communications,” Computer Communications, no. 201, pp. 48-58, 2023.
- [18] Y. Xie, et al., ”Precise power delay profiling with commodity Wi-Fi,” IEEE Transactions on Mobile Computing, vol. 18, no. 6, pp. 1342–1355, 2018.
- [19] G. Virone, R. Tascone, A. Olivieri, G. Addamo and O. A. Peverini, ”A waveguide/free-space measurement setup for panels and joints of large dielectric radomes,” 2007 International Conference on Electromagnetics in Advanced Applications, Turin, Italy, 2007, pp. 792-794, doi: 10.1109/ICEAA.2007.4387422.
- [20] M. Santoboni, R. Bersan, S. Savazzi, A. Zecchin, V. Rampa and D. Piazza, “Wireless LAN sensing with smart antennas,” Proc. 16th European Conference on Antennas and Propagation (EuCAP), Madrid, Spain, pp. 1-5, 2022.
- [21] Abiodun M. Ikotun, Absalom E. Ezugwu, Laith Abualigah, Belal Abuhaija, Jia Heming, “K-means clustering algorithms: A comprehensive review, variants analysis, and advances in the era of big data,” Information Sciences, Volume 622, Pages 178-210, 2023.