HEST-1k: A Dataset for Spatial Transcriptomics and Histology Image Analysis
Abstract
Spatial transcriptomics (ST) enables interrogating the molecular composition of tissue with ever-increasing resolution, depth, and sensitivity. However, costs, rapidly evolving technology, and lack of standards have constrained computational methods in ST to narrow tasks and small cohorts. In addition, the underlying tissue morphology as reflected by H&E-stained whole slide images (WSIs) encodes rich information often overlooked in ST studies. Here, we introduce HEST-1k, a collection of 1,108 spatial transcriptomic profiles, each linked to a WSI and metadata. HEST-1k was assembled using HEST-Library from 131 public and internal cohorts encompassing 25 organs, two species (Homo Sapiens and Mus Musculus), and 320 cancer samples from 25 cancer types. HEST-1k processing enabled the identification of 1.5 million expression–morphology pairs and 60 million nuclei. HEST-1k is tested on three use cases: (1) benchmarking foundation models for histopathology (HEST-Benchmark), (2) biomarker identification, and (3) multimodal representation learning. HEST-1k, HEST-Library, and HEST-Benchmark can be freely accessed via https://github.com/mahmoodlab/hest.
1 Introduction
Advances in molecular profiling enable spatially-resolved gene expression analysis with increasingly large gene panels, enhanced spatial resolution, and greater sensitivity Asp et al. (2020); Rao et al. (2021). From the early days of bulk RNA sequencing constrained by its coarse resolution and limited gene panels, spatially-resolved technologies have progressed to achieve whole-transcriptome sequencing at sub-cellular resolution Li and Wang (2021). In cancer research, spatial transcriptomics (ST) holds particular promise for characterizing the tumor microenvironment, a key element in understanding disease progression and treatment response Ståhl et al. (2016b); Marx (2021); de Visser and Joyce (2023); Xiao and Yu (2021). With the large amount of transcriptomics data generated by a single ST sample (e.g., 10 million transcripts are detected in a typical 10x Genomics Xenium assay), computational methods are often used to identify promising targets and biomarkers, such as based on gene expression clustering or gene-set enrichment analysis Rao et al. (2021).
However, high costs and rapidly evolving technology have constrained computational methods to narrow tasks and data cohorts of only few patients Meylan et al. (2022); Janesick et al. (2023); Valdeolivas et al. (2023). Consequently, we observe a lack of standardized resources and unified formats for storing ST, which limits the development of deep learning models on a large scale Moses and Pachter (2022). In addition, the underlying tissue morphology, traditionally visualized in hematoxylin and eosin (H&E)-stained tissue sections (whole-slide images, WSIs), is often overlooked in ST studies, despite encoding valuable information. In particular, pairs of ST and WSI enable analyzing expression changes in their morphological context, which may facilitate the discovery of morphological biomarkers (e.g., changes in nuclear shape) that correspond to gene regulation patterns. In translational medicine, ST could be employed for identifying biomarkers, which are then morphologically validated and characterized by widely deployed clinical modalities such as H&E. Alternatively, pairs of ST and WSI can enable multimodal tissue representation learning for joint modeling of the morphomolecular signature of tissue at a scale and resolution beyond bulk RNA sequencing Chen et al. (2022). Finally, the development of “foundation models” for encoding histopathology image patches Wang et al. (2021); Filiot et al. (2023); Chen et al. (2024); Huang et al. (2023) has increased the need for new, diverse, and challenging benchmarks beyond diagnostic tasks. Using ST, new tasks can be defined for predicting gene expression from histology.
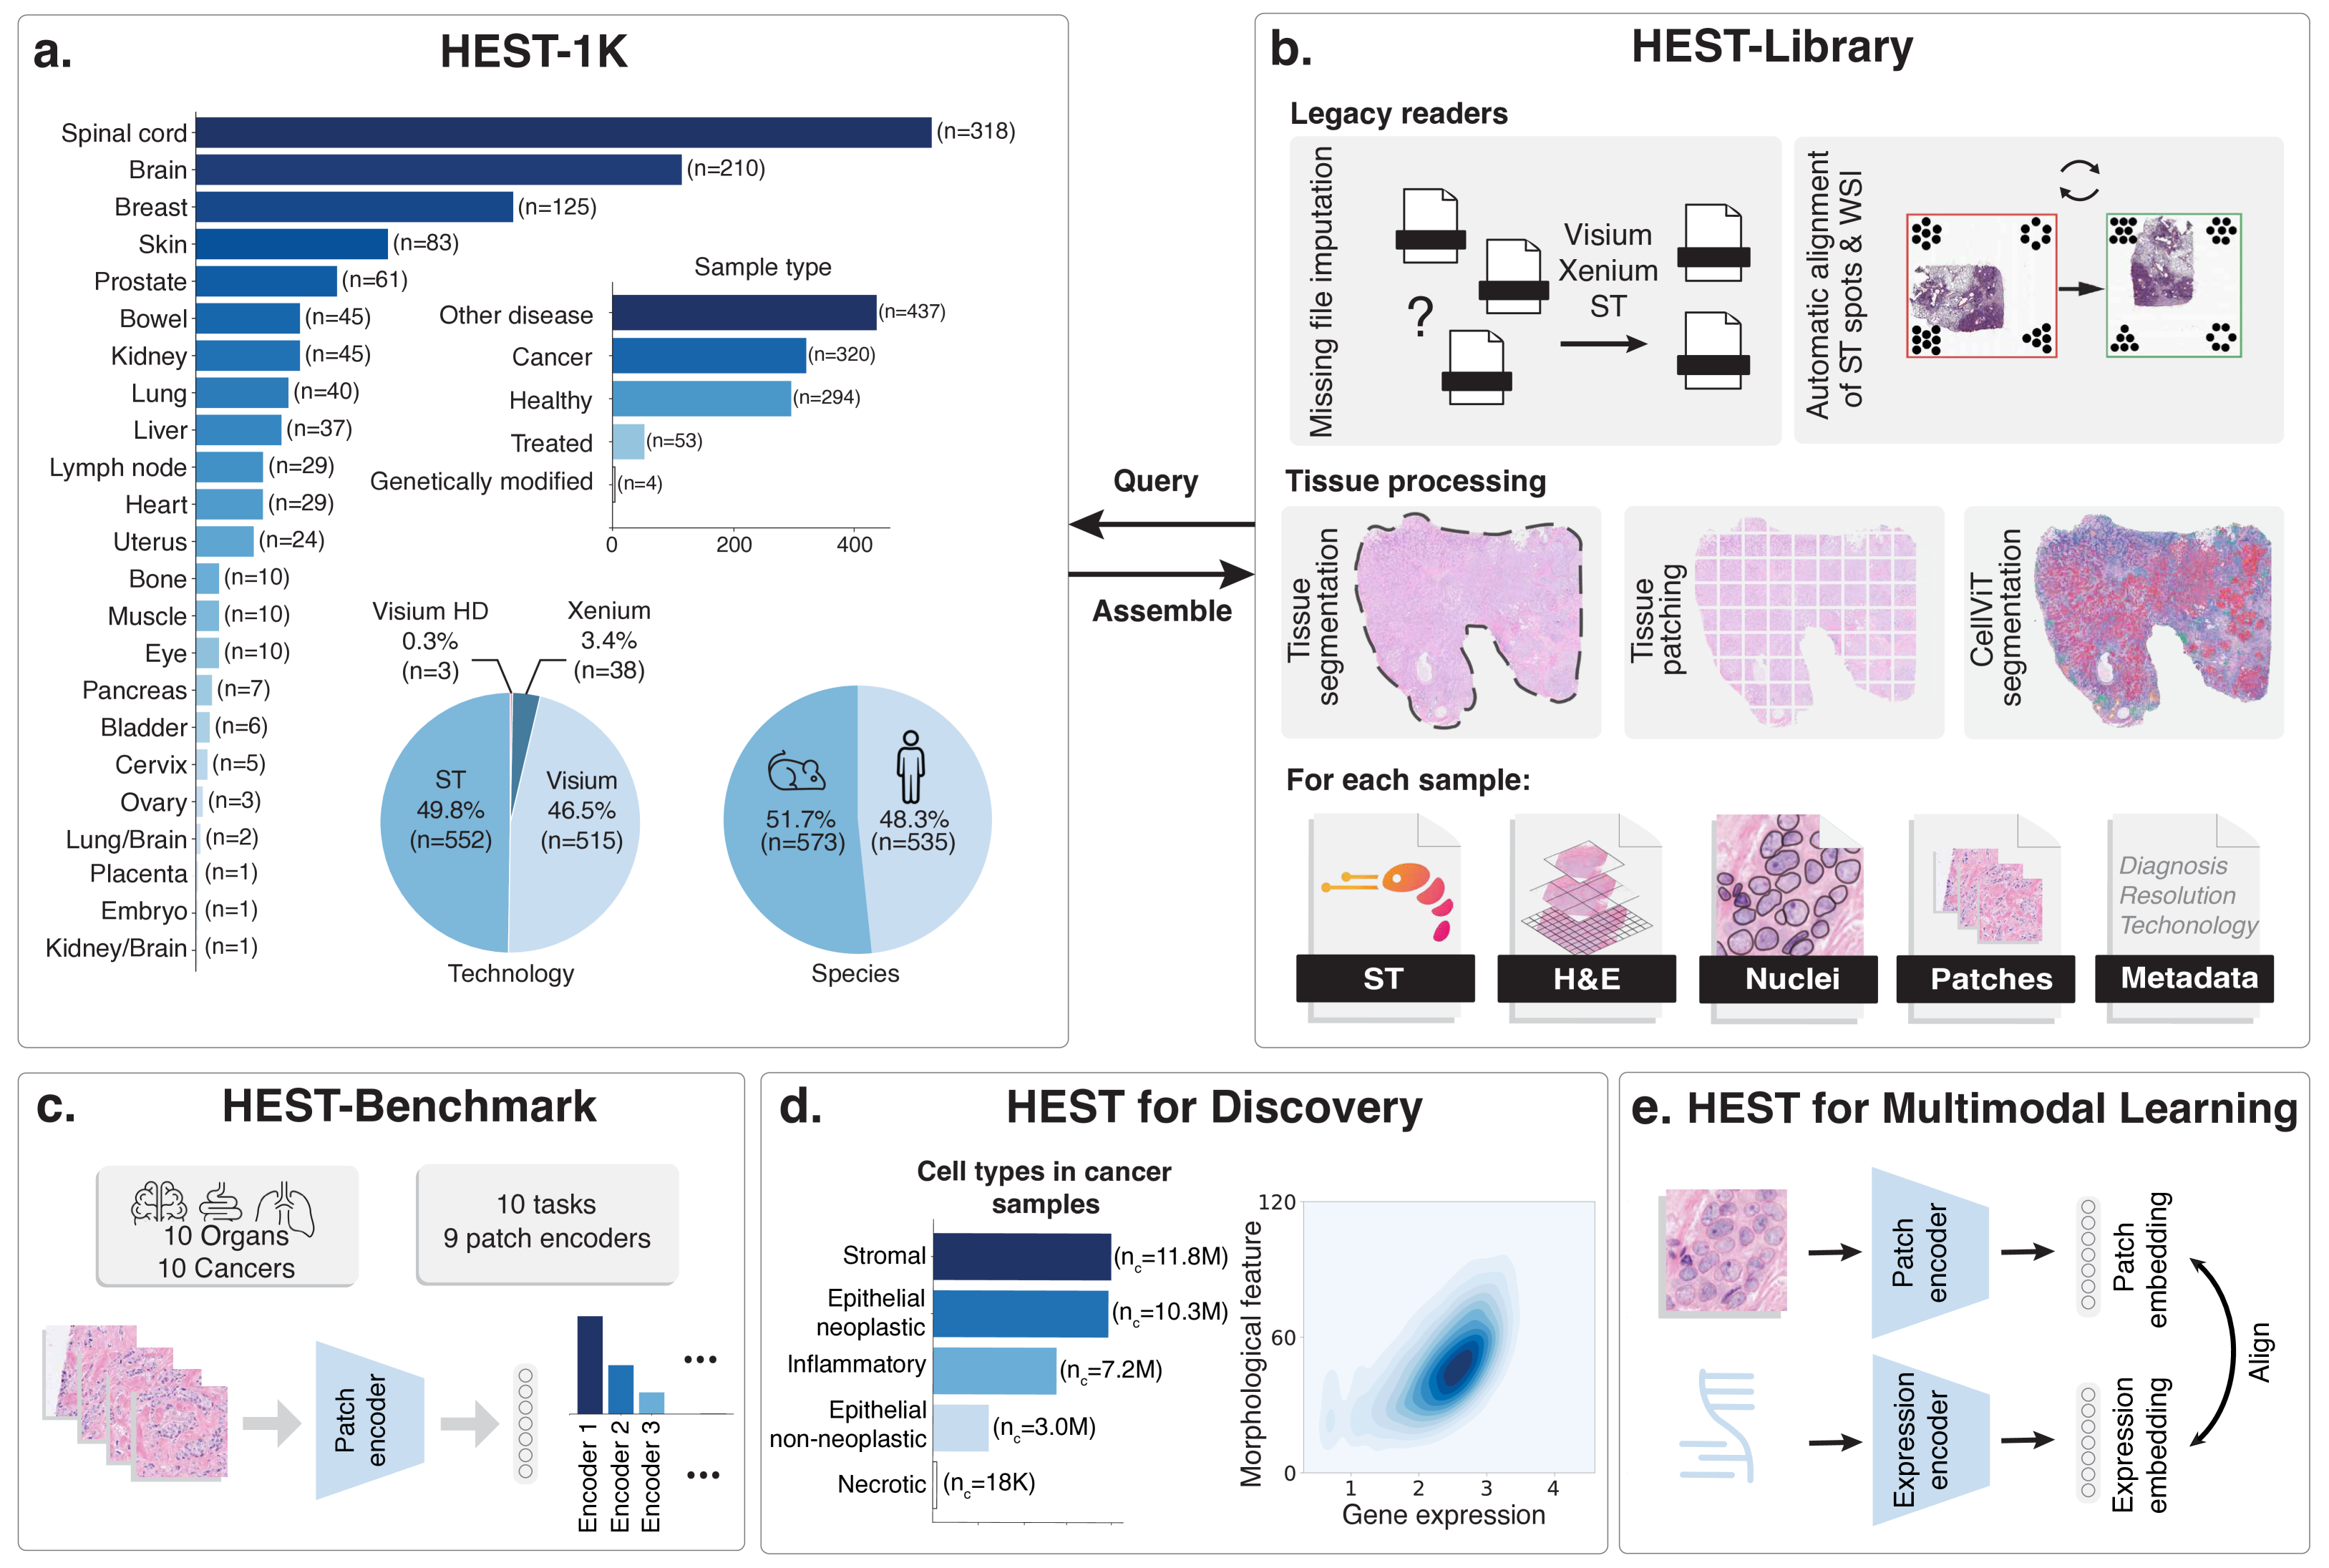
Here, we introduce HEST-1k, a collection of paired ST and H&E-stained WSIs curated from public and internal cohorts (Figure 1.a). HEST-1k comprises 1,108 samples from 131 cohorts encompassing 25 organs, two species (Homo Sapiens and Mus Musculus), and 320 cancer samples from 25 subtypes. Processing all samples in HEST-1k resulted in 1.5 million expression–morphology pairs and 60 million detected nuclei. With new cohorts frequently made public, we also introduce the HEST-Library, a Python package for querying HEST-1k and assembling new legacy data (Figure 1.b). We highlight the potential of HEST-1k through three use cases: (i) benchmarking foundation models for histology using the HEST-Benchmark, a set of ten tasks (nine human cancer types and ten organs) for gene expression prediction from histology and evaluated on ten state-of-the-art models (Figure 1.c), (ii) a proof-of-concept demonstrating the use of HEST-1k for biomarker characterization (Figure 1.d), and (iii) a proof-of-concept for expression-guided fine-tuning of foundation models for histology (Figure 1.e).
2 Related work
Libraries for ST analysis. Libraries to process, visualize, and analyze ST have been built around two core pipelines: Scanpy Wolf et al. (2018) (and the Anndata format) in Python and Seurat Butler et al. (2018) in R. Scanpy has served as the foundation for several subsequent developments such as Squidpy Palla et al. (2022) for spatial data exploration at cellular-, gene-, and morphological-level, SpatialData Marconato et al. (2024) for multi-technology integration and deep learning interfacing, and STlearn Pham et al. (2023) for cell-cell interactions and spatiotemporal trajectory analyses. In R, Seurat Butler et al. (2018) has been consolidated with packages such as BayeSpace Zhao et al. (2021) for clustering and spot super-resolution, and Giotto suites Chen et al. (2023) for preprocessing, data integration, and visualization of multiple ST technologies. 10x genomics also includes software analytics through the Xenium and Visium Explorer pipelines for multimodal visualization, nuclear segmentation, and cell deconvolution. However, none of these pipelines were designed to handle the diversity of legacy data, where datasets can suffer from missing or incorrect data, such as alignment mismatches, incorrect pixel resolution, inconsistent image file formats, etc.
Molecular profile prediction from H&E. Molecular profiling from histology images has been explored both at (1) slide-level to predict bulk molecular status/changes from a WSI, and at (2) patch-level to predict local molecular status/changes from regions-of-interest. (1) Slide-level profiling has been proposed to predict the presence of gene mutations Saldanha et al. (2023); Wagner et al. (2023); Kather et al. (2020); Echle et al. (2021); Fu et al. (2020); Wang et al. (2019); Loeffler et al. (2022), microsatellite instability Wagner et al. (2023); Kather et al. (2019b), and gene expression changes Schmauch et al. (2020); El Nahhas et al. (2024); He et al. (2020); Alsaafin et al. (2023), among others. The motivation is two-fold: First, patient screening to substitute or emulate costly clinical molecular assays, and second, to identify morphological correlates of molecular alterations for discovering novel biomarkers. Such studies can be conducted on large patient cohorts as they mainly rely on data generated by the routine clinical workflow (e.g., using TCGA cohorts with 11,000 cases from 33 cancer types). (2) With ST, several works have explored predicting expression changes from regions-of-interest He et al. (2020); Xie et al. (2023); Pang et al. (2021); Zhao et al. (2024); Rahaman et al. (2023); Monjo et al. (2022); Mondol et al. (2023); Chung et al. (2024); Wang et al. (2024). Due to limited cohort sizes (typically one to ten patients), transfer learning has become the norm using pretrained networks based on ConvNets He et al. (2020) or Vision Transformers Xie et al. (2023); Pang et al. (2021). Transcriptomic measurements are inherently noisy, hence the development of context-based methods that integrate global and local information from surrounding ST spots Chung et al. (2024); Zhao et al. (2024); Wang et al. (2024). While recent technologies offer near-single-cell resolution (such as Visium HD and Xenium), legacy assays operate at a more coarse resolution, which can be upsampled using super-resolution techniques Zhao et al. (2021); Bergenstråhle et al. (2022); Zhang et al. (2024). The potential clinical and research implications of such methods are still being explored, with HEST-1k potentially catalyzing their large-scale development.
Foundation models in pathology. A fundamental task in computational pathology is to extract general-purpose embeddings of image patches (typically 256256-pixel regions) that can then be used for downstream tasks, such as diagnosis or prognosis prediction. To achieve this, self-supervised learning (SSL) has been extensively applied Koohbanani et al. (2021); Filiot et al. (2023); Vorontsov et al. (2023); Wang et al. (2021); Kang et al. (2023); Ciga et al. (2022); Wang et al. (2022); Azizi et al. (2023); Chen et al. (2024); Lu et al. (2024), such as based on the DINOv2 framework Oquab et al. (2023). Models for general-purpose patch encoding are trained on increasingly large and more diverse patient cohorts with models growing in model size (e.g., Virchow uses a ViT-Huge trained on more than 1.5M WSIs Vorontsov et al. (2023)). As the number of such models rapidly increases, new, diverse, and challenging benchmarks are needed to replace or complement well-established tasks where performance has saturated. HEST-Benchmark aims to address this by offering a set of ten patch-level tasks for gene expression prediction from histology.
Patch-level benchmarks in histopathology. Early task and dataset contributions in computational pathology revolved around classifying small regions of interest. Over the years, a variety of benchmarks have been established: In prostate cancer, Gleason grading at pixel- and patch-level has been widely explored, with public resources such as PANDA Bulten et al. (2022), AGCC Huo et al. (2022), DiagSet Koziarski et al. (2024), and SICAPv2 Silva-Rodríguez et al. (2020). In colorectal cancer, datasets have been proposed for tissue classification, such as HunCRC Pataki et al. (2022), UniToPatho Barbano et al. (2021), MHIST Wei et al. (2021), and CRC-100k Kather et al. (2019a). In breast cancer, morphological subtyping has been studied (e.g., for atypical ductal hyperplasia detection), such as BACH Aresta et al. (2019), BRACS Brancati et al. (2021), and BreakHis Spanhol et al. (2015), and for lymph node metastasis detection with Patch CAMELYON (pCAM) Veeling et al. (2018), respectively. However, the performance on many of these datasets has saturated; for instance, Gleason scoring reaches similar or better performance than pathologists Bulten et al. (2022), which limits objective comparisons of new methods and hinders well-informed model selection for developing better features. Instead, HEST-Benchmark provides a collection of diverse and challenging tasks that enable assessing the predictive capabilities of foundation models for histology.
3 HEST-1k Dataset
We present HEST-1k, a dataset of paired ST, H&E-stained WSIs, and metadata (Figure 1.a). To this end, we extracted all publicly available cohorts that provide ST with H&E-stained whole-slide images. Specifically, we harvested data from 10x Genomics public datasets (TENX)111https://www.10xgenomics.com/datasets, Mendeley (MEND)222https://data.mendeley.com/, Spatial-Research (SPA)333https://www.spatialresearch.org/, Zenodo (ZEN)444https://zenodo.org/, the National Center for Biotechnology Information (NCBI)555https://www.ncbi.nlm.nih.gov/gds/, GitHub666https://github.com/, the Human Cell Atlas777https://data.humancellatlas.org/, and internal data cohorts. A summary of all sources is provided in Appendix Table A1 with specifics in Appendix Table A2, A4, A6,A7,A8,A9, and A10.
3.1 Metadata
As Spatial Transcriptomics were not intended for large-scale computational research, they are provided in various formats (e.g., images can be in JPG or TIFF format, with or without cross-modal alignment files) and resolutions. We unified all data with comprehensive metadata with generic-, histology-, and expression-related descriptors for all samples. Generic: We provide the reference to the original publication, download link, year of publication, license, and sample species. Each sample is then categorized as either healthy, cancer, treated (which refers to a post-compound administration), genetically modified (mostly knock-out mouse samples), or other diseases (with an additional description). All cancer samples were unified using the OncoTree code, a taxonomy of cancer types provided by the Memorial Sloan Kettering Cancer Center888https://oncotree.mskcc.org. Finally, we include the organ using the highest level of the OncoTree taxonomy as a reference. Expression: We include the number of genes and spots per sample, the spot resolution and spacing, the total number of reads, and the mean number of reads per spot. We additionally provide the transcriptomic technology (ST, Visum, Visium HD, or Xenium). Histology: We provide the image resolution (in m/pixel) and magnification as 10 (1.15 to 0.8 m/px), 20 (0.8 to 0.4 m/px) and 40 (0.4 to 0.1 m/px). All images with a resolution lower than 1.15 m/px were discarded to ensure an acceptable image quality. In addition, we provide the image size at the highest resolution, and tissue preparation protocol (frozen or formalin-fixed paraffin-embedded, FFPE).
3.2 Histology
All tissue sections were normalized and transformed into a generic TIFF object, a pyramidal image that can easily be integrated into computational frameworks using Openslide or viewers such as QuPath Bankhead et al. (2017). In addition, we provide a contour object that delineates all the tissue regions identified in the image. We developed a robust tissue detection method where we fine-tuned a DeepLabV3 Chen et al. (2017) model with an ImageNet-pretrained ResNet50 backbone on a set of annotated segmentation regions. From the tissue segmentation, we extracted 224224-pixel patches at 20 magnification around each spot. This yielded 1.5 million valid patches for which a corresponding expression profile was derived. Such patching can readily be used for various downstream tasks, such as employed in the HEST-Benchmark or multimodal fine-tuning of foundation models for histology (Section 5 and 7).
3.3 Nuclear segmentation and classification
In addition to patching, we include nuclear segmentation that delineates each nucleus identified in all slides from HEST-1k. Specifically, we use CellViT Hörst et al. (2024), a state-of-the-art nuclear segmentation model that was trained on the PanNuke dataset Gamper et al. (2019, 2020). CellViT enables joint instance segmentation and classification of each nucleus into five classes: neoplastic epithelial, non-neoplastic epithelial, inflammatory, stromal, and necrotic. On average, we identified 55.5k nuclei per slide (standard deviation 91.3k nuclei), for a total of 59.6 million nuclei identified across all samples. Among those 17.6 million are classified as neoplastic, 21.5 million as stromal, 4.9 million as normal epithelial, 15.4 million as inflammatory, and 76 thousand as necrotic. The resulting nuclear segmentation and classification can easily be visualized using QuPath (using geojson) or loaded as Python/R objects (using json).
3.4 Gene expression
All expression data were unified in a Anndata object that can be loaded with scanpy. Anndata encodes the gene names (as var) and number of spots (as obs). Each entry represents the raw transcript counts of a gene in a given spot. No additional normalization was conducted, and we let users explore various normalization strategies based on needs, e.g., using total count normalization, log-based re-weighting, etc. In addition, we include metadata to specify the number of genes, the gene panel, and the tissue site.
To use the expression in tandem with the WSI, an alignment file describing the mapping between the image and the spots is needed. However, relying on publicly available alignment information brings three challenges: (1) most datasets report alignment with respect to a low-resolution version of the image, (2) they are not standardized, and (3) alignment quality can be low. To address these limitations, we re-aligned all samples under the same unified format between the WSI and the corresponding expression profile. To this end, we developed an automatic alignment pipeline (see Section 4) and embedded the alignment in the scanpy object.
4 HEST-Library
The HEST-Library is built around scanpy and Anndata. At its core, the HEST-Library enables (1) assembling and querying HEST-1k, and (2) running the HEST-Benchmark (see Section 5). We describe its core functionalities, in particular for unifying legacy data.
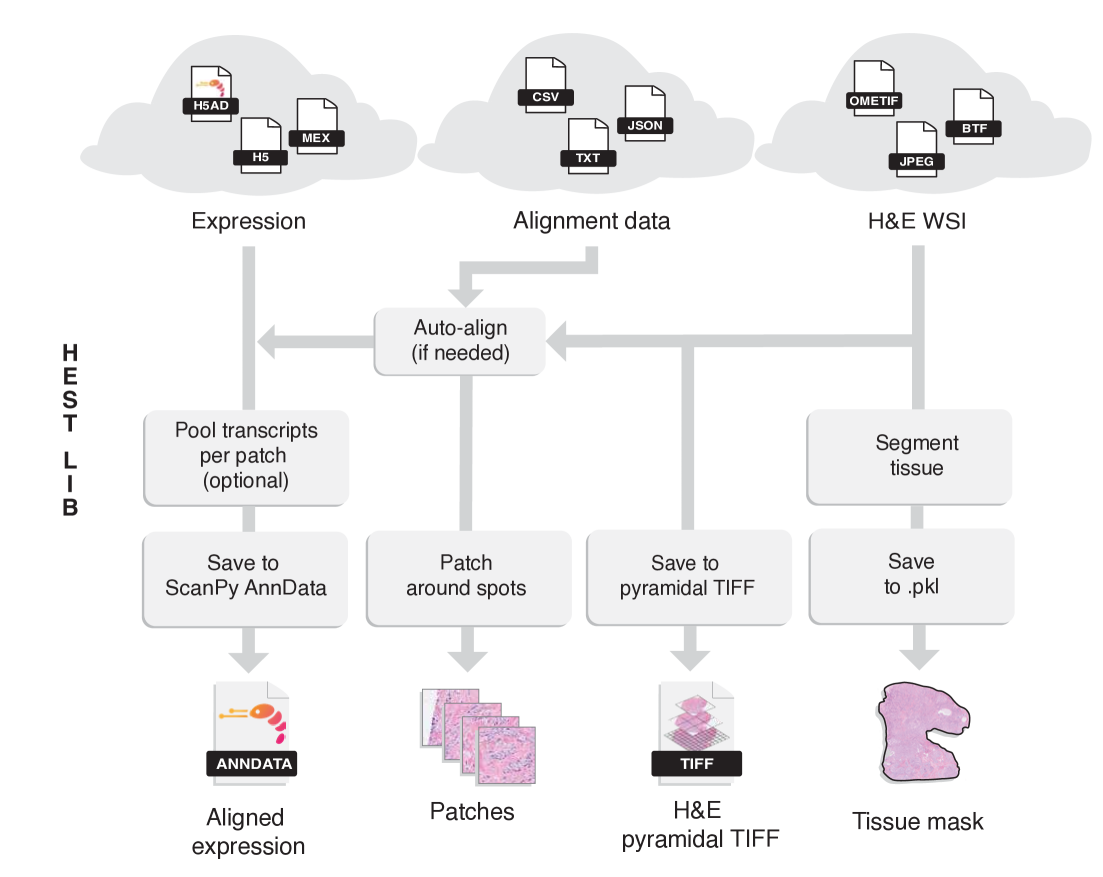
Conversion to generic TIFF. We integrate functions to convert a WSI from common formats found in public ST datasets (e.g., OME.TIF, JPG, BigTIFF, etc.) to a pyramidal generic TIFF format. Pyramidal formats offer seamless integration with OpenSlide (commonly used in computational pathology pipelines) and QuPath (open-access software for WSI visualization and annotation).
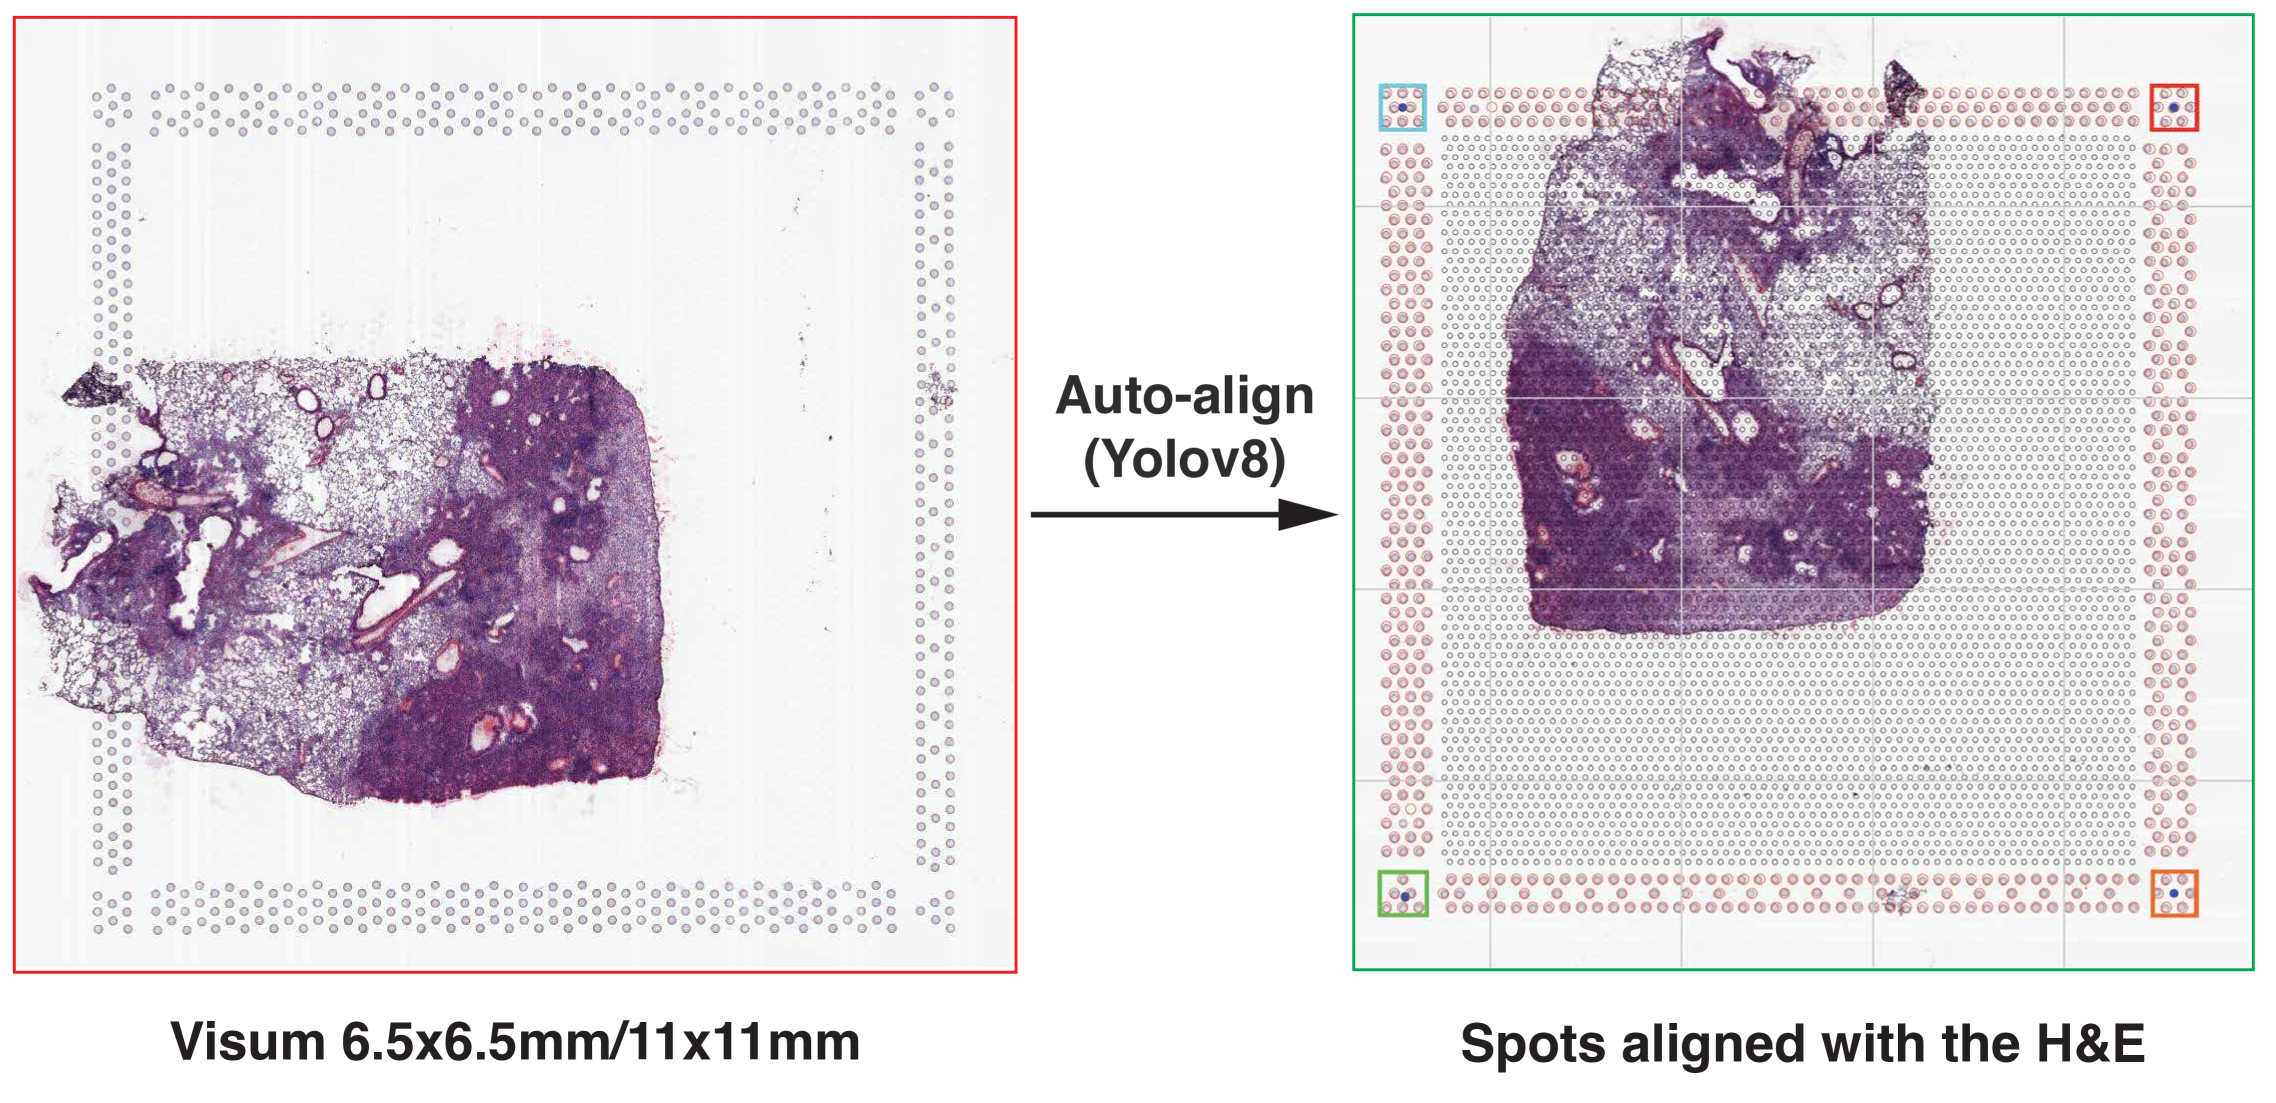
Automatic alignment. Spot alignment is crucial to ensure an accurate match between the ST spots and the WSI. While software such as LoupeBrowser enables manual alignment using the fiducials (in Visium), the process remains time-consuming when processing large batches of samples. Instead, we implemented an automatic fiducial detection algorithm based on Yolov8 Redmon et al. (2016) for processing Visium samples (Appendix Figure 4). Specifically, we manually annotated 119 fiducial regions that we further augmented using tissue and fiducials mixing. We then fine-tuned Yolov8 pretrained on COCO dataset. In samples without fiducials (e.g., early versions of Spatial Transcriptomics), we realigned using the provided spot position files.
Automatic detection of image resolution. From the alignment and the spot resolution, we can infer the exact pixel resolution. We start by deriving the distance in pixel between two neighboring spots and leverage the known inter-spot distance in m to estimate the pixel width in m/px. For Xenium samples, we directly read the H&E alignment file which provides an affine transformation from the DAPI-stained image (with known pixel size) to the H&E image. We then compared the self-reported image resolution and our re-estimations to manually inspect and correct discrepancies.
Conversion to Anndata. ST data is provided in multiple formats, such as CSVs, MEX, TXT, h5, etc. We provide functions to unify a large set of existing formats into a AnnData object that stores the raw transcript counts as a matrix of genes by the number of spots.
Tissue segmentation and patching. We provide a tissue segmentation pipeline optimized for Visium/Xenium images. The segmented tissue can automatically be tessellated into fixed-size image patches at a predefined resolution around each spot.
Automatic HEST-1k download. To facilitate downloading part or all of the HEST-1k dataset (in total 825 GB), we implemented an easy download option where the user can specify entries of the metadata, for instance, to query all human breast cancer cases.
5 HEST-Benchmark
From HEST-1k, we curated the HEST-Benchmark, a set of ten tasks for gene expression prediction from histology in human cancer samples. The goal is two-fold: (i) benchmarking foundation models for histology under a diverse and challenging benchmark, and (ii) understanding the predictive capabilities of state-of-the-art models in predicting expression from morphology. Compared to existing tasks (e.g., Camelyon16), HEST-Benchmark brings more morphological and data acquisition diversity, and more complex tasks as expression prediction is inherently challenging.
5.1 Task definition
We define ten tasks with data from nine human cancers and ten organs (nine primary and one metastatic dataset), which include invasive ductal carcinoma (breast cancer, IDC, Task 1), prostate adenocarcinoma (prostate cancer, PRAD, Task 2), pancreatic adenocarcinoma (pancreatic cancer, PRAD, Task 3), skin cutaneous melanoma (skin cancer, SKCM, Task 4), colonic adenocarcinoma (colon cancer, COAD, Task 5), rectal adenocarcinoma (rectum cancer, READ, Task 6), clear cell renal cell carcinoma (kidney cancer, ccRCC, Task 7), hepatocellular carcinoma (liver cancer, HCC, Task 8), lung adenocarcinoma (lung cancer, LUAD, Task 9), and axillary lymph nodes in IDC (metastatic, LYM-IDC, Task 10). Additional information is provided in Appendix Table A11.
For each task, we predict the expression of the top 50 genes with the highest normalized variance across all samples from 112112 m H&E regions (equivalent to 224224-pixel patches at 20). To avoid train/test patient-level data leakage, we use patient-stratified splits, resulting in a -fold cross-validation, where is the number of patients. In ccRCC, we use -fold cross-validation due to the large number of patients.
5.2 Evaluating foundation models for histology on HEST-Benchmark
We use the HEST-Benchmark to evaluate ten patch encoders for histology. Namely, ResNet50 (IN) Lu et al. (2020) (ImageNet pretrained), KimiaNet Riasatian et al. (2021) (pretrained with supervised subtyping classification), Ciga Ciga et al. (2022) (SimCLR pretrained on public histology data), CTransPath Wang et al. (2022) (adapted MoCov3 pretrained on TCGA and PAIP), Remedis Azizi et al. (2023) (iBOT pretrained on TCGA), Phikon Filiot et al. (2023) (iBOT pretrained on TCGA), PLIP Huang et al. (2023) (visual-language model based on CLIP pretrained on histology data from Twitter), UNI Chen et al. (2024) (DINOv2 ViT-Large pretrained on public and private histology data), CONCH Lu et al. (2024) (visual-language model using CoCa pretrained on captions from publications and educational resources), and GigaPath Xu et al. (2024) (DINOv2 ViT-Giant pretrained on proprietary data). Additional information is provided in Table A12 and Section C.3.
| ResNet50 | KimiaNet | Ciga | CTransPath | Remedis | Phikon | PLIP | UNI | CONCH | GigaPath | |
|---|---|---|---|---|---|---|---|---|---|---|
| IDC | 0.440 | 0.420 | 0.406 | 0.454 | 0.491 | 0.430 | 0.436 | 0.492 | ||
| PRAD | 0.318 | 0.328 | 0.332 | 0.346 | 0.335 | 0.362 | 0.357 | 0.372 | ||
| PAAD | 0.389 | 0.410 | 0.397 | 0.406 | 0.372 | 0.392 | 0.424 | 0.425 | ||
| SKCM | 0.446 | 0.452 | 0.484 | 0.535 | 0.577 | 0.516 | 0.461 | 0.541 | ||
| COAD | 0.107 | 0.080 | 0.102 | 0.123 | 0.125 | 0.137 | 0.112 | 0.124 | ||
| READ | 0.051 | 0.038 | 0.046 | 0.083 | 0.099 | 0.138 | 0.063 | 0.132 | ||
| CCRCC | 0.136 | 0.136 | 0.127 | 0.171 | 0.178 | 0.124 | 0.149 | 0.182 | ||
| HCC | 0.034 | 0.028 | 0.045 | 0.041 | 0.038 | 0.051 | 0.040 | 0.055 | ||
| LUNG | 0.497 | 0.507 | 0.515 | 0.531 | 0.541 | 0.533 | 0.511 | 0.547 | ||
| LYMPH_IDC | 0.205 | 0.206 | 0.218 | 0.238 | 0.243 | 0.243 | 0.229 | 0.234 | ||
| Average | 0.262 | 0.261 | 0.267 | 0.295 | 0.315 | 0.297 | 0.275 | 0.315 |
We learn a regression model to map model-specific patch embeddings (512 to 2048 dimensions) to the log1p-normalized expression of the top-50 highly variable genes. All tasks are evaluated using the Pearson correlation between the predicted and measured gene expression. We report mean and standard deviation across all folds (or patients). All experiments were run on a single NVIDIA 3090 GPU. Table 1 summarizes HEST-Benchmark when employing a Random Forest regression model (70 trees), and Table A13 when employing a Ridge regression model.
When using Random Forest, UNI Chen et al. (2024), GigaPath Xu et al. (2024), Remedis Azizi et al. (2023), and CONCH Lu et al. (2024) provide similar performance (0.315 to 0.319 average Pearson correlation across all tasks), outperforming all other baselines. When using a Ridge regression, CONCH Lu et al. (2024) significantly outperforms all models with an average of +5.0% absolute performance gain over the second-best model, Phikon, and 5.3% better than the third-best model, CTransPath with an average Pearson correlation of 0.316.
Supervised vs. contrastive vs. student-teacher pretraining: When employing both Random Forest or Ridge regression, supervised models (ResNet50-IN and KimiaNet) exhibit lower performance than other models. This can be attributed to (1) a lack of sufficiently large and diverse pretraining datasets and models or (2) fundamental limitations of supervised models in transferring to challenging tasks. Using Random Forest, the best student-teacher models (UNI, CONCH, GigaPath) provide similar performance to the best contrastive approach (Remedis).
Vision Transformer Base vs. Large vs. Giant: CONCH (ViT-Base, 86M parameters), UNI (ViT-Large, 307M) and GigaPath (ViT-Giant, 1.13B) provide similar performance despite GigaPath using 13 more parameters than CONCH. UNI and GigaPath have been trained in a unimodal fashion by building “views” using traditional augmentation techniques, such as color jittering and cropping. In contrast, CONCH was trained in two steps: first using unimodal iBOT pretraining, and then by fine-tuning the resulting model on image-caption pairs. Such fine-tuning step could explain its parameter-efficiency and high performance in HEST-Benchmark.
Random Forest vs. Ridge regression: The best-performing model using Random Forest (UNI, 0.319) is similar to the best-performing model using Ridge regression (CONCH, 0.316), showing the predictive capabilities of both regression models. However, Ridge regression leads to poor performance using larger models (GigaPath, Remedis, and UNI), which could be explained by the curse of dimensionality (CONCH embedding dimension is 3 smaller than GigaPath). We also emphasize that the performance could be optimized using more complex models (such as MLP) or dedicated hyper-parameter search.
Overall, HEST-Benchmark brings new insights into the performance of patch encoders for histology. We observe that (1) Random Forest regression leads to multiple models performing similarly (CONCH, UNI, GigaPath) which may suggest a form of plateauing of patch encoders, (2) CONCH is the only model that shows high performance using both Ridge and Random Forest regression models, which could be attributed to its compact size (ViT-B) and visual-language fine-tuning step, and (3) performance remains low for some tasks (e.g., READ and HCC) which implies that for certain cancer types, the morphology might not be as reflective of gene expression, as well as leaving room for follow-up works.
6 HEST for discovery
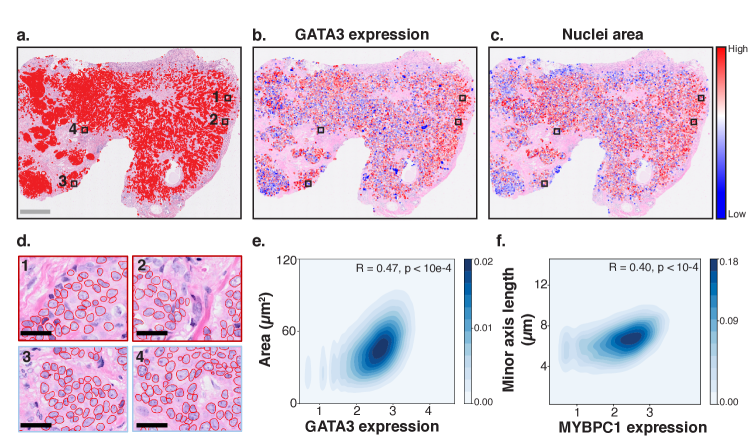
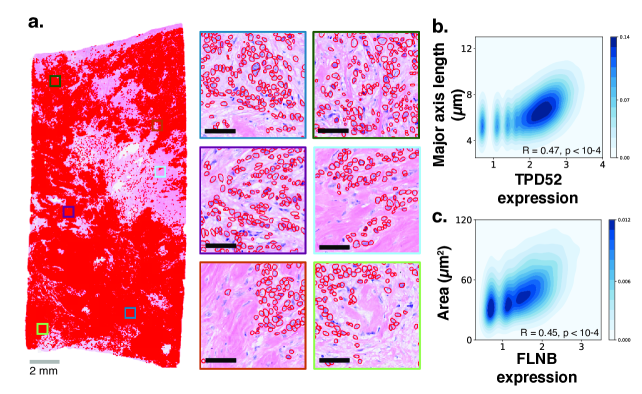
HEST-1k also enables the analysis of interactions and correlations between tissue morphology (as seen in H&E) and local gene expression (as provided in ST). Here, we showcase the capabilities of HEST-1k (1) by studying morphological correlates of expression changes in invasive breast cancer and (2) by visualizing tumor heterogeneity both on the morphological and molecular sides. Specifically, we focus on invasive ductal carcinoma (IDC) samples imaged with Xenium. Using CellViT nuclear segmentation and classification, we identified neoplastic nuclei (exemplified in two samples: Figure 2.a with n=168,033 nuclei and Appendix Figure 5.a with n=342,018 nuclei). We then overlay the WSI with the expression of specific genes, such as GATA3, a known prognostic gene in breast cancer Mehra et al. (2005)(Figure 2.b). This qualitatively shows that high GATA3 expression is associated with cancerous regions and reveals heterogeneity within invasive regions (e.g., the right-most region shows higher expression of GATA3 than the rest of the tumor, Figure 2.b). Using the nuclear segmentation, we can compute human-interpretable features related to nuclear size (area, perimeter, major axis length, minor axis length, and equivalent diameter), topology and shape (roundness, ellipticity, eccentricity, extent, and roughness), and cell distribution (cell density and crowdedness). A heatmap of the nuclear area of neoplastic cells also indicates morphological heterogeneity among neoplastic regions (Figure 2.c,d). Regions with a high nuclear area and elevated GATA3 expression notably overlap, suggesting that this tumor exhibits molecular heterogeneity, which to some degree is morphologically expressed.
To investigate this hypothesis, we measured the Pearson correlation between the expression of GATA3 and nuclear area in neoplastic cells (Figure 2.e). We observe a significant correlation (R=0.47), which is also observed in other genes and morphological features (Figure 2.f). Overall, out of the 12 human-interpretable features we analyzed, we found the highest association with gene expression for size-related features, while features involving topology, shape, and cell distribution had a lower correlation (R<0.2). A similar analysis in another IDC sample (Appendix Figure 5.b,c) confirmed these observations. In particular, we found the highest associations between nuclear size and expression for the genes FLNB (R=0.49) and TPD52 (R=0.49), both involved in breast tumor growth and proliferation Bandaru et al. (2014); Ren et al. (2021), and FOXA1 (R=0.47), a known prognostic factor associated with better survival Badve et al. (2007); Wolf et al. (2007).
Such analysis highlights how HEST-1k can be used for identifying fine-grained morphological correlates of expression. Additional analyses of morphological and molecular tumor heterogeneity can be leveraged at larger scale using similar approaches.
7 HEST for multimodal representation learning
Access to spatially-resolved expression–morphology pairs unlocks new directions for multimodal representation learning. Several problem statements can be explored, such as cross-modal alignment and retrieval, multimodal fusion, etc. Here, we fine-tune CONCH (strong performer on HEST-Benchmark) on five Xenium invasive breast cancer cases (four ductal and one lobular case) using contrastive alignment. We hypothesize that the resulting breast cancer-specific patch encoder, termed CONCH-FT, can better encode the underlying molecular landscape associated with disease-specific morphologies. To validate the hypothesis, CONCH-FT is benchmarked on an independent breast cancer cohort for molecular subtyping against its non-finetuned version.
For each Xenium sample, we extract 112112-m image patches centered around each spot at 20 magnification (0.5m/px). This yields 47,051 pairs of 224224-pixel patches and corresponding expression profile (n=238 common genes in the panel, log1p normalized). We then embed the data using modality-specific encoders: image patches using a ViT-Base initialized with CONCH weights, and expression using a 3-layer MLP. Modality-specific embeddings are then aligned using a contrastive objective, i.e., InfoNCE loss Oord et al. (2018). To mitigate over-fitting, we use the following training recipe: (1) Finetune only the last 3 layers of CONCH, (2) employ a layer-wise learning decay factor of 0.7, and (3) patch-level image augmentation. Detailed training recipes can be found in Appendix.
We evaluate the resulting CONCH-FT model to predict ER, PR, and HER2 expression status (binary) from WSIs in the BCNB dataset Xu et al. (2021) (n=1,058 WSIs). To generate a slide representation for a WSI, we take the average of the patch embedding in the WSI, which is subsequently mapped to the expression status using logistic regression (Table 2). We observe that CONCH-FT outperforms CONCH on most metrics, demonstrating that pan-tissue histology patch encoders can be further fine-tuned to obtain better tissue-specific patch encoders. This is further validated by the larger rank induced by the patch embedding space Garrido et al. (2023) for CONCH-FT, suggesting better expressivity of the patch embeddings. While these results are based on only five WSIs, we anticipate additional benefits when training with larger disease-specific cohorts.
| Rank | ER | PR | HER2 | ||||
| AUC | Bal.acc. | AUC | Bal.acc. | AUC | Bal.acc. | ||
| CONCH | 144.66 | 0.881 | 0.745 | 0.810 | 0.698 | 0.715 | |
| CONCH-FT | 0.615 | ||||||
8 Discussion
Summary. We assembled HEST-1k, a dataset comprising paired spatial transcriptomics, H&E-stained whole-slide images, and comprehensive metadata built from public and internal cohorts. HEST-1k includes 1,108 samples, encompassing 1.5 million spots and over 60 million cells. The scale and comprehensiveness of HEST-1k, supported by the HEST-Library, enable exploring directions such as biomarker discovery and multimodal representation learning. Additionally, motivated by the need for new diverse and challenging patch-level benchmarks, we curated the HEST-Benchmark, a set of ten tasks covering nine cancer types and ten organs for gene expression prediction from histology. HEST-Benchmark revealed new insights into the predictive capabilities of foundation models for histology, such as the added benefits of vision-language alignment Lu et al. (2024).
Limitations. Our study includes limitations. First, research data, such as those generated in spatial transcriptomic, are inherently noisy. While we tried to minimize “label” noise (e.g., by re-estimating image magnification and alignment, and unifying cancer samples using oncotree code taxonomy), staining and compression artifacts, varying acquisition protocols, among others can negatively impact the quality of HEST-1k. Second, batch effects (on both the imaging and transcriptomic sides) can be significant across samples, datasets, and technologies. This study does not quantify these batch effects or explore methods to mitigate them. Lastly, although the HEST-Library was designed for versatility, it cannot cover all existing formats and should rather be viewed as a blueprint for processing ST data in a consistent and unified manner.
Future work. Spatial transcriptomics is rapidly evolving with new datasets frequently published. As they become available, we will keep updating HEST-1k with new resources. This study merely starts to uncover the potential of HEST-1k for advancing translational research and biomarker discovery, and we plan to explore these capabilities further. Additionally, the prospects for multimodal representation learning with HEST-1k are promising and are expected to grow with the addition of more data.
Acknowledgements
We thank Dr. Maxime Meylan for his insights and guidance on accessing data published in Meylan et al. (2022). S.J.W. was supported by the Helmholtz Association under the joint research school “Munich School for Data Science - MUDS” and the Add-on Fellowship of the Joachim Herz Foundation.
Checklist
-
1.
Do the main claims made in the abstract and introduction accurately reflect the paper’s contributions and scope? [Yes] Each claim: HEST-1k, HEST-Library, HEST-Benchmark, HEST for discovery and multimodal fine-tuning are supported by dedicated sections in the main text, in addition to supplementary information provided in the appendix. In addition, all the code to reproduce results is made available.
-
2.
Did you describe the limitations of your work? [Yes] We discuss limitations in the Discussion.
-
3.
Did you discuss any potential negative societal impacts of your work? [Yes] We discuss potential negative societal impacts in the section Ethical considerations, intended usage, and license.
-
4.
Have you read the ethics review guidelines and ensured that your paper conforms to them? [Yes]
-
5.
Did you include the code, data, and instructions needed to reproduce the main experimental results (either in the supplemental material or as a URL)? [Yes] In the abstract, we provide a link to access the HEST website and the HEST-Library on GitHub. HEST-Library includes a link to download all data to run the HEST-Benchmark. Finally, we provide all metadata associated with HEST-1k in a CSV as part of the supplementary material. Processed ST and WSIs will be made available upon acceptance.
-
6.
Did you specify all the training details (e.g., data splits, hyperparameters, how they were chosen)? [Yes] When relevant, we provide training details, such as in the HEST-Benchmark.
-
7.
Did you report error bars? [Yes] HEST-Benchmark results include standard deviation computed from cross-validation across all patients.
-
8.
Did you include the total amount of compute and the type of resources used (e.g., type of GPUs, internal cluster, or cloud provider)? [Yes]
- 9.
-
10.
Did you mention the license of the assets? [Yes] Metadata associated with HEST-1k includes the license under which data were originally published. We ensured that the reported license allowed for distributing and creating derivatives of the data.
-
11.
Did you include any new assets either in the supplemental material or as a URL? [Yes] As part of HEST-1k, we include internal datasets (see Appendix Table A9).
-
12.
Did you discuss whether and how consent was obtained from people whose data you’re using/curating? [No] We used public resources for which the license was allowing redistributing the work. Users are welcome to inspect the individual IRBs of each publicly available resource.
-
13.
Did you discuss whether the data you are using/curating contains personally identifiable information or offensive content? [Yes] We manually ensured that none of the published and distributed data includes personally identifiable information or offensive content, such as personal health information.
Appendix A Ethical considerations, intended usage and license
All resources provided as part of this study are strictly for research purposes and must not be utilized to support any diagnostic procedures. Users are hereby notified that the nuclear segmentation and classification components are derived from a publicly available model. Consequently, this model should not be regarded as the definitive standard, and users should exercise particular caution when utilizing this part of the dataset. Despite our efforts to exclude sensitive information, such as patient names, addresses, and social security numbers, users are expressly prohibited from attempting to reverse engineer the data to extract any confidential patient information. On the presumption that users will adhere to the aforementioned restrictions, we have not identified any potential adverse societal impacts that could arise from using HEST-1k.
The dataset is hosted on HuggingFace Dataset webpage. All instructions are provided in the main README of HEST-Library. From there, users can choose to download HEST-1k in its entirety, or a subset (e.g., only breast cancer samples). HEST-1k, HEST-Benchmark, and HEST library are released under the Attribution-NonCommercial-ShareAlike 4.0 International license (CC BY-NC-SA 4.0 Deed)999https://creativecommons.org/licenses/by-nc-sa/4.0/.
Appendix B Background
This study connects two fields: (1) computational pathology, which primarily uses routinely acquired clinical data to determine outcomes such as disease diagnosis from H&E-stained digitized tissue sections, and (2) spatial transcriptomics, which has, so far, been confined to biological research and aims to identify new biomarkers predictive of disease progression or treatment response, among others.
B.1 Computational pathology
Research in computational pathology Song et al. (2023) has mainly centered on classifying digitized WSIs into clinical outcomes. Unlike natural image classification tasks such as ImageNet, a WSI may reach sizes of up to 150,000 150,000 pixels at 20 magnification (0.5m/pixel). The challenge of managing the large size of WSIs has been the main focus of the field, primarily through the adoption of multiple instance learning (MIL) for weakly-supervised classification. MIL employs a two-step process: (1) Initially, the tissue is segmented from the background and then tessellated into patches, usually 256 256 pixels, akin to an ImageNet sample, and each patch is compressed into a patch embedding using a pretrained patch encoder. (2) Subsequently, these patch embeddings are aggregated using a learnable neural network, such as an attention-based network, a graph neural network, or a Transformer, to produce a slide embedding Ilse et al. (2018); Shao et al. (2021); Lee et al. (2022). This slide embedding is then used to classify specific targets of interest, such as cancer histological subtyping, morphological subtyping, mutation prediction, or survival analysis.
Such frameworks have been shown to achieve better or similar performance than humans for Gleason grading in prostate cancerBulten et al. (2022), metastasis detection in lymph nodesBejnordi et al. (2017), determining the origin of a cancer of unknown primaryLu et al. (2021a), predicting heart transplant rejectionLipkova et al. (2022), among others.
B.2 Spatial Transcriptomics (ST)
ST enables the measurement of gene activity and the mapping to its corresponding location on the tissue. In this study, we gather samples from two ST paradigms: sequencing-based (ST, Visium, Visium HD) and imaging-based (Xenium).
Visium (HD) / Spatial Transcriptomics: Visium-HD and its predecessors Visium and Spatial Transcriptomics (ST) refer to a family of sequencing-based products for spatially resolved large transcript panels, whose main difference lies in the resolution and spacing between the expression measurement, called a spot. These spots capture mRNA from tissue sections placed on the chip, the location-specific barcodes contained in each of the spots bind to the RNA to retain spatial information. The RNA molecules are then washed off the slides and processed by a sequencing instrument. Using a sequencing-based method allows the reuse of existing sequencing instruments developed in the fields of single-cell and bulk transcriptomics, hence benefitting from existing technological advancements, and allowing whole transcriptome analysis. A fundamental drawback of current sequencing-based methods is the inherent RNA resolution limitation imposed by the size of the spots (from 55m to 2m).
Xenium: Xenium is an imaging-based spatial-profiling technology offering higher resolution compared to its sequencing counterpart, Visium. Xenium imaging-based paradigm breaks free from the resolution limitations of its sequencing-based counterpart, it directly performs in situ RNA capturing on tissue sections by imaging fluorescent RNA markers derived from padlock probes and rolling circle amplification chemistry, hence offering sub-cellular expression resolution. As of 2024, Xenium cannot perform whole transcriptome measurement and is limited to gene panels of up to 580 genes.
Appendix C HEST
C.1 HEST-1k
We provide a comprehensive description of all publicly available and internal cohorts integrated into HEST-1k.
| Resource | Number of datasets | Number of samples | Size (GB, raw) |
|---|---|---|---|
| 10x Genomics | 79 | 97 | 225 |
| Mendeley | 9 | 118 | 181 |
| Spatial-Research | 4 | 139 | 18 |
| Zenodo | 3 | 17 | 11 |
| NCBI | 42 | 677 | 265 |
| Internal | 3 | 28 | 60 |
| Miscellaneous | 2 | 32 | 65 |
| Collection name | Organ | Technology | Num. genes | |
|---|---|---|---|---|
| Adult Mouse Brain (FFPE) | Brain | Visium | 1 | 19,465 |
| Adult Mouse Brain Coronal Section (Fresh Frozen) 1 | Brain | Visium | 1 | 32,285 |
| Adult Mouse Brain Coronal Section (Fresh Frozen) 2 | Brain | Visium | 1 | 32,285 |
| Adult Mouse Kidney (FFPE) | Kidney | Visium | 1 | 19,465 |
| Adult Mouse Olfactory Bulb | Brain | Visium | 1 | 32,285 |
| FFPE Human Breast using the Entire Sample Area | Breast | Xenium | 2 | 541 |
| FFPE Human Breast with Custom Add-on Panel | Breast | Xenium | 2 | 541 |
| FFPE Human Breast with Pre-designed Panel | Breast | Xenium | 2 | 541 |
| FFPE Human Pancreas with Xenium Multimodal Cell Segmentation | Pancreas | Xenium | 1 | 541 |
| Fresh Frozen Mouse Colon with Xenium Multimodal Cell Segmentation | Bowel | Xenium | 1 | 541 |
| Fresh Frozen Visium on CytAssist: Human Breast Cancer, Probe-Based Whole Transcriptome Profiling | Breast | Visium | 1 | 18,085 |
| Fresh Frozen Visium on CytAssist: Mouse Brain, Probe-Based Whole Transcriptome Profiling | Brain | Visium | 1 | 19,465 |
| Human Bone and Bone Marrow Data with Custom Add-on Panel | Bone | Xenium | 3 | 541 |
| Human Brain Cancer, 11 mm Capture Area (FFPE) | Brain | Visium | 1 | 18,085 |
| Human Breast Cancer (Block A Section 1) | Breast | Visium | 1 | 33,538 |
| Human Breast Cancer (Block A Section 2) | Breast | Visium | 1 | 33,538 |
| Human Breast Cancer: Ductal Carcinoma In Situ, Invasive Carcinoma (FFPE) | Breast | Visium | 1 | 17,943 |
| Human Breast Cancer: Targeted, Immunology Panel | Breast | Visium | 1 | 1,056 |
| Human Breast Cancer: Visium Fresh Frozen, Whole Transcriptome | Breast | Visium | 1 | 36,601 |
| Human Breast Cancer: Whole Transcriptome Analysis | Breast | Visium | 1 | 32,285 |
| Human Cerebellum: Targeted, Neuroscience Panel | Brain | Visium | 1 | 1,186 |
| Human Cerebellum: Whole Transcriptome Analysis | Brain | Visium | 1 | 1,186 |
| Human Cervical Cancer (FFPE) | Cervix | Visium | 1 | 17,943 |
| Human Colon Preview Data (Xenium Human Colon Gene Expression Panel) | Bowel | Xenium | 2 | 541 |
| Human Colorectal Cancer, 11 mm Capture Area (FFPE) | Bowel | Visium | 1 | 18,085 |
| Human Colorectal Cancer: Targeted, Gene Signature Panel | Bowel | Visium | 1 | 1,142 |
| Human Colorectal Cancer: Whole Transcriptome Analysis | Bowel | Visium | 1 | 36,601 |
| Human Glioblastoma: Targeted, Pan-Cancer Panel | Brain | Visium | 1 | 1,253 |
| Human Glioblastoma: Whole Transcriptome Analysis | Brain | Visium | 1 | 36,601 |
| Human Heart | Heart | Visium | 1 | 36,601 |
| Human Heart Data with Xenium Human Multi-Tissue and Cancer Panel | Heart | Xenium | 1 | 541 |
| Human Intestine Cancer (FPPE) | Bowel | Visium | 1 | 17,943 |
| Human Kidney Preview Data (Xenium Human Multi-Tissue and Cancer Panel) | Kidney | Xenium | 2 | 541 |
| Human Kidney, 11 mm Capture Area (FFPE) | Kidney | Visium | 1 | 18,085 |
| Human Liver Data with Xenium Human Multi-Tissue and Cancer Panel | Liver | Xenium | 2 | 541 |
| Human Lung Cancer (FFPE) | Lung | Visium | 1 | 18,085 |
| Human Lung Cancer, 11 mm Capture Area (FFPE) | Lung | Visium | 1 | 18,085 |
| Human Lymph Node | Lymph node | Visium | 1 | 36,601 |
| Collection name | Organ | Technology | Num. genes | |
|---|---|---|---|---|
| Human Ovarian Cancer (FFPE) | Ovary | Visium | 1 | 17,943 |
| Human Ovarian Cancer, 11 mm Capture Area (FFPE) | Ovary | Visium | 1 | 18,085 |
| Human Prostate Cancer, Acinar Cell Carcinoma (FFPE) | Prostate | Visium | 1 | 17,943 |
| Human Prostate Cancer, Adenocarcinoma with Invasive Carcinoma (FFPE) | Prostate | Visium | 1 | 17,943 |
| Human Skin Data with Xenium Human Multi-Tissue and Cancer Panel | Skin | Xenium | 2 | 541 |
| Human Skin Preview Data (Xenium Human Skin Gene Expression Panel with Custom Add-On) | Skin | Xenium | 1 | 541 |
| Human Skin Preview Data (Xenium Human Skin Gene Expression Panel) | Skin | Xenium | 1 | 541 |
| Human Tonsil Data with Xenium Human Multi-Tissue and Cancer Panel | Lymph node | Xenium | 2 | 541 |
| Mouse Bone Data with Custom Add-on Panel | Bone | Xenium | 3 | 541 |
| Mouse Brain Coronal Section 1 (FFPE) | Brain | Visium | 1 | 19,465 |
| Mouse Brain Coronal Section 2 (FFPE) | Brain | Visium | 1 | 19,465 |
| Mouse Brain Section (Coronal) | Brain | Visium | 1 | 31,053 |
| Mouse Brain Serial Section 1 (Sagittal-Anterior) | Brain | Visium | 1 | 31,053 |
| Mouse Brain Serial Section 1 (Sagittal-Posterior) | Brain | Visium | 1 | 31,053 |
| Mouse Brain Serial Section 2 (Sagittal-Anterior) | Brain | Visium | 1 | 31,053 |
| Mouse Brain Serial Section 2 (Sagittal-Posterior) | Brain | Visium | 1 | 31,053 |
| Mouse Embryo, 11 mm Capture Area (FFPE) | Embryo | Visium | 1 | 19,465 |
| Mouse Kidney Section (Coronal) | Kidney | Visium | 1 | 31,053 |
| Mouse Tissue Microarray in 3x3 Layout with 1 mm Edge to Edge Spacing (FFPE) | Lung/Brain | Visium | 1 | 19,465 |
| Mouse Tissue Microarray in 3x3 Layout with 2 mm Edge to Edge Spacing (FFPE) | Lung/Brain | Visium | 1 | 19,465 |
| Mouse Tissue Microarray in 5x5 Layout with 1 mm Edge to Edge Spacing (FFPE) | Kidney/Brain | Visium | 1 | 19,465 |
| Normal Human Prostate (FFPE) | Prostate | Visium | 1 | 17943 |
| Pancreatic Cancer with Xenium Human Multi-Tissue and Cancer Panel | Pancreas | Xenium | 1 | 538 |
| Preservation Method Comparison on CytAssist: FFPE Mouse Brain (Sagittal), 11 mm Capture Area | Brain | Visium | 1 | 19,465 |
| Preservation Method Comparison on CytAssist: Fixed Frozen Mouse Brain (Sagittal), 11 mm Capture Area | Brain | Visium | 1 | 19,465 |
| Preservation Method Comparison on CytAssist: Fresh Frozen Mouse Brain (Sagittal), 11 mm Capture Area | Brain | Visium | 1 | 19,465 |
| Preservation Method Comparison on Visium CytAssist: FFPE Mouse Brain (Sagittal), 11 mm Capture Area | Brain | Visium | 1 | 19,465 |
| Preservation Method Comparison on Visium CytAssist: Fixed Frozen Mouse Brain (Sagittal), 11 mm Capture Area | Brain | Visium | 1 | 19,465 |
| Preservation Method Comparison on Visium CytAssist: Fresh Frozen Mouse Brain (Sagittal), 11 mm Capture Area | Brain | Visium | 1 | 19,465 |
| Preview Data: FFPE Human Lung Cancer with Xenium Multimodal Cell Segmentation | Lung | Xenium | 1 | 541 |
| Visium CytAssist Gene Expression Libraries of Post-Xenium Human Colon Cancer (FFPE) | Bowel | Visium | 4 | 18,085 |
| Visium CytAssist Gene Expression Libraries of Post-Xenium Mouse Brain (FF) | Brain | Visium | 4 | 19,465 |
| Visium CytAssist, Mouse Embryo, 11 mm Capture Area (FFPE) | Embryo | Visium | 1 | 19,465 |
| Whole Mouse Pup Preview Data (Xenium Mouse Tissue Atlassing Panel) | Whole organism | Xenium | 1 | 541 |
| Publication | Organ | Technology | Num. genes | |
|---|---|---|---|---|
| 10X Visium Spatial transcriptomics of murine colon at d14 (mucosa healing) in B cell sufficient-deficient mice Parigi et al. (2022) | Bowel | Visium | 2 | 31,053 |
| 10X Visium Spatial transcriptomics of murine colon in steady state and during recovery after DSS colitis Parigi et al. (2022) | Bowel | Visium | 2 | 31,053 |
| A Spatial Transcriptomic atlas of the human kidney papilla identifies significant immune injury in patients with stone disease Canela et al. (2023) | Kidney | Visium | 7 | 36,601 |
| A cellular hierarchy in melanoma uncouples growth and metastasis Karras et al. (2022) | Skin | Visium | 3 | 31,053 |
| A new epithelial cell subpopulation predicts response to surgery, chemotherapy, and immunotherapy in bladder cancer Abdel-Hafiz et al. (2023); Gouin et al. (2021) | Bladder | Visium | 4 | 33,538 |
| A novel model of binge ethanol exposure reveals enhanced neurodegeneration with advanced age Anton et al. (2024) | Brain | Visium | 4 | 32,285 |
| A single-cell transcriptomic analysis of endometriosis Fonseca et al. (2023) | Uterus | Visium | 2 | 36,601 |
| Distinct mesenchymal cell states mediate prostate cancer progression Pakula et al. (2024) | Prostate | Visium | 2 | 32,589 |
| Epithelial Plasticity and Innate Immune Activation Promote Lung Tissue Remodeling following Respiratory Viral Infection Beppu et al. (2023) | Lung | Visium | 1 | 32,285 |
| Gene expression within a human choroidal neovascular membrane using spatial transcriptomics Voigt et al. (2023) | Eye | Visium | 5 | 36,601 |
| Genome-wide Spatial Expression Profiling in Formalin-fixed Tissues Gracia Villacampa et al. (2021) | Kidney | Visium | 14 | 33,538 |
| High resolution mapping of the tumor microenvironment using integrated single-cell, spatial and in situ analysis Janesick et al. (2023) | Breast | Xenium | 4 | 541 |
| Identification of TREM1+CD163+ myeloid cells as a deleterious immune subset in HCC Giraud et al. (2022) | Liver | Visium | 2 | 36,601 |
| Integration of spatial and single cell transcriptomics localizes epithelial-immune cross-talk in kidney injury Ferreira et al. (2021) | Kidney | Visium | 4 | 33,538 |
| Molecular Atlas of the Adult Mouse Brain Ortiz et al. (2020) | Brain | Spatial Transcriptomics | 75 | 23,371 |
| Regional differential gene expression analyses of brains from four 24w-old Nf1+- mice | Brain | Visium | 4 | 32,285 |
| SARS-CoV-2 Niches in Human Placenta Revealed by Spatial Transcriptomics Barrozo et al. (2023) | Uterus | Visium | 16 | 36,612 |
| Schwann Cells Shape Tumor Cells and Cancer-Associated Fibroblasts in the Pancreatic Ductal Adenocarcinoma Microenvironment Xue et al. (2023) | Pancreas | Visium | 4 | 20,615 |
| Single Cell and Spatial Analysis of Human Squamous Cell Carcinoma Ji et al. (2020) | Skin | Spatial Transcriptomics | 12 | 17,138 |
| Single cell profiling of primary and paired metastatic lymph node tumors in breast cancer patients Liu et al. (2022) | Lymph node | Visium | 4 | 33,931 |
| Publication | Organ | Technology | Num. genes | |
|---|---|---|---|---|
| Single-cell and spatial transcriptomics characterisation of the immunological landscape in the healthy and PSC human liver Andrews et al. (2024) | Liver | Visium | 4 | 36,601 |
| Single-nucleus Ribonucleic Acid-sequencing and Spatial Transcriptomics Reveal the Cardioprotection of Shexiang Baoxin Pill (MUSKARDIA) in Mice with Myocardial Ischemia-Reperfusion Injury Lin et al. (2023) | Heart | Visium | 2 | 32,285 |
| Spatial Multimodal Analysis: MALDI-MSI and Spatial Transcriptomics within the same tissue section Vicari et al. (2023) | Brain | Visium | 19 | 32,285 |
| Spatial RNA sequencing of regenerating mouse hindlimb muscle McKellar et al. (2021) | Muscle | Visium | 3 | 33,217 |
| Spatial Total RNA-Sequencing of regenerating mouse hindlimb muscle and Type 1-Lang reovirus-infected mouse heart McKellar et al. (2023) | Muscle | Visium | 7 | 55,414 |
| Spatial localization with Spatial Transcriptomics for an atlas of healthy and injured cell states and niches in the human kidney Lake et al. (2023) | Kidney | Visium | 23 | 33,538 |
| Spatial sequencing of Foreign body granuloma Krausgruber et al. (2023) | None | Visium | 1 | 15,524 |
| Spatial transcriptomics landscape of non-communicable inflammatory skin diseases Schäbitz et al. (2022) | Skin | Visium | 59 | 20,613 |
| Spatial transcriptomics of adenoid cystic carcinoma of the lacrimal gland Moeyersoms et al. (2023) | Eye | Visium | 1 | 17,943 |
| Spatial transcriptomics of the mouse brain across three age groups | Brain | Visium | 6 | 32,285 |
| Spatial transcriptomics reveal unnresolved wound repair as potential driver of PFA Ependymoma progression Fu et al. (2023) | Brain | Visium | 14 | 36,601 |
| Spatiotemporal dynamics of molecular pathology in amyotrophic lateral sclerosis Silas Maniatis et al. (2019) | Spinal cord | Spatial Transcriptomics | 302 | 12,572 |
| The neurons that restore walking after paralysis Kathe et al. (2022) | Spinal cord | Visium | 16 | 22,127 |
| Visium spatial transcriptomics analysis of lacrimal gland during chronic inflammation progression Mauduit et al. (2022) | Eye | Visium | 4 | 32,285 |
| YAP Drives Assembly of a Spatially Colocalized Cellular Triad Required for Heart Renewal Li et al. (2024) | Heart | Visium | 2 | 32,285 |
| Zika virus co-opts miRNA networks to persist in placental microenvironments detected by spatial transcriptomics Barrozo et al. (2024) | Placenta | Visium | 8 | 32,298 |
| Mouse model Heptablastoma spatial transcriptomics Pilet et al. (2023) | Liver | Visium | 10 | 31,053 |
| Publication | Organ | Technology | Num. genes | |
|---|---|---|---|---|
| A spatiotemporal organ-wide gene expression and cell atlas of the developing human heart Asp et al. (2019) | Heart | Spatial Transcriptomics | 19 | 39,739 |
| Integrating spatial gene expression and breast tumour morphology via deep learning He et al. (2020) | Breast | Spatial Transcriptomics | 68 | 16,744 |
| Spatial deconvolution of HER2-positive breast cancer delineates tumor-associated cell type interactions Andersson et al. (2021) | Breast | Spatial Transcriptomics | 36 | 15,045 |
| Visualization and analysis of gene expression in tissue sections by spatial transcriptomics Ståhl et al. (2016a) | Brain | Spatial Transcriptomics | 16 | 16,573 |
| Publication | Organ | Technology | Num. genes | |
|---|---|---|---|---|
| Ex-ST Andrusivova and Fan (2023) | Brain | Visium | 5 | 31,053 |
| Genome-wide spatial expression profiling in formalin-fixed tissues Villacampa et al. (2021) | Brain | Visium | 15 | 31,053 |
| Human ileum, Visium Mirzazadeh et al. (2021) | Bowel | Visium | 4 | 33,538 |
| Human squamous cell carcinoma Abalo et al. (2021) | Skin | Visium | 4 | 33,538 |
| Prostate needle biopsies pre- and post-ADT: Count matrices, histological-, and Androgen receptor immunohistochemistry images Marklund (2022) | Prostate | Spatial Transcriptomics | 24 | 26,437 |
| Spatially resolved clonal copy number alterations in benign and malignant tissue Erickson et al. (2022) | Prostate | Visium | 23 | 33,538 |
| Spatially resolved transcriptomic profiling of degraded Mirzazadeh et al. (2023) | Bowel | Visium | 35 | 17,943 |
| spatialRNAseq heart raw suppdata | Heart | Visium | 4 | 54,848 |
| spatialRNAseq ileum raw suppdata | Bowel | Visium | 4 | 54,848 |
| Publication | Organ | Technology | Num. genes | |
|---|---|---|---|---|
| Transcriptome-scale spatial gene expression in the human dorsolateral prefrontal cortexMaynard et al. (2021) | Brain | Visium | 12 | 33,538 |
| A spatially resolved atlas of the human lung characterizes a gland-associated immune nicheMadissoon et al. (2023) | Lung | Visium | 20 | 17,922 |
| Publication | Organ | Technology | Num. genes | |
|---|---|---|---|---|
| Prostate ST Internal | Prostate | Visium | 4 | 17,943 |
| Tertiary lymphoid structures generate and propagate anti-tumor antibody-producing plasma cells in renal cell cancer Meylan et al. (2022) | Lymph node | Visium | 24 | 17,943 |
| Publication | Organ | Technology | Num. genes | |
|---|---|---|---|---|
| Charting the Heterogeneity of Colorectal Cancer Consensus Molecular Subtypes using Spatial Transcriptomics: datasets Valdeolivas et al. (2023) | Bowel | Visium | 14 | 36,601 |
| Demo 10x Visium dataset for STQ zen (2024a) | Skin | Visium | 1 | 68,886 |
| Spotiphy: generative modeling in single-cell spatial whole transcriptomics zen (2024b) | Brain | Visium | 2 | 32,285 |
C.2 HEST-Library
The HEST-Library helps transform unstructured spatial transcriptomics and histology data into a unified format. An overview of the HEST-Library is provided in Suppl. Figure 3. An example of fiducial detection is presented in Suppl. Figure 4.
C.3 HEST-Benchmark
Gene selection, Random Forest, and Ridge regression models: We learn a regression model that maps the patch embeddings of each encoder to its corresponding gene expression profile. The Random Forest model is based on 70 trees (sklearn implementation). The Ridge regression uses a fixed regularization coefficient to , where is the embedding dimension and is the number of targets trained with the Regularized Least-Squares Routine solver (sklearn implementation). We train the regression models to predict a panel of 50 most variable genes tailored to each task. Specifically, for each task, we select the 50 most variable genes across all spots and samples, after excluding the genes that have non-zero counts in less than 10% of the spots.
Benchmark task description: We provide complementary information on each task introduced as part of the HEST-Benchmark.
| Task ID | Oncotree | Organ | Number of Patients | Number of Samples | Technology |
|---|---|---|---|---|---|
| Task 1 Janesick et al. (2023) | IDC | Breast | 4 | 4 | Xenium |
| Task 2 | PRAD | Prostate | 2 | 23 | Visium |
| Task 3 | PAAD | Pancreas | 3 | 3 | Xenium |
| Task 4 | SKCM | Skin | 2 | 2 | Xenium |
| Task 5 Valdeolivas et al. (2023) | COAD | Colon | 3 | 6 | Visium |
| Task 6 Valdeolivas et al. (2023) | READ | Rectum | 2 | 4 | Visium |
| Task 7 Meylan et al. (2022) | ccRCC | Kidney | 24 | 24 | Visium |
| Task 8 Giraud et al. (2022) | HCC | Liver | 2 | 2 | Visium |
| Task 9 | LUAD | Lung | 2 | 2 | Xenium |
| Task 10 Liu et al. (2022) | IDC | Axillary lymph nodes | 4 | 4 | Visium |
Task 1: Expression prediction in invasive ductal carcinoma (breast cancer, IDC). We used all publicly available Xenium samples available on 10x Genomics (“FFPE Human Breast using the Entire Sample Area”, 2 patients) and two samples published in Janesick et al. (2023) (2 patients). All samples are FFPE sections imaged with the Xenium pipeline v1.
Task 2: Expression prediction in prostate adenocarcinoma (prostate cancer, PRAD). We used all 23 Visium samples (fresh frozen sections) from 2 patients published in Erickson et al. (2022). Both patients were diagnosed with prostatic acinar adenocarcinoma with a (4+3) Gleason score (ISUP group 4).
Task 3: Expression prediction in pancreatic adenocarcinoma (pancreatic cancer, PAAD). We used 3 samples from 3 different patients from 10x Genomics (“FFPE Human Pancreas with Xenium Multimodal Cell Segmentation” and “Pancreatic Cancer with Xenium Human Multi-Tissue and Cancer Panel”). All samples are FFPE sections processed with Xenium pipeline v1.
Task 4: Expression prediction in skin cutaneous melanoma (skin cancer, SKCM). We used 2 samples from 2 different patients from 10x Genomics website (“Human Skin Data with Xenium Human Multi-Tissue and Cancer Panel”). All samples are FFPE sections processed with Xenium pipeline v1.
Task 5: Expression prediction in colon adenocarcinoma (colon cancer, COAD). We used 6 COAD samples from 3 different patients published in Valdeolivas et al. (2023). All samples are fresh frozen sections processed with Visium.
Task 6: Expression prediction in rectal adenocarcinoma (rectum cancer, READ). We used 4 READ samples from different 2 patients published in Valdeolivas et al. (2023). All samples are fresh frozen sections processed with Visium.
Task 7: Expression prediction in clear cell renal cell carcinoma (kidney cancer, ccRCC). We used all 24 ccRCC samples from 24 different patients published in Meylan et al. (2022). All samples are fresh frozen sections processed with Visium.
Task 8: Expression prediction in hepatocellular carcinoma (liver cancer, HCC). We used 2 HCC liver samples from 2 different patients published in Giraud et al. (2022). All samples are fresh frozen sections processed with Visium.
Task 9: Expression prediction in lung adenocarcinoma (lung cancer, LUAD). We used 2 LUAD samples from 2 different patients from 10x genomics (“Preview Data: FFPE Human Lung Cancer with Xenium Multimodal Cell Segmentation”). All samples are fresh frozen sections processed with Xenium pipeline v1.
Task 10: Expression prediction in axillary lymph nodes in IDC patients. We used 4 axillary lymph node samples from 2 IDC patients published in Liu et al. (2022). All samples are fresh frozen sections processed with Visium.
| Name | Number of | Number of | Magnification | Model | Training |
|---|---|---|---|---|---|
| slides | patches | recipe | |||
| ResNet50-IN Lu et al. (2021b) | N/A | 1M | N/A | ResNet-50 | Supervised |
| KimiaNet Riasatian et al. (2021) | 7K | 240K | 20x | ResNet-18 | Supervised |
| Ciga Ciga et al. (2022) | UNK | UNK | 10x, 20x | ResNet-50 | Supervised |
| CTransPath Wang et al. (2021) | 32k | 17M | 10x | UNK | MoCov2 |
| Remedis Azizi et al. (2023) | 10 | 10M | 20x | ResNet-152 | iBOT |
| Phikon Filiot et al. (2023) | 6k | 43.3M | 20x | ViT-B | iBOT |
| PLIP Huang et al. (2023) | N/A | 800k | Many | ViT-B | CLIP |
| UNI Chen et al. (2024) | 100k | 100M | 20x | ViT-L | DINOv2 |
| CONCH Lu et al. (2024) | N/A | 1.17M | Many | ViT-B | CoCa |
| GigaPath Xu et al. (2024) | 171k | 1.3B | 20x | ViT-G | CoCa |
We provide a brief description of each patch encoder assessed on the HEST-Benchmark.
ResNet50 (IN) Lu et al. (2020): This model uses a ResNet50 backbone He et al. (2016) trained on ImageNet dataset Deng et al. (2009). Following prior work Lu et al. (2020), the patch embedding corresponds to the deep representation at the penultimate layer before classification.
Ciga Ciga et al. (2022): This model uses a ResNet-50 backbone He et al. (2016) trained on public histology datasets such as TCGA and Cameleyon16 using SimCLR.
CTransPath Wang et al. (2022): This model uses a “Tiny” Swin Transformer backbone Liu et al. (2021) with a window size of 14 (Swin-T/14, 28 million parameters) pretrained on TCGA and PAIP datasets (17 million images) using MoCoV3 Chen et al. (2021).
Remedis Azizi et al. (2023): This model uses a ResNet-1522 (232 million parameters) initialized with the “Big Transfer”-medium protocol Kolesnikov et al. (2020) on ImageNet-22K and pretrained with SimCLR Chen et al. (2020) on TCGA.
Phikon Filiot et al. (2023): This model uses a Vision Transformer-Base (ViT-B, 86 million parameters) Dosovitskiy et al. (2021) trained on TCGA data using iBOT Zhou et al. (2022).
PLIP Huang et al. (2023): This model uses a ViT-B (86 million parameters) trained on 208 thousand pathology images paired with natural language descriptions extracted from Twitter and trained using CLIP Radford et al. (2021).
UNI Chen et al. (2024): This model uses a ViT-Large (ViT-L, 307 million parameters) Dosovitskiy et al. (2021) trained on 100 million histology images (over 100,000 slides) from proprietary and public data using DINOv2 Oquab et al. (2023).
CONCH Lu et al. (2024): This model uses a ViT-B (86 million parameters) trained on 1.17 million histology image–caption pairs extracted from online educational and research resources using CoCa Yu et al. (2022).
GigaPath Xu et al. (2024): This model uses a ViT-Giant (1.13 billion parameters) trained on 1.3 billion image patches from 171,189 WSIs at 20 magnification using DINOv2.
Appendix D HEST for multimodal representation learning
CONCH-FT model, a ViT-Base model initialized with CONCH weights, was fine-tuned for 50 epochs using a cosine learning rate scheduler, with a base learning rate of for the image encoder and for the expression encoder. Only the last 3 layers of the model were fine-tuned, with a layer-wise learning decay rate of 0.7. For training with the infoNCE loss, a contrastive temperature of and batch size of 1,024 pairs of patch and transcriptomics were used. A combination of random horizontal/vertical flip and color jittering was employed for image patch augmentation.
The rank of the embedding space, also referred to as smooth rank measure Garrido et al. (2023), measures the quality of the embeddings produced from encoders trained in unsupervised or self-supervised manners. Given the patch embedding matrix and , where is the number of patches and is the feature dimension, we compute the rank as the entropy of the L1-normalized singular values of .
Appendix E HEST for discovery
Cells were segmented and classified using CellViT Hörst et al. (2024). To find the gene expression profile of each neoplastic cell, we matched each cell to its corresponding cell index in Xenium by assigning the index for which the distance between the cell centroids was the smallest. After matching all neoplastic cells, only those cells for which the assignment was unique were kept. After this filtering step, an average of 91% of the cells per sample were kept while 9% of the cells were discarded. The discarded cells likely correspond to over-segmentation errors by CellViT.
Appendix F Datasheet for HEST-1k
We provide a DataSheet for HEST-1k that summarizes the contributions, analyses, and intended usages presented in the study.
F.1 Motivation for dataset creation
-
•
Why was the dataset created? HEST-1k was designed with three key applications: (1) multimodal representation learning of histology and transcriptomics, (2) biomarker discovery, and (3) benchmarking of histopathology patch encoder models. Despite many publicly available resources, no existing unified and user-friendly formatting was available to bring ST in the world of deep learning.
-
•
What (other) tasks could the dataset be used for? Are there obvious tasks for which it should not be used? Users are welcome to propose new creative ways to use the dataset. Users are not allowed to try to retrieve patient information from the existing data. A dedicated section is allocated to discuss ethical considerations and intended usage.
-
•
Has the dataset been used for any tasks already? If so, where are the results so others can compare (e.g., links to published papers)? All samples that were made public as part of a publication (peer-review or not) are reported in the metadata attached with HEST-1k.
-
•
Who funded the creation of the dataset? The work was funded by an R35 grant.
F.2 Dataset composition
-
•
What are the instances? The modalities used in this study are histopathology whole-slide images, gene expression data, and derivatives of these two modalities, such as nuclear segmentation maps.
-
•
Are relationships between instances made explicit in the data Each whole-slide image maps to a unique gene expression profile in an unequivocal way.
-
•
What data does each instance consist of? Imaging data consists of Generic TIFF objects stored in pyramidal format, and gene expression data consists of scanpy objects. Derivatives are stored in JSON and Hierarchical Data Format (HDF) files.
-
•
Is there a label/target associated with instances? If the instances are related to people, are subpopulations identified (e.g., by age, gender, etc.), and what is their distribution? Each sample pair (slide and expression profile) is associated with comprehensive metadata. All metadata information is thoroughly described in the main paper. Age and gender are only reported in a subset of cases.
-
•
Is everything included or does the data rely on external resources? (e.g., websites, tweets, datasets) If external resources, a) are there guarantees that they will exist, and remain constant, over time; b) is there an official archival version. Are there licenses, fees or rights associated with any of the data? We provide all data as part of HEST-1k release. In addition, a link to the original data is provided in the metadata. Each sample is associated with a license as provided by the original publication, where we ensured that the reported license allowed for distributing and creating derivatives of the data. Should the author of the original publication would like to remove their samples from HEST-1k, we will update the data promptly.
-
•
Are there recommended data splits or evaluation measures? HEST-1k comes with the HEST-Benchmark, a series of tasks for gene expression prediction from histology images. All patient-stratified splits are specified in the attached comma-separated values (CSV) files.
-
•
What experiments were initially run on this dataset? Have a summary of those results and, if available, provide the link to a paper with more information here. At the time of submission, all experiments run with HEST-1k are part of this study. The reader can refer to the main text for a thorough description of all experiments (see HEST-Benchmark, HEST for discovery, HEST for multimodal representation learning).
F.3 Data collection process
-
•
How was the data collected? The data were manually inspected and curated by the authors of the present study.
-
•
Who was involved in the data collection process? All authors of the present study were involved in the data collection, inspection, and curation. The reader can refer to the original publication to understand how the data were orginally acquired.
-
•
Over what time-frame was the data collected? Does the collection time-frame match the creation time-frame? The original data comprise publications from 2016 to 2024. As the dataset grows, more recent publications might be included in HEST-1k.
-
•
Does the dataset contain all possible instances? Or is it, for instance, a sample (not necessarily random) from a larger set of instances? All pairs of gene expression data and whole-slide images of the underlying studies were included and are unique.
-
•
Is there information missing from the dataset and why? (this does not include intentionally dropped instances; it might include, e.g., redacted text, and withheld documents) Is this data missing because it was unavailable? Original publications include some missing information, such as the alignment file between the slide and the expression profile. We developed computational tools to minimize missing information to reach near-complete metadata.
-
•
Are there any known errors, sources of noise, or redundancies in the data? All whole-slide images have been manually inspected. The quality from one sample to another varies significantly, for instance, due to poor staining, compression artifact, lower resolution, etc. Gene expression data are inherently noisy. Users can decide to apply post-hoc normalization methods to reduce noise.
F.4 Data preprocessing
-
•
What preprocessing/cleaning was done? All whole-slide images were converted into a pyramidal TIFF objects with re-estimated pixel resolution. All alignment files have been manually inspected and included if missing. All gene expression data have been transformed into scanpy objects following the same process.
-
•
Was the “raw” data saved in addition to the preprocessed/cleaned data? (e.g., to support unanticipated future uses) Raw data are downloaded, but not publicly shared. In the case of public samples, users can re-download them using the metadata provided as part of the dataset release.
-
•
Is the preprocessing software available? Yes, the source code to preprocess HEST-1k is made publicly available as part of the HEST library.
F.5 Dataset distribution
-
•
How is the dataset distributed? HEST-1k is distributed using internal storage. We have several internal copies to ensure data preservation over the years.
-
•
When will the dataset be released/first distributed? The dataset will be made public with the camera-ready version of this publication. This study serves as the canonical reference.
-
•
What license (if any) is it distributed under? Are there any copyrights on the data? The dataset is distributed under the Attribution-NonCommercial-ShareAlike 4.0 International license (CC BY-NC-SA 4.0 Deed).
-
•
Are there any fees or access/export restrictions? No access/export restrictions unless they violates the terms of the above-mentioned license (CC BY-NC-SA 4.0 Deed).
-
•
Who is supporting/hosting/maintaining the dataset? How does one contact the owner/curator/manager of the dataset? The dataset is maintained by the authors of the publication.
-
•
Will the dataset be updated? How often and by whom? How will updates/revisions be documented and communicated (e.g., mailing list, GitHub)? Is there an erratum? The dataset might evolve as additional samples become publicly available. Dataset versioning will be put in place. A website will clearly state what the latest version of the dataset contains and keep track of the changes in each version.
-
•
If the dataset becomes obsolete how will this be communicated? The corresponding website will state if the dataset becomes obsolete.
-
•
Is there a repository to link to any/all papers/systems that use this dataset? There is no repository to link papers that use HEST-1k. Users are required to cite HEST-1k if they use it in their own research.
-
•
If others want to extend/augment/build on this dataset, is there a mechanism for them to do so? If so, is there a process for tracking/assessing the quality of those contributions. What is the process for communicating/distributing these contributions to users? Users are welcome to contact us if they would like to provide additional data that meet the standards of the data contained in HEST-1k. We do not have a dedicated system to communicate these contributions. Newly added data will be tracked in the versioning.
F.6 Legal and ethical considerations
-
•
If the dataset relates to people (e.g., their attributes) or was generated by people, were they informed about the data collection? (e.g., datasets that collect writing, photos, interactions, transactions, etc.) HEST-1k does not include patient information (such as name, address, etc.).
-
•
If it relates to other ethically protected subjects, have appropriate obligations been met? (e.g., medical data might include information collected from animals) For animal samples (Mus musculus tissue), we refer to the original publication for an in-depth analysis.
-
•
If it relates to people, were there any ethical review applications/reviews/approvals? (e.g. Institutional Review Board applications) For human tissue, we refer to the original publication for an in-depth analysis. Internal cohorts were ethically reviewed and collected as part of dedicated IRBs.
-
•
If it relates to people, could this dataset expose people to harm or legal action? (e.g., financial social or otherwise) What was done to mitigate or reduce the potential for harm? No, patients cannot be linked to the corresponding histology and gene expression profile.
-
•
If it relates to people, does it unfairly advantage or disadvantage a particular social group? In what ways? How was this mitigated? Most datasets do not include specific demographics. When reported, we include this information in the metadata associated with each sample. To our knowledge, the representation of HEST-1k does not unfairly advantage or disadvantage a particular social group.
-
•
Does the dataset contain information that might be considered sensitive or confidential? (e.g., personally identifying information) No.
-
•
Does the dataset contain information that might be considered inappropriate or offensive? No.
Appendix G Author statement
The authors of this paper bear all responsibility in case of violation of rights associated with HEST-1k, HEST-Library, and HEST-Benchmark.
| ResNet50 | KimiaNet | Ciga | CTransPath | Remedis | Phikon | PLIP | UNI | CONCH | Gigapath | |
|---|---|---|---|---|---|---|---|---|---|---|
| IDC | 0.446 | 0.455 | 0.425 | 0.499 | 0.496 | 0.526 | 0.450 | 0.541 | ||
| PRAD | 0.276 | 0.323 | 0.258 | 0.264 | 0.249 | 0.262 | 0.257 | 0.301 | ||
| PAAD | 0.343 | 0.374 | 0.364 | 0.288 | 0.360 | 0.358 | 0.377 | 0.323 | ||
| SKCM | 0.357 | 0.381 | 0.404 | 0.412 | 0.369 | 0.337 | 0.343 | 0.190 | ||
| COAD | 0.103 | 0.093 | 0.113 | 0.075 | 0.114 | 0.108 | 0.110 | 0.085 | ||
| READ | 0.067 | 0.058 | 0.081 | 0.090 | 0.077 | 0.114 | 0.084 | 0.124 | ||
| 0.05 | ||||||||||
| ccRCC | 0.210 | 0.190 | 0.180 | 0.214 | 0.219 | 0.174 | 0.221 | 0.226 | ||
| HCC | 0.031 | 0.027 | 0.024 | 0.016 | 0.038 | 0.032 | 0.017 | 0.008 | ||
| LUAD | 0.400 | 0.419 | 0.417 | 0.403 | 0.311 | 0.406 | 0.371 | 0.297 | ||
| LYM-IDC | 0.203 | 0.227 | 0.218 | 0.209 | 0.167 | 0.215 | 0.215 | 0.224 | 0.191 | |
| Average | 0.251 | 0.253 | 0.244 | 0.263 | 0.232 | 0.266 | 0.243 | 0.260 | 0.229 |
References
- zen [2024a] Demo 10x Visium dataset for STQ, February 2024a. [Online; accessed 16. May 2024].
- zen [2024b] Spotiphy: generative modeling in single-cell spatial whole transcriptomics, January 2024b. [Online; accessed 16. May 2024].
- Abalo et al. [2021] Xesús Abalo, Kim Thrane, Andrew Lin Ji, Reza Mirzazadeh, Paul Khavari, and Joakim Lundeberg. Human squamous cell carcinoma, visium, 2021. URL https://data.mendeley.com/datasets/2bh5fchcv6/1.
- Abdel-Hafiz et al. [2023] H. A. Abdel-Hafiz, J. M. Schafer, X. Chen, T. Xiao, et al. Y chromosome loss in cancer drives growth by evasion of adaptive immunity. Nature, 619(7970):624–631, 2023. doi: 10.1038/s41586-023-06083-w.
- Alsaafin et al. [2023] Areej Alsaafin, Amir Safarpoor, Milad Sikaroudi, Jason D Hipp, and HR Tizhoosh. Learning to predict rna sequence expressions from whole slide images with applications for search and classification. Communications Biology, 6(1):304, 2023.
- Andersson et al. [2021] Alma Andersson, Ludvig Larsson, Linnea Stenbeck, Fredrik Salmén, Anna Ehinger, Sunny Z. Wu, Ghamdan Al-Eryani, Daniel Roden, Alex Swarbrick, Åke Borg, Jonas Frisén, Camilla Engblom, and Joakim Lundeberg. Spatial deconvolution of HER2-positive breast cancer delineates tumor-associated cell type interactions. Nat. Commun., 12(6012):1–14, October 2021. ISSN 2041-1723. doi: 10.1038/s41467-021-26271-2.
- Andrews et al. [2024] Tallulah S. Andrews, Diana Nakib, Catia T. Perciani, Xue Zhong Ma, Lewis Liu, Erin Winter, Damra Camat, Sai W. Chung, Patricia Lumanto, Justin Manuel, Shantel Mangroo, Bettina Hansen, Bal Arpinder, Cornelia Thoeni, Blayne Sayed, Jordan Feld, Adam Gehring, Aliya Gulamhusein, Gideon M. Hirschfield, Amanda Ricciuto, Gary D. Bader, Ian D. McGilvray, and Sonya MacParland. Single-cell, single-nucleus, and spatial transcriptomics characterization of the immunological landscape in the healthy and PSC human liver. J. Hepatol., 80(5):730–743, May 2024. ISSN 1600-0641. doi: 10.1016/j.jhep.2023.12.023.
- Andrusivova and Fan [2023] Zaneta Andrusivova and Yuhang Fan. Ex-st, 2023. URL https://data.mendeley.com/datasets/nrbsxrk9mp/1.
- Anton et al. [2024] Paige E. Anton, Lauren N. Rutt, Michael L. Kaufman, Nicolas Busquet, Elizabeth J. Kovacs, and Rebecca L. McCullough. Binge ethanol exposure in advanced age elevates neuroinflammation and early indicators of neurodegeneration and cognitive impairment in female mice. Brain Behav. Immun., 116:303–316, February 2024. ISSN 0889-1591. doi: 10.1016/j.bbi.2023.12.034.
- Aresta et al. [2019] Guilherme Aresta, Teresa Araújo, Scotty Kwok, Sai Saketh Chennamsetty, Mohammed Safwan, Varghese Alex, Bahram Marami, Marcel Prastawa, Monica Chan, Michael Donovan, et al. Bach: Grand challenge on breast cancer histology images. Medical image analysis, 56:122–139, 2019.
- Asp et al. [2019] Michaela Asp, Stefania Giacomello, Ludvig Larsson, Chenglin Wu, Daniel Fürth, Xiaoyan Qian, Eva Wärdell, Joaquin Custodio, Johan Reimegård, Fredrik Salmén, Cecilia Österholm, Patrik L. Ståhl, Erik Sundström, Elisabet Åkesson, Olaf Bergmann, Magda Bienko, Agneta Månsson-Broberg, Mats Nilsson, Christer Sylvén, and Joakim Lundeberg. A Spatiotemporal Organ-Wide Gene Expression and Cell Atlas of the Developing Human Heart. Cell, 179(7):1647–166019, December 2019. ISSN 1097-4172. doi: 10.1016/j.cell.2019.11.025.
- Asp et al. [2020] Michaela Asp, Joseph Bergenstråhle, and Joakim Lundeberg. Spatially Resolved Transcriptomes—Next Generation Tools for Tissue Exploration. BioEssays, 42(10):1900221, October 2020. ISSN 0265-9247. doi: 10.1002/bies.201900221.
- Azizi et al. [2023] Shekoofeh Azizi, Laura Culp, Jan Freyberg, Basil Mustafa, Sebastien Baur, Simon Kornblith, Ting Chen, Nenad Tomasev, Jovana Mitrović, Patricia Strachan, et al. Robust and data-efficient generalization of self-supervised machine learning for diagnostic imaging. Nature Biomedical Engineering, pages 1–24, 2023.
- Badve et al. [2007] Sunil Badve, Dmitry Turbin, Mangesh A Thorat, Akira Morimiya, Torsten O Nielsen, Charles M Perou, Sandi Dunn, David G Huntsman, and Harikrishna Nakshatri. Foxa1 expression in breast cancer—correlation with luminal subtype a and survival. Clinical cancer research, 13(15):4415–4421, 2007.
- Bandaru et al. [2014] S Bandaru, AX Zhou, P Rouhi, Y Zhang, MO Bergo, Yihai Cao, and LM Akyürek. Targeting filamin b induces tumor growth and metastasis via enhanced activity of matrix metalloproteinase-9 and secretion of vegf-a. Oncogenesis, 3(9):e119–e119, 2014.
- Bankhead et al. [2017] Peter Bankhead, Maurice Loughrey, Jose Fernandez, Yvonne Dombrowski, Darragh Mcart, Philip Dunne, Stephen Mcquaid, Ronan Gray, Liam Murray, Helen Coleman, Jacqueline James, Manuel Salto-Tellez, and Peter Hamilton. Qupath: Open source software for digital pathology image analysis. Scientific Reports, 7, 12 2017. doi: 10.1038/s41598-017-17204-5.
- Barbano et al. [2021] Carlo Alberto Barbano, Daniele Perlo, Enzo Tartaglione, Attilio Fiandrotti, Luca Bertero, Paola Cassoni, and Marco Grangetto. UniToPatho, a labeled histopathological dataset for colorectal polyps classification and adenoma dysplasia grading. arXiv, January 2021. doi: 10.1109/ICIP42928.2021.9506198.
- Barrozo et al. [2023] Enrico R. Barrozo, Maxim D. Seferovic, Eumenia C. C. Castro, Angela M. Major, David N. Moorshead, Michael D. Jochum, Ricardo Ferral Rojas, Cynthia D. Shope, and Kjersti M. Aagaard. SARS-CoV-2 niches in human placenta revealed by spatial transcriptomics. Med, 4(9):612–634.e4, September 2023. ISSN 2666-6340. doi: 10.1016/j.medj.2023.06.003.
- Barrozo et al. [2024] Enrico R. Barrozo, Maxim D. Seferovic, Mark P. Hamilton, David N. Moorshead, Michael D. Jochum, Trang Do, Derek S. O’Neil, Melissa A. Suter, and Kjersti M. Aagaard. Zika virus co-opts microRNA networks to persist in placental niches detected by spatial transcriptomics. Am. J. Obstet. Gynecol., 230(2):2511–25117, February 2024. ISSN 1097-6868. doi: 10.1016/j.ajog.2023.08.012.
- Bejnordi et al. [2017] Babak Ehteshami Bejnordi, Mitko Veta, Paul Johannes Van Diest, Bram Van Ginneken, Nico Karssemeijer, Geert Litjens, Jeroen AWM Van Der Laak, Meyke Hermsen, Quirine F Manson, Maschenka Balkenhol, et al. Diagnostic assessment of deep learning algorithms for detection of lymph node metastases in women with breast cancer. JAMA, 318(22):2199–2210, 2017.
- Beppu et al. [2023] Andrew K. Beppu, Juanjuan Zhao, Changfu Yao, Gianni Carraro, Edo Israely, Anna Lucia Coelho, Katherine Drake, Cory M. Hogaboam, William C. Parks, Jay K. Kolls, and Barry R. Stripp. Epithelial plasticity and innate immune activation promote lung tissue remodeling following respiratory viral infection. Nat. Commun., 14(5814):1–16, September 2023. ISSN 2041-1723. doi: 10.1038/s41467-023-41387-3.
- Bergenstråhle et al. [2022] Ludvig Bergenstråhle, Bryan He, Joseph Bergenstråhle, Xesús Abalo, Reza Mirzazadeh, Kim Thrane, Andrew L. Ji, Alma Andersson, Ludvig Larsson, Nathalie Stakenborg, Guy Boeckxstaens, Paul Khavari, James Zou, Joakim Lundeberg, and Jonas Maaskola. Super-resolved spatial transcriptomics by deep data fusion. Nat. Biotechnol., 40:476–479, April 2022. ISSN 1546-1696. doi: 10.1038/s41587-021-01075-3.
- Brancati et al. [2021] Nadia Brancati, Anna Maria Anniciello, Pushpak Pati, Daniel Riccio, Giosuè Scognamiglio, Guillaume Jaume, Giuseppe De Pietro, Maurizio Di Bonito, Antonio Foncubierta, Gerardo Botti, et al. Bracs: A dataset for breast carcinoma subtyping in h&e histology images. arXiv preprint arXiv:2111.04740, 2021.
- Bulten et al. [2022] Wouter Bulten, Kimmo Kartasalo, Po-Hsuan Cameron Chen, Peter Ström, Hans Pinckaers, Kunal Nagpal, Yuannan Cai, David F Steiner, Hester van Boven, Robert Vink, et al. Artificial intelligence for diagnosis and gleason grading of prostate cancer: the panda challenge. Nature Medicine, 28(1):154–163, 2022.
- Butler et al. [2018] Andrew Butler, Paul Hoffman, Peter Smibert, Efthymia Papalexi, and Rahul Satija. Integrating single-cell transcriptomic data across different conditions, technologies, and species. Nat. Biotechnol., 36:411–420, May 2018. ISSN 1546-1696. doi: 10.1038/nbt.4096.
- Canela et al. [2023] V. H. Canela, W. S. Bowen, R. M. Ferreira, F. Syed, et al. A spatially anchored transcriptomic atlas of the human kidney papilla identifies significant immune injury in patients with stone disease. Nature Communications, 14(1):4140, 2023. doi: 10.1038/s41467-023-41340-8.
- Chen et al. [2023] Jiaji George Chen, Joselyn Cristina Chávez-Fuentes, Matthew O’Brien, Junxiang Xu, Edward Ruiz, Wen Wang, Iqra Amin, Irzam Sarfraz, Pratishtha Guckhool, Adriana Sistig, Guo-Cheng Yuan, and Ruben Dries. Giotto Suite: a multi-scale and technology-agnostic spatial multi-omics analysis ecosystem. bioRxiv, page 2023.11.26.568752, November 2023. URL https://doi.org/10.1101/2023.11.26.568752.
- Chen et al. [2017] Liang-Chieh Chen, George Papandreou, Florian Schroff, and Hartwig Adam. Rethinking Atrous Convolution for Semantic Image Segmentation. arXiv, June 2017. doi: 10.48550/arXiv.1706.05587.
- Chen et al. [2022] Richard J Chen, Ming Y Lu, Drew FK Williamson, Tiffany Y Chen, Jana Lipkova, Zahra Noor, Muhammad Shaban, Maha Shady, Mane Williams, Bumjin Joo, et al. Pan-cancer integrative histology-genomic analysis via multimodal deep learning. Cancer Cell, 40(8):865–878, 2022.
- Chen et al. [2024] Richard J. Chen, Tong Ding, Ming Y. Lu, Drew F. K. Williamson, Guillaume Jaume, Andrew H. Song, Bowen Chen, Andrew Zhang, Daniel Shao, Muhammad Shaban, Mane Williams, Lukas Oldenburg, Luca L. Weishaupt, Judy J. Wang, Anurag Vaidya, Long Phi Le, Georg Gerber, Sharifa Sahai, Walt Williams, and Faisal Mahmood. Towards a general-purpose foundation model for computational pathology. Nature Medicine, 2024.
- Chen et al. [2020] Ting Chen, Simon Kornblith, Mohammad Norouzi, and Geoffrey Hinton. A simple framework for contrastive learning of visual representations. In International conference on machine learning, pages 1597–1607. PMLR, 2020.
- Chen et al. [2021] Xinlei Chen, Saining Xie, and Kaiming He. An Empirical Study of Training Self-Supervised Vision Transformers. arXiv, April 2021. doi: 10.48550/arXiv.2104.02057.
- Chung et al. [2024] Youngmin Chung, Ji Hun Ha, Kyeong Chan Im, and Joo Sang Lee. Accurate Spatial Gene Expression Prediction by integrating Multi-resolution features. arXiv, March 2024. doi: 10.48550/arXiv.2403.07592.
- Ciga et al. [2022] Ozan Ciga, Tony Xu, and Anne Louise Martel. Self supervised contrastive learning for digital histopathology. Machine Learning with Applications, 7, 2022.
- de Visser and Joyce [2023] Karin E. de Visser and Johanna A. Joyce. The evolving tumor microenvironment: From cancer initiation to metastatic outgrowth. Cancer Cell, 41(3):374–403, March 2023. ISSN 1535-6108. doi: 10.1016/j.ccell.2023.02.016.
- Deng et al. [2009] Jia Deng, Wei Dong, Richard Socher, Li-Jia Li, Kai Li, and Li Fei-Fei. Imagenet: A large-scale hierarchical image database. In 2009 IEEE conference on computer vision and pattern recognition, pages 248–255. Ieee, 2009.
- Dosovitskiy et al. [2021] Alexey Dosovitskiy, Lucas Beyer, Alexander Kolesnikov, Dirk Weissenborn, Xiaohua Zhai, Thomas Unterthiner, Mostafa Dehghani, Matthias Minderer, Georg Heigold, Sylvain Gelly, Jakob Uszkoreit, and Neil Houlsby. An image is worth 16x16 words: Transformers for image recognition at scale. In International Conference on Learning Representations, 2021. URL https://openreview.net/forum?id=YicbFdNTTy.
- Echle et al. [2021] Amelie Echle, Niklas Timon Rindtorff, Titus Josef Brinker, Tom Luedde, Alexander Thomas Pearson, and Jakob Nikolas Kather. Deep learning in cancer pathology: a new generation of clinical biomarkers. British journal of cancer, 124(4):686–696, 2021.
- El Nahhas et al. [2024] Omar SM El Nahhas, Chiara ML Loeffler, Zunamys I Carrero, Marko van Treeck, Fiona R Kolbinger, Katherine J Hewitt, Hannah S Muti, Mara Graziani, Qinghe Zeng, Julien Calderaro, et al. Regression-based deep-learning predicts molecular biomarkers from pathology slides. Nature communications, 15(1):1253, 2024.
- Erickson et al. [2022] Andrew Erickson, Mengxiao He, Emelie Berglund, Maja Marklund, Reza Mirzazadeh, Niklas Schultz, Linda Kvastad, Alma Andersson, Ludvig Bergenstråhle, Joseph Bergenstråhle, Ludvig Larsson, Leire Alonso Galicia, Alia Shamikh, Elisa Basmaci, Teresita Díaz De Ståhl, Timothy Rajakumar, Dimitrios Doultsinos, Kim Thrane, Andrew L. Ji, Paul A. Khavari, Firaz Tarish, Anna Tanoglidi, Jonas Maaskola, Richard Colling, Tuomas Mirtti, Freddie C. Hamdy, Dan J. Woodcock, Thomas Helleday, Ian G. Mills, Alastair D. Lamb, and Joakim Lundeberg. Spatially resolved clonal copy number alterations in benign and malignant tissue. Nature, 608:360–367, August 2022. ISSN 1476-4687. doi: 10.1038/s41586-022-05023-2.
- Ferreira et al. [2021] Ricardo Melo Ferreira, Angela R. Sabo, Seth Winfree, Kimberly S. Collins, Danielle Janosevic, Connor J. Gulbronson, Ying-Hua Cheng, Lauren Casbon, Daria Barwinska, Michael J. Ferkowicz, Xiaoling Xuei, Chi Zhang, Kenneth W. Dunn, Katherine J. Kelly, Timothy A. Sutton, Takashi Hato, Pierre C. Dagher, Tarek M. El-Achkar, and Michael T. Eadon. Integration of spatial and single-cell transcriptomics localizes epithelial cell–immune cross-talk in kidney injury. JCI Insight, 6(12), June 2021. ISSN 0021-9738. doi: 10.1172/jci.insight.147703.
- Filiot et al. [2023] Alexandre Filiot, Ridouane Ghermi, Antoine Olivier, Paul Jacob, Lucas Fidon, Alice Kain, Charlie Saillard, and Jean-Baptiste Schiratti. Scaling self-supervised learning for histopathology with masked image modeling. medRxiv, 07 2023. doi: 10.1101/2023.07.21.23292757.
- Fonseca et al. [2023] Marcos A. S. Fonseca, Marcela Haro, Kelly N. Wright, Xianzhi Lin, Forough Abbasi, Jennifer Sun, Lourdes Hernandez, Natasha L. Orr, Jooyoon Hong, Yunhee Choi-Kuaea, Horacio M. Maluf, Bonnie L. Balzer, Aaron Fishburn, Ryan Hickey, Ilana Cass, Helen S. Goodridge, Mireille Truong, Yemin Wang, Margareta D. Pisarska, Huy Q. Dinh, Amal E. L.-Naggar, David G. Huntsman, Michael S. Anglesio, Marc T. Goodman, Fabiola Medeiros, Matthew Siedhoff, and Kate Lawrenson. Single-cell transcriptomic analysis of endometriosis. Nat. Genet., 55:255–267, February 2023. ISSN 1546-1718. doi: 10.1038/s41588-022-01254-1.
- Fu et al. [2023] R. Fu, G. A. Norris, N. Willard, A. M. Griesinger, et al. Spatial transcriptomic analysis delineates epithelial and mesenchymal subpopulations and transition stages in childhood ependymoma. Neuro-Oncology, 25(4):786–798, 2023. doi: 10.1093/neuonc/noad070.
- Fu et al. [2020] Yu Fu, Alexander W Jung, Ramon Viñas Torne, Santiago Gonzalez, Harald Vöhringer, Artem Shmatko, Lucy R Yates, Mercedes Jimenez-Linan, Luiza Moore, and Moritz Gerstung. Pan-cancer computational histopathology reveals mutations, tumor composition and prognosis. Nature Cancer, 1(8):800–810, 2020.
- Gamper et al. [2019] Jevgenij Gamper, Navid Alemi Koohbanani, Ksenija Benet, Ali Khuram, and Nasir Rajpoot. Pannuke: an open pan-cancer histology dataset for nuclei instance segmentation and classification. In European Congress on Digital Pathology, pages 11–19. Springer, 2019.
- Gamper et al. [2020] Jevgenij Gamper, Navid Alemi Koohbanani, Simon Graham, Mostafa Jahanifar, Syed Ali Khurram, Ayesha Azam, Katherine Hewitt, and Nasir Rajpoot. Pannuke dataset extension, insights and baselines. arXiv preprint arXiv:2003.10778, 2020.
- Garrido et al. [2023] Quentin Garrido, Randall Balestriero, Laurent Najman, and Yann Lecun. Rankme: Assessing the downstream performance of pretrained self-supervised representations by their rank. In International Conference on Machine Learning, pages 10929–10974. PMLR, 2023.
- Giraud et al. [2022] Julie Giraud, Domitille Chalopin, Eloïse Ramel, Thomas Boyer, Atika Zouine, Marie-Alix Derieppe, Nicolas Larmonier, Olivier Adotevi, Brigitte Le Bail, Jean-Frédéric Blanc, Laurence Chiche, Macha Nikolski, and Maya Saleh. TREM1+CD163+ regulatory myeloid cells expand in steatohepatitis-HCC and associate with poor prognosis and therapeutic resistance to immune checkpoint blockade. bioRxiv, page 2022.11.09.515839, November 2022. URL https://doi.org/10.1101/2022.11.09.515839.
- Gouin et al. [2021] K. H. 3rd Gouin, N. Ing, J. T. Plummer, C. J. Rosser, et al. An n-cadherin 2 expressing epithelial cell subpopulation predicts response to surgery, chemotherapy and immunotherapy in bladder cancer. Nature Communications, 12(1):4906, 2021. doi: 10.1038/s41467-021-25205-2.
- Gracia Villacampa et al. [2021] Eva Gracia Villacampa, Ludvig Larsson, Reza Mirzazadeh, Linda Kvastad, Alma Andersson, Annelie Mollbrink, Georgia Kokaraki, Vanessa Monteil, Niklas Schultz, Karin Sofia Appelberg, Nuria Montserrat, Haibo Zhang, Josef M. Penninger, Wolfgang Miesbach, Ali Mirazimi, Joseph Carlson, and Joakim Lundeberg. Genome-wide spatial expression profiling in formalin-fixed tissues. Cell Genomics, 1(3):100065, December 2021. ISSN 2666-979X. doi: 10.1016/j.xgen.2021.100065.
- He et al. [2020] Bryan He, Ludvig Bergenstråhle, Linnea Stenbeck, Abubakar Abid, Alma Andersson, Åke Borg, Jonas Maaskola, Joakim Lundeberg, and James Zou. Integrating spatial gene expression and breast tumour morphology via deep learning. Nature biomedical engineering, 4(8):827–834, 2020.
- He et al. [2016] Kaiming He, Xiangyu Zhang, Shaoqing Ren, and Jian Sun. Deep residual learning for image recognition. In Proceedings of the IEEE conference on computer vision and pattern recognition, pages 770–778, 2016.
- Huang et al. [2023] Zhi Huang, Federico Bianchi, Mert Yuksekgonul, Thomas Montine, and James Zou. A visual–language foundation model for pathology image analysis using medical twitter. Nature Medicine, 29:1–10, 08 2023. doi: 10.1038/s41591-023-02504-3.
- Huo et al. [2022] Xinmi Huo, Kok Haur Ong, Kah Weng Lau, Laurent Gole, Char Loo Tan, Chongchong Zhang, Yonghui Zhang, Xiaohui Zhu, Longjie Li, Hao Han, David Young, Haoda Lu, Jun Xu, Wanyuan Chen, Stephan J. Sanders, Lee Hwee Kuan, Susan Swee-Shan Hue, Weimiao Yu, and Soo Yong Tan. Comprehensive AI Model Development for Gleason Grading: From Scanning, Cloud-Based Annotation to Pathologist-AI Interaction, July 2022. [Online; accessed 7. May 2024].
- Hörst et al. [2024] Fabian Hörst, Moritz Rempe, Lukas Heine, Constantin Seibold, Julius Keyl, Giulia Baldini, Selma Ugurel, Jens Siveke, Barbara Grünwald, Jan Egger, and Jens Kleesiek. Cellvit: Vision transformers for precise cell segmentation and classification. Medical Image Analysis, 94:103143, 2024. ISSN 1361-8415. doi: https://doi.org/10.1016/j.media.2024.103143. URL https://www.sciencedirect.com/science/article/pii/S1361841524000689.
- Ilse et al. [2018] Maximilian Ilse, Jakub Tomczak, and Max Welling. Attention-based deep multiple instance learning. In Proceedings of the 35th International Conference on Machine Learning, pages 2132–2141, 2018.
- Janesick et al. [2023] Amanda Janesick, Robert Shelansky, Andrew D. Gottscho, Florian Wagner, Stephen R. Williams, Morgane Rouault, Ghezal Beliakoff, Carolyn A. Morrison, Michelli F. Oliveira, Jordan T. Sicherman, Andrew Kohlway, Jawad Abousoud, Tingsheng Yu Drennon, Seayar H. Mohabbat, and Sarah E. B. Taylor. High resolution mapping of the tumor microenvironment using integrated single-cell, spatial and in situ analysis. Nat. Commun., 14(8353):1–15, December 2023. ISSN 2041-1723. doi: 10.1038/s41467-023-43458-x.
- Ji et al. [2020] Andrew L. Ji, Adam J. Rubin, Kim Thrane, Sizun Jiang, David L. Reynolds, Robin M. Meyers, Margaret G. Guo, Benson M. George, Annelie Mollbrink, Joseph Bergenstråhle, Ludvig Larsson, Yunhao Bai, Bokai Zhu, Aparna Bhaduri, Jordan M. Meyers, Xavier Rovira-Clavé, S. Tyler Hollmig, Sumaira Z. Aasi, Garry P. Nolan, Joakim Lundeberg, and Paul A. Khavari. Multimodal Analysis of Composition and Spatial Architecture in Human Squamous Cell Carcinoma. Cell, 182(2):497–51422, July 2020. ISSN 1097-4172. doi: 10.1016/j.cell.2020.05.039.
- Kang et al. [2023] Mingu Kang, Heon Song, Seonwook Park, Donggeun Yoo, and Sérgio Pereira. Benchmarking self-supervised learning on diverse pathology datasets. In Proceedings of the IEEE/CVF Conference on Computer Vision and Pattern Recognition, pages 3344–3354, 2023.
- Karras et al. [2022] Panagiotis Karras, Ignacio Bordeu, Joanna Pozniak, Ada Nowosad, Cecilia Pazzi, Nina Van Raemdonck, Ewout Landeloos, Yannick Van Herck, Dennis Pedri, Greet Bervoets, Samira Makhzami, Jia Hui Khoo, Benjamin Pavie, Jochen Lamote, Oskar Marin-Bejar, Michael Dewaele, Han Liang, Xingju Zhang, Yichao Hua, Jasper Wouters, Robin Browaeys, Gabriele Bergers, Yvan Saeys, Francesca Bosisio, Joost van den Oord, Diether Lambrechts, Anil K. Rustgi, Oliver Bechter, Cedric Blanpain, Benjamin D. Simons, Florian Rambow, and Jean-Christophe Marine. A cellular hierarchy in melanoma uncouples growth and metastasis. Nature, 610:190–198, October 2022. ISSN 1476-4687. doi: 10.1038/s41586-022-05242-7.
- Kathe et al. [2022] Claudia Kathe, Michael A. Skinnider, Thomas H. Hutson, Nicola Regazzi, Matthieu Gautier, Robin Demesmaeker, Salif Komi, Steven Ceto, Nicholas D. James, Newton Cho, Laetitia Baud, Katia Galan, Kaya J. E. Matson, Andreas Rowald, Kyungjin Kim, Ruijia Wang, Karen Minassian, John O. Prior, Leonie Asboth, Quentin Barraud, Stéphanie P. Lacour, Ariel J. Levine, Fabien Wagner, Jocelyne Bloch, Jordan W. Squair, and Grégoire Courtine. The neurons that restore walking after paralysis. Nature, 611:540–547, November 2022. ISSN 1476-4687. doi: 10.1038/s41586-022-05385-7.
- Kather et al. [2019a] Jakob Nikolas Kather, Johannes Krisam, Pornpimol Charoentong, Tom Luedde, Esther Herpel, Cleo-Aron Weis, Timo Gaiser, Alexander Marx, Nektarios A. Valous, Dyke Ferber, Lina Jansen, Constantino Carlos Reyes-Aldasoro, Inka Zörnig, Dirk Jäger, Hermann Brenner, Jenny Chang-Claude, Michael Hoffmeister, and Niels Halama. Predicting survival from colorectal cancer histology slides using deep learning: A retrospective multicenter study. PLoS Med., 16(1), January 2019a. doi: 10.1371/journal.pmed.1002730.
- Kather et al. [2019b] Jakob Nikolas Kather, Alexander T Pearson, Niels Halama, Dirk Jäger, Jeremias Krause, Sven H Loosen, Alexander Marx, Peter Boor, Frank Tacke, Ulf Peter Neumann, et al. Deep learning can predict microsatellite instability directly from histology in gastrointestinal cancer. Nature medicine, 25(7):1054–1056, 2019b.
- Kather et al. [2020] Jakob Nikolas Kather, Lara R Heij, Heike I Grabsch, Chiara Loeffler, Amelie Echle, Hannah Sophie Muti, Jeremias Krause, Jan M Niehues, Kai AJ Sommer, Peter Bankhead, et al. Pan-cancer image-based detection of clinically actionable genetic alterations. Nature Cancer, 1(8):789–799, 2020.
- Kolesnikov et al. [2020] Alexander Kolesnikov, Lucas Beyer, Xiaohua Zhai, Joan Puigcerver, Jessica Yung, Sylvain Gelly, and Neil Houlsby. Big Transfer (BiT): General Visual Representation Learning. In Computer Vision – ECCV 2020: 16th European Conference, Glasgow, UK, August 23–28, 2020, Proceedings, Part V, pages 491–507. Springer-Verlag, Heidelberg, Germany, 2020. ISBN 978-3-030-58557-0. doi: 10.1007/978-3-030-58558-7_29.
- Koohbanani et al. [2021] Navid Alemi Koohbanani, Balagopal Unnikrishnan, Syed Ali Khurram, Pavitra Krishnaswamy, and Nasir Rajpoot. Self-path: Self-supervision for classification of pathology images with limited annotations. IEEE Transactions on Medical Imaging, 2021.
- Koziarski et al. [2024] Michał Koziarski, Bogusław Cyganek, Przemysław Niedziela, Bogusław Olborski, Zbigniew Antosz, Marcin Żydak, Bogdan Kwolek, Paweł Wąsowicz, Andrzej Bukała, Jakub Swadźba, and Piotr Sitkowski. DiagSet: a dataset for prostate cancer histopathological image classification. Sci. Rep., 14(6780):1–14, March 2024. ISSN 2045-2322. doi: 10.1038/s41598-024-52183-4.
- Krausgruber et al. [2023] Thomas Krausgruber, Anna Redl, Daniele Barreca, Konstantin Doberer, Daria Romanovskaia, Lina Dobnikar, Maria Guarini, Luisa Unterluggauer, Lisa Kleissl, Denise Atzmüller, Carolina Mayerhofer, Aglaja Kopf, Simona Saluzzo, Clarice X. Lim, Praveen Rexie, Thomas Weichhart, Christoph Bock, and Georg Stary. Single-cell and spatial transcriptomics reveal aberrant lymphoid developmental programs driving granuloma formation. Immunity, 56(2):289–306.e7, February 2023. ISSN 1074-7613. doi: 10.1016/j.immuni.2023.01.014.
- Lake et al. [2023] Blue B. Lake, Rajasree Menon, Seth Winfree, Qiwen Hu, Ricardo Melo Ferreira, Kian Kalhor, Daria Barwinska, Edgar A. Otto, Michael Ferkowicz, Dinh Diep, Nongluk Plongthongkum, Amanda Knoten, Sarah Urata, Laura H. Mariani, Abhijit S. Naik, Sean Eddy, Bo Zhang, Yan Wu, Diane Salamon, James C. Williams, Xin Wang, Karol S. Balderrama, Paul J. Hoover, Evan Murray, Jamie L. Marshall, Teia Noel, Anitha Vijayan, Austin Hartman, Fei Chen, Sushrut S. Waikar, Sylvia E. Rosas, Francis P. Wilson, Paul M. Palevsky, Krzysztof Kiryluk, John R. Sedor, Robert D. Toto, Chirag R. Parikh, Eric H. Kim, Rahul Satija, Anna Greka, Evan Z. Macosko, Peter V. Kharchenko, Joseph P. Gaut, Jeffrey B. Hodgin, Michael T. Eadon, Pierre C. Dagher, Tarek M. El-Achkar, Kun Zhang, Matthias Kretzler, and Sanjay Jain. An atlas of healthy and injured cell states and niches in the human kidney. Nature, 619:585–594, July 2023. ISSN 1476-4687. doi: 10.1038/s41586-023-05769-3.
- Lee et al. [2022] Dong Hoon Lee, Sungik Choi, Hyunwoo J Kim, and Sae-Young Chung. Unsupervised visual representation learning via mutual information regularized assignment. Advances in Neural Information Processing Systems, 35:29610–29623, 2022.
- Li et al. [2024] Rich Gang Li, Xiao Li, Yuka Morikawa, Francisco J. Grisanti-Canozo, Fansen Meng, Chang-Ru Tsai, Yi Zhao, Lin Liu, Jong Kim, Bing Xie, Elzbieta Klysik, Shijie Liu, Md Abul Hassan Samee, and James F. Martin. YAP induces a neonatal-like pro-renewal niche in the adult heart. Nature cardiovascular research, 3(3):283, March 2024. doi: 10.1038/s44161-024-00428-w.
- Li and Wang [2021] Xinmin Li and Cun-Yu Wang. From bulk, single-cell to spatial RNA sequencing. Int. J. Oral Sci., 13(36):1–6, November 2021. ISSN 2049-3169. doi: 10.1038/s41368-021-00146-0.
- Lin et al. [2023] Wenyong Lin, Xin Chen, Dongyuan Wang, Ruixia Lu, Chunling Zhang, Zhenchao Niu, Jie Chen, Xiaofen Ruan, and Xiaolong Wang. Single-nucleus ribonucleic acid-sequencing and spatial transcriptomics reveal the cardioprotection of Shexiang Baoxin Pill (SBP) in mice with myocardial ischemia-reperfusion injury. Front. Pharmacol., 14:1173649, May 2023. ISSN 1663-9812. doi: 10.3389/fphar.2023.1173649.
- Lipkova et al. [2022] Jana Lipkova, Tiffany Y Chen, Ming Y Lu, Richard J Chen, Maha Shady, Mane Williams, Jingwen Wang, Zahra Noor, Richard N Mitchell, Mehmet Turan, et al. Deep learning-enabled assessment of cardiac allograft rejection from endomyocardial biopsies. Nature medicine, 28(3):575–582, 2022.
- Liu et al. [2022] Tong Liu, Cheng Liu, Meisi Yan, Lei Zhang, Jing Zhang, Min Xiao, Zhigao Li, Xiaofan Wei, and Hongquan Zhang. Single cell profiling of primary and paired metastatic lymph node tumors in breast cancer patients. Nat. Commun., 13(6823):1–17, November 2022. ISSN 2041-1723. doi: 10.1038/s41467-022-34581-2.
- Liu et al. [2021] Ze Liu, Yutong Lin, Yue Cao, Han Hu, Yixuan Wei, Zheng Zhang, Stephen Lin, and Baining Guo. Swin transformer: Hierarchical vision transformer using shifted windows. In Proceedings of the IEEE/CVF International Conference on Computer Vision, pages 10012–10022, 2021.
- Loeffler et al. [2022] Chiara Maria Lavinia Loeffler, Nadina Ortiz Bruechle, Max Jung, Lancelot Seillier, Michael Rose, Narmin Ghaffari Laleh, Ruth Knuechel, Titus J Brinker, Christian Trautwein, Nadine T Gaisa, et al. Artificial intelligence–based detection of fgfr3 mutational status directly from routine histology in bladder cancer: A possible preselection for molecular testing? European Urology Focus, 8(2):472–479, 2022.
- Lu et al. [2024] Ming Lu, Bowen Chen, Drew Williamson, Richard Chen, Ivy Liang, Tong Ding, Guillaume Jaume, Igor Odintsov, Andrew Zhang, Long Le, Georg Gerber, Anil Parwani, and Faisal Mahmood. Towards a visual-language foundation model for computational pathology. Nature Medicine, 2024.
- Lu et al. [2020] Ming Y Lu, Drew FK Williamson, Tiffany Y Chen, Richard J Chen, Matteo Barbieri, and Faisal Mahmood. Data efficient and weakly supervised computational pathology on whole slide images. Nature Biomedical Engineering, 2020.
- Lu et al. [2021a] Ming Y Lu, Tiffany Y Chen, Drew FK Williamson, Melissa Zhao, Maha Shady, Jana Lipkova, and Faisal Mahmood. Ai-based pathology predicts origins for cancers of unknown primary. Nature, 594(7861):106–110, 2021a.
- Lu et al. [2021b] Ming Y Lu, Drew FK Williamson, Tiffany Y Chen, Richard J Chen, Matteo Barbieri, and Faisal Mahmood. Data-efficient and weakly supervised computational pathology on whole-slide images. Nature biomedical engineering, 5(6):555–570, 2021b.
- Madissoon et al. [2023] Elo Madissoon, Amanda J Oliver, Vitalii Kleshchevnikov, Anna Wilbrey-Clark, Krzysztof Polanski, Nathan Richoz, Ana Ribeiro Orsi, Lira Mamanova, Liam Bolt, Rasa Elmentaite, et al. A spatially resolved atlas of the human lung characterizes a gland-associated immune niche. Nature Genetics, 55(1):66–77, 2023.
- Marconato et al. [2024] Luca Marconato, Giovanni Palla, Kevin A. Yamauchi, Isaac Virshup, Elyas Heidari, Tim Treis, Wouter-Michiel Vierdag, Marcella Toth, Sonja Stockhaus, Rahul B. Shrestha, Benjamin Rombaut, Lotte Pollaris, Laurens Lehner, Harald Vöhringer, Ilia Kats, Yvan Saeys, Sinem K. Saka, Wolfgang Huber, Moritz Gerstung, Josh Moore, Fabian J. Theis, and Oliver Stegle. SpatialData: an open and universal data framework for spatial omics. Nat. Methods, pages 1–5, March 2024. ISSN 1548-7105. doi: 10.1038/s41592-024-02212-x.
- Marklund [2022] Maja Marklund. Prostate needle biopsies pre- and post-adt: Count matrices, histological-, and androgen receptor immunohistochemistry images, 2022. URL https://data.mendeley.com/datasets/mdt8n2xgf4/1.
- Marx [2021] Vivien Marx. Method of the year: spatially resolved transcriptomics. Nature methods, 18(1):9–14, 2021.
- Mauduit et al. [2022] Olivier Mauduit, Vanessa Delcroix, Takeshi Umazume, Cintia S. de Paiva, Darlene A. Dartt, and Helen P. Makarenkova. Spatial transcriptomics of the lacrimal gland features macrophage activity and epithelium metabolism as key alterations during chronic inflammation. Front. Immunol., 13:1011125, October 2022. ISSN 1664-3224. doi: 10.3389/fimmu.2022.1011125.
- Maynard et al. [2021] Kristen R Maynard, Leonardo Collado-Torres, Lukas M Weber, Cedric Uytingco, Brianna K Barry, Stephen R Williams, Joseph L Catallini, Matthew N Tran, Zachary Besich, Madhavi Tippani, et al. Transcriptome-scale spatial gene expression in the human dorsolateral prefrontal cortex. Nature neuroscience, 24(3):425–436, 2021.
- McKellar et al. [2021] D. W. McKellar, L. D. Walter, L. T. Song, M. Mantri, et al. Large-scale integration of single-cell transcriptomic data captures transitional progenitor states in mouse skeletal muscle regeneration. Communications Biology, 4(1):1280, 2021. doi: 10.1038/s42003-021-02756-8.
- McKellar et al. [2023] David W. McKellar, Madhav Mantri, Meleana M. Hinchman, John S. L. Parker, Praveen Sethupathy, Benjamin D. Cosgrove, and Iwijn De Vlaminck. Spatial mapping of the total transcriptome by in situ polyadenylation. Nat. Biotechnol., 41:513–520, April 2023. ISSN 1546-1696. doi: 10.1038/s41587-022-01517-6.
- Mehra et al. [2005] Rohit Mehra, Sooryanarayana Varambally, Lei Ding, Ronglai Shen, Michael S. Sabel, Debashis Ghosh, Arul M. Chinnaiyan, and Celina G. Kleer. Identification of GATA3 as a Breast Cancer Prognostic Marker by Global Gene Expression Meta-analysis. Cancer Res., 65(24):11259–11264, December 2005. ISSN 0008-5472. doi: 10.1158/0008-5472.CAN-05-2495.
- Meylan et al. [2022] Maxime Meylan, Florent Petitprez, Etienne Becht, Antoine Bougoüin, Guilhem Pupier, Anne Calvez, Ilenia Giglioli, Virginie Verkarre, Guillaume Lacroix, Johanna Verneau, Chen-Ming Sun, Pierre Laurent-Puig, Yann-Alexandre Vano, Reza Elaïdi, Arnaud Méjean, Rafaël Sanchez-Salas, Eric Barret, Xavier Cathelineau, Stephane Oudard, Claude-Agnès Reynaud, Aurélien de Reyniès, Catherine Sautès-Fridman, and Wolf Herman Fridman. Tertiary lymphoid structures generate and propagate anti-tumor antibody-producing plasma cells in renal cell cancer. Immunity, 55(3):527–541.e5, March 2022. ISSN 1074-7613. doi: 10.1016/j.immuni.2022.02.001.
- Mirzazadeh et al. [2021] Reza Mirzazadeh, Ludvig Larsson, Nathalie Stakenborg, Xesús Abalo, Guy Boeckxstaens, and Joakim Lundeberg. Human ileum, visium, 2021. URL https://data.mendeley.com/datasets/v8s9nz948s/1.
- Mirzazadeh et al. [2023] Reza Mirzazadeh, Zaneta Andrusivova, Ludvig Larsson, Phillip T. Newton, Leire Alonso Galicia, Xesús M. Abalo, Mahtab Avijgan, Linda Kvastad, Alexandre Denadai-Souza, Nathalie Stakenborg, Alexandra B. Firsova, Alia Shamikh, Aleksandra Jurek, Niklas Schultz, Monica Nistér, Christos Samakovlis, Guy Boeckxstaens, and Joakim Lundeberg. Spatially resolved transcriptomic profiling of degraded and challenging fresh frozen samples. Nat. Commun., 14(509):1–16, January 2023. ISSN 2041-1723. doi: 10.1038/s41467-023-36071-5.
- Moeyersoms et al. [2023] Acadia H. M. Moeyersoms, Ryan A. Gallo, Michelle G. Zhang, Vasileios Stathias, Michelle M. Maeng, Dawn Owens, Rayan Abou Khzam, Yoseph Sayegh, Cynthia Maza, Sander R. Dubovy, David T. Tse, and Daniel Pelaez. Spatial Transcriptomics Identifies Expression Signatures Specific to Lacrimal Gland Adenoid Cystic Carcinoma Cells. Cancers, 15(12):3211., June 2023. ISSN 2072-6694. doi: 10.3390/cancers15123211.
- Mondol et al. [2023] Raktim Kumar Mondol, Ewan K. A. Millar, Peter H. Graham, Lois Browne, Arcot Sowmya, and Erik Meijering. hist2RNA: An Efficient Deep Learning Architecture to Predict Gene Expression from Breast Cancer Histopathology Images. Cancers, 15(9):2569, April 2023. ISSN 2072-6694. doi: 10.3390/cancers15092569.
- Monjo et al. [2022] Taku Monjo, Masaru Koido, Satoi Nagasawa, Yutaka Suzuki, and Yoichiro Kamatani. Efficient prediction of a spatial transcriptomics profile better characterizes breast cancer tissue sections without costly experimentation. Sci. Rep., 12(4133):1–12, March 2022. ISSN 2045-2322. doi: 10.1038/s41598-022-07685-4.
- Moses and Pachter [2022] Lambda Moses and Lior Pachter. Museum of spatial transcriptomics. Nat. Methods, 19:534–546, May 2022. ISSN 1548-7105. doi: 10.1038/s41592-022-01409-2.
- Oord et al. [2018] Aaron van den Oord, Yazhe Li, and Oriol Vinyals. Representation learning with contrastive predictive coding. arXiv preprint arXiv:1807.03748, 2018.
- Oquab et al. [2023] Maxime Oquab, Timothée Darcet, Théo Moutakanni, Huy Vo, Marc Szafraniec, Vasil Khalidov, Pierre Fernandez, Daniel Haziza, Francisco Massa, Alaaeldin El-Nouby, et al. Dinov2: Learning robust visual features without supervision. arXiv preprint arXiv:2304.07193, 2023.
- Ortiz et al. [2020] Cantin Ortiz, Jose Fernandez Navarro, Aleksandra Jurek, Antje Märtin, Joakim Lundeberg, and Konstantinos Meletis. Molecular atlas of the adult mouse brain. Sci. Adv., 6(26), June 2020. ISSN 2375-2548. doi: 10.1126/sciadv.abb3446.
- Pakula et al. [2024] Hubert Pakula, Mohamed Omar, Ryan Carelli, Filippo Pederzoli, Giuseppe Nicolò Fanelli, Tania Pannellini, Fabio Socciarelli, Lucie Van Emmenis, Silvia Rodrigues, Caroline Fidalgo-Ribeiro, Pier Vitale Nuzzo, Nicholas J. Brady, Wikum Dinalankara, Madhavi Jere, Itzel Valencia, Christopher Saladino, Jason Stone, Caitlin Unkenholz, Richard Garner, Mohammad K. Alexanderani, Francesca Khani, Francisca Nunes de Almeida, Cory Abate-Shen, Matthew B. Greenblatt, David S. Rickman, Christopher E. Barbieri, Brian D. Robinson, Luigi Marchionni, and Massimo Loda. Distinct mesenchymal cell states mediate prostate cancer progression. Nat. Commun., 15(363):1–21, January 2024. ISSN 2041-1723. doi: 10.1038/s41467-023-44210-1.
- Palla et al. [2022] Giovanni Palla, Hannah Spitzer, Michal Klein, David Fischer, Anna Christina Schaar, Louis Benedikt Kuemmerle, Sergei Rybakov, Ignacio L. Ibarra, Olle Holmberg, Isaac Virshup, Mohammad Lotfollahi, Sabrina Richter, and Fabian J. Theis. Squidpy: a scalable framework for spatial omics analysis. Nat. Methods, 19:171–178, February 2022. ISSN 1548-7105. doi: 10.1038/s41592-021-01358-2.
- Pang et al. [2021] Minxing Pang, Kenong Su, and Mingyao Li. Leveraging information in spatial transcriptomics to predict super-resolution gene expression from histology images in tumors. bioRxiv, page 2021.11.28.470212, November 2021. URL https://doi.org/10.1101/2021.11.28.470212.
- Parigi et al. [2022] S. M. Parigi, L. Larsson, S. Das, R. O. Ramirez Flores, et al. The spatial transcriptomic landscape of the healing mouse intestine following damage. Nature Communications, 13(1):828, 2022. doi: 10.1038/s41467-022-28423-2.
- Pataki et al. [2022] Bálint Ármin Pataki, Alex Olar, Dezső Ribli, Adrián Pesti, Endre Kontsek, Benedek Gyöngyösi, Ágnes Bilecz, Tekla Kovács, Kristóf Attila Kovács, Zsófia Kramer, András Kiss, Miklós Szócska, Péter Pollner, and István Csabai. HunCRC: annotated pathological slides to enhance deep learning applications in colorectal cancer screening. Sci. Data, 9(370):1–7, June 2022. ISSN 2052-4463. doi: 10.1038/s41597-022-01450-y.
- Pham et al. [2023] Duy Pham, Xiao Tan, Brad Balderson, Jun Xu, Laura F. Grice, Sohye Yoon, Emily F. Willis, Minh Tran, Pui Yeng Lam, Arti Raghubar, Priyakshi Kalita-de Croft, Sunil Lakhani, Jana Vukovic, Marc J. Ruitenberg, and Quan H. Nguyen. Robust mapping of spatiotemporal trajectories and cell–cell interactions in healthy and diseased tissues. Nat. Commun., 14(7739):1–25, November 2023. ISSN 2041-1723. doi: 10.1038/s41467-023-43120-6.
- Pilet et al. [2023] Jill Pilet, Theo Z. Hirsch, Barkha Gupta, Amélie Roehrig, Guillaume Morcrette, Aurore Pire, Eric Letouzé, Brice Fresneau, Sophie Taque, Laurence Brugières, Sophie Branchereau, Christophe Chardot, Isabelle Aerts, Sabine Sarnacki, Monique Fabre, Catherine Guettier, Sandra Rebouissou, and Jessica Zucman-Rossi. Preneoplastic liver colonization by 11p15.5 altered mosaic cells in young children with hepatoblastoma. Nat. Commun., 14, 2023. doi: 10.1038/s41467-023-42418-9.
- Radford et al. [2021] Alec Radford, Jong Wook Kim, Chris Hallacy, Aditya Ramesh, Gabriel Goh, Sandhini Agarwal, Girish Sastry, Amanda Askell, Pamela Mishkin, Jack Clark, et al. Learning transferable visual models from natural language supervision. arXiv preprint arXiv:2103.00020, 2021.
- Rahaman et al. [2023] Md Mamunur Rahaman, Ewan K. A. Millar, and Erik Meijering. Breast cancer histopathology image-based gene expression prediction using spatial transcriptomics data and deep learning. Sci. Rep., 13(13604):1–11, August 2023. ISSN 2045-2322. doi: 10.1038/s41598-023-40219-0.
- Rao et al. [2021] Anjali Rao, Dalia Barkley, Gustavo S. França, and Itai Yanai. Exploring tissue architecture using spatial transcriptomics. Nature, 596:211–220, August 2021. ISSN 1476-4687. doi: 10.1038/s41586-021-03634-9.
- Redmon et al. [2016] Joseph Redmon, Santosh Divvala, Ross Girshick, and Ali Farhadi. You Only Look Once: Unified, Real-Time Object Detection. In 2016 IEEE Conference on Computer Vision and Pattern Recognition (CVPR), pages 27–30. IEEE, 2016. doi: 10.1109/CVPR.2016.91.
- Ren et al. [2021] Jing Ren, Yunzi Chen, Weishu Kong, Ye Li, and Feng Lu. Tumor protein d52 promotes breast cancer proliferation and migration via the long non-coding rna neat1/microrna-218-5p axis. Annals of Translational Medicine, 9(12), 2021.
- Riasatian et al. [2021] Abtin Riasatian, Morteza Babaie, Danial Maleki, S. Kalra, Mojtaba Valipour, Sobhan Hemati, Manit Zaveri, Amir Safarpoor, Sobhan Shafiei, Mehdi Afshari, Maral Rasoolijaberi, Milad Sikaroudi, Mohammed Adnan, Sultaan Shah, Charles Choi, Savvas Damaskinos, Clinton J. V. Campbell, Phedias Diamandis, Liron X Pantanowitz, Hany Kashani, Ali Ghodsi, and Hamid R. Tizhoosh. Fine-tuning and training of densenet for histopathology image representation using tcga diagnostic slides. Medical image analysis, 70:102032, 2021. URL https://api.semanticscholar.org/CorpusID:231648164.
- Saldanha et al. [2023] Oliver Lester Saldanha, Chiara ML Loeffler, Jan Moritz Niehues, Marko van Treeck, Tobias P Seraphin, Katherine Jane Hewitt, Didem Cifci, Gregory Patrick Veldhuizen, Siddhi Ramesh, Alexander T Pearson, et al. Self-supervised attention-based deep learning for pan-cancer mutation prediction from histopathology. NPJ Precision Oncology, 7(1):35, 2023.
- Schäbitz et al. [2022] A. Schäbitz, C. Hillig, M. Mubarak, M. Jargosch, A. Farnoud, E. Scala, N. Kurzen, A. C. Pilz, N. Bhalla, J. Thomas, M. Stahle, T. Biedermann, C. B. Schmidt-Weber, F. Theis, N. Garzorz-Stark, K. Eyerich, M. P. Menden, and S. Eyerich. Spatial transcriptomics landscape of lesions from non-communicable inflammatory skin diseases. Nat. Commun., 13(7729):1–13, December 2022. ISSN 2041-1723. doi: 10.1038/s41467-022-35319-w.
- Schmauch et al. [2020] Benoît Schmauch, Alberto Romagnoni, Elodie Pronier, Charlie Saillard, Pascale Maillé, Julien Calderaro, Aurélie Kamoun, Meriem Sefta, Sylvain Toldo, Mikhail Zaslavskiy, et al. A deep learning model to predict rna-seq expression of tumours from whole slide images. Nature Communications, 11(1), 2020.
- Shao et al. [2021] Zhuchen Shao, Hao Bian, Yang Chen, Yifeng Wang, Jian Zhang, Xiangyang Ji, et al. Transmil: Transformer based correlated multiple instance learning for whole slide image classification. Advances in Neural Information Processing Systems, 34, 2021.
- Silas Maniatis et al. [2019] # Silas Maniatis, # Tarmo Äijö, # Sanja Vickovic, Catherine Braine, Kristy Kang, Annelie Mollbrink, Delphine Fagegaltier, Žaneta Andrusivová, Sami Saarenpää, Gonzalo Saiz-Castro, Miguel Cuevas, Aaron Watters, Joakim Lundeberg, Richard Bonneau, and Hemali Phatnani. Spatiotemporal dynamics of molecular pathology in amyotrophic lateral sclerosis. Science, 364(6435):89–93, April 2019. ISSN 1095-9203. doi: 10.1126/science.aav9776.
- Silva-Rodríguez et al. [2020] Julio Silva-Rodríguez, Adrián Colomer, María A. Sales, Rafael Molina, and Valery Naranjo. Going deeper through the Gleason scoring scale: An automatic end-to-end system for histology prostate grading and cribriform pattern detection. Comput. Methods Programs Biomed., 195:105637, October 2020. ISSN 0169-2607. doi: 10.1016/j.cmpb.2020.105637.
- Song et al. [2023] Andrew H. Song, Guillaume Jaume, Drew F. K. Williamson, Ming Y. Lu, Anurag Vaidya, Tiffany R. Miller, and Faisal Mahmood. Artificial intelligence for digital and computational pathology. Nature Reviews Bioengineering, Oct 2023. ISSN 2731-6092. doi: 10.1038/s44222-023-00096-8. URL https://doi.org/10.1038/s44222-023-00096-8.
- Spanhol et al. [2015] Fabio A. Spanhol, Luiz S. Oliveira, Caroline Petitjean, and Laurent Heutte. A Dataset for Breast Cancer Histopathological Image Classification. IEEE Trans. Biomed. Eng., 63(7):1455–1462, October 2015. doi: 10.1109/TBME.2015.2496264.
- Ståhl et al. [2016a] Patrik L. Ståhl, Fredrik Salmén, Sanja Vickovic, Anna Lundmark, José Fernández Navarro, Jens Magnusson, Stefania Giacomello, Michaela Asp, Jakub O. Westholm, Mikael Huss, Annelie Mollbrink, Sten Linnarsson, Simone Codeluppi, Åke Borg, Fredrik Pontén, Paul Igor Costea, Pelin Sahlén, Jan Mulder, Olaf Bergmann, Joakim Lundeberg, and Jonas Frisén. Visualization and analysis of gene expression in tissue sections by spatial transcriptomics. Science, 353(6294):78–82, July 2016a. ISSN 0036-8075. doi: 10.1126/science.aaf2403.
- Ståhl et al. [2016b] Patrik L Ståhl, Fredrik Salmén, Sanja Vickovic, Anna Lundmark, José Fernández Navarro, Jens Magnusson, Stefania Giacomello, Michaela Asp, Jakub O Westholm, Mikael Huss, et al. Visualization and analysis of gene expression in tissue sections by spatial transcriptomics. Science, 353(6294):78–82, 2016b.
- Valdeolivas et al. [2023] Alberto Valdeolivas, Bettina Amberg, Nicolas Giroud, Marion Richardson, Eric J. C. Gálvez, Solveig Badillo, Alice Julien-Laferrière, Demeter Turos, Lena Voith von Voithenberg, Isabelle Wells, Amy A. Lo, Emilio Yángüez, Meghna Das Thakur, Michael Bscheider, Marc Sultan, Nadine Kumpesa, Björn Jacobsen, Tobias Bergauer, Julio Saez-Rodriguez, Sven Rottenberg, Petra C. Schwalie, and Kerstin Hahn. Charting the Heterogeneity of Colorectal Cancer Consensus Molecular Subtypes using Spatial Transcriptomics. bioRxiv, page 2023.01.23.525135, January 2023. URL https://doi.org/10.1101/2023.01.23.525135.
- Veeling et al. [2018] Bastiaan S Veeling, Jasper Linmans, Jim Winkens, Taco Cohen, and Max Welling. Rotation equivariant CNNs for digital pathology. June 2018.
- Vicari et al. [2023] Marco Vicari, Reza Mirzazadeh, Anna Nilsson, Reza Shariatgorji, Patrik Bjärterot, Ludvig Larsson, Hower Lee, Mats Nilsson, Julia Foyer, Markus Ekvall, Paulo Czarnewski, Xiaoqun Zhang, Per Svenningsson, Lukas Käll, Per E. Andrén, and Joakim Lundeberg. Spatial multimodal analysis of transcriptomes and metabolomes in tissues. Nat. Biotechnol., pages 1–5, September 2023. ISSN 1546-1696. doi: 10.1038/s41587-023-01937-y.
- Villacampa et al. [2021] Eva Gracia Villacampa, Ludvig Larsson, Reza Mirzazadeh, Linda Kvastad, Alma Andersson, Annelie Mollbrink, Georgia Kokaraki, Vanessa Monteil, Niklas Schultz, Karin Sofia Appelberg, Nuria Montserrat, Haibo Zhang, Josef M. Penninger, Wolfgang Miesbach, Ali Mirazimi, Joseph Carlson, and Joakim Lundeberg. Genome-wide spatial expression profiling in formalin-fixed tissues. Cell Genom., 1(3):100065., December 2021. ISSN 2666-979X. doi: 10.1016/j.xgen.2021.100065.
- Voigt et al. [2023] Andrew P. Voigt, Nathaniel K. Mullin, Emma M. Navratil, Miles J. Flamme-Wiese, Li-Chun Lin, Todd E. Scheetz, Ian C. Han, Edwin M. Stone, Budd A. Tucker, and Robert F. Mullins. Gene Expression Within a Human Choroidal Neovascular Membrane Using Spatial Transcriptomics. Invest. Ophthalmol. Visual Sci., 64(13):40, October 2023. ISSN 1552-5783. doi: 10.1167/iovs.64.13.40.
- Vorontsov et al. [2023] Eugene Vorontsov, Alican Bozkurt, Adam Casson, George Shaikovski, Michal Zelechowski, Siqi Liu, Philippe Mathieu, Alexander van Eck, Donghun Lee, Julian Viret, Eric Robert, Yi Kan Wang, Jeremy D. Kunz, Matthew C. H. Lee, Jan Bernhard, Ran A. Godrich, Gerard Oakley, Ewan Millar, Matthew Hanna, Juan Retamero, William A. Moye, Razik Yousfi, Christopher Kanan, David Klimstra, Brandon Rothrock, and Thomas J. Fuchs. Virchow: A million-slide digital pathology foundation model, 2023.
- Wagner et al. [2023] Sophia J. Wagner, Daniel Reisenbüchler, Nicholas P. West, Jan Moritz Niehues, Jiefu Zhu, Sebastian Foersch, Gregory Patrick Veldhuizen, Philip Quirke, Heike I. Grabsch, Piet A. van den Brandt, Gordon G.A. Hutchins, Susan D. Richman, Tanwei Yuan, Rupert Langer, Josien C.A. Jenniskens, Kelly Offermans, Wolfram Mueller, Richard Gray, Stephen B. Gruber, Joel K. Greenson, Gad Rennert, Joseph D. Bonner, Daniel Schmolze, Jitendra Jonnagaddala, Nicholas J. Hawkins, Robyn L. Ward, Dion Morton, Matthew Seymour, Laura Magill, Marta Nowak, Jennifer Hay, Viktor H. Koelzer, David N. Church, Christian Matek, Carol Geppert, Chaolong Peng, Cheng Zhi, Xiaoming Ouyang, Jacqueline A. James, Maurice B. Loughrey, Manuel Salto-Tellez, Hermann Brenner, Michael Hoffmeister, Daniel Truhn, Julia A. Schnabel, Melanie Boxberg, Tingying Peng, Jakob Nikolas Kather, David Church, Enric Domingo, Joanne Edwards, Bengt Glimelius, Ismail Gogenur, Andrea Harkin, Jen Hay, Timothy Iveson, Emma Jaeger, Caroline Kelly, Rachel Kerr, Noori Maka, Hannah Morgan, Karin Oien, Clare Orange, Claire Palles, Campbell Roxburgh, Owen Sansom, Mark Saunders, and Ian Tomlinson. Transformer-based biomarker prediction from colorectal cancer histology: A large-scale multicentric study. Cancer Cell, 41(9), September 2023. ISSN 1535-6108.
- Wang et al. [2024] Hongyi Wang, Xiuju Du, Jing Liu, Shuyi Ouyang, Yen-Wei Chen, and Lanfen Lin. M2ORT: Many-To-One Regression Transformer for Spatial Transcriptomics Prediction from Histopathology Images. arXiv, January 2024. doi: 10.48550/arXiv.2401.10608.
- Wang et al. [2019] Shuo Wang, Jingyun Shi, Zhaoxiang Ye, Di Dong, Dongdong Yu, Mu Zhou, Ying Liu, Olivier Gevaert, Kun Wang, Yongbei Zhu, et al. Predicting egfr mutation status in lung adenocarcinoma on computed tomography image using deep learning. European Respiratory Journal, 53(3), 2019.
- Wang et al. [2021] Xiyue Wang, Sen Yang, Jun Zhang, Minghui Wang, Jing Zhang, Junzhou Huang, Wei Yang, and Xiao Han. Transpath: Transformer-based self-supervised learning for histopathological image classification. In International Conference on Medical Image Computing and Computer-Assisted Intervention, pages 186–195. Springer, 2021.
- Wang et al. [2022] Xiyue Wang, Sen Yang, Jun Zhang, Minghui Wang, Jing Zhang, Wei Yang, Junzhou Huang, and Xiao Han. Transformer-based unsupervised contrastive learning for histopathological image classification. Medical Image Analysis, 81:102559, 2022.
- Wei et al. [2021] Jerry Wei, Arief Suriawinata, Bing Ren, Xiaoying Liu, Mikhail Lisovsky, Louis Vaickus, Charles Brown, Michael Baker, Naofumi Tomita, Lorenzo Torresani, et al. A petri dish for histopathology image analysis. In International Conference on Artificial Intelligence in Medicine, pages 11–24. Springer, 2021.
- Wolf et al. [2018] F. Alexander Wolf, Philipp Angerer, and Fabian J. Theis. SCANPY: large-scale single-cell gene expression data analysis. Genome Biol., 19(1):1–5, December 2018. ISSN 1474-760X. doi: 10.1186/s13059-017-1382-0.
- Wolf et al. [2007] Ido Wolf, Shikha Bose, Elizabeth A Williamson, Carl W Miller, Beth Y Karlan, and H Phillip Koeffler. Foxa1: Growth inhibitor and a favorable prognostic factor in human breast cancer. International journal of cancer, 120(5):1013–1022, 2007.
- Xiao and Yu [2021] Yi Xiao and Dihua Yu. Tumor microenvironment as a therapeutic target in cancer. Pharmacol. Ther., 221:107753, May 2021. ISSN 0163-7258. doi: 10.1016/j.pharmthera.2020.107753.
- Xie et al. [2023] Ronald Xie, Kuan Pang, Sai Chung, Catia Perciani, Sonya MacParland, Bo Wang, and Gary Bader. Spatially resolved gene expression prediction from histology images via bi-modal contrastive learning. In A. Oh, T. Neumann, A. Globerson, K. Saenko, M. Hardt, and S. Levine, editors, Advances in Neural Information Processing Systems, volume 36, pages 70626–70637. Curran Associates, Inc., 2023. URL https://proceedings.neurips.cc/paper_files/paper/2023/file/df656d6ed77b565e8dcdfbf568aead0a-Paper-Conference.pdf.
- Xu et al. [2021] Feng Xu, Chuang Zhu, Wenqi Tang, Ying Wang, Yu Zhang, Jie Li, Hongchuan Jiang, Zhongyue Shi, Jun Liu, and Mulan Jin. Predicting axillary lymph node metastasis in early breast cancer using deep learning on primary tumor biopsy slides. Frontiers in oncology, 11:759007, 2021.
- Xu et al. [2024] Hanwen Xu, Naoto Usuyama, Jaspreet Bagga, Sheng Zhang, Rajesh Rao, Tristan Naumann, Cliff Wong, Zelalem Gero, Javier González, Yu Gu, Yanbo Xu, Mu Wei, Wenhui Wang, Shuming Ma, Furu Wei, Jianwei Yang, Chunyuan Li, Jianfeng Gao, Jaylen Rosemon, Tucker Bower, Soohee Lee, Roshanthi Weerasinghe, Bill J. Wright, Ari Robicsek, Brian Piening, Carlo Bifulco, Sheng Wang, and Hoifung Poon. A whole-slide foundation model for digital pathology from real-world data. Nature, 630:181–188, June 2024. ISSN 1476-4687. doi: 10.1038/s41586-024-07441-w.
- Xue et al. [2023] Meilin Xue, Youwei Zhu, Yongsheng Jiang, Lijie Han, Minmin Shi, Rui Su, Liwen Wang, Cheng Xiong, Chaofu Wang, Ting Wang, Shijie Deng, Dong Wu, Yizhi Cao, Lei Dong, Fan Bai, Shulin Zhao, Xiaxing Deng, Chenghong Peng, Hongwei Li, Jianjun Chen, Baiyong Shen, Lingxi Jiang, and Hao Chen. Schwann cells regulate tumor cells and cancer-associated fibroblasts in the pancreatic ductal adenocarcinoma microenvironment. Nat. Commun., 14(4600):1–18, July 2023. ISSN 2041-1723. doi: 10.1038/s41467-023-40314-w.
- Yu et al. [2022] Jiahui Yu, Zirui Wang, Vijay Vasudevan, Legg Yeung, Mojtaba Seyedhosseini, and Yonghui Wu. Coca: Contrastive captioners are image-text foundation models. 2022.
- Zhang et al. [2024] Daiwei Zhang, Amelia Schroeder, Hanying Yan, Haochen Yang, Jian Hu, Michelle Y. Y. Lee, Kyung S. Cho, Katalin Susztak, George X. Xu, Michael D. Feldman, Edward B. Lee, Emma E. Furth, Linghua Wang, and Mingyao Li. Inferring super-resolution tissue architecture by integrating spatial transcriptomics with histology. Nat. Biotechnol., pages 1–6, January 2024. ISSN 1546-1696. doi: 10.1038/s41587-023-02019-9.
- Zhao et al. [2021] Edward Zhao, Matthew R. Stone, Xing Ren, Jamie Guenthoer, Kimberly S. Smythe, Thomas Pulliam, Stephen R. Williams, Cedric R. Uytingco, Sarah E. B. Taylor, Paul Nghiem, Jason H. Bielas, and Raphael Gottardo. Spatial transcriptomics at subspot resolution with BayesSpace. Nat. Biotechnol., 39:1375–1384, November 2021. ISSN 1546-1696. doi: 10.1038/s41587-021-00935-2.
- Zhao et al. [2024] Weiqin Zhao, Zhuo Liang, Xianjie Huang, Yuanhua Huang, and Lequan Yu. Hist2Cell: Deciphering Fine-grained Cellular Architectures from Histology Images. bioRxiv, page 2024.02.17.580852, February 2024. URL https://doi.org/10.1101/2024.02.17.580852.
- Zhou et al. [2022] Jinghao Zhou, Chen Wei, Huiyu Wang, Wei Shen, Cihang Xie, Alan Yuille, and Tao Kong. ibot: Image bert pre-training with online tokenizer. International Conference on Learning Representations (ICLR), 2022.