GraphEval2000: Benchmarking and Improving Large Language Models on Graph Datasets
Abstract
Large language models (LLMs) have achieved remarkable success in natural language processing (NLP), demonstrating significant capabilities in processing and understanding text data. However, recent studies have identified limitations in LLMs’ ability to reason about graph-structured data. To address this gap, we introduce GraphEval2000, the first comprehensive graph dataset, comprising 40 graph data structure problems along with 2000 test cases. Additionally, we introduce an evaluation framework based on GraphEval2000, designed to assess the graph reasoning abilities of LLMs through coding challenges. Our dataset categorizes test cases into four primary and four sub-categories, ensuring a comprehensive evaluation. We evaluate eight popular LLMs on GraphEval2000, revealing that LLMs exhibit a better understanding of directed graphs compared to undirected ones. While private LLMs consistently outperform open-source models, the performance gap is narrowing. Furthermore, to improve the usability of our evaluation framework, we propose Structured Symbolic Decomposition (SSD), an instruction-based method designed to enhance LLM performance on GraphEval2000. Results show that SSD improves the performance of GPT-3.5, GPT-4, and GPT-4o on complex graph problems, with the increase of , , and , respectively. GraphEval2000 is available at https://harrywuhust2022.github.io/GraphEval2000.
1 Introduction
Large language models (LLMs) GPTs (Achiam et al., 2023; Brown et al., 2020a; Chen et al., 2021), Gemini-Pro (Team et al., 2023), Gemini-1.5 (Reid et al., 2024), Claude-3-Haiku, Claude-3-Sonnet, Claude-3-Opus (Anthropic, 2024), LLaMA-3-70b (Touvron et al., 2023), and Mixtral-8x7b (Jiang et al., 2024) have achieved remarkable success in solving a wide range of natural language processing (NLP) tasks. For example, question answering (Devlin et al., 2018; Brown et al., 2020b; Raffel et al., 2020)), machine translation (Raffel et al., 2020; Brown et al., 2020b), text classification (Raffel et al., 2020; Yang et al., 2019; Liu et al., 2019), and text generation (Yang et al., 2019; Achiam et al., 2023).
However, their performance on complex graph reasoning tasks has been notably inadequate (Zhang, 2023). Current research highlights that while LLMs can handle basic graph-related queries, they have a challenge with more complex graph structures and multi-step reasoning processes (Liu and Wu, 2023; Wang et al., 2024; Creswell et al., 2022).
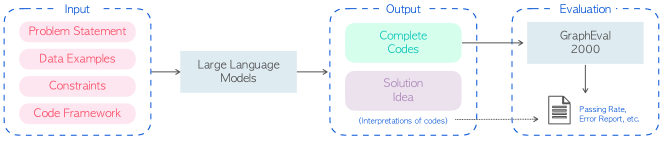
Recognizing the potential of leveraging LLMs’ programming capabilities in computational contexts (Yang et al., 2024; Murphy et al., 2024), we propose to use their programming abilities to enhance reasoning on graphs. To this end, we introduce GraphEval2000, the first dataset designed to evaluate the graph reasoning capability of LLMs through coding challenges. It includes 40 data structure problems and 2,000 test cases. Each problem includes: (1) problem statement, (2) data examples, (3) constraints, and (4) code framework. The dataset has four main graph categories: Sparse, Planar, Regular, and Complete graphs. Within each main category, there are four sub-categories: connected, disconnected, cyclic, and acyclic graphs. Based on GraphEval2000, we propose the evaluation framework, which provides real-time feedback to users. The entire framework is illustrated in Figure 1. Unlike traditional coding challenges (e.g., LeetCode) that obscure test case details (Hou and Ji, 2024; Hu et al., 2024), the framework will return failed test cases along with excution results.
To better help readers use our framework to evaluate and improve the performance of LLMs, we propose an instruction-based method, Structured Symbolic Decomposition (SSD). SSD is designed to enhance LLMs’ ability to understand and solve complex graph problems. Drawing inspiration from human cognitive strategies (Paas and van Merriënboer, 2020), SSD decomposes complex tasks into a “cognitive step” and an “action step”, thereby improving model comprehensions. Experiments demonstrate that SSD significantly boosts the performance of GPT-3.5, GPT-4, and GPT-4o in hard-level graph problems, yielding improvements of , , and , respectively. We hope this example inspires the community to further utilize our framework to explore LLMs’ reasoning abilities on graphs.
Our contributions are summarized as follows:
-
•
We propose GraphEval2000, the first graph dataset specifically designed to evaluate the graph reasoning abilities of LLMs through code. This dataset includes 40 data structure problems and 2000 graph test cases. It is organized into four primary graph categories, each containing four sub-categories, ensuring a diverse representation of graph structures;
-
•
Based on GraphEval2000, we propose an evaluation framework to systematically assess the graph reasoning abilities of LLMs. This framework not only tests the models but also provides real-time feedback, enabling users to iteratively improve their models’ performance;
-
•
We have established the first benchmark for LLMs on graph data structure problems, involving eight of the most popular LLMs. Our experiment reveals that LLMs understand directed graph structures better than undirected ones. While open-source models generally underperform relative to private LLMs, the performance gap is narrow, and in certain graph categories, they demonstrate comparable performance.
-
•
To enhance the usability of our evaluation framework and GraphEval2000, we proposed Structured Symbolic Decomposition (SSD), an instruction-based method. SSD decomposes complicated problems into distinct reasoning components, facilitating better understanding by LLMs. Experimental results demonstrate the effectiveness of SSD, resulting in an average improvement in performance for GPT-3.5, GPT-4 and GPT-4o.
-
•
GraphEval2000 is released under MIT license. The dataset is available at https://harrywuhust2022.github.io/GraphEval2000.
2 Related Work
2.1 LLMs on Graph Reasoning
Recent research has investigated the application of LLMs for handling graph data and reasoning tasks. These studies have utilized LLMs as predictors to generate answers for graph problems. Currently, the proposed methods can be classified into the following two categories:
Direct Answering
LLMs are provided with a graph and are required to return answers to related questions. Researchers have found that LLMs can provide a preliminary understanding of simple graph structures and answer basic questions such as “count the number of nodes”, “identify node degrees”, and “determine connectivity”. However, their performance declines significantly when the graph structures become complex or when more intricate reasoning is required (Jin et al., 2023; Wang et al., 2024; Liu and Wu, 2023; Guo et al., 2023). Notably, providing additional examples in a few-shot learning scenario can improve performance on easier problems, although the improvement is marginal (Zhang et al., 2023b; Fatemi et al., 2023; Chai et al., 2023).
Heuristic Reasoning
Due to the difficulty for LLMs to directly produce correct answers based on the input, and inspired by the Chain-of-Thought (CoT) method (Wei et al., 2022; Kojima et al., 2022), researchers have proposed a step-by-step reasoning approach for graph problems, known as zero-shot CoT. This technique has been widely studied (Chai et al., 2023; Wang et al., 2024; Liu and Wu, 2023; Guo et al., 2023; Zhang et al., 2023b; Fatemi et al., 2023; Sun et al., 2023), but the observed improvements remain limited.
2.2 Enhancing LLM Reasoning through Code Utilization
Recent research has demonstrated that LLMs exhibit superior reasoning capabilities in code-prompted scenarios compared to text-prompted ones (Suzgun et al., 2022; Liang et al., 2023; Hendy et al., 2023). Researchers have transformed natural language problems into code prompts to facilitate better interaction with LLMs, thereby enhancing their reasoning abilities (Madaan et al., 2022; Zhang et al., 2023a; Bi et al., 2024; Dong et al., 2022; Yan et al., 2023). This insight leads us to evaluate the graph reasoning abilities of LLMs on data structure problems by assessing the code generated by these models. Moreover, by prompting LLMs to generate more accurate code, we aim to further improve their reasoning capabilities on graphs, thereby advancing the research in this area.
3 Dataset Construction
3.1 Data Collection
Problem Set
We collected a total of 40 graph data structure problems from the LeetCode111https://leetcode.com/tag/graph/, comprising 20 undirected and 20 directed graph problems. Most of these problems are recently released, which minimizes the likelihood of their inclusion in the training sets of the verification LLMs. The majority of these problems are classified as medium- and hard-level according to their difficulty.
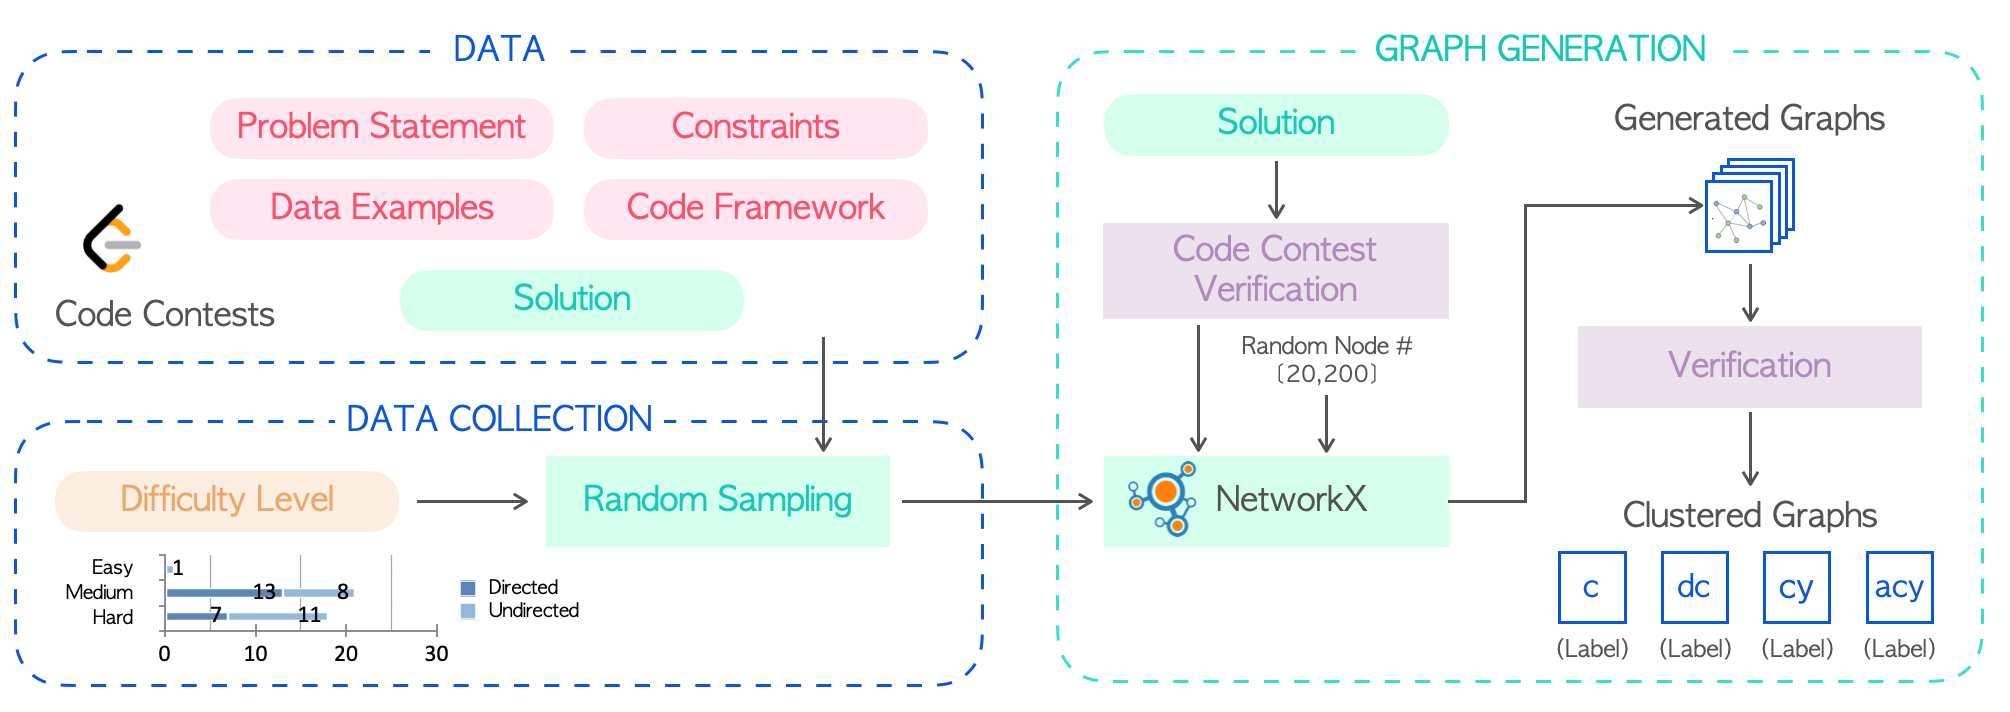
For each selected problem, we collected the following contents: problem statement, input/output examples, data constraints, and code framework. This information, accessible on the LeetCode website, was then stored in the format of JSONL strings. Finally, based on the keywords in the problem statement, we classified these problems as either directed or undirected graphs. The whole process is summarized in the left part of Figure 2.
3.2 Graph Generation
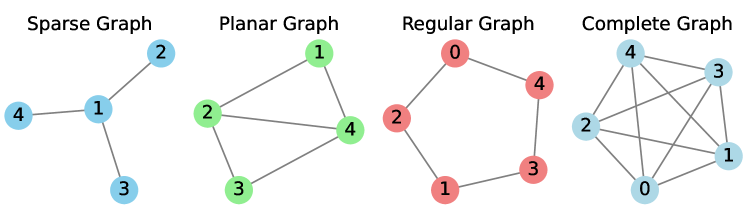
Consider a graph , where denotes the set of vertices and denotes the set of edges in the graph. We classify graphs into four main categories: Sparse Graph, Planar Graph, Regular Graph, and Complete Graph. Below, we provide definitions of these graphs using mathematical notations.
Sparse Graph
A graph is considered sparse if the number of edges is much less than the maximum possible number of edges, which is
| (1) |
Planar Graph
A planar graph is one that can be drawn such that no edges intersect at any point that is not a vertex. For a finite, connected planar graph with faces, the following holds:
| (2) |
Regular Graph
A graph is -regular if every vertex has the same degree . That is,
| (3) |
Complete Graph
A graph is complete if there is an edge between every pair of distinct vertices. The number of edges in a complete graph with is:
| (4) |
Graph Classification
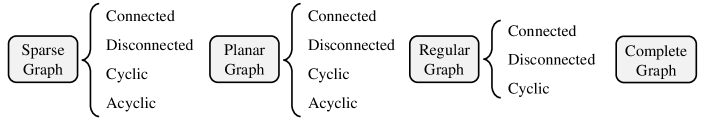
To diversify the graph data and encompass a broader range of edge cases, we have developed four sub-categories within each main category. These sub-categories include connected graphs, disconnected graphs, cyclic graphs, and acyclic graphs. However, due to the inherent characteristics of the main categories, some sub-categories require adjustments. For example, a planar graph inherently contains cycles, thus it cannot be classified as acyclic. After these adjustments, we have identified 11 distinct types of graphs. The adjusted graph classification is presented in Figure 3.
To efficiently manage the graph generation process, we utilize “NetworkX” (Developers, 2024), a widely used Python package for creating and analyzing complex networks. Leveraging the NetworkX framework, we can easily construct both directed and undirected graphs according to our classification requirements. Specifically, we generate 10 graph samples for each sub-category, with the number of vertices in each graph being a random integer between 20 and 200. This approach allows us to create a graph dataset with varying levels of complexity.
As most recently-released problems do not have official answers, we select the solutions with the most votes for each problem as our label generation code. These solutions have been verified by the LeetCode contest. Subsequently, we run the solution code on graph test cases to generate the corresponding labels. The overview of this pipeline is summarized in the right part of Figure 2.
4 Evaluations
Experimental Setup
For our experiments, we evaluate the reasoning abilities of LLMs using two approaches: assessment on the LeetCode platform and evaluation against our proposed dataset. The first approach employs the LeetCode platform to estimate LLM performance on graph data structure problems. This method, widely adopted by researchers, serves as a common benchmark to determine whether the model has comprehensively understood the problem (Hou and Ji, 2024). In presenting the experimental results, we categorize the data into two parts: directed and undirected graphs. This division allows for a nuanced analysis of the LLMs’ understanding of different graph structures.
Assessment on the LeetCode Platform
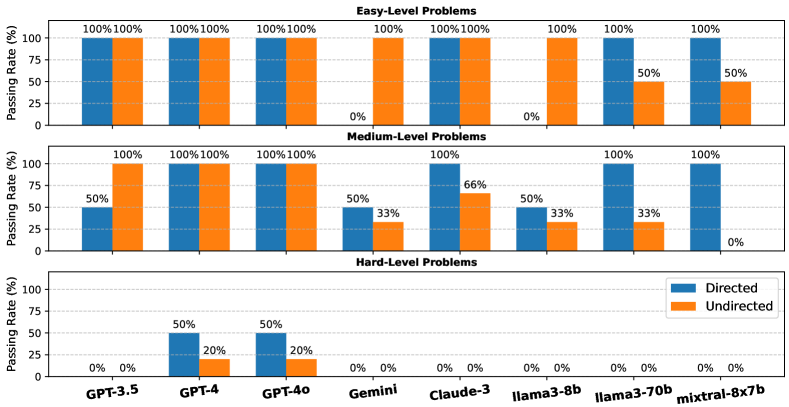
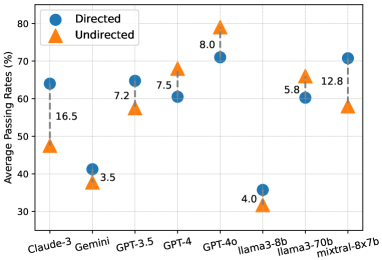
We selected a total of 17 graph data structure problems from the LeetCode platform for evaluation, categorized into 3 easy-level, 5 medium-level, and 9 hard-level problems, with difficulty levels defined by LeetCode. The evaluation process involved incorporating the problem statement, data examples, and code framework into a prompt. The LLMs were then tasked with generating a complete code based on this prompt. The generated code was subsequently tested on the LeetCode platform to assess its accuracy and performance. The summarized results of this assessment are presented in Figure 4:
-
•
For easy-level problems, most LLMs successfully pass the directed graph problems. Interestingly, private LLMs (e.g., the GPT family, Gemini, and Claude-3) outperform open-source LLMs (e.g., the LLaMA family and mixtral-8x7b) on undirected graph problems.
-
•
For medium-level problems, LLMs demonstrate a better understanding of directed graph problems compared to undirected ones. Open-source LLMs perform worse than private LLMs, with a passing rate lower than 50%. However, private LLMs and open-source LLMs perform comparably on directed graph problems.
-
•
For hard-level problems, only GPT-4 and GPT-4o achieve a 50% passing rate on directed graph problems and a 20% passing rate on undirected ones. All other LLMs fail to pass these problems, indicating that the GPT model exhibits the strongest reasoning ability among the tested LLMs.
|
|
|
|
|
|
|
|
||||||||||||||||||
| S G | c | 66 | 39 | 46 | 42 | 59 | 48 | 58 | 67 | 62 | 78 | 39 | 29 | 69 | 68 | 76 | 54 | ||||||||||||||||
| dc | 56 | 42 | 32 | 38 | 61 | 63 | 65 | 70 | 82 | 83 | 26 | 33 | 54 | 66 | 65 | 64 | |||||||||||||||||
| cy | 71 | 59 | 46 | 33 | 64 | 70 | 50 | 76 | 58 | 84 | 42 | 41 | 67 | 72 | 73 | 62 | |||||||||||||||||
| acy | 63 | 50 | 41 | 38 | 75 | 49 | 69 | 59 | 82 | 71 | 36 | 24 | 51 | 58 | 69 | 52 | |||||||||||||||||
| P G | c | 80 | 38 | 75 | 34 | 75 | 47 | 60 | 60 | 60 | 75 | 60 | 26 | 75 | 77 | 60 | 53 | ||||||||||||||||
| dc | 65 | 50 | 39 | 45 | 64 | 58 | 78 | 76 | 88 | 84 | 29 | 28 | 52 | 62 | 65 | 62 | |||||||||||||||||
| cy | 68 | 52 | 46 | 36 | 62 | 70 | 58 | 76 | 67 | 83 | 38 | 38 | 65 | 76 | 65 | 59 | |||||||||||||||||
| acy | 57 | 48 | 42 | 46 | 68 | 49 | 71 | 62 | 81 | 77 | 30 | 23 | 41 | 67 | 61 | 57 | |||||||||||||||||
| R G | c | NA | 63 | NA | 39 | NA | 69 | NA | 83 | NA | 93 | NA | 52 | NA | 78 | NA | 72 | ||||||||||||||||
| dc | NA | 67 | NA | 39 | NA | 61 | NA | 89 | NA | 96 | NA | 44 | NA | 80 | NA | 74 | |||||||||||||||||
| cy | NA | 81 | NA | 50 | NA | 74 | NA | 87 | NA | 99 | NA | 57 | NA | 84 | NA | 77 | |||||||||||||||||
|
c | NA | 33 | NA | 50 | NA | 67 | NA | 86 | NA | 88 | NA | 43 | NA | 67 | NA | 57 | ||||||||||||||||
Evaluating LLMs on GraphEval2000
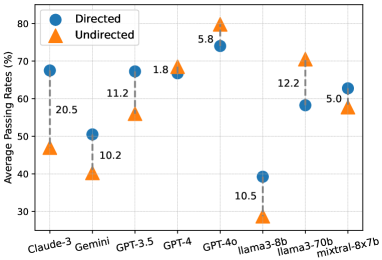
As illustrated in Figure 3, the GraphEval2000 has four main categories and four sub-categories. However, due to the common constraints of input data in directed graph problems, we can only apply planar and sparse graphs to them. For example, many directed graph problems require a Directed Acyclic Graph (DAG) as input, making it impractical to apply regular and complex graphs to these problems. To analyze the results in Table 1 and Figure 5, we will answer the following questions: 1. What is the performance difference between private and open-sourced models? 2. How are the performances of LLMs on directed and undirected graph problems? 3. How are the performances of LLMs on each main graph category?
-
•
Private models, especially GPT-4 and GPT-4o, consistently outperform open-sourced models across all graph categories. The performance gap is most pronounced in complex graph types such as regular and complete graphs, where private models achieve passing rates close to 100%, while open-sourced models like Mixtral manage competitive but lower rates around 70-80%.
-
•
LLMs generally perform better on directed graphs than undirected graphs (as shown in Figure 5). The performance gap between private and open-sourced models is more pronounced in directed graph samples, highlighting the strength of private models in handling directed graph complexities. Private models, such as Claude-3 and GPT-3.5, typically exhibit a larger performance gap between directed and undirected graphs compared to open-source models. Interestingly, GPT-4 and GPT-4o seem to understand undirected graphs better than directed graphs.
-
•
Private models consistently outperform across all graph categories, with GPT-4o leading in most cases and achieving near-perfect scores in complex graph types like regular and complete graphs. Open-sourced models like mixtral-8x7b show competitive performance but remain behind private models. llama3 models, particularly llama3-8b, exhibit lower performance, indicating potential areas for improvement. The performance gap is most pronounced in directed graph samples and complex graph structures.
5 Unleashing the Power of LLMs on Graph Solving via GraphEval2000
To enhance the usability of our evaluation framework and GraphEval2000, we introduce Structured Symbolic Decomposition (SSD), an instruction-based method utilizing test cases from GraphEval2000 for graph problems. Our approach aims to enable LLMs to perform better graph reasoning, especially, for hard-level problems.
5.1 Methodology
We hypothesize that breaking down complex graph problems into smaller, more manageable sub-problems and turning them into symbolic forms (Dinu et al., 2024; Fang et al., 2024; Yang et al., 2024) will enhance the problem-solving capabilities of LLMs. Current methods rely on implicit knowledge and lack explicit guidance (Wei et al., 2022; Jin et al., 2024; Huang et al., 2024), leading to suboptimal performance, especially in complex scenarios. Our method mirrors human cognitive strategies (Paas and van Merriënboer, 2020; Romero et al., 2023), which simplify complex tasks by decomposing them into two parts: cognitive step and action step, thereby improving comprehension and facilitating more effective solutions. We selected the problems from GraphEval2000 to be evaluation problems. The test cases are used for problem understanding and program testing.
5.1.1 Instructions for LLM
The instructions are composed of four parts: problem clarification, problem breakdown, solution formulation, and program implementation.
-
•
Problem Clarification:
1. Cognitive Step: You must first understand and clearly articulate the problem, including all inputs and desired outputs.
2. Action Step: Identify and list any specific rules, constraints, or conditions that influence the solution. Use the [test case] examples to assist the understanding. -
•
Problem Breakdown:
1. Cognitive Step: Decompose the problem into smaller, manageable sub-problems, translating it into a symbolic form and identifying the key components and relationships within the problem.
2. Action Step: Outline the sequential steps required to solve the overall problem. -
•
Solution Formulation:
1. Cognitive Step: Formulate solving strategies using the symbolic form developed in the previous step and define the algorithms and methods needed to address each sub-problem.
2. Action Step: Detail the algorithms and approaches for each sub-problem, ensuring they are logically connected and comprehensive. -
•
Program Implementation:
1. Cognitive Step: Conceptualize the implementation of each solution component.
2. Action Step: Write a program for each breakdown part, ensuring it aligns with the formulated strategy. Run [test cases] to verify the correctness of each component.
We demonstrate the comparison of SSD-enhanced graph reasoning with CoT-based graph reasoning in Box 5.1.1. The LLM we used is GPT-4o. The demonstration involves a hard-level question and a test case from GraphEval2000. The reasoning processes are represented in green boxes (“SSD-enhanced GPT-4o’s Graph Reasoning” and “CoT-based GPT-4o’s Graph Reasoning”), and the code details are provided in Listings 1 and 2. Our results show that the SSD-enhanced GPT-4o reduces hallucinations and improves graph reasoning capabilities. In the following, we evaluate our method on a set of hard-level graph problem selected from GraphEval2000.
| GPT-3.5 | GPT-4 | GPT-4o | |
|---|---|---|---|
| Easy-level (3) | 100% | 100% | 100% |
| Medium-level (5) | 80% | 100% | 100% |
| Hard-level (9) | 0% | 33.30% | 33.30% |
| Hard-level (9) + SSD | 11.11% | 66.67% | 66.67% |
| Performance Gain | +11.11% | +33.37% | +33.37% |
![[Uncaptioned image]](/html/2406.16176/assets/x6.png)
5.2 Results
We conducted experiments using three versions of GPT models (GPT-3.5, GPT-4, and GPT-4o) on a set of hard-level graph problems (the same as Figure 4). Given the near-perfect performance on easy- and medium-level problems, our evaluation focuses primarily on the hard-level problems from GraphEval2000. We compare the performance of SSD method with the CoT-based method. The results are shown in Table 2 and Figure 6. All the settings are the same as in Figure 4. Our method outperforms the CoT-based method on three GPT models, demonstrating the effectiveness of SSD in enhancing LLMs’ graph reasoning capabilities. The increase from a 0% passing rate to 11.11% with GPT-3.5, and 33.30% to 66.67% with GPT-4 and GPT-4o. This improvement validates our hypothesis that a structured, decomposed framework with test cases aids LLMs in solving complex graph problems. We notice that the performance of GPT-3.5 is not improved as much as the other two models. This is because GPT-3.5 has a smaller model size and may not have enough knowledge to solve the hard-level graph problems.
6 Conclusion
We introduce GraphEval2000, the first graph dataset that help evaluate the reasoning ability of LLMs through coding challenges. It includes 40 data structure problems with 2000 graph test cases. To better help readers use our dataset, we propose SSD, an instruction-based method, to improve the reasoning ability of LLMs. Our experimental results validate the usefulness and effectiveness of GraphEval2000 and SSD.
References
- Achiam et al. (2023) Josh Achiam, Steven Adler, Sandhini Agarwal, Lama Ahmad, Ilge Akkaya, Florencia Leoni Aleman, Diogo Almeida, Janko Altenschmidt, Sam Altman, Shyamal Anadkat, et al. Gpt-4 technical report. arXiv preprint arXiv:2303.08774, 2023.
- Anthropic (2024) Anthropic. Introducing the next generation of claude. https://www.anthropic.com/ news/claude-3-family/, 2024.
- Bi et al. (2024) Zhen Bi, Jing Chen, Yinuo Jiang, Feiyu Xiong, Wei Guo, Huajun Chen, and Ningyu Zhang. Codekgc: Code language model for generative knowledge graph construction. ACM Transactions on Asian and Low-Resource Language Information Processing, 23(3):1–16, 2024.
- Brown et al. (2020a) Tom Brown, Benjamin Mann, Nick Ryder, Melanie Subbiah, Jared D Kaplan, Prafulla Dhariwal, Arvind Neelakantan, Pranav Shyam, Girish Sastry, Amanda Askell, et al. Language models are few-shot learners. Advances in neural information processing systems, 33:1877–1901, 2020a.
- Brown et al. (2020b) Tom Brown, Benjamin Mann, Nick Ryder, Melanie Subbiah, Jared D Kaplan, Prafulla Dhariwal, Arvind Neelakantan, Pranav Shyam, Girish Sastry, Amanda Askell, et al. Language models are few-shot learners. Advances in neural information processing systems, 33:1877–1901, 2020b.
- Chai et al. (2023) Ziwei Chai, Tianjie Zhang, Liang Wu, Kaiqiao Han, Xiaohai Hu, Xuanwen Huang, and Yang Yang. Graphllm: Boosting graph reasoning ability of large language model. arXiv preprint arXiv:2310.05845, 2023.
- Chen et al. (2021) Mark Chen, Jerry Tworek, Heewoo Jun, Qiming Yuan, Henrique Ponde de Oliveira Pinto, Jared Kaplan, Harri Edwards, Yuri Burda, Nicholas Joseph, Greg Brockman, et al. Evaluating large language models trained on code. arXiv preprint arXiv:2107.03374, 2021.
- Creswell et al. (2022) Antonia Creswell, Murray Shanahan, and Irina Higgins. Selection-inference: Exploiting large language models for interpretable logical reasoning. arXiv preprint arXiv:2205.09712, 2022.
- Developers (2024) NetworkX Developers. Networkx homepage. https://networkx.org/, 2024.
- Devlin et al. (2018) Jacob Devlin, Ming-Wei Chang, Kenton Lee, and Kristina Toutanova. Bert: Pre-training of deep bidirectional transformers for language understanding. arXiv preprint arXiv:1810.04805, 2018.
- Dinu et al. (2024) Marius-Constantin Dinu, Claudiu Leoveanu-Condrei, Markus Holzleitner, Werner Zellinger, and Sepp Hochreiter. Symbolicai: A framework for logic-based approaches combining generative models and solvers. arXiv preprint arXiv:2402.00854, 2024.
- Dong et al. (2022) Yijiang River Dong, Lara J Martin, and Chris Callison-Burch. Corrpus: Code-based structured prompting for neurosymbolic story understanding. arXiv preprint arXiv:2212.10754, 2022.
- Fang et al. (2024) Meng Fang, Shilong Deng, Yudi Zhang, Zijing Shi, Ling Chen, Mykola Pechenizkiy, and Jun Wang. Large language models are neurosymbolic reasoners. arXiv preprint arXiv:2401.09334, 2024.
- Fatemi et al. (2023) Bahare Fatemi, Jonathan Halcrow, and Bryan Perozzi. Talk like a graph: Encoding graphs for large language models. arXiv preprint arXiv:2310.04560, 2023.
- Gebru et al. (2021) Timnit Gebru, Jamie Morgenstern, Briana Vecchione, Jennifer Wortman Vaughan, Hanna Wallach, Hal Daumé Iii, and Kate Crawford. Datasheets for datasets. Communications of the ACM, 64(12):86–92, 2021.
- Guo et al. (2023) Jiayan Guo, Lun Du, Hengyu Liu, Mengyu Zhou, Xinyi He, and Shi Han. Gpt4graph: Can large language models understand graph structured data? an empirical evaluation and benchmarking. arXiv preprint arXiv:2305.15066, 2023.
- Hendy et al. (2023) Amr Hendy, Mohamed Gomaa Abdelrehim, Amr Sharaf, Vikas Raunak, Mohamed Gabr, Hitokazu Matsushita, Young Jin Kim, Mohamed Afify, and Hany Hassan Awadalla. How good are gpt models at machine translation? a comprehensive evaluation. ArXiv, abs/2302.09210, 2023. URL https://api.semanticscholar.org/CorpusID:257038384.
- Hou and Ji (2024) Wenpin Hou and Zhicheng Ji. A systematic evaluation of large language models for generating programming code. arXiv preprint arXiv:2403.00894, 2024.
- Hu et al. (2024) Xueyu Hu, Kun Kuang, Jiankai Sun, Hongxia Yang, and Fei Wu. Leveraging print debugging to improve code generation in large language models. arXiv preprint arXiv:2401.05319, 2024.
- Huang et al. (2024) Qian Huang, Hongyu Ren, Peng Chen, Gregor Kržmanc, Daniel Zeng, Percy S Liang, and Jure Leskovec. Prodigy: Enabling in-context learning over graphs. Advances in Neural Information Processing Systems, 36, 2024.
- Jiang et al. (2024) Albert Q Jiang, Alexandre Sablayrolles, Antoine Roux, Arthur Mensch, Blanche Savary, Chris Bamford, Devendra Singh Chaplot, Diego de las Casas, Emma Bou Hanna, Florian Bressand, et al. Mixtral of experts. arXiv preprint arXiv:2401.04088, 2024.
- Jin et al. (2023) Bowen Jin, Gang Liu, Chi Han, Meng Jiang, Heng Ji, and Jiawei Han. Large language models on graphs: A comprehensive survey. arXiv preprint arXiv:2312.02783, 2023.
- Jin et al. (2024) Bowen Jin, Chulin Xie, Jiawei Zhang, Kashob Kumar Roy, Yu Zhang, Suhang Wang, Yu Meng, and Jiawei Han. Graph chain-of-thought: Augmenting large language models by reasoning on graphs. arXiv preprint arXiv:2404.07103, 2024.
- Kojima et al. (2022) Takeshi Kojima, Shixiang Shane Gu, Machel Reid, Yutaka Matsuo, and Yusuke Iwasawa. Large language models are zero-shot reasoners. Advances in neural information processing systems, 35:22199–22213, 2022.
- Liang et al. (2023) Percy Liang, Rishi Bommasani, Tony Lee, Dimitris Tsipras, Dilara Soylu, Michihiro Yasunaga, Yian Zhang, Deepak Narayanan, Yuhuai Wu, Ananya Kumar, Benjamin Newman, Binhang Yuan, Bobby Yan, Ce Zhang, Christian Cosgrove, Christopher D. Manning, Christopher R’e, Diana Acosta-Navas, Drew A. Hudson, E. Zelikman, Esin Durmus, Faisal Ladhak, Frieda Rong, Hongyu Ren, Huaxiu Yao, Jue Wang, Keshav Santhanam, Laurel J. Orr, Lucia Zheng, Mert Yuksekgonul, Mirac Suzgun, Nathan S. Kim, Neel Guha, Niladri S. Chatterji, O. Khattab, Peter Henderson, Qian Huang, Ryan Chi, Sang Michael Xie, Shibani Santurkar, Surya Ganguli, Tatsunori Hashimoto, Thomas F. Icard, Tianyi Zhang, Vishrav Chaudhary, William Wang, Xuechen Li, Yifan Mai, Yuhui Zhang, and Yuta Koreeda. Holistic evaluation of language models. Annals of the New York Academy of Sciences, 1525:140 – 146, 2023. URL https://api.semanticscholar.org/CorpusID:253553585.
- Liu and Wu (2023) Chang Liu and Bo Wu. Evaluating large language models on graphs: Performance insights and comparative analysis. arXiv preprint arXiv:2308.11224, 2023.
- Liu et al. (2019) Yinhan Liu, Myle Ott, Naman Goyal, Jingfei Du, Mandar Joshi, Danqi Chen, Omer Levy, Mike Lewis, Luke Zettlemoyer, and Veselin Stoyanov. Roberta: A robustly optimized bert pretraining approach. arXiv preprint arXiv:1907.11692, 2019.
- Madaan et al. (2022) Aman Madaan, Shuyan Zhou, Uri Alon, Yiming Yang, and Graham Neubig. Language models of code are few-shot commonsense learners. In Yoav Goldberg, Zornitsa Kozareva, and Yue Zhang, editors, Proceedings of the 2022 Conference on Empirical Methods in Natural Language Processing, pages 1384–1403, Abu Dhabi, United Arab Emirates, December 2022. Association for Computational Linguistics. doi: 10.18653/v1/2022.emnlp-main.90. URL https://aclanthology.org/2022.emnlp-main.90.
- Murphy et al. (2024) Logan Murphy, Kaiyu Yang, Jialiang Sun, Zhaoyu Li, Anima Anandkumar, and Xujie Si. Autoformalizing euclidean geometry. arXiv preprint arXiv:2405.17216, 2024.
- Paas and van Merriënboer (2020) Fred Paas and Jeroen JG van Merriënboer. Cognitive-load theory: Methods to manage working memory load in the learning of complex tasks. Current Directions in Psychological Science, 29(4):394–398, 2020.
- Raffel et al. (2020) Colin Raffel, Noam Shazeer, Adam Roberts, Katherine Lee, Sharan Narang, Michael Matena, Yanqi Zhou, Wei Li, and Peter J Liu. Exploring the limits of transfer learning with a unified text-to-text transformer. Journal of machine learning research, 21(140):1–67, 2020.
- Reid et al. (2024) Machel Reid, Nikolay Savinov, Denis Teplyashin, Dmitry Lepikhin, Timothy Lillicrap, Jean-baptiste Alayrac, Radu Soricut, Angeliki Lazaridou, Orhan Firat, Julian Schrittwieser, et al. Gemini 1.5: Unlocking multimodal understanding across millions of tokens of context. arXiv preprint arXiv:2403.05530, 2024.
- Romero et al. (2023) Oscar J Romero, John Zimmerman, Aaron Steinfeld, and Anthony Tomasic. Synergistic integration of large language models and cognitive architectures for robust ai: An exploratory analysis. In Proceedings of the AAAI Symposium Series, volume 2, pages 396–405, 2023.
- Sun et al. (2023) Jiashuo Sun, Chengjin Xu, Lumingyuan Tang, Saizhuo Wang, Chen Lin, Yeyun Gong, Heung-Yeung Shum, and Jian Guo. Think-on-graph: Deep and responsible reasoning of large language model with knowledge graph. arXiv preprint arXiv:2307.07697, 2023.
- Suzgun et al. (2022) Mirac Suzgun, Nathan Scales, Nathanael Scharli, Sebastian Gehrmann, Yi Tay, Hyung Won Chung, Aakanksha Chowdhery, Quoc V. Le, Ed Huai hsin Chi, Denny Zhou, and Jason Wei. Challenging big-bench tasks and whether chain-of-thought can solve them. In Annual Meeting of the Association for Computational Linguistics, 2022. URL https://api.semanticscholar.org/CorpusID:252917648.
- Team et al. (2023) Gemini Team, Rohan Anil, Sebastian Borgeaud, Yonghui Wu, Jean-Baptiste Alayrac, Jiahui Yu, Radu Soricut, Johan Schalkwyk, Andrew M Dai, Anja Hauth, et al. Gemini: a family of highly capable multimodal models. arXiv preprint arXiv:2312.11805, 2023.
- Touvron et al. (2023) Hugo Touvron, Louis Martin, Kevin Stone, Peter Albert, Amjad Almahairi, Yasmine Babaei, Nikolay Bashlykov, Soumya Batra, Prajjwal Bhargava, Shruti Bhosale, et al. Llama 2: Open foundation and fine-tuned chat models. arXiv preprint arXiv:2307.09288, 2023.
- Wang et al. (2024) Heng Wang, Shangbin Feng, Tianxing He, Zhaoxuan Tan, Xiaochuang Han, and Yulia Tsvetkov. Can language models solve graph problems in natural language? Advances in Neural Information Processing Systems, 36, 2024.
- Wei et al. (2022) Jason Wei, Xuezhi Wang, Dale Schuurmans, Maarten Bosma, Fei Xia, Ed Chi, Quoc V Le, Denny Zhou, et al. Chain-of-thought prompting elicits reasoning in large language models. Advances in neural information processing systems, 35:24824–24837, 2022.
- Yan et al. (2023) Weixiang Yan, Haitian Liu, Yunkun Wang, Yunzhe Li, Qian Chen, Wen Wang, Tingyu Lin, Weishan Zhao, Li Zhu, Shuiguang Deng, et al. Codescope: An execution-based multilingual multitask multidimensional benchmark for evaluating llms on code understanding and generation. arXiv preprint arXiv:2311.08588, 2023.
- Yang et al. (2024) Kaiyu Yang, Aidan Swope, Alex Gu, Rahul Chalamala, Peiyang Song, Shixing Yu, Saad Godil, Ryan J Prenger, and Animashree Anandkumar. Leandojo: Theorem proving with retrieval-augmented language models. Advances in Neural Information Processing Systems, 36, 2024.
- Yang et al. (2019) Zhilin Yang, Zihang Dai, Yiming Yang, Jaime Carbonell, Russ R Salakhutdinov, and Quoc V Le. Xlnet: Generalized autoregressive pretraining for language understanding. Advances in neural information processing systems, 32, 2019.
- Zhang (2023) Jiawei Zhang. Graph-toolformer: To empower llms with graph reasoning ability via prompt augmented by chatgpt. arXiv e-prints, pages arXiv–2304, 2023.
- Zhang et al. (2023a) Li Zhang, Hainiu Xu, Yue Yang, Shuyan Zhou, Weiqiu You, Manni Arora, and Chris Callison-Burch. Causal reasoning of entities and events in procedural texts. In Andreas Vlachos and Isabelle Augenstein, editors, Findings of the Association for Computational Linguistics: EACL 2023, pages 415–431, Dubrovnik, Croatia, May 2023a. Association for Computational Linguistics. doi: 10.18653/v1/2023.findings-eacl.31. URL https://aclanthology.org/2023.findings-eacl.31.
- Zhang et al. (2023b) Zeyang Zhang, Xin Wang, Ziwei Zhang, Haoyang Li, Yijian Qin, Simin Wu, and Wenwu Zhu. Llm4dyg: Can large language models solve problems on dynamic graphs? arXiv preprint arXiv:2310.17110, 2023b.
Appendix A Datasheet for GraphEval2000
To better help users understand our dataset, we follow the questions in [Gebru et al., 2021] to create a datasheet. Our dataset is available for downloading at the webpage here (https://harrywuhust2022.github.io/GraphEval2000/).
A.1 Motivation
For what purpose was the dataset created? Was there a specific task in mind? Was there a specific gap that needed to be filled? Please provide a description.
This dataset is designed to evaluate and enhance the reasoning capabilities of large language models (LLMs) in addressing graph-related problems. By providing LLMs with materials such as problem statements, data examples, and code frameworks, they can generate complete code solutions. Researchers can then assess the accuracy and effectiveness of these solutions using our proposed dataset.
Who created the dataset (e.g., which team, research group) and on behalf of which entity (e.g., company, institution, organization)?
The dataset is created by Qiming Wu, Zichen Chen, Will Corcoran, Misha Sra and Ambuj Singh in the University of California, Santa Barbara.
Who funded the creation of the dataset? If there is an associated grant, please provide the name of the grantor and the grant name and number.
Ambuj Singh.
A.2 Composition
What do the instances that comprise the dataset represent (e.g., documents, photos, people, countries)? Are there multiple types of instances (e.g., movies, users, and ratings; people and interactions between them; nodes and edges)? Please provide a description.
The instances are graph data structure problems and graph test cases. We extract the problems from LeetCode community (https://LeetCode.com/tag/graph/) and generate graph test cases by python programming.
How many instances are there in total (of each type, if appropriate)?
There are 2850 graph test cases in our dataset totally. Specifically, there are 1110 directed graph samples and 1740 undirected ones.
Does the dataset contain all possible instances or is it a sample (not necessarily random) of instances from a larger set? If the dataset is a sample, then what is the larger set? Is the sample representative of the larger set (e.g., geographic coverage)? If so, please describe how this representativeness was validated/verified. If it is not representative of the larger set, please describe why not (e.g., to cover a more diverse range of instances, because instances were withheld or unavailable).
GraphEval2000 contains all possible instances. However, users can scale this dataset by generating more graph test cases based on our provided code.
Is there a label or target associated with each instance? If so, please provide a description.
Yes. Each graph instance are associated with a label, which is the correct answer of that graph problem. This label is contained in the dataset.
Are relationships between individual instances made explicit (e.g., users’ movie ratings, social network links)? If so, please describe how these relationships are made explicit.
Yes. One instance of GraphEval2000 contains the following contents: Problem Statement, Data Examples, Code Framework, and graph test cases. The first three materials give an overview of the data structure problem to the LLMs, and graph test cases are used to evaluate the generated code.
Are there recommended data splits (e.g., training, development/validation, testing)? If so, please provide a description of these splits, explaining the rationale behind them.
Not applicable. Our dataset is mainly used in the inference phase of LLMs, it does not relate to the training phase.
Does the dataset contain data that, if viewed directly, might be offensive, insulting, threatening, or might otherwise cause anxiety? If so, please describe why
No. The problem materials are all available at the LeetCode community (https://LeetCode.com/tag/graph/) and the graph test cases are presented in the way of python list.
Does the dataset identify any subpopulations (e.g., by age, gender)? If so, please describe how these subpopulations are identified and provide a description of their respective distributions within the dataset.
No.
Does the dataset contain data that might be considered sensitive in any way (e.g., data that reveals race or ethnic origins, sexual orientations, religious beliefs, political opinions or union memberships, or locations; financial or health data; biometric or genetic data; forms of government identification, such as social security numbers; criminal history)? If so, please provide a description.
No.
Does the dataset contain data that might be considered confidential (e.g., data that is protected by legal privilege or by doctor–patient confidentiality, data that includes the content of individuals’ nonpublic communications)? If so, please provide a description.
No.
A.3 Collection Process
How was the data associated with each instance acquired? Was the data directly observable (e.g., raw text, movie ratings), reported by subjects (e.g., survey responses), or indirectly inferred/derived from other data (e.g., part-of-speech tags, model-based guesses for age or language)? If the data was reported by subjects or indirectly inferred/derived from other data, was the data validated/verified? If so, please describe how.
We first picked 40 graph data structure problems form the LeetCode Community (https://LeetCode.com/tag/graph/). We collect the problem statement, data examples, constraints, and code framework and store them in the jsonl files. After that, we use NetworkX (https://networkx.org/) to generate graph test cases for each of these problems.
What mechanisms or procedures were used to collect the data (e.g., hardware apparatuses or sensors, manual human curation, software programs, software APIs)? How were these mechanisms or procedures validated?
We collect the problem materials by hand, that is, directly copying and pasting the contents from the website. And for the graph test cases, we use python programming to generate them, the code is available at this webpage (https://harrywuhust2022.github.io/GraphEval2000/).
Over what timeframe was the data collected? Does this timeframe match the creation timeframe of the data associated with the instances (e.g., recent crawl of old news articles)? If not, please describe the timeframe in which the data associated with the instances was created.
We collect the problem materials in April 2024. At that time, all these selected problems are already available at LeetCode (https://LeetCode.com/tag/graph/). After we finish the data collections, we created the graph test cases.
Who was involved in the data collection process (e.g., students, crowdworkers, contractors) and how were they compensated (e.g., how much were crowdworkers paid)?
Qiming Wu collected the directed graph problems and Will Corcoran collected the undirected graph problems. They both funded by Ambuj Singh.
Were any ethical review processes conducted (e.g., by an institutional review board)? If so, please provide a description of these review processes, including the outcomes, as well as a link or other access point to any supporting documentation.
Unknown to the authors of the datasheet.
Did you collect the data from the individuals in question directly, or obtain it via third parties or other sources (e.g., websites)?
We collect the problem materials from the LeetCode (https://LeetCode.com/tag/graph/), which is a public platform that provides data structure problems.
Has an analysis of the potential impact of the dataset and its use on data subjects (e.g., a data protection impact analysis) been conducted? If so, please provide a description of this analysis, including the outcomes, as well as a link or other access point to any supporting documentation.
Not applicable.
A.4 Preprocessing/cleaning/labeling
Was any preprocessing/cleaning/labeling of the data done (e.g., discretization or bucketing, tokenization, part-of-speech tagging, SIFT feature extraction, removal of instances, processing of missing values)? If so, please provide a description. If not, you may skip the remaining questions in this section.
We mainly select the medium- and hard-level problems on LeetCode website becase the easy-level problems can be easily solved by LLMs. And then, we use the solution code of the select problem to generate labels of graph test cases. These codes are verified by the LeetCode contests.
Was the “raw” data saved in addition to the preprocessed/cleaned/labeled data (e.g., to support unanticipated future uses)? If so, please provide a link or other access point to the “raw” data.
Yes, the dataset itself stores the raw data.
Is the software that was used to preprocess/clean/label the data available? If so, please provide a link or other access point.
Yes, it is included in our code, which is available at here (https://harrywuhust2022.github.io/GraphEval2000/).
A.5 Uses
Has the dataset been used for any tasks already? If so, please provide a description.
No.
Is there a repository that links to any or all papers or systems that use the dataset? If so, please provide a link or other access point.
No.
What (other) tasks could the dataset be used for?
GraphEval2000 is designed to evaluate and improve the reasoning ability of LLMs. It can also be used to train the LLMs to better understand the graph structures.
Is there anything about the composition of the dataset or the way it was collected and preprocessed/cleaned/labeled that might impact future uses? For example, is there anything that a dataset consumer might need to know to avoid uses that could result in unfair treatment of individuals or groups (e.g., stereotyping, quality of service issues) or other risks or harms (e.g., legal risks, financial harms)? If so, please provide a description. Is there anything a dataset consumer could do to mitigate these risks or harms?
N/A.
Are there tasks for which the dataset should not be used? If so, please provide a description.
Unknown to the authors of the dataset.
A.6 Distribution
Will the dataset be distributed to third parties outside of the entity (e.g., company, institution, organization) on behalf of which the dataset was created? If so, please provide a description.
Yes, the dataset is available at the Internet.
How will the dataset will be distributed (e.g., tarball on website, API, GitHub)? Does the dataset have a digital object identifier (DOI)?
Users can download the dataset at the webpage here (https://harrywuhust2022.github.io/GraphEval2000/)
Will the dataset be distributed under a copyright or other intellectual property (IP) license, and/or under applicable terms of use (ToU)? If so, please describe this license and/or ToU, and provide a link or other access point to, or otherwise reproduce, any relevant licensing terms or ToU, as well as any fees associated with these restrictions.
Yes, this dataset is licensed under a CC BY 4.0 license, see official instructions at https://creativecommons.org/licenses/by/4.0/).
Have any third parties imposed IP-based or other restrictions on the data associated with the instances? If so, please describe these restrictions, and provide a link or other access point to, or otherwise reproduce, any relevant licensing terms, as well as any fees associated with these restrictions.
The problem materials are provided by the LeetCode, therefore, any commercial usage of this dataset is prohibited.
A.7 Maintenance
Who will be supporting/hosting/maintaining the dataset?
Qiming Wu, Will Corcoran and Zichen Chen will maintain the dataset.
How can the owner/curator/manager of the dataset be contacted (e.g., email address)?
The contact information of authors are available at the Internet.
Will the dataset be updated (e.g., to correct labeling errors, add new instances, delete instances)? If so, please describe how often, by whom, and how updates will be communicated to dataset consumers (e.g., mailing list, GitHub)?
Yes. The updated information will be posted at the webpage here (https://harrywuhust2022.github.io/GraphEval2000/).
If the dataset relates to people, are there applicable limits on the retention of the data associated with the instances (e.g., were the individuals in question told that their data would be retained for a fixed period of time and then deleted)? If so, please describe these limits and explain how they will be enforced.
N/A.
Will older versions of the dataset continue to be supported/hosted/maintained? If so, please describe how. If not, please describe how its obsolescence will be communicated to dataset consumers.
Yes, all versions of the dataset is stored at the webpage here (https://harrywuhust2022.github.io/GraphEval2000/).
If others want to extend/augment/build on/contribute to the dataset, is there a mechanism for them to do so? If so, please provide a description.
Follow the Github regulations.
Appendix B Analysis of Our Dataset GraphEval2000
In this section, we analyze our dataset from several perspectives: data distributions, the complexity of graph test cases, and the time and memory usage during evaluations on GraphEval2000.
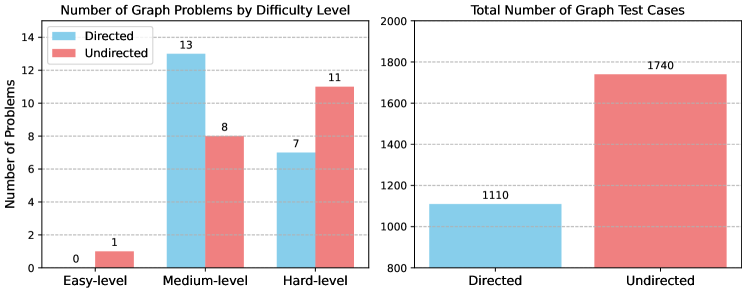
Distributions of Data in GraphEval2000
We begin by counting the number of graph test cases, as shown on the right side of Figure 7. Additionally, we examine the distribution of problems across different difficulty levels, as illustrated on the left side of Figure 7. Figure 7 summarizes these results. Our dataset, GraphEval2000, includes four main graph categories (as shown in Figure 8, sparse, planar, complete, and regular) and four subcategories (connected, disconnected, cyclic, and acyclic) within each main category. For each subcategory, we generated ten graph test cases. Due to the specific characteristics of the main categories, our final dataset comprises 1,110 graph samples for directed graphs and 1,740 for undirected graphs. These samples are designed to evaluate and improve the graph reasoning abilities of large language models (LLMs).
The graph problems were collected from LeetCode (https://leetcode.com/tag/graph/), and we calculated the distribution of problems across different difficulty levels222The difficulty level is defined by LeetCode.. Given the near-perfect performance of LLMs on easy-level data structure problems, we focused primarily on medium- and hard-level problems. An interesting finding is that directed graph problems tend to be more concentrated at the medium difficulty level, whereas undirected graph problems are more concentrated at the hard difficulty level.
| Graph Type |
|
|
|
|
||||||||
|---|---|---|---|---|---|---|---|---|---|---|---|---|
| Directed Sparse | 98.63 | 247.83 | 4.69 | 3.65 | ||||||||
| Directed Planar | 41.67 | 44.68 | 2.31 | 1.25 | ||||||||
| Undirected Sparse | 88.55 | 89.47 | 1.96 | 0.72 | ||||||||
| Undirected Planar | 68.67 | 69.75 | 1.97 | 0.72 | ||||||||
| Undirected Regular | 91.91 | 258.57 | 5.53 | 0.55 | ||||||||
| Undirected Complete | 92.13 | 6845.71 | 91.13 | 0.0 |
Complexity Analysis of Graphs in GraphEval2000
To analyze the complexity of the graph test cases in GraphEval2000, we include several key metrics: the average number of nodes and edges, the average degree, and the average degree variance. These metrics provide a comprehensive understanding of the structural characteristics of the graphs in our dataset, allowing for a more detailed assessment of the complexity and diversity of the test cases. The results are summarized in Table 3.
To begin with, we first introduce the evaluation metrics. Consider to be number of nodes in the -th graph, represents the number of edges in the -th graph. Then, average number of nodes across graph test cases is
| (5) |
and average number of edges across graph test cases is
| (6) |
The degree of a node in a graph is the number of edges connected to it. The average degree of a graph is the mean degree of all its nodes. For an undirected graph with nodes and edges, the average degree is
| (7) |
For a directed graph, the average degree is
| (8) |
Across multiple graphs, the average degree is the mean of the average degrees of each graph. The degree variance measures the variability of the degrees of the nodes in a graph. For a graph with nodes and degrees , the variance of the degrees is calculated as:
| (9) |
Here, is the average degree of the nodes in that graph. Across multiple graphs, the average degree variance is the mean of the degree variances of each graph.
Summary of Analysis
In our dataset, the directed graph has two categories: sparse and planar. The undirected graph has four categories: sparse, planar, regular and complete. We summarized the experimental results based on these categories:
-
•
Directed sparse graphs have a moderate number of nodes and edges. The average degree is relatively low, indicating sparsity. The degree variance suggests variability in node connectivity.
-
•
Directed planar graphs have fewer nodes and edges compared to sparse graphs. The average degree and variance are low, indicating even sparser connectivity with less variation in node degree.
-
•
Undirected sparse graphs have a similar number of nodes to directed sparse graphs but significantly fewer edges. The average degree is just below 2, with low degree variance, indicating very sparse and consistent connectivity.
-
•
Undirected planar graphs are similar to undirected sparse graphs in terms of average degree and degree variance but have fewer nodes and edges. They maintain sparse and consistent connectivity.
-
•
Undirected regular graphs have a higher average number of edges and degree compared to sparse and planar graphs, indicating denser connectivity. The low degree variance suggests uniformity in node connectivity.
-
•
Undirected complete graphs have a very high number of edges, as expected. Each node is connected to every other node, resulting in the maximum possible average degree for the given number of nodes. The degree variance is zero, indicating perfect uniformity in connectivity.
Time and Memory Usage Analysis
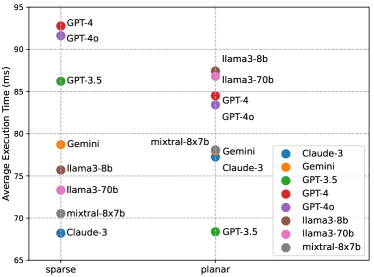
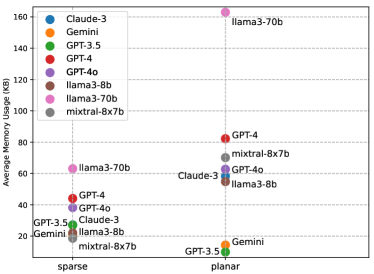
In addition to evaluating the passing rates of LLMs on our dataset, we also present the time and memory usage data, summarized in Figure 9. These metrics are crucial for assessing the efficiency of the code generated by LLMs.
Results on Directed Graphs
For directed graphs, GPT-3.5 stands out as the most efficient model, demonstrating the lowest average execution times and memory usage across planar and sparse graphs. Claude-3 also performs well, particularly for sparse graphs, achieving the lowest execution time. Gemini and mixtral-8x7b show good memory efficiency, with mixtral-8x7b being particularly efficient for sparse graphs. Conversely, llama3-70b consistently exhibits the highest memory usage, making it the least efficient in terms of memory management. Although GPT-4 is powerful, it has higher execution times and memory usage compared to GPT-3.5. Overall, GPT-3.5 proves to be the most balanced and efficient model across the tested scenarios, while llama3-70b demonstrates significant inefficiencies, especially in memory usage.
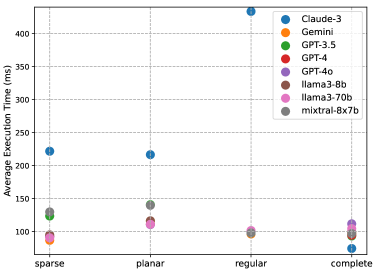
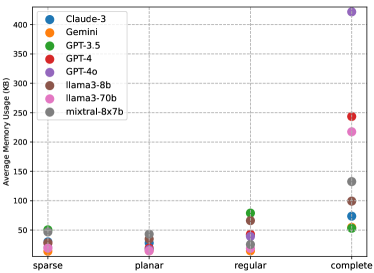
Results on Undirected Graphs
The performance of models on undirected graphs varies significantly across different graph types. Claude-3 displays notably high execution times for planar, sparse, and regular graphs but performs exceptionally well with complete graphs, showing the lowest execution time albeit with relatively higher memory usage. Gemini demonstrates consistently low memory usage and good execution times, particularly excelling with sparse graphs. GPT-3.5 and GPT-4 show balanced performance, with GPT-3.5 achieving better execution times for planar graphs and GPT-4 managing memory more efficiently except for complete graphs, where it uses significantly more memory. GPT-4o is similar to GPT-4 but with slightly improved times and memory efficiency. Llama3-8b and llama3-70b exhibit higher memory usage, especially for complete graphs, with llama3-70b showing the highest memory usage for complete graphs. Mixtral-8x7b presents high execution times and memory usage across all graph types but performs moderately well with regular graphs. Overall, Gemini and GPT-3.5 emerge as the most efficient models in terms of execution time and memory usage across various graph types, while Claude-3 and GPT-4 show significant variations based on the graph type.
It is important to note that high efficiency in code execution does not always guarantee a high passing rate. Occasionally, code may produce incorrect answers, which can result in accelerated program execution.
Appendix C Completed Reasoning Example
Due to space constraints, in this section, we demonstrate the complete implementation of SSD-enhanced graph reasoning and CoT-based graph reasoning, as shown in Boxes C (“SSD-enhanced GPT-4o’s Graph Reasoning” and “CoT-based GPT-4o’s Graph Reasoning”).
The detailed code for SSD-enhanced Graph Reasoning and CoT-based Graph Reasoning is provided in Listings 1 and 2, respectively. Notably, the instances of hallucinations in the CoT-based Graph Reasoning are highlighted for clarity.