Also at ]University of Nizhny Novgorod, 603022 Nizhny Novgorod, Russia Now at ]Experimental Physics 2, Department of Physics, TU Dortmund, 44227, Dortmund, Germany
Polar phonons and magnetic excitations in the antiferromagnet
Abstract
The coupling between antiferromagnetic spins and infrared-active phonons in solids is responsible for many intriguing phenomena and is a field of intense research with extensive potential applications in the modern devices based on antiferromagnetic spintronics and phononics. Insulating rutile antiferromagnetic crystal is one of the model materials for studying nonlinear magneto-phononics due to the strong spin-lattice coupling as a result of the orbitally degenerate ground state of ions manifested in the plethora of static and induced piezomagnetic effects. Here, we report results on the complete infrared spectroscopy study of lattice and magnetic dynamics in in a wide temperature range and their careful analysis. We observed that infrared-active phonons demonstrate frequency shifts at the antiferromagnetic ordering. Furthermore, using first-principles calculations, we examined the lattice dynamics and disclosed that these frequency shifts are rather due to the spin-phonon coupling than geometrical lattice effects. Next we found that the low-frequency dielectric permittivity demonstrates distinct changes at the antiferromagnetic ordering due to the spontaneous magnetodielectric effect caused by the behavior of infrared-active phonons. In addition, we have observed magnetic excitations in the infrared spectra and identified their magnetodipole origin. To strengthen our conclusions, we analyze the theoretical phonon-magnon coupling overall phonons at the point. We conclude that the largest effect comes from the and Raman-active modes. As such, our results establish a solid basis for further investigations and more deeper understanding of the coupling of phonons with spins and magnetic excitations in antiferromagnets.
I Introduction
Antiferromagnets are promising materials for next-generation spintronic devices because of their several considerable advantages over ferromagnets. These advantages cover, for example, orders of magnitude higher frequencies of spin dynamics (typically in the terahertz range), insensitivity to external magnetic perturbations, and the absence of stray field [1; 2; 3; 4; 5; 6; 7; 8; 9; 10; 11]. In turn, the coupling between the optical phonons with spins in antiferromagnets has tremendous interest and it is, nowadays, a hot topic area of modern condensed matter physics. The latter interest lies at the intersection of spintronics and phononics because it provides the attractive route to control of the magnetic and structural properties of materials [12; 13; 14; 15; 16; 17; 18; 19; 20; 21]. Nevertheless, despite the intensive research in this area in recent years, the microscopic mechanisms for the spin-phonon coupling in insulator crystals remain poorly understood [22; 23].
Among magnetic crystals, transition metal fluorides , with a rutile structure, are attractive materials for antiferromagnetic spintronic applications. Thus, the spin Seebeck effect was experimentally observed in thin films of [24] and [25] that can be used for generation of nonequilibrium magnons for spin caloritronic devices. The controllable generation of coherent spin currents at terahertz frequencies, due to the spin-pumping effect, has been demonstrated in thin film of [26]. It has been shown that phonon frequencies [27; 28] and dielectric permittivity in the [29; 30] are changed at the antiferromagnetic ordering that indicates a coupling of phonons with spins in the materials.
The cobalt fluoride is one of the most fascinating compounds because the cation exhibits a not fully frozen orbital momentum with a strong spin-orbit interaction leading to an exceptionally high-magnetic anisotropy [31; 32] and large magnetostriction [33; 34]. Thus, the strong static [35; 36; 37], phonon-driven [38] and laser-induced THz [39; 40] piezomagnetic effects have been observed. Furthermore, has been a model material for nonlinear phononics and magneto-phononics in which it was discovered that infrared-active phonons and magnons pumped by terahertz pulses efficiently excite coherent Raman-active phonons [38; 41; 42]. It is worth mentioning that most of basic physical properties of this, as well as of some other crystals, are fairly known. These studies include the experimental exploration of the magnetic and optical properties even considering experiments in the high magnetic field [43; 44; 45; 46; 47]. The latter studies partially cover the spin excitations and Raman-active phonons at the center of the Brillouin zone have been investigated experimentally in a wide temperature range [48; 49; 50; 51; 52; 53; 54; 55]. Nevertheless, there is a lack of understanding of the infrared-active phonons and magnetic-dipole active excitations in a wide range of temperatures and some studies only cover a few temperature points [56; 57; 58]. Moreover, the temperature behavior of dielectric properties of remains generally unexplored.
In this paper, we report the results of a detailed experimental study of the lattice and spin dynamics of in a wide temperature range by using far-infrared and dielectric spectroscopy techniques. The latter findings are supported by appropriate first-principles calculations and their careful analysis. We show that frequencies of the polar phonons present a clear shift at the antiferromagnetic ordering. Lattice dynamics calculations have shown that these frequency shifts are due to the spin-phonon coupling. Moreover, we have revealed that observed changes in the low-frequency dielectric permittivity at the antiferromagnetic ordering, due to the spontaneous magnetodielectric effect, are caused by the coupling of spins with polar phonons.
II Methods
II.1 Crystal and magnetic structures:
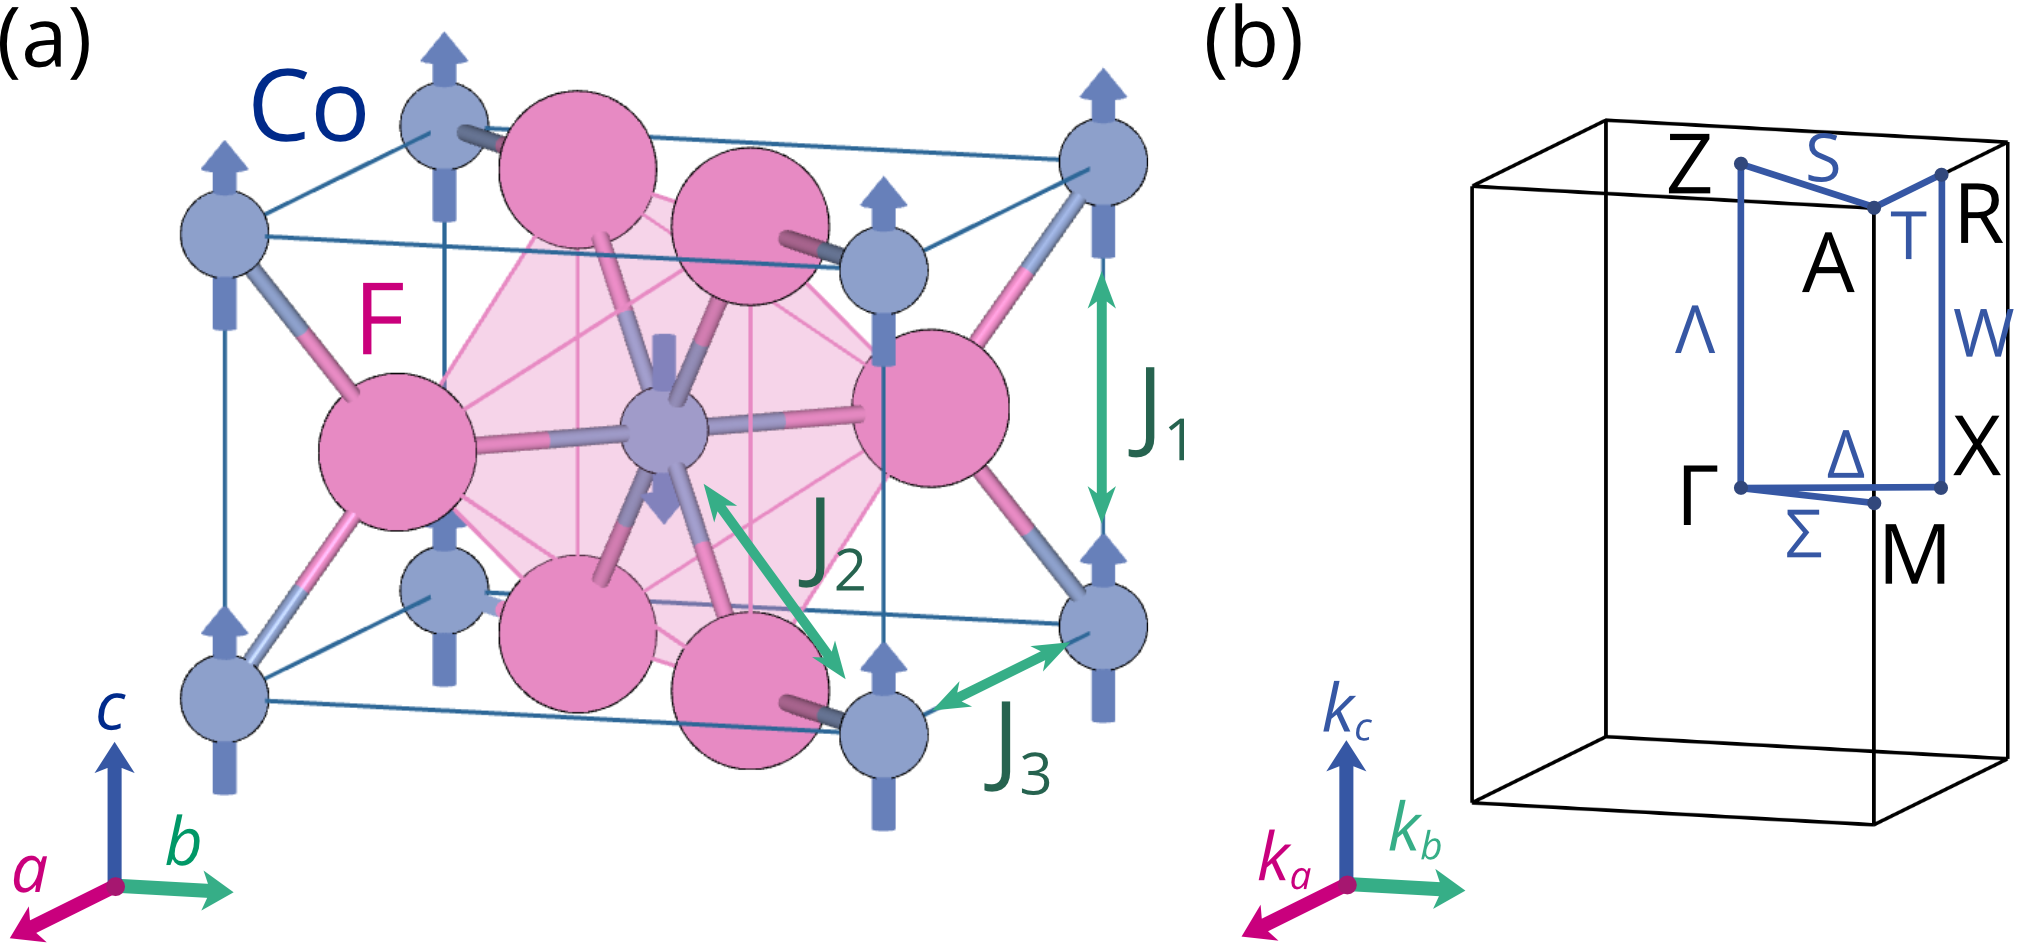
Cobalt fluoride crystallizes in a centrosymmetric tetragonal rutile crystal structure with the space group (, #136, ) [59] as shown in Fig. 1(a). The lattice parameters measured at room temperature are Å and Å [60]. The rutile structure consists of alternating neighboring octahedra which share edges and corners. The and ions are located at the Wyckoff positions 2a (0, 0, 0) and 4f (0.30346, 0.30346, 0.0000) with site symmetries and , respectively [60]. The antiferromagnetic phase transition in takes place at K and the magnetic space group is realized [61]. At low temperatures in the antiferromagnetic phase the spins of \chCo^2+ () ions are aligned along the axis with opposite directions at the center and corners [62; 63; 64] as shown by purple arrows in Fig. 1(a). The experimental magnetic structure of can be adequately described by the three exchange integrals between the nearest-neighboring \chCo^2+ ions with values meV, meV, and meV [53] which are indicated in Fig. 1(a).
II.2 Experimental Details:
The single crystal of was grown by the Bridgman method in platinum crucibles in a helium atmosphere as described in Ref. [65]. Samples with the and planes were cut from the x-ray oriented single crystal and polished to optical quality. The surface size of the samples for far-infrared experiments were about mm2 whereas the thicknesses were about 5 mm. Samples for dielectric experiments were prepared in a form of plane-parallel plates with a thickness of about 1.5 mm and an area of about 50 mm2.
The far-infrared (IR) reflectivity and transmission measurements were carried out in the spectral range 50–650 cm-1 and 30–300 cm-1, respectively, using Bruker IFS 125HR spectrometer with a liquid helium-cooled bolometer. The plane sample was mounted on a cold finger of a closed-cycle helium cryostat Cryomech ST403. The polarization of electric field was switched between two positions of the linear thin film polarizer along the and axes of the crystal. In reflectivity measurements, the incident light beam was at 10∘ from the normal to the sample plane. The relative reflectivity spectra from the sample with respect to a reference reflectivity of a gold mirror at room temperature were measured at slow continuous cooling from 300 to 5 K. No corrections on the surface quality and shape of the sample, as well as change of positions due to cold finger thermal contraction, were done. The absolute reflectivity spectra were obtained by means of the Bruker IFS 66v/S spectrometer in the range of 50–7500 cm-1 in order to determine the values of high-frequency dielectric permittivity .
The dielectric permittivity in the frequency range from 20 Hz to 1 MHz was measured using precision RLC meter AKTAKOM AM-3028. The and plane samples were used to measure the dielectric permittivity along the () and axes, respectively. Electric contacts were deposited on the sample surfaces using silver paint to form a capacitor. Samples were placed in a helium flow cryostat Cryo CRC-102 and capacitance measurements were performed at continuous heating from 5 to 300 K. Experimental data are presented only for the frequency of 100 kHz because no noticeable dispersion was observed in the studied frequency range. The dielectric losses are very small, on the order of 10-5, and no noticeable temperature changes were detected.
II.3 Computational Details:
The obtained experimental results were supplemented by the lattice dynamic calculations within the density-functional theory (DFT) framework [66; 67] and the projector-augmented wave method [68] as implemented in the Vienna ab initio simulation package (vasp) [69; 70]. The configurations considered in the pseudopotentials for the valence electrons were (, version 23Apr2009) and (, version 08Apr2002). The Monkhorst-Pack scheme with a mesh 668 has been employed for the Brillouin zone integration [71]. As such, an eV energy cutoff was used to give forces convergence of less than 0.001 eVÅ-1. The exchange-correlation energy was represented within the generalized gradient approximation (GGA) in the Perdew-Burke-Ernzerhof revised for solids PBEsol form [72]. The approximation within the Dudarev’s formalism [73] with the on-site Coulomb interaction eV and an exchange correction eV were used to account for the strong correlation between electrons in the shell of the \chCo^2+ ions [74]. The dielectric constants, phonon dispersions, eigenvectors, and Born effective charges were calculated within the density-functional perturbation theory [75] and analyzed through the Phonopy code [76]. The longitudinal-transverse optical (LO-TO) phonon splitting near the -point was included using nonanalytical corrections to the dynamical matrix [77]. Finally, the correlation between eigendisplacements of the LO and TO modes was evaluated using LADYtools [78]. Moreover, we use the LKAG Green’s function method [79] as implemented in the TB2J code [80] to calculate the exchange interaction constants of following the process described in Ref. [81]. Particularly, we interface TB2J with the Siesta package [82], where we use a 400 Ry mesh-cutoff energy and a double-zeta polarized basis in addition to the previously mentioned DFT parameters. We compare the LKAG results with those obtained from vasp with an energy mapping procedure. Finally, we use linear spin-wave theory [83] to calculate the magnon frequencies.
III Results and Discussion
III.1 Far-infrared spectroscopy:
The group-theoretical analysis for the rutile predicts 13 phonon modes at the point of the Brillouin zone [84]:
| (1) |
among which there are 2 acoustic , three “silent” , four Raman-active , and four infrared-active (polar) phonons. The and modes are nondegenerated, whereas the modes are doubly degenerated. The polar phonon is polarized along the axis whereas phonons are active in the plane.
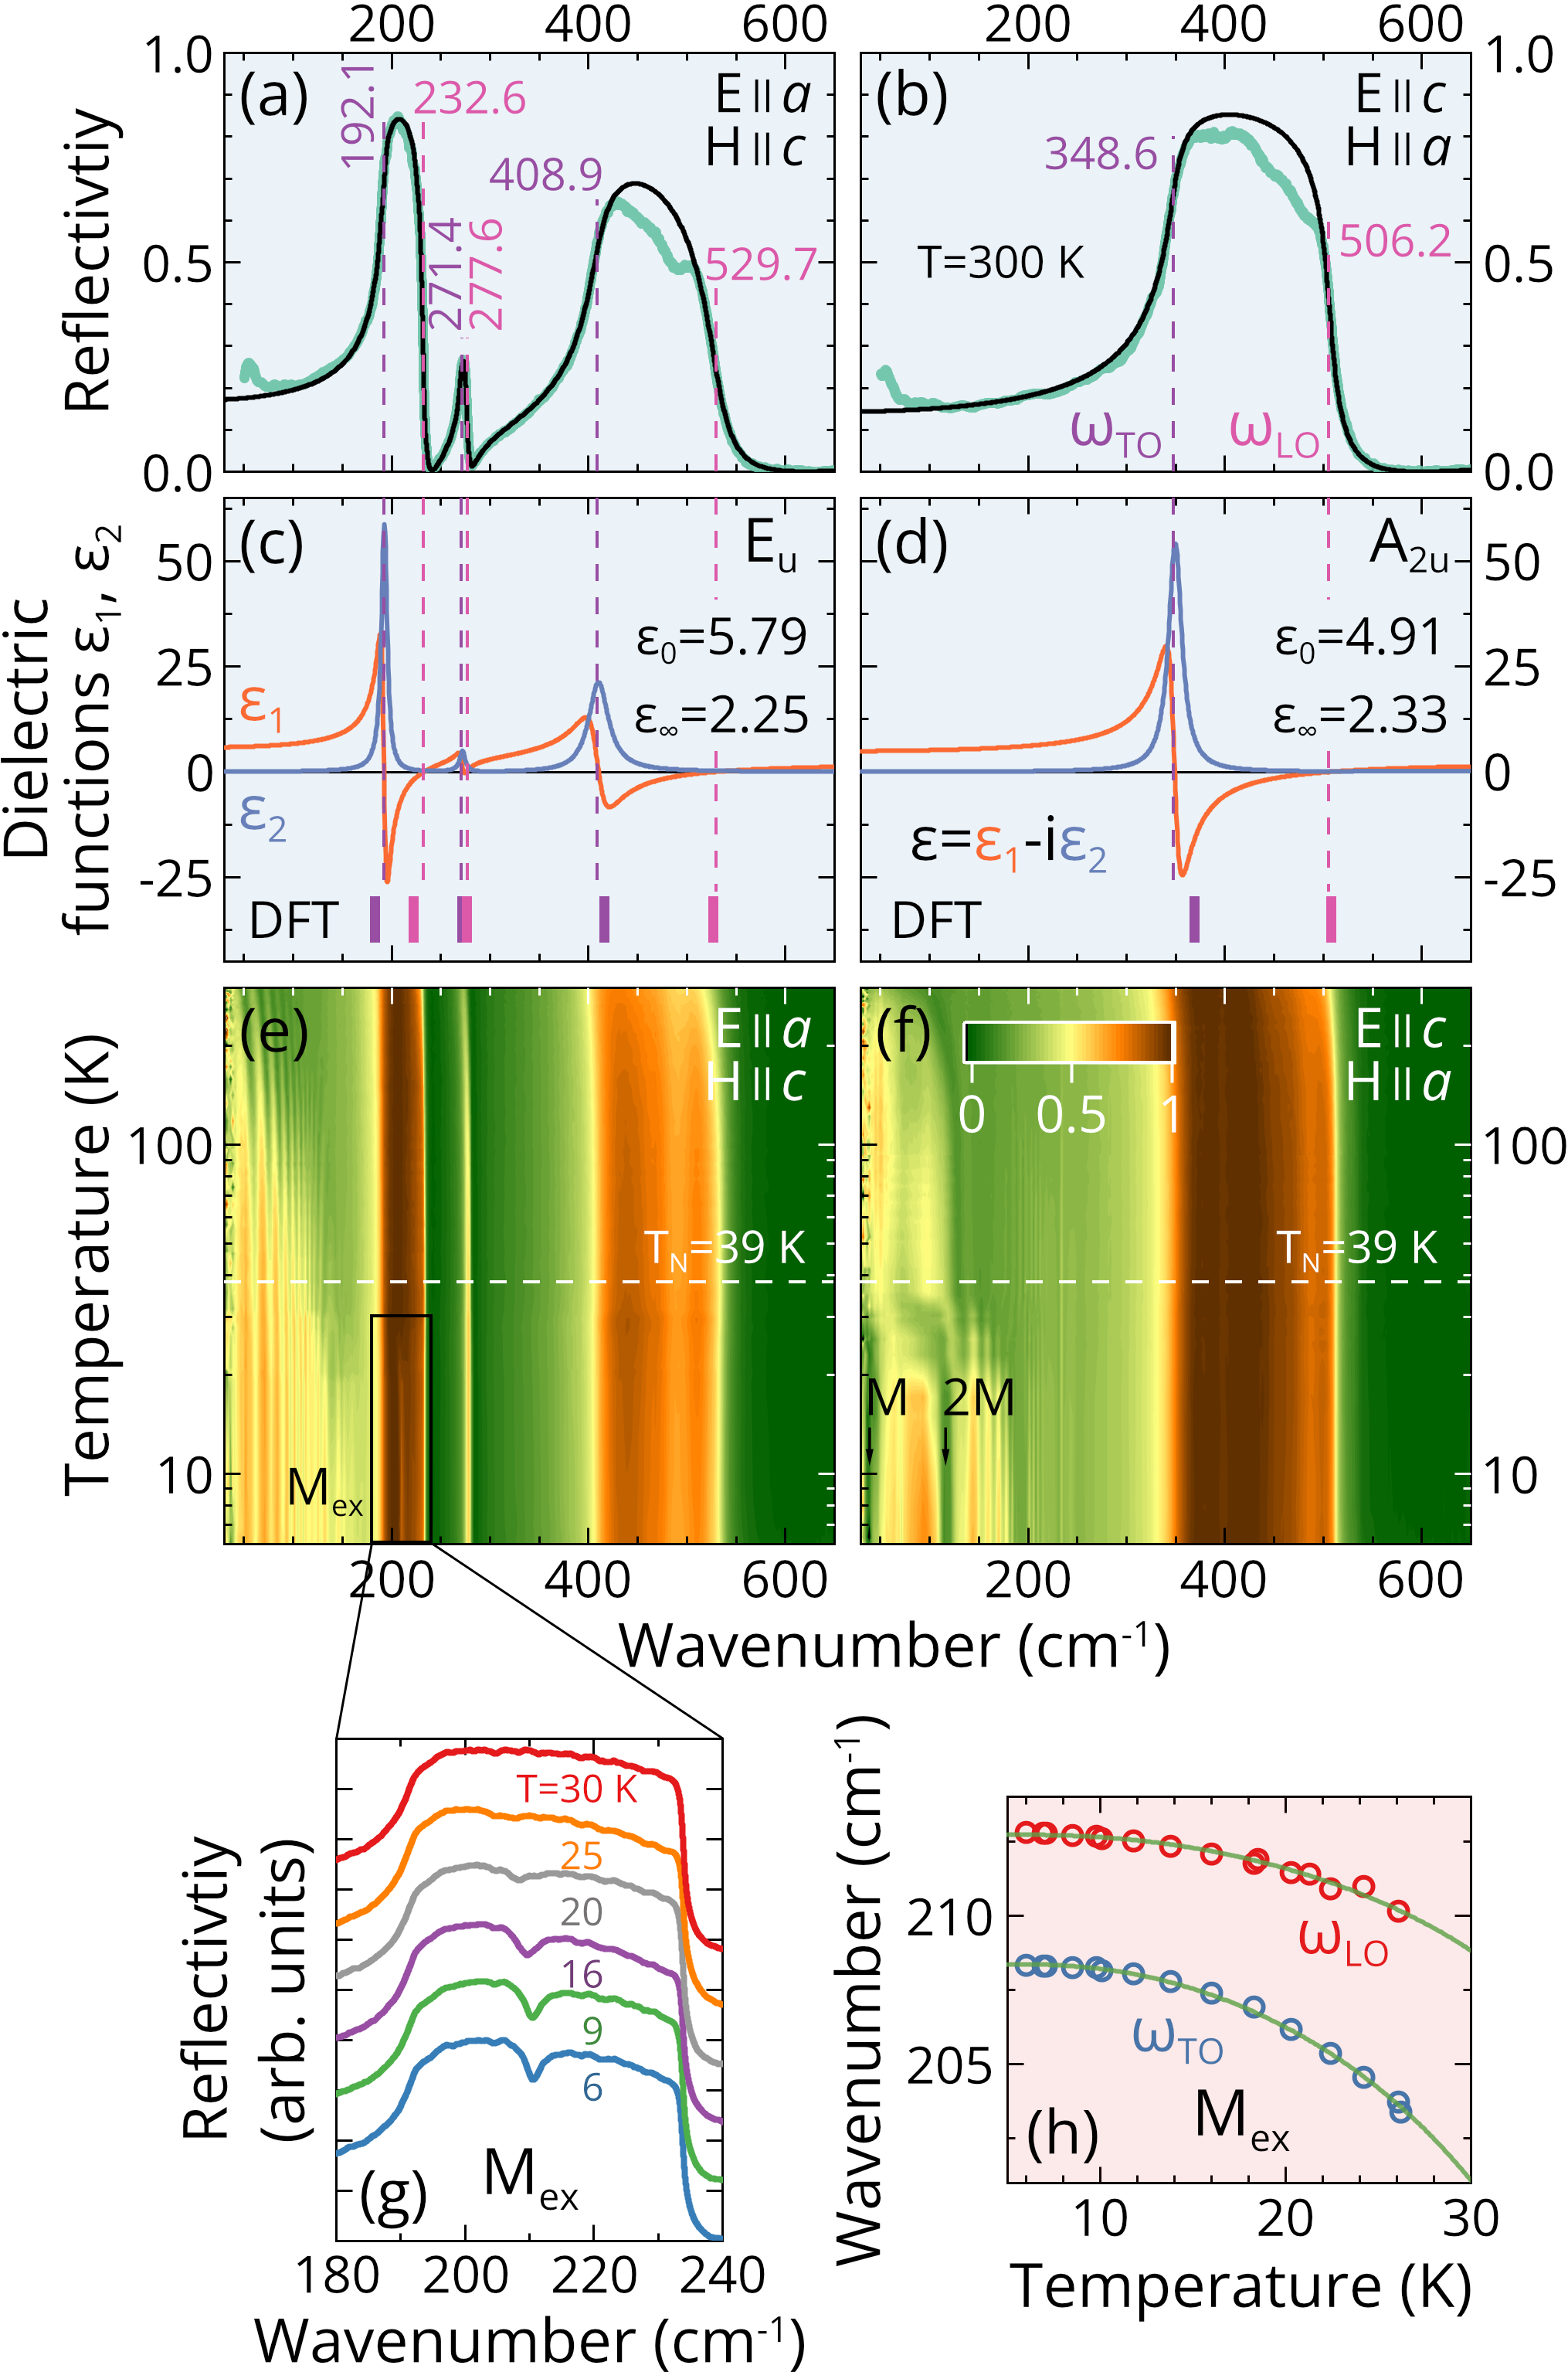
The IR reflectivity spectra at room temperature with the polarization of light parallel to the and axis are shown in Figs. 2(a) and 2(b), respectively. Three and one reflection bands are observed in the spectra for nonequivalent polarizations, which correspond to the () and () polar phonons in full agreement with group theory predictions. To obtain the phonon parameters the reflectivity spectra were fitted using the Fresnel equation [85]
| (2) |
with the factorized form of the complex dielectric permittivity [86]
| (3) |
where is the high-frequency dielectric permittivity, , , and correspond to and frequencies () and dampings () of the th polar phonon, respectively. Multiplication occurs over all polar phonons which are active for the relevant polarization of light. Far from the magnetic excitations, it is assumed that magnetic permeability . There is, in general, a good agreement between experimental green and fit black lines, as shown in Figs. 2(a) and 2(b). Slight deviations appear at the highest-frequency phonons presumably due to multiphonon absorption [87]. The real and imaginary parts of the complex dielectric functions which correspond to the fits are shown in Figs. 2(c) and 2(d). The obtained parameters of the polar phonons from fits using Eqs. (2) and (3) of the experimental data at room temperature are listed in Table 1. These parameters are in fair agreement with the literature data for [56; 57]. Note that LO-TO splitting does not depend on the degeneracy of polar phonons [88].
| Sym. | ||||||
|---|---|---|---|---|---|---|
| 1 | 192.1 (182.7) | 7.0 | 232.6 (222.3) | 4.2 | 2.14 (2.26) | |
| 2 | 271.4 (271.8) | 6.7 | 277.6 (276.2) | 5.3 | 0.12 (0.103) | |
| 3 | 408.9 (415.7) | 24.5 | 529.7 (526.9) | 28.1 | 1.28 (1.33) | |
| (2.54) (6.24) | ||||||
| 1 | 348.6 (369.8) | 16.6 | 506.2 (507.1) | 13.0 | 2.58 (2.32) | |
| (2.63) (4.95) | ||||||
To reveal the temperature evolution of the polar phonons in , we perform the measurements of the infrared reflectivity in the range from 5 to 300 K for both polarizations which are shown by the color maps in Figs. 2(e) and 2(f). The bright vertical brown bands correspond to polar phonons and it can be seen that their evolution with temperature is not significant. It should be noted that we did not detect in any evidences of the exchange driven phonon splitting below which was previously observed in the antiferromagnetic cubic transition-metal monoxides and oxide spinels [89; 90; 91; 92]. We attribute the absence of clear signs of the exchange driven phonon splitting in the antiferromagnetic rutiles and from Ref. [28] to the fact that they have tetragonal crystal structure and they have no magnetic frustration, which is apparently essential for this effect.
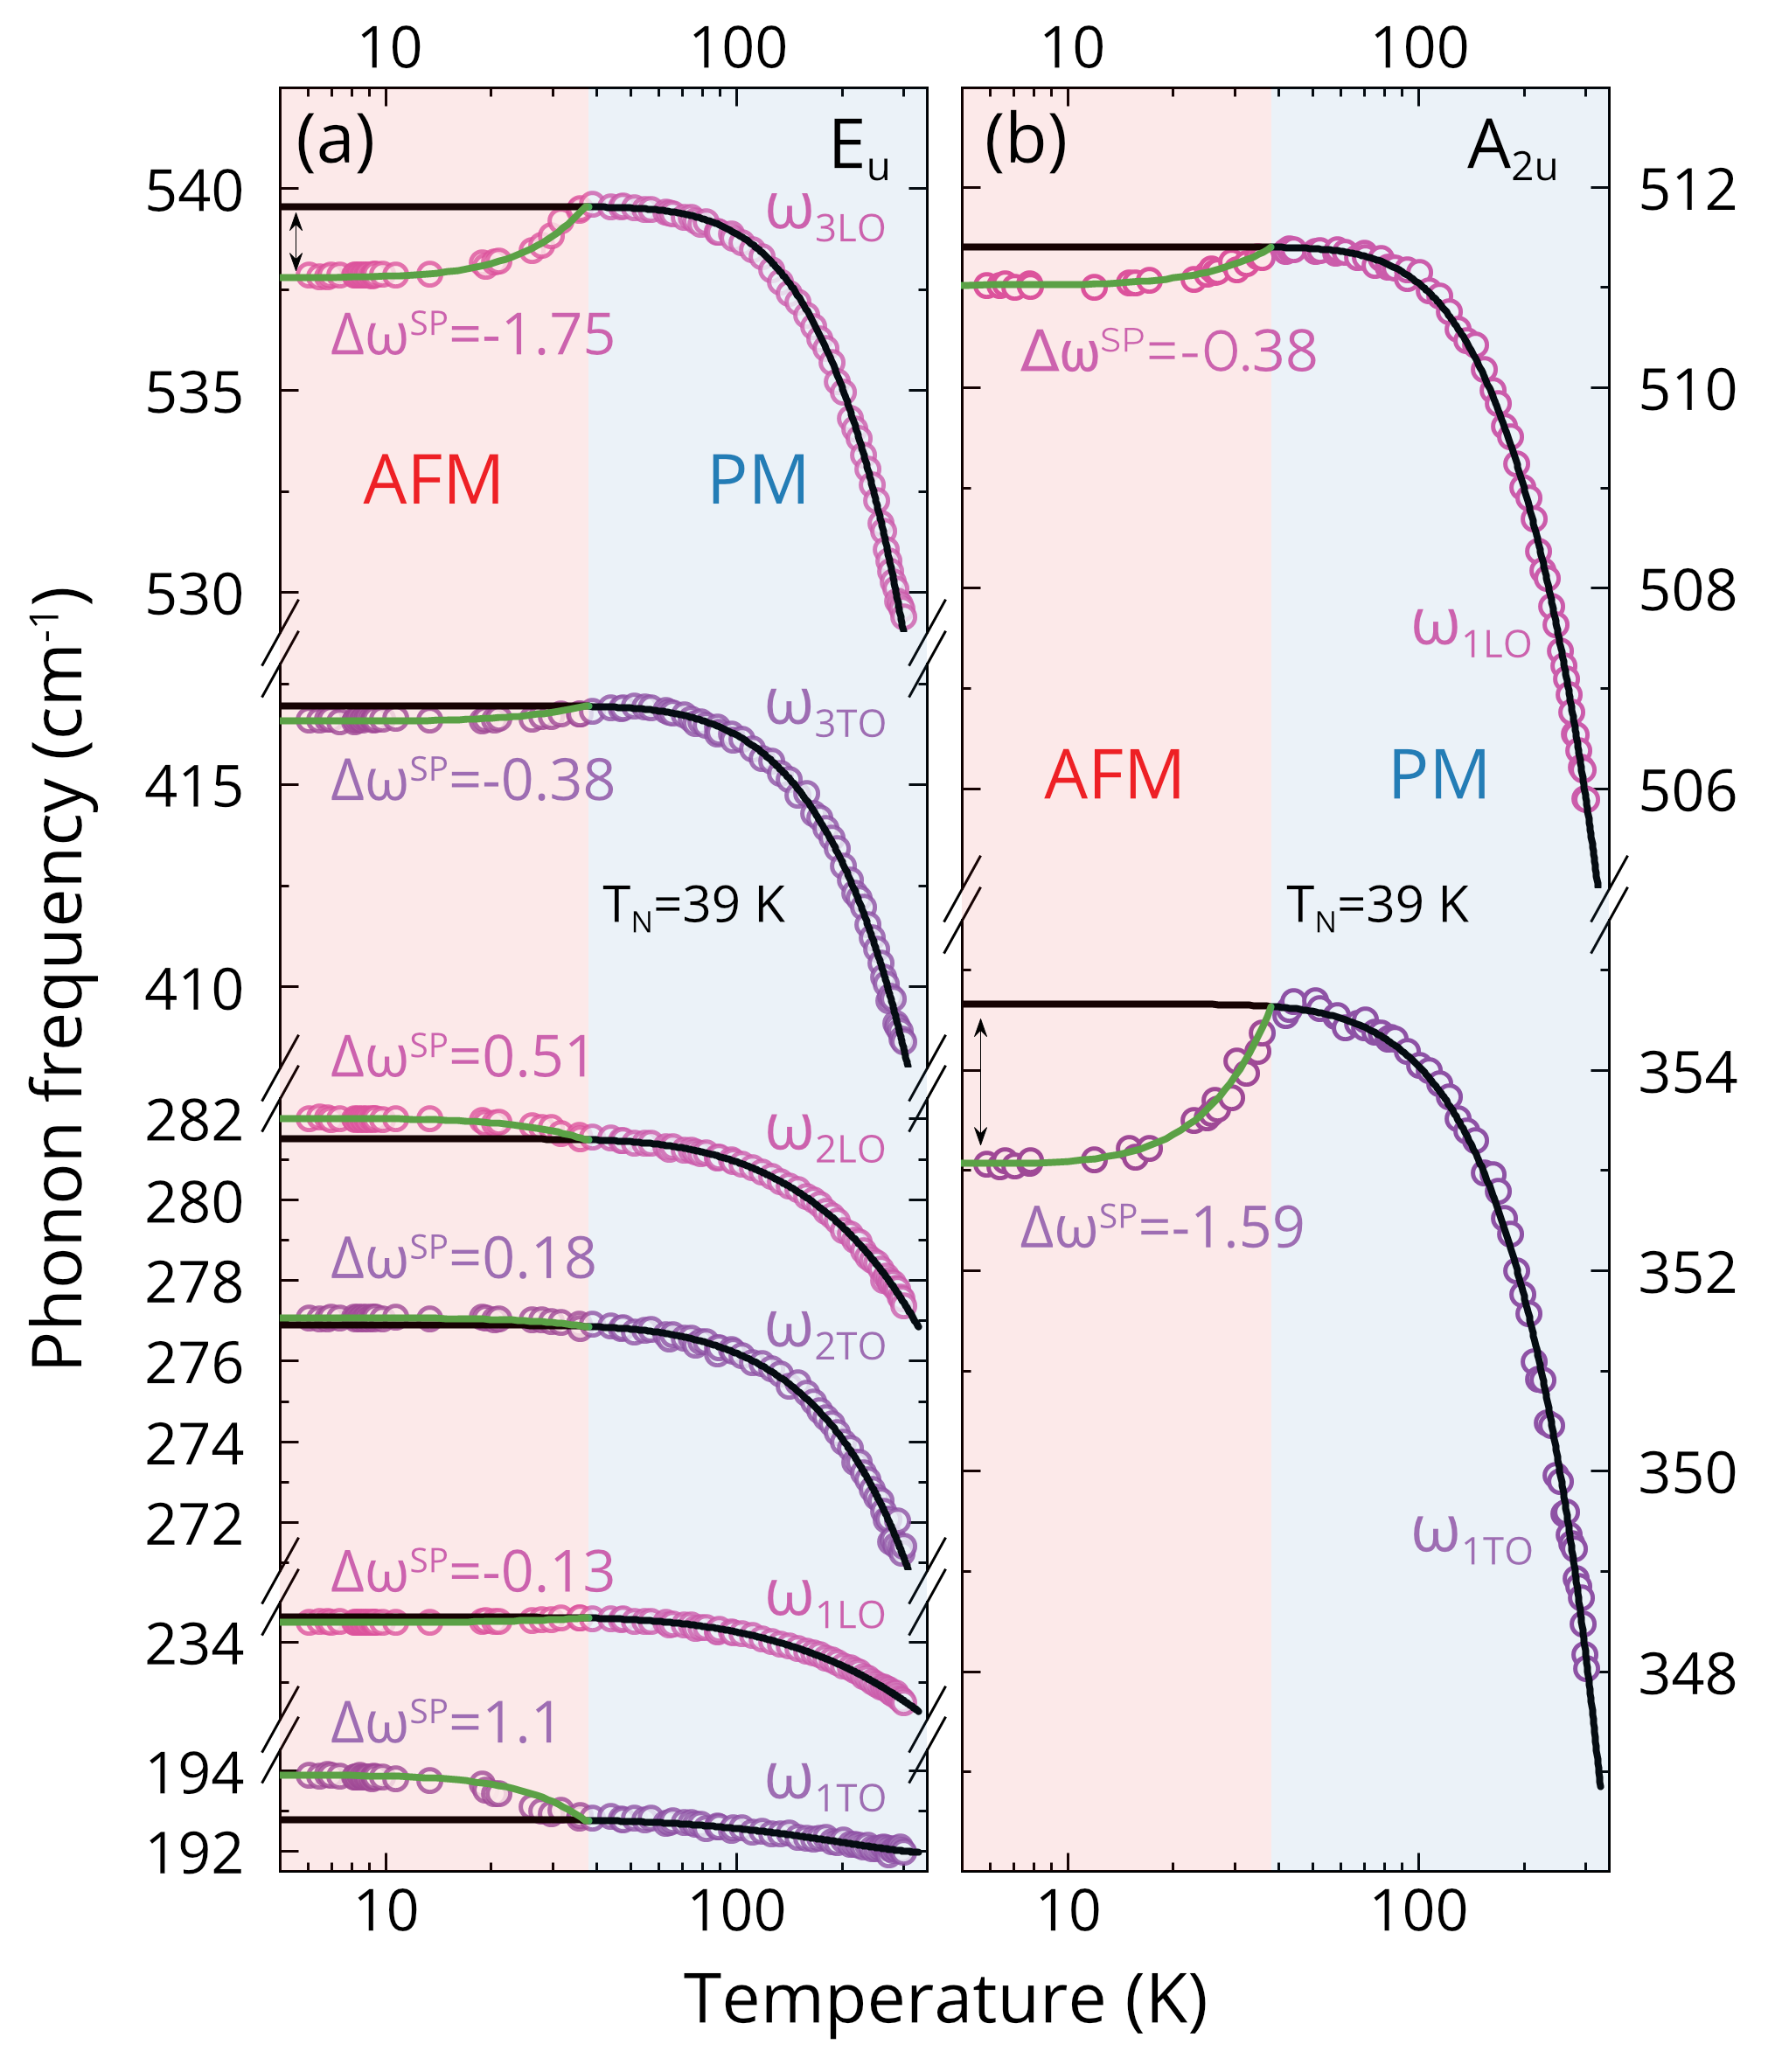
Further, the obtained reflectivity spectra were analyzed using Eqs. (2) and (3). The derived temperature dependences of the TO and LO frequencies of and polar phonons are shown on a logarithmic scale in Figs. 3(a) and 3(b). In the paramagnetic state , the TO and LO frequencies of all polar phonons increase (i.e. harden) at cooling. It should be noted that the hardening of phonon frequencies is typical for conventional insulator crystals due to anharmonic effects which manifest themselves in the compression of the crystal at cooling [93]. In turn, a decrease in the distance between ions in a crystal leads to an increase of the interaction forces between them, which drives an increase of the phonon frequencies , where is a reduced mass [94]. According to the Ref. [34] the lattice parameters of decrease at cooling in the paramagnetic phase. The observation in the isostructural antiferromagnet presents a fascinating phenomenon where, contrary to typical behavior, the frequency of the polar phonon exhibiting symmetry decreases on cooling. This anomaly underscores a unique aspect of phonon behavior in antiferromagnetic materials, challenging conventional understandings and inviting a deeper investigation into the underlying mechanisms [28].
It is clearly seen in Fig. 3 that the temperature dependencies of all polar phonons abruptly change the smooth behavior at the Néel temperature K evidencing the influence of the spin-phonon coupling. For a deeper understanding of this effect, we fitted the temperature dependencies of phonon frequencies in the paramagnetic state using expression describing the three- and four-phonon anharmonic processes [95; 96]
| (4) |
where is harmonic phonon frequency, and are parameters. It is worth noting that the phonon anharmonicity in the real crystals is very complicated, but Eq. (III.1) gives reasonable fits above as shown by the black lines in the Fig. 3. The frequency shifts of the phonon frequencies from extrapolated anharmonic behavior in the antiferromagnetic phase were fitted by the function [97]:
| (5) |
where is the spin-phonon coupling constant which is equal to the phonon frequency at the low temperature and is the magnetic order parameter. Neglecting the short-range magnetic ordering above , the temperature dependence of can be estimated by using the Brillouin function [98] such as:
| (6) |
where , is spin value of the magnetic ion, and is the full magnetic order parameter. There is a fair agreement between fits using Eqs. (5), (6) and experimental data below as shown in Fig. 3. The obtained values of the spin-phonon coupling constants given in Fig. 3 are close to the published data for Raman-active phonons [97]. It is worth nothing that spin-phonon coupling for IR-active TO phonons has been reported for the isostructural antiferromagnet [28].
Here, it can be observed that the temperature maps of the IR reflectivity spectra reveal features at about 37, 115, and 209 cm-1 appearing at antiferromagnetic ordering, as it can be seen in Figs. 2(e) and 2(h). According to the numerous published data, the feature at 37 cm-1 corresponds to the magnon excitation with symmetry , 115 cm-1 () is two-magnon mode, and 209 cm-1 () is magnetic exciton [99; 100; 55; 49; 101; 102; 51; 52; 53; 50]. Magnetic excitons in are usually considered as a transition between the split by crystal and exchange fields, and the spin-orbit coupling of ions levels [103; 104; 100; 49]. At that the magnetic exciton with the lowest frequency is a magnon. It is interesting that the magnetic excitation with frequency 209 cm-1 is located in the Reststrahlen band between 2TO and 2LO frequencies of the polar phonon and appears by a dip in the reflection spectra, as shown in Figs. 2(e) and 2(g), and it was previously discovered in Ref. [58]. Note that, this magnetic excitation appears in the polarized IR reflectivity spectra on the polar phonon only at , in the plane and does not appear at , in the plane [58; 105] which confirms its magnetodipole character.
To reveal the temperature dependence of the frequency of this magnetic excitation , the feature on the IR reflection spectra was fitted using Eqs. (2), (3) and magnetic permeability in the form which is close to the Eq. (3) [105]
| (7) |
where and correspond to LO and TO frequencies of the magnetic excitation. The recieved temperature dependences of and frequencies of the and fit lines obtained using Eq. (6) are shown in Fig. 2(h) according to Ref. [106].
At low temperatures, the crystal becomes more transparent in the low-frequency region below 200 cm-1 (see Fig. 4). The reflection from the back side of the sample with double absorption at its thickness and interference are added to the reflection from the front side as shown in Figs. 2(e) and 2(f). Thus, the absorption related to magnon at 37 cm-1 and two-magnon excitation at 115 cm-1 are observed in the spectra with , as can be seen in Figs. 2(f) and Figs. 4(b). In addition to the magnon , and the two-magnon already described, four narrow absorption lines at temperatures both above and below were also observed in the transmission spectrum with , , as shown in Fig. 4(b).
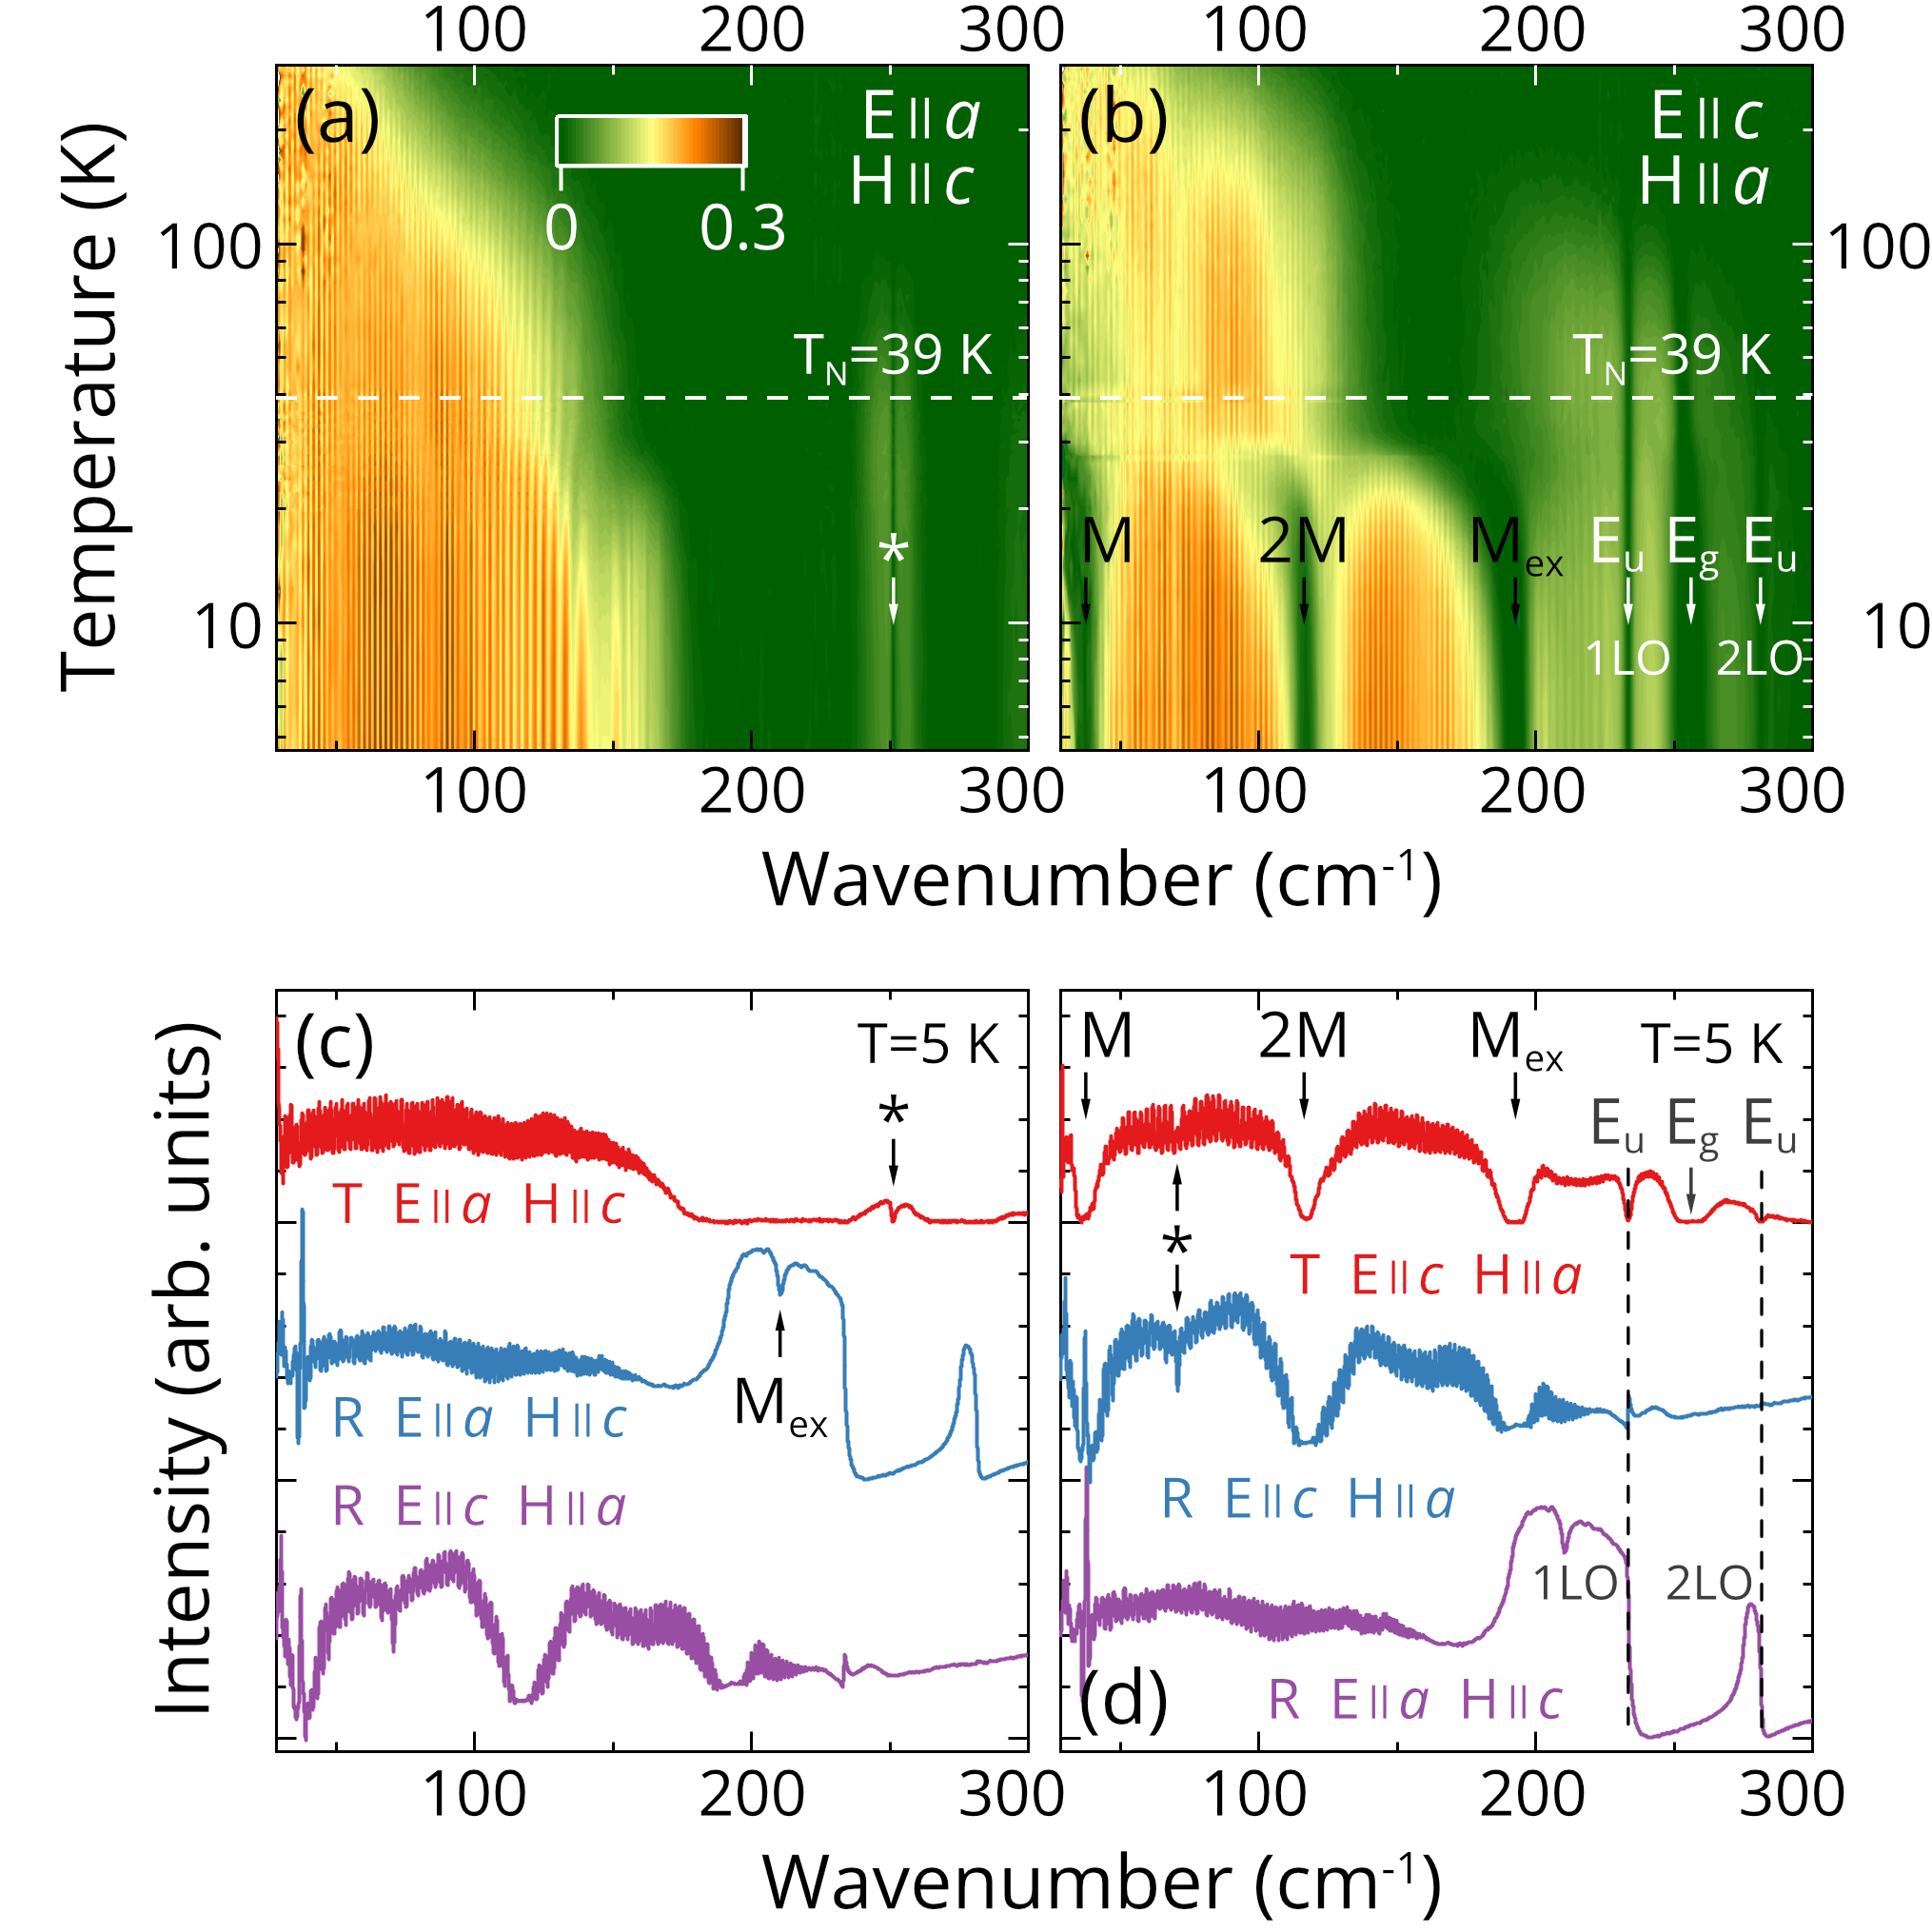
Absorption at 193 cm-1 corresponds to another magnetic excitation with symmetry [100; 49; 101; 102; 50]. Lines at 234 and 282 cm-1 are 1LO and 2LO frequencies of polar phonons with symmetry. Note that the absorption bands corresponding to LO polar phonons begin to be observed in the spectra at temperatures significantly higher than [see Fig. 4(b)]. According to the crystal symmetry, the phonons are active at . In the reflection spectrum, these off-symmetry LO modes also appear in forbidden polarizations as shown in Fig. 4(d). This effect occurs in uniaxial crystals in the infrared reflectivity spectra at the off-normal incidence of radiation with the -polarization [107]. We observe the appearance of this effect in the transmission spectra.
It is interesting to note that the absorption band at 256 cm-1 corresponds to the Raman-active phonon which is infrared inactive. Magnetodipole absorption of this Raman-active phonon was previously experimentally observed in and it is due to the coupling of magnetic excitations with the mode [108; 109; 110; 111; 101; 102]. Moreover, the magnetodipole phonon absorption begins at temperatures well above , as in the previously reported papers [see Fig. 4(b)]. Also, a slight absorption is observed at low temperatures at 71 cm-1 as shown by an asterisk in Fig. 4(d). The frequency of these features is close to the Raman-active phonon at 65 cm-1, but it is most likely an artifact and is unlikely to be related. Weak but distinct absorption line at 251 cm-1 was detected on the transmission spectra with , below K [see Fig. 4(a)]. This line is close to the Raman-active phonon at 256 cm-1. Still, any absence of temperature dependence indicates that it is related to the small amount of water in the cryostat, and not with the sample under study. Thus, the possesses several electrodipole and magnetodipole excitations with rich physics manifested in the infrared spectra.
III.2 Dielectric properties:
It is well known that the static dielectric permittivity of crystals is related to the th polar phonon thought its dielectric strength according to the expression [112]:
| (8) |
The static , high frequency dielectric permittivities, and dielectric strengths evaluated from reflectivity spectra at room temperature using Eq. (8) are listed in Table 1 and in Figs. 2(c) and 2(d). We observed that our obtained values of the dielectric parameters are in fair agreement with previously published data [56; 57].
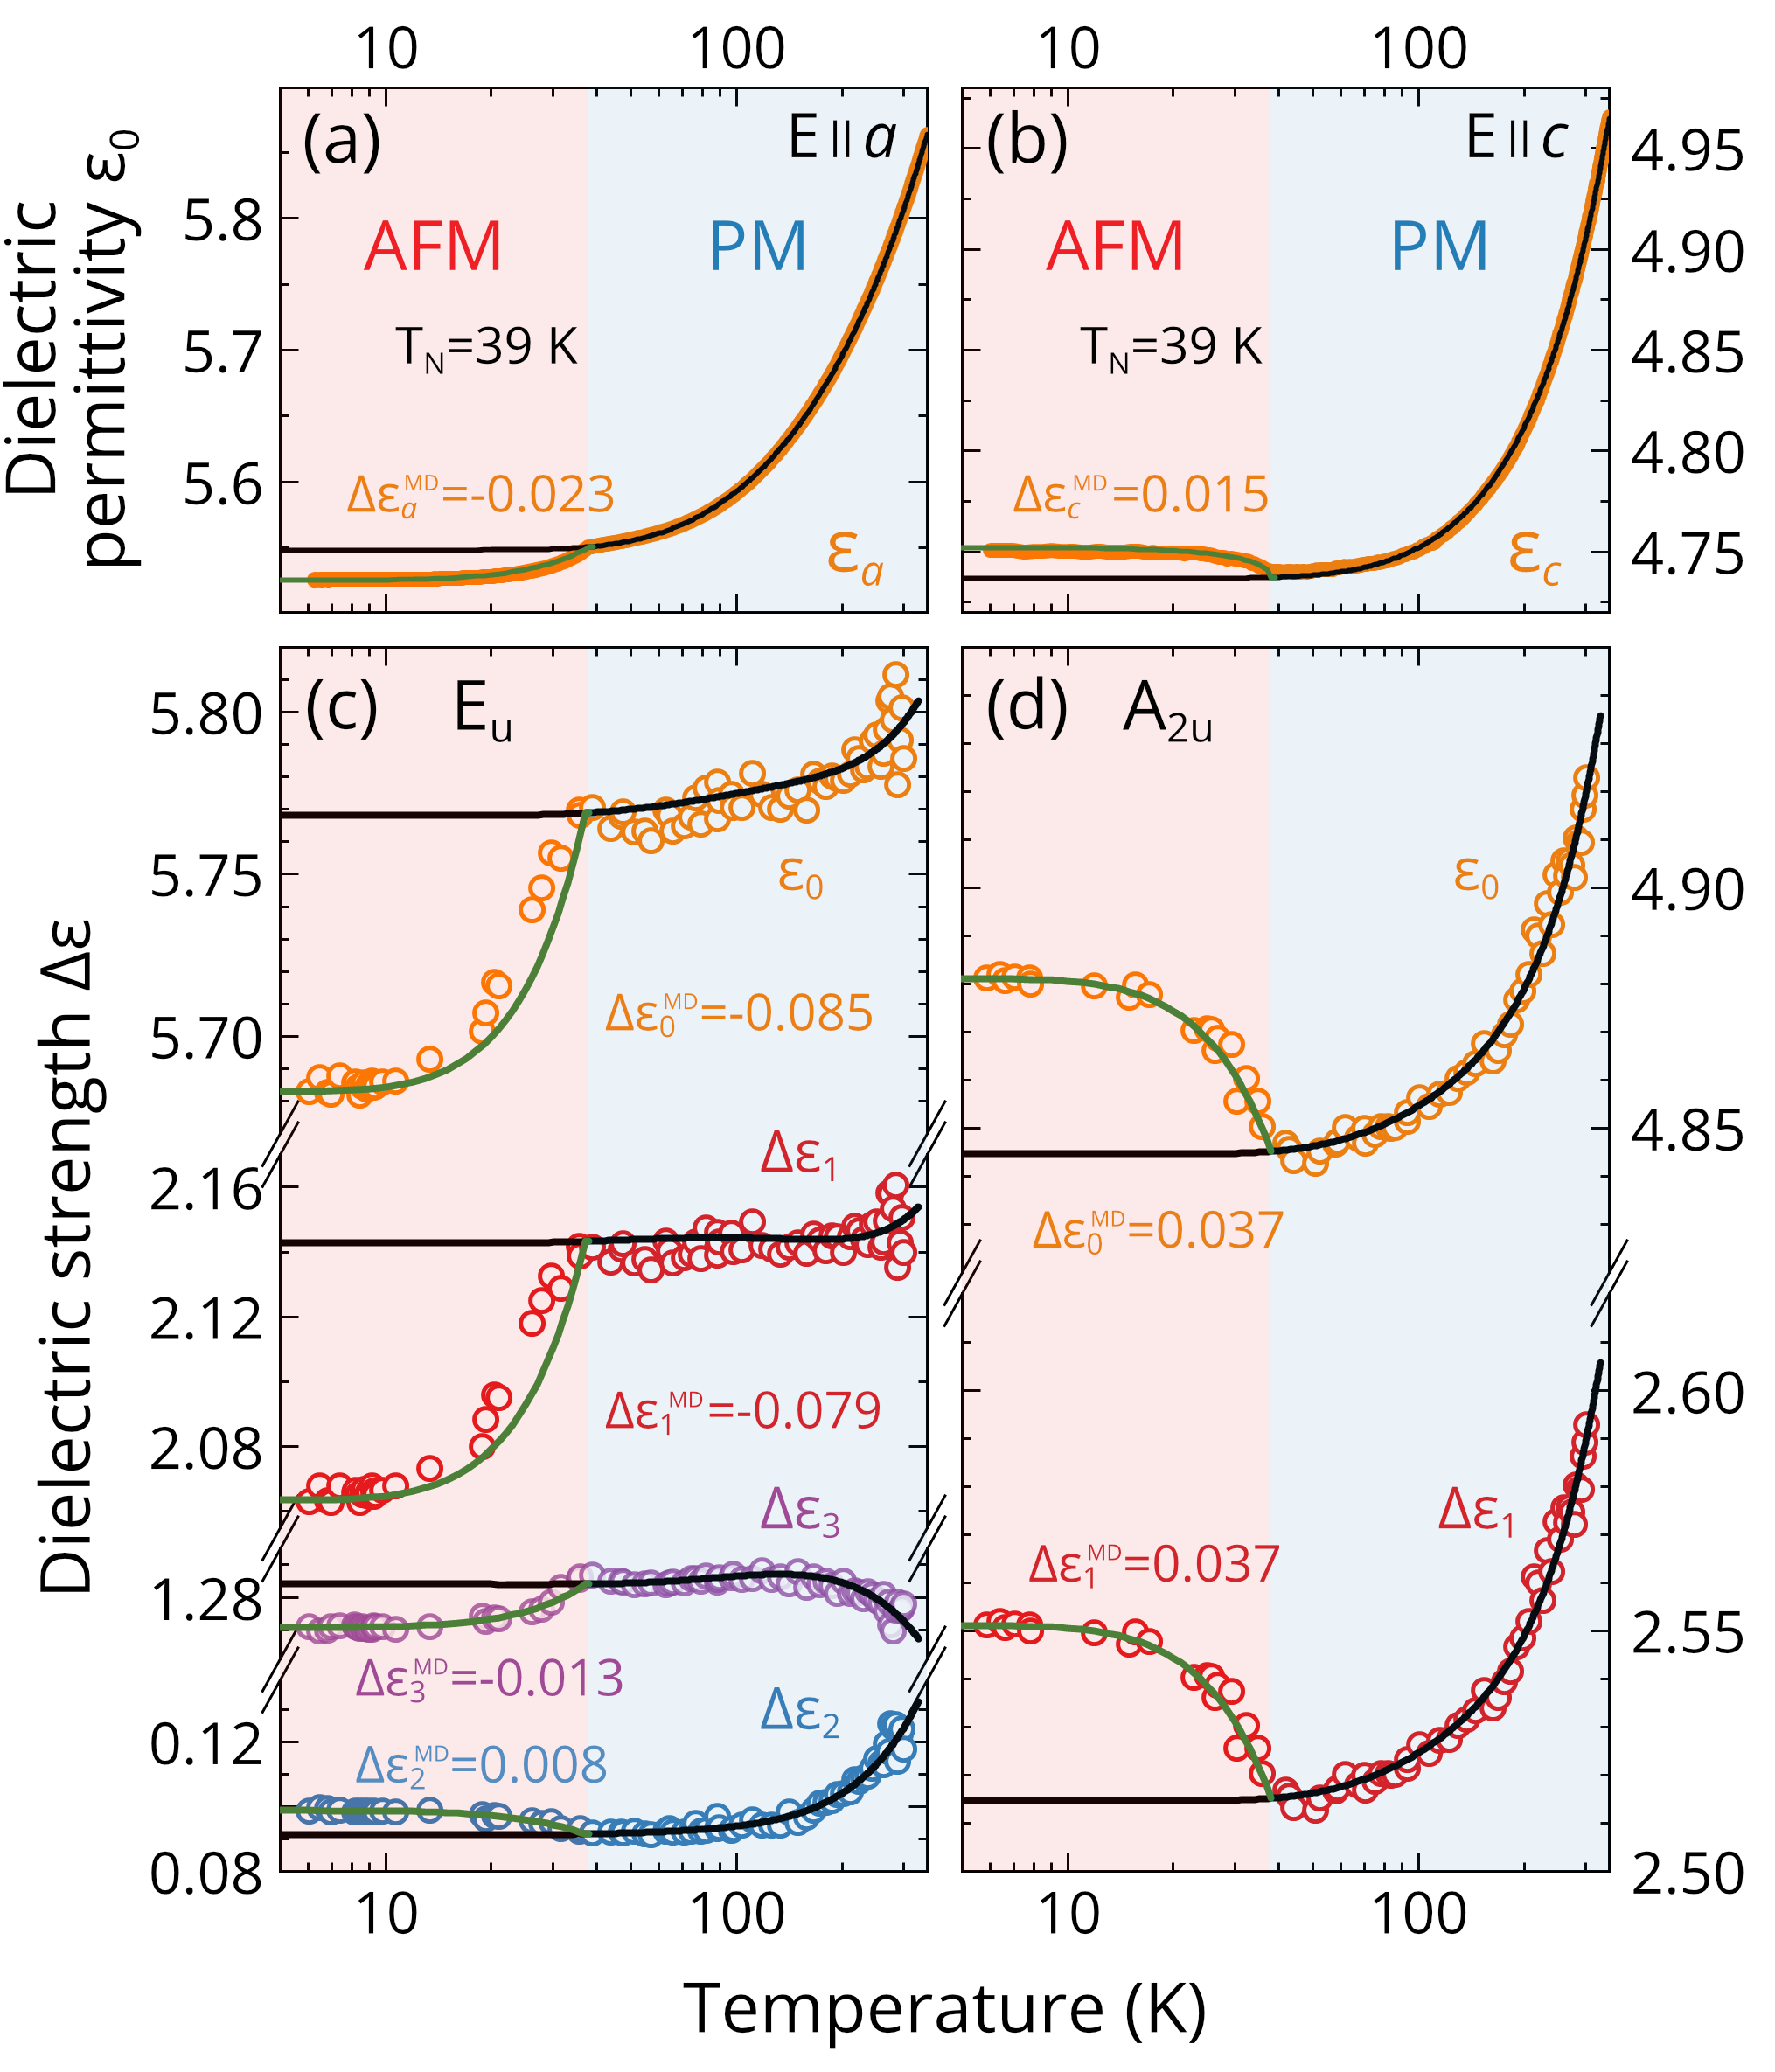
The temperature behavior of the dielectric permittivity at frequencies (about 1 MHz) much lower than lattice excitations represents the general temperature trend of the dielectric strengths of polar phonons. Figures 5(a) and 5(b) show experimental temperature dependencies of the low-frequency dielectric permittivities measured in along the and axes, respectively. At all temperatures the relation holds. The values and at room temperature are close to those obtained from reflectivity spectra (see Table 1). The low-frequency dielectric permittivities and decrease at cooling in the paramagnetic phase along both axes and the relative magnitude of these changes is comparatively tiny and amounts about 3%. Note that the similar temperature behavior of the low-frequency dielectric permittivity was previously observed in the isostructural diamagnetic crystal [113]. Moreover, this temperature behavior of the dielectric permittivity is typical for conventional dielectric crystals [114; 115; 116; 113].
At the Néel temperature K both temperature dependencies of the dielectric permittivity exhibit kinks due to the spontaneous magnetodielectric effect, as shown in Figs. 5(a) and 5(b). Below the value of decreases, while , on the contrary, increases at cooling [see Figs. 5(a) and 5(b)]. It is worth mentioning that similar temperature behavior of the and below was previously observed in the isostructural antiferromagnet [29; 30]. To extract the spontaneous magnetodielectric effect, the temperature behavior above was fitted by an Einstein-type function [117; 118; 29; 30]:
| (9) |
where is the temperature independent low-frequency dielectric permittivity, is constant, is the frequency of the “effective” polar phonon. The fit results using Eq. (9) which are shown by black lines in Figs. 5(a) and 5(b) allow us to extrapolate the “pure” low-frequency dielectric permittivity to the antiferromagnetic phase. The differences between experimental and fit lines give the magnetic contribution caused by the spontaneous magnetodielectric effect according to expression that is close to the Eq. (5):
| (10) |
where is a coefficient defining the spontaneous magnetodielecric effect, and is described by Eq. (6). There is a good agreement between experimental results and fits using Eq. (10) below as shown by green lines in Figs. 5(a) and 5(b). The obtained values of the and listed in Figs. 5(a) and 5(b), respectively, are somewhat less than those for from literature [29] which we can attribute to the difference in the values of the ion spins for and 5/2 for .
To reveal the contribution of each polar phonon to the we calculate the dielectric strengths using experimental and fit TO and LO phonon frequencies at different temperatures by employing Eq. (8). The obtained temperature dependencies of the dielectric strengths of the and polar phonons and the static dielectric permittivities along the and axes are shown in Figs. 5(a) and 5(b), respectively. We assumed that the high-frequency dielectric permittivity temperature changes are insignificant and can be neglected [119; 120]. It is seen that at the antiferromagnetic ordering the clear shifts of the dielectric strengths for all polar phonons are observed. These shifts are a manifestation of the spontaneous magnetodielectric effect caused by frequency changes of the polar phonons due to the spin-phonon coupling. Note that the for the medium frequency and lowest frequency polar phonons have a positive sign, while the and , on the contrary, are positive as shown in Figs. 5(a) and 5(b). A fair qualitative agreement is observed between the temperature behavior of the low-frequency and the static dielectric permittivities and their shifts below due to the spontaneous magnetodielectric effect as can be seen in Fig. 5. Thus, we have shown that the shifts of the macroscopic dielectric permittivity at antiferromagnetic ordering are caused by changes of the frequencies of microscopic polar phonons.
III.3 Lattice dynamics:
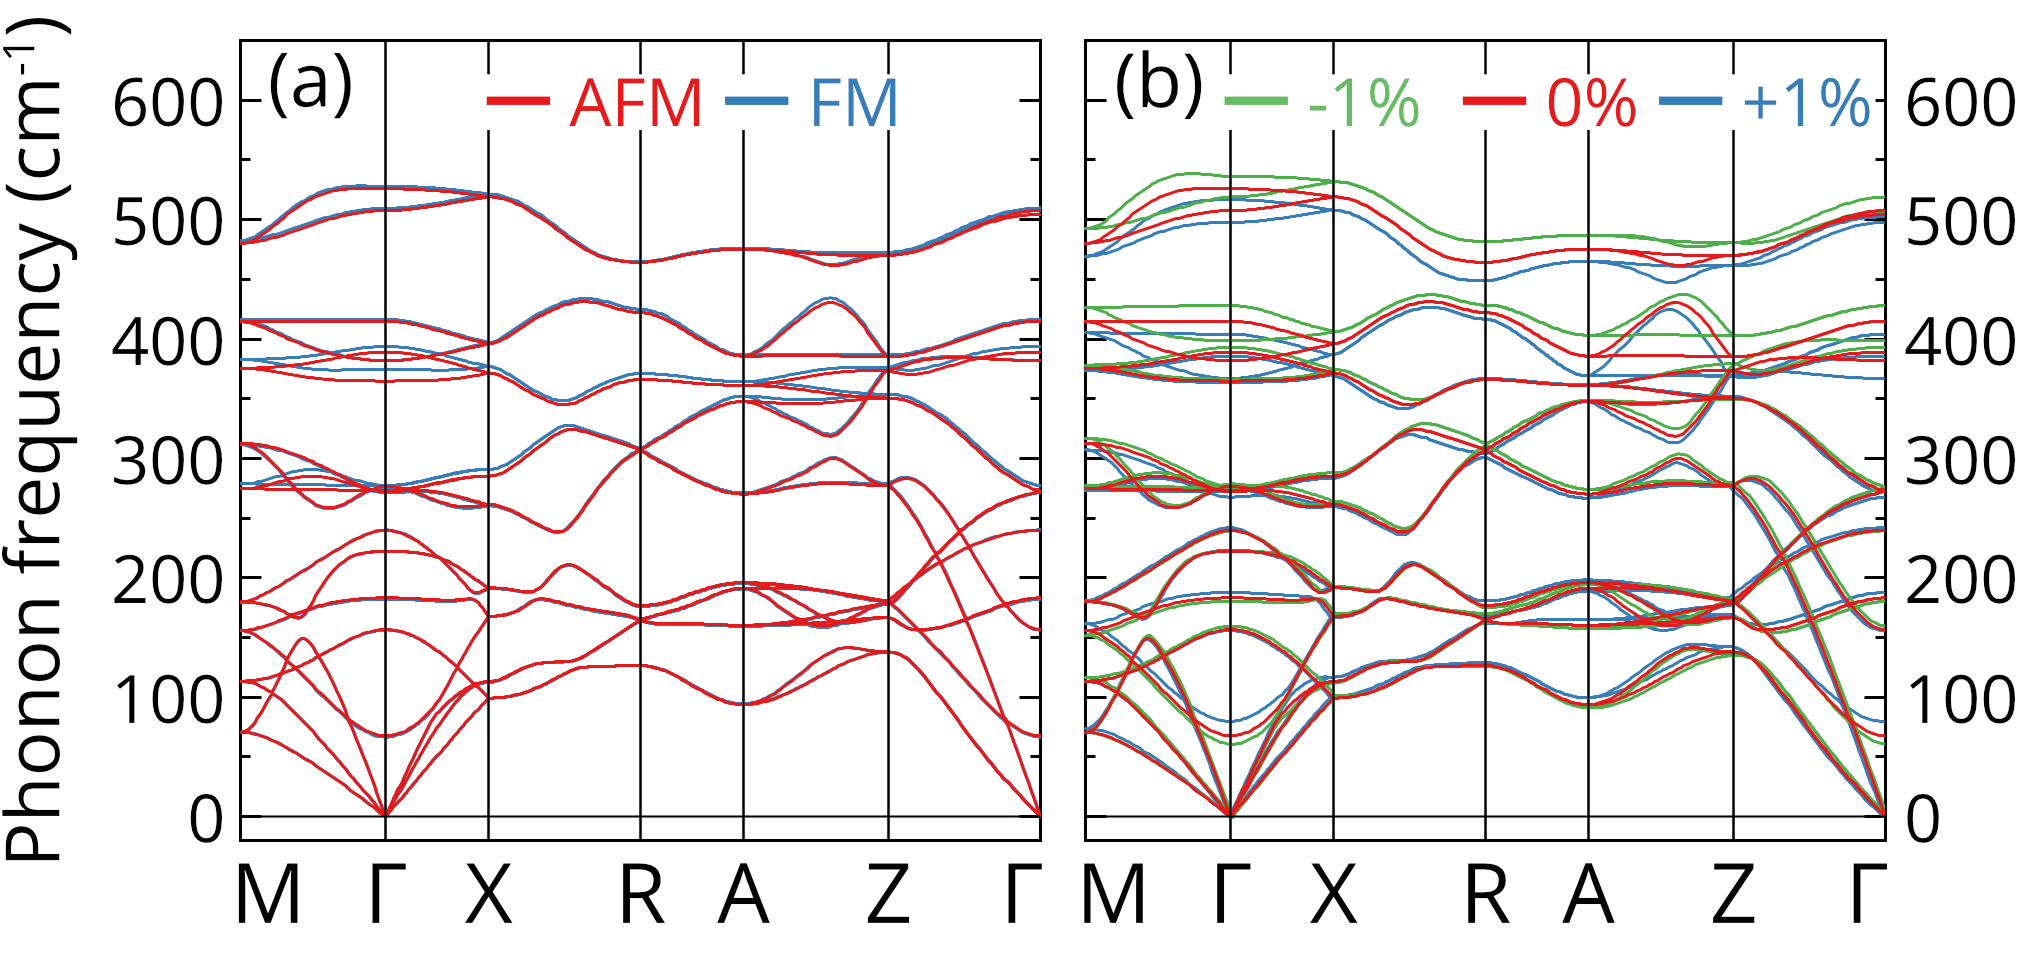
Aiming to explore the origin of the observed spin-phonon coupling, we performed several first-principles calculations of the lattice dynamics landscape in the in the antiferromagnetic (AFM) and ferromagnetic (FM) spin configurations considering the same lattice parameters as Åand Å. Because the nonmagnetic (NM) phase is not accessible for DFT calculations of magnetic crystals, we assumed as a reference that [28; 121]. The calculated phonon dispersion curves in the whole Brillouin zone for AFM (in red curves) and FM (in blue curves) spin configurations are shown in Fig. 6(a). The –––––– high-symmetry path shown in Fig. 1(b) was used in the lattice dynamics calculations. It is clearly seen that there are no significant differences between AFM and FM phonon dispersion curves which are consistent with the obtained values of the frequency shifts of about 1 cm-1 in the experiment. According to the Ref. [122], the difference between FM and AFM phonon dispersion curves is related to the second derivative from exchange interactions with respect to the ionic displacements, which is presumably small in rutiles with respect to other magnetic materials. Note that the calculated phonon frequencies are real (positive) in the whole Brillouin zone and therefore in space group is stable for both specified magnetic states.
| Act. | Sym. | Phonon | AFM | FM | NM | SP |
|---|---|---|---|---|---|---|
| IR | 183.26 | 182.08 | 182.67 | 0.59 | ||
| 222.29 | 222.22 | 222.25 | 0.04 | |||
| 272.32 | 271.32 | 271.82 | 0.5 | |||
| 276.65 | 275.72 | 276.19 | 0.47 | |||
| 414.95 | 416.52 | 415.74 | -0.78 | |||
| 525.81 | 527.93 | 526.87 | -1.06 | |||
| 364.82 | 374.72 | 369.77 | -4.95 | |||
| 504.47 | 509.74 | 507.11 | -2.63 | |||
| R | 67.78 | 66.63 | 67.2 | 0.58 | ||
| 273.16 | 277.35 | 275.25 | -2.1 | |||
| 381.8 | 381.88 | 381.84 | -0.04 | |||
| 507.65 | 509.51 | 508.58 | -0.93 | |||
| S | 156.74 | 156.34 | 156.54 | 0.2 | ||
| 239.8 | 240.13 | 239.96 | -0.17 | |||
| 389 | 393.78 | 391.4 | -2.39 |
The calculated frequencies of the optical phonons in AFM, FM, and NM states at the center of the Brillouin zone and estimated values of frequency shifts below () are listed in Table 2. The phonon frequencies are in fair agreement with previously reported calculations [124], experiments [56; 57; 55; 58; 97], and our data from Table 1. Signs and magnitudes of for polar phonons obtained in our calculation agree with our experimental findings shown in Fig. 3. Thus, in these both cases have positive sign for , , , and frequencies of the phonon and negative sign for other and phonons. For Raman-active phonons in there is fair agreement between the experiment from Ref. [97] and our simulation for , , and phonons, whereas for phonon has different sign. However, it is worth noting that the spin-phonon frequency shift for the phonon in is different from those in , , and [97]. Besides, the for the polar 3TO phonon of symmetry has an opposite sign in and [28], which also indicates a difference in the spin-phonon coupling mechanism in these antiferromagnets. Therefore, the lattice dynamic simulation shows that the magnetic ordering shifts the phonon frequencies without changing unit cell volume of .
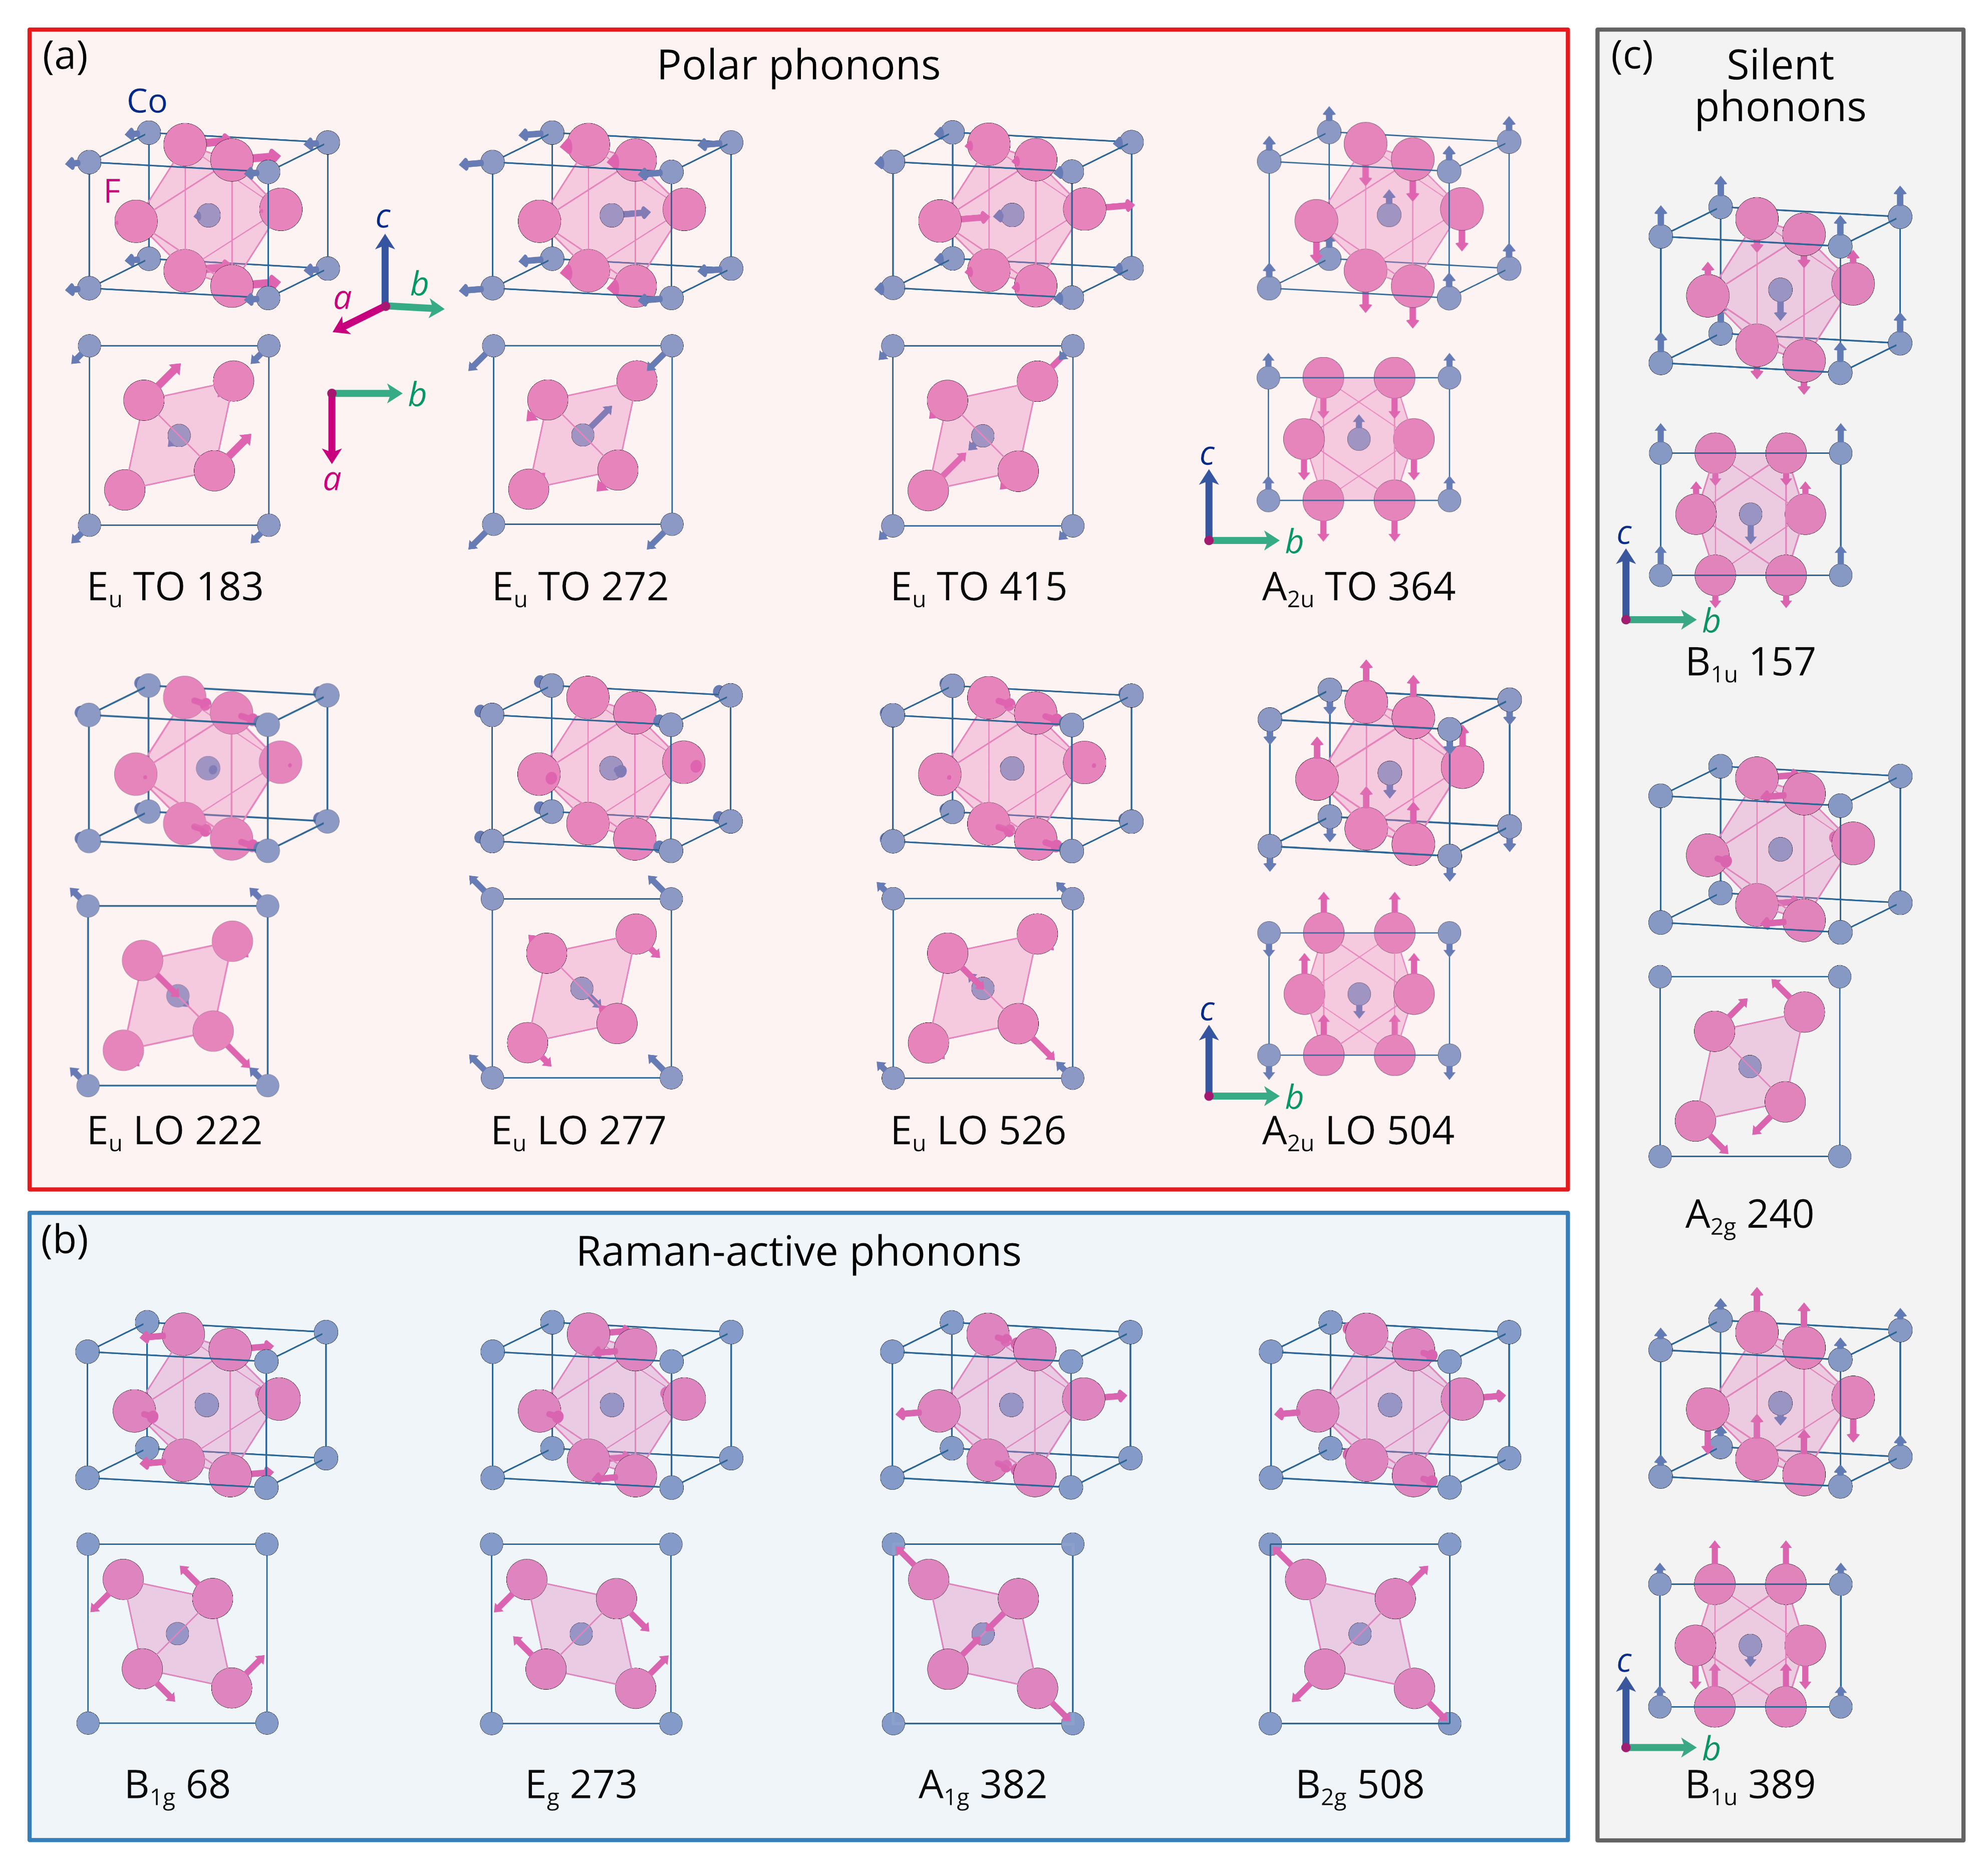
Next, we calculate eigenvectors for all-optical phonons in the Brillouin zone’s center, shown in Fig. 7. The obtained ion displacements for phonons in are close to the same ones in isostructural rutile [125]. As can be seen in Fig. 7(b), the Co ions remain unmoved tor all Raman-active and silent phonons. This is due to the fact that from symmetry the Co (2a) ions are active only for ungerade modes, while the F (4f) ions are involved for both gerade and ungerade phonons [84]. The ion displacement for most phonons are in the plane and only for the and vibrations are they along the axis, as shown in Fig. 7. Besides, we see that the phonon displacements do not change the distances between the nearest-neighborhood Co ions and thus does not significantly modulate the exchange interaction. This in turn manifests itself in a small frequency shift due to the spin-phonon coupling and an insignificant difference between FM and AFM phonon dispersion curves in Fig. 6. Thus, we can conclude that the rutile structure does not favor significant spin-phonon interaction, which is confirmed experimentally by us on and on from Ref. [28].
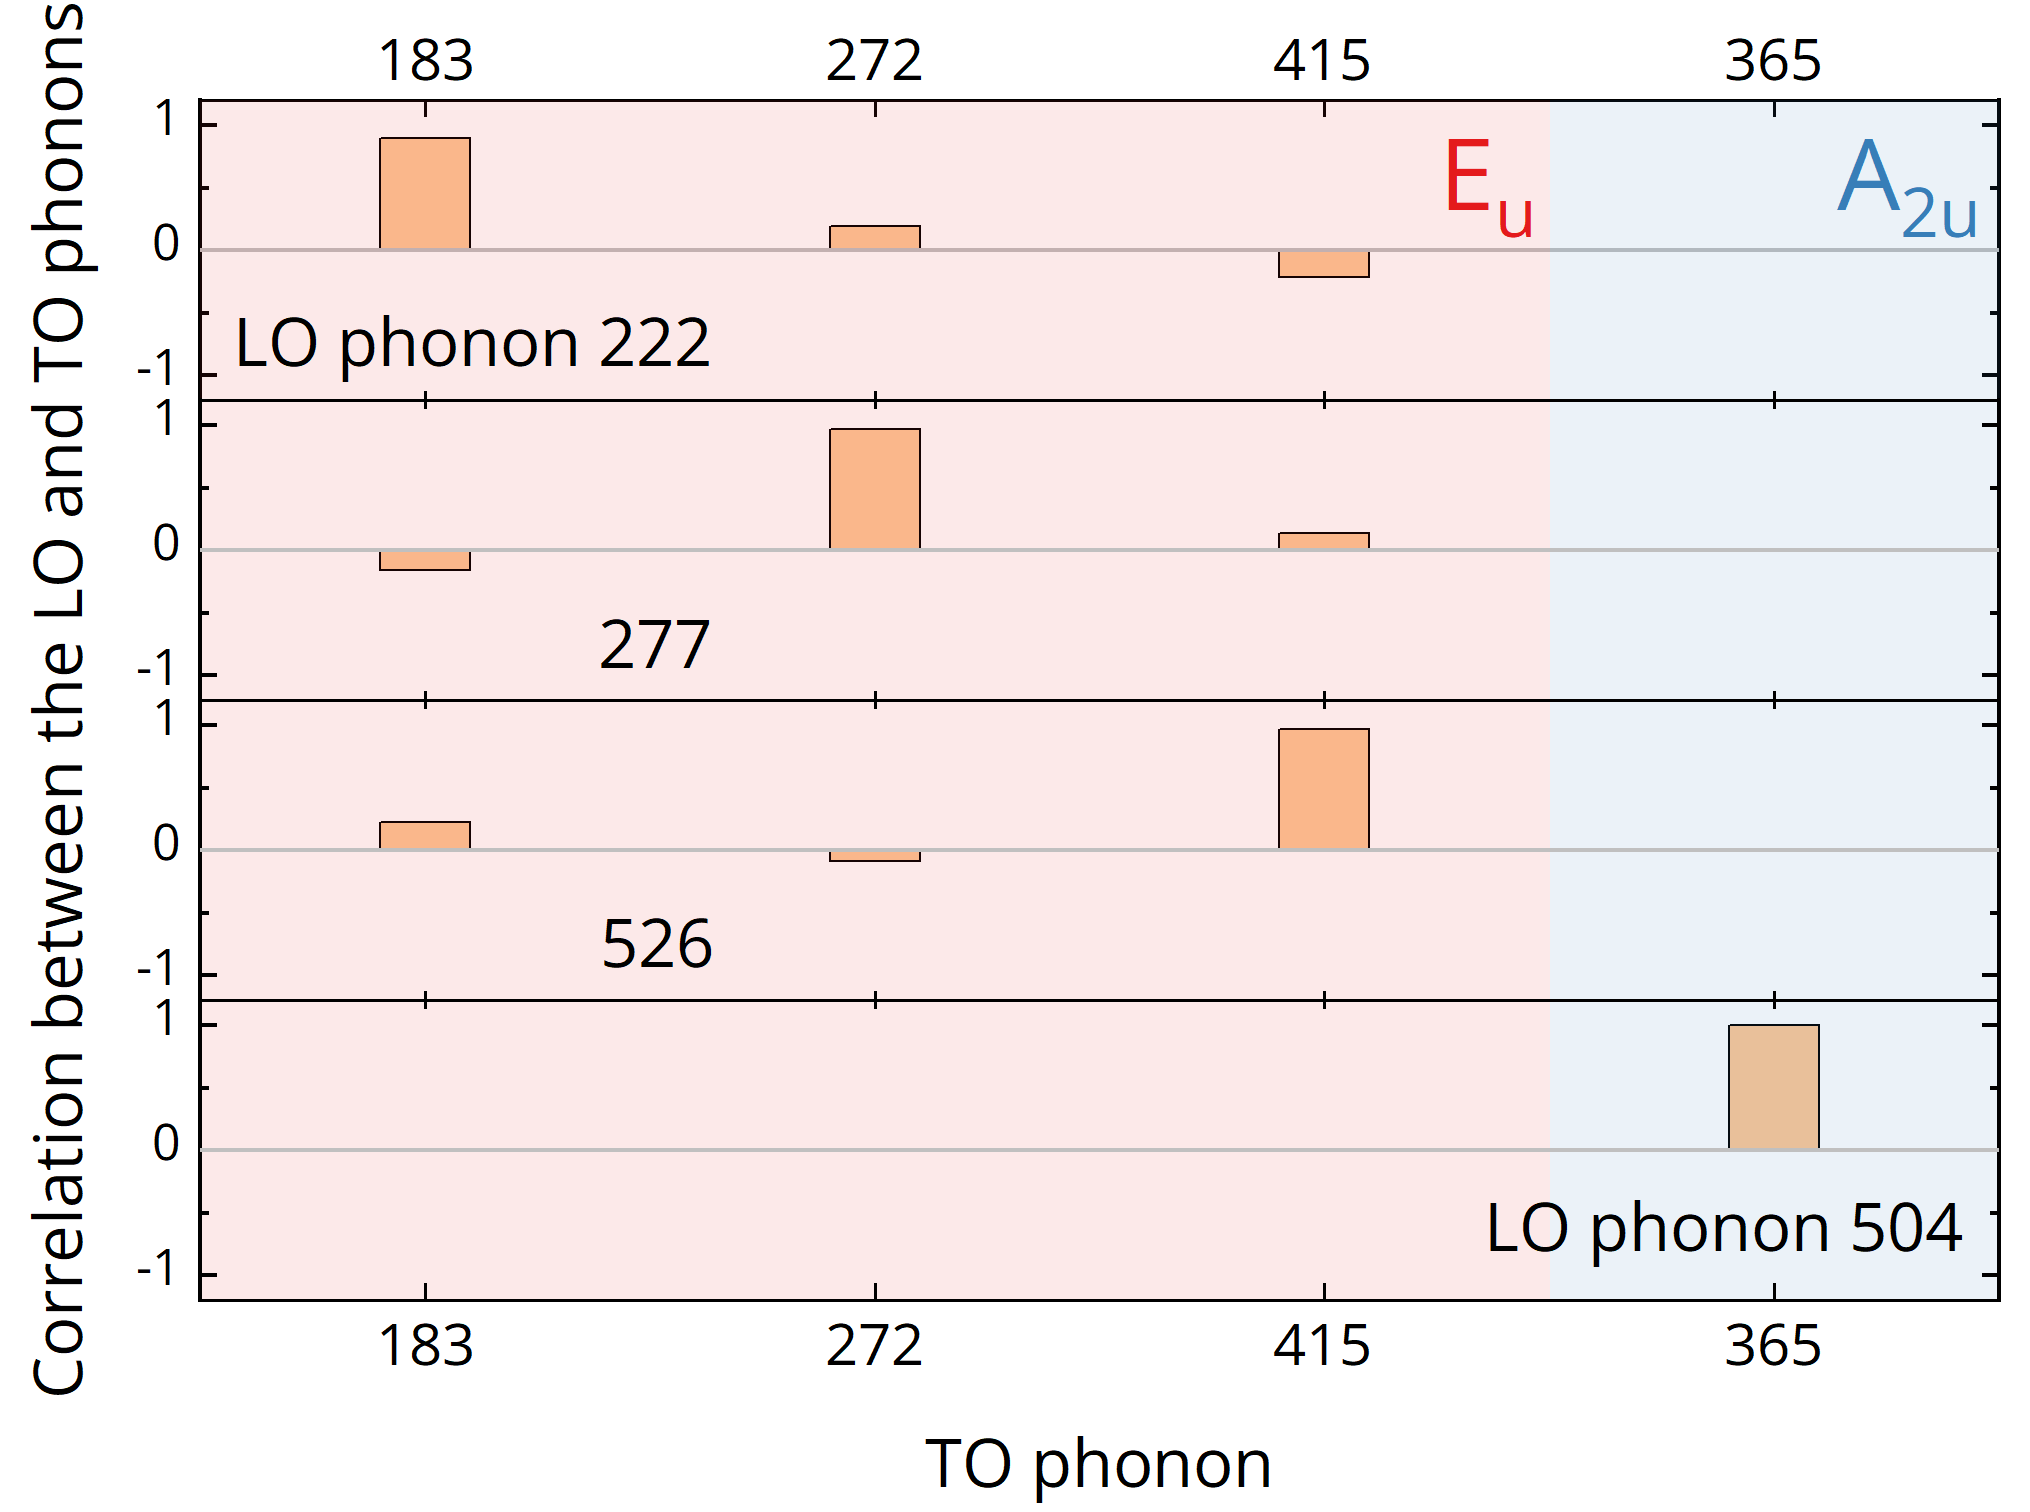
To assign LO to TO polar phonons we expand the eigenvector of the th LO mode to a linear combination of the TO normal modes [126; 127]. Figure 8 shows the overlap matrix , which represents the degree of correlation between eigenvectors of the th LO and th TO polar phonons. There is the “LO-TO rule” according to which in most crystals the sequence of polar phonons is such that the TO frequency is followed by LO frequency, with for each main crystallographic axis [128]. In the isostructural rutile , which is an incipient ferroelectric, a more complex pattern of the correlation matrix is observed, polar phonons are significantly mixed by the strong Coulomb interaction, and the “LO-TO rule” was not fully obeyed [125]. Conversely, the “LO-TO rule” is satisfied for all polar phonons in and LO is more correlated with the nearest TO mode of the same symmetry with . Moreover, since the polar phonon is the single one, the eigenvectors () are equal and ion displacements for this TO and LO modes are the same as can be seen in Fig. 7(a). Nonetheless, despite this fact, the frequency shifts are different in magnitude for TO and LO frequencies of the polar phonons () which proves that the frequency shift is inversely proportional to the phonon frequency [129]. In contrast, for polar phonons, there are slight differences in ion displacements for TO and LO modes [see Fig. 7(a)] due to the slight mode mixing caused by the Coulomb interaction [130; 125; 131].
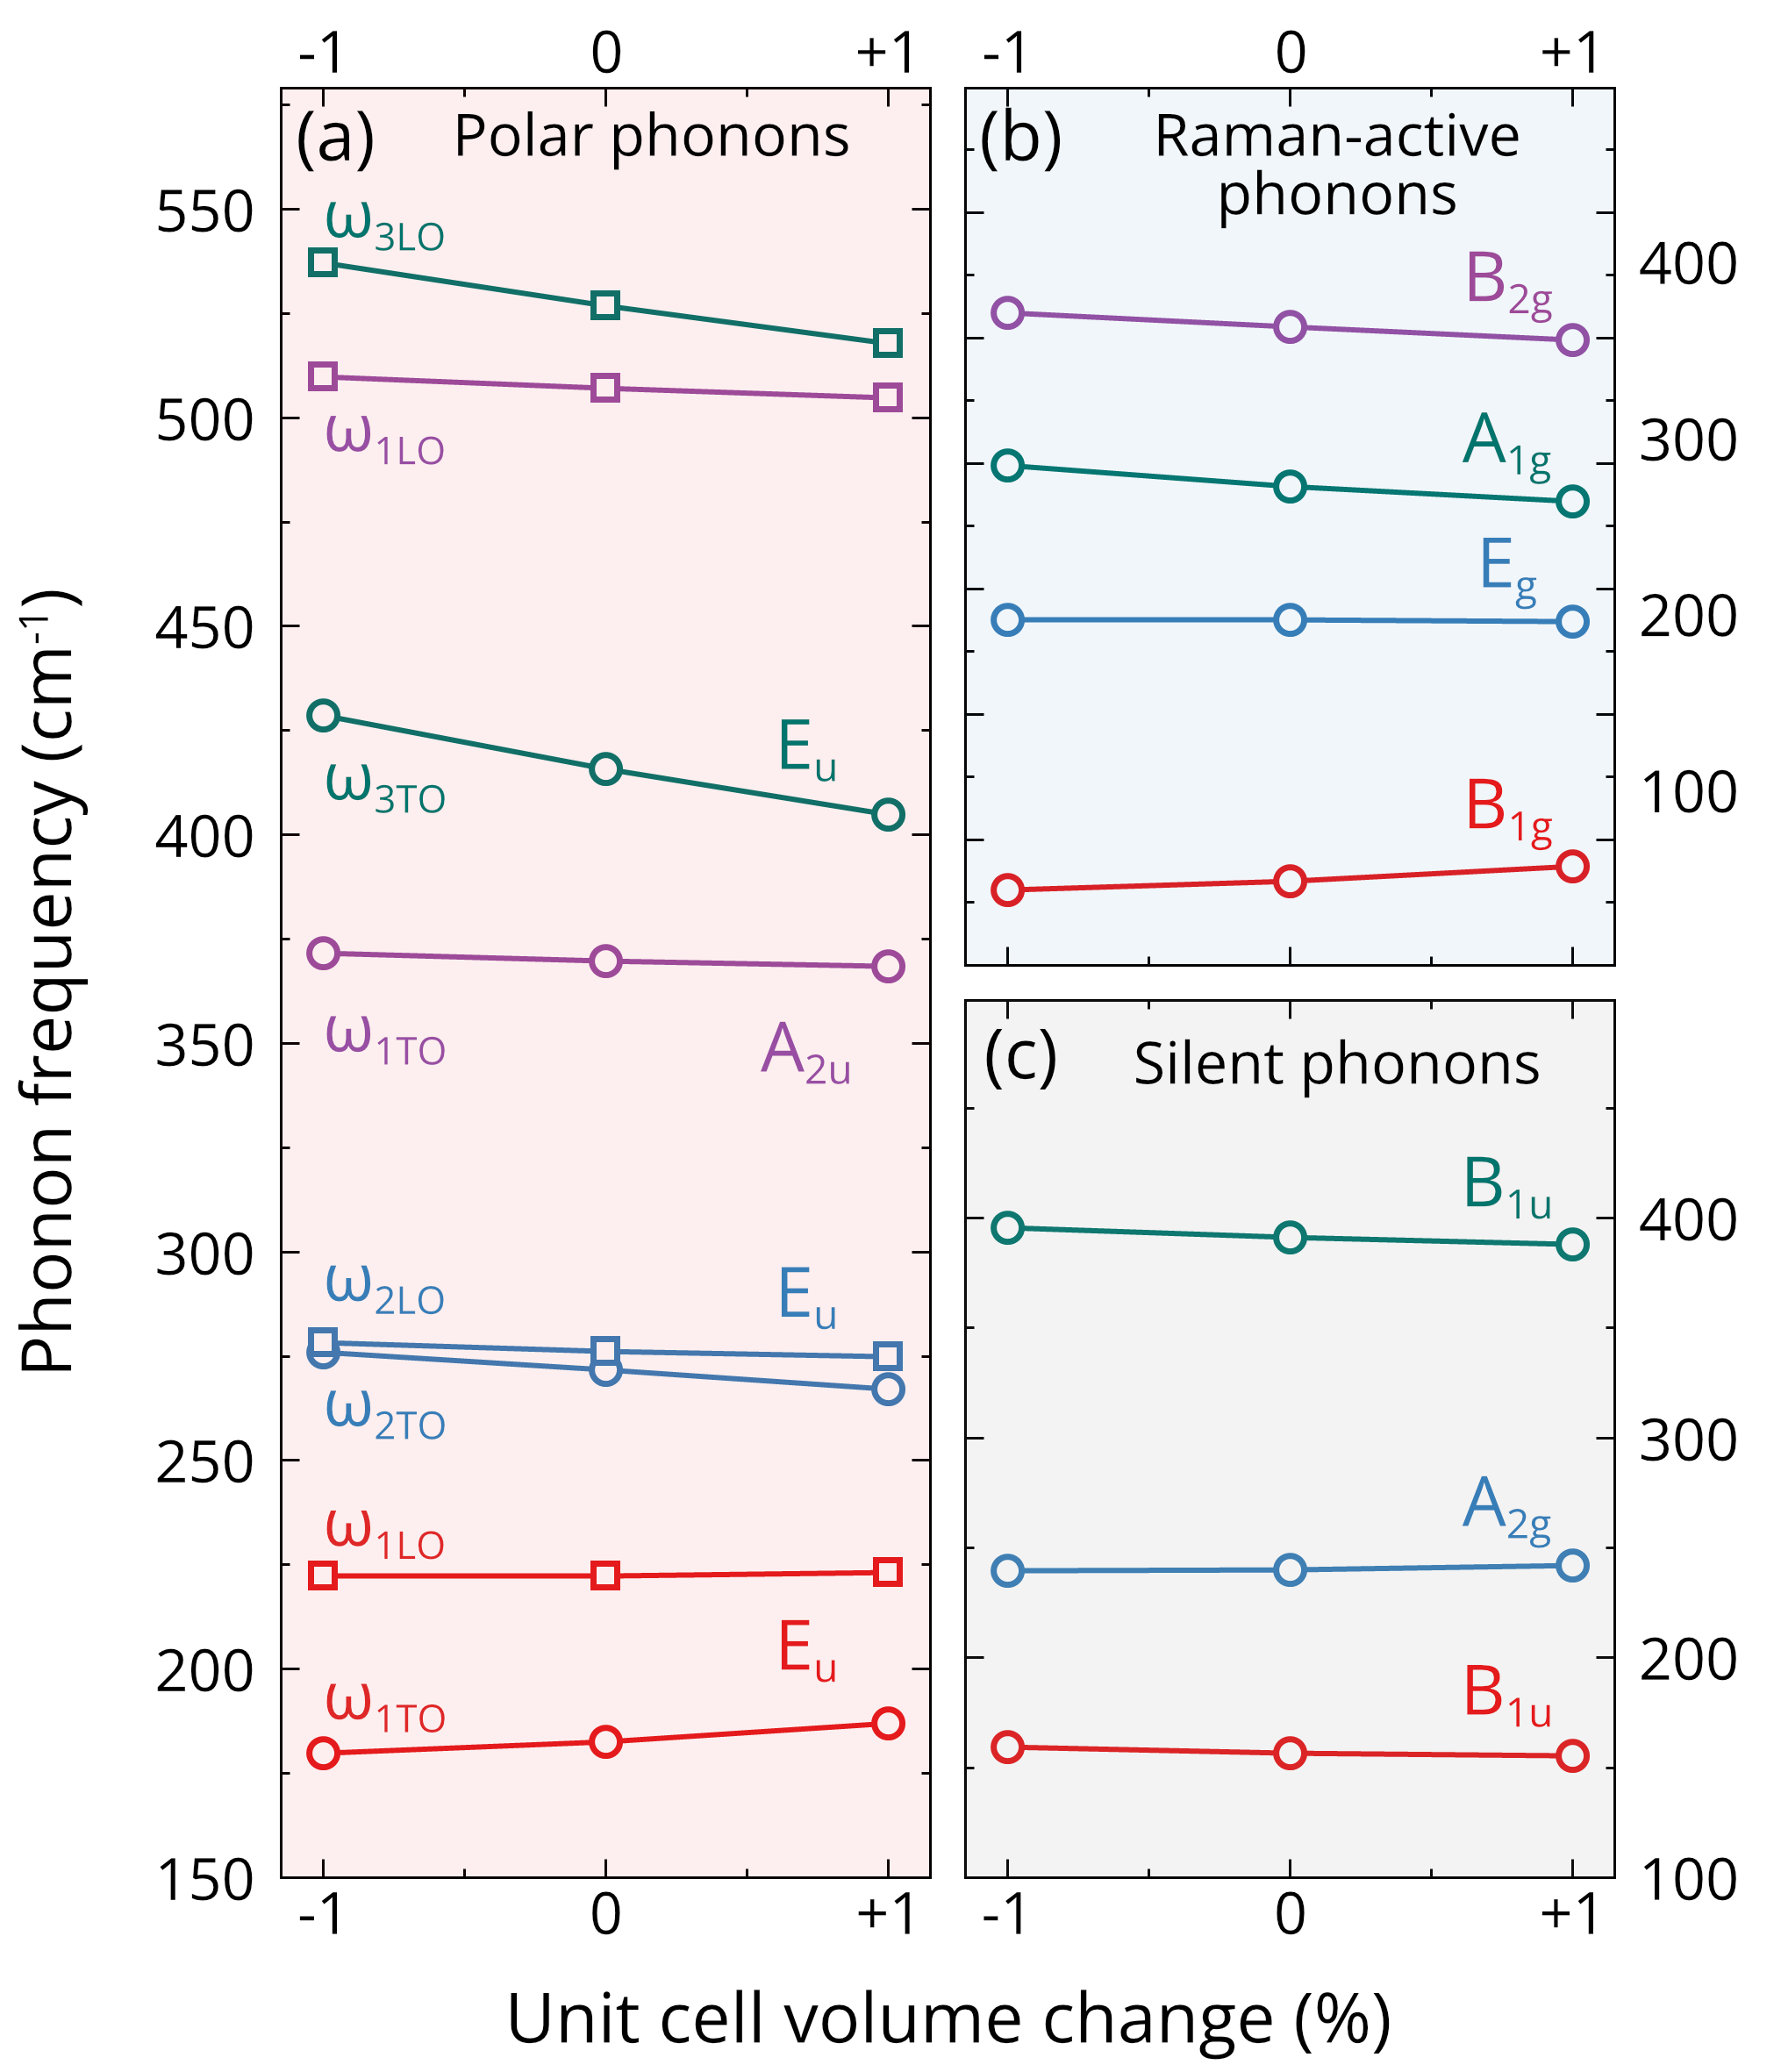
Aiming to reveal the volume effect on the phonons, we performed lattice dynamics simulations with the unit cell volume change of as shown in Fig. 6(b). The dispersion curves of phonons qualitatively have the same behavior in the whole Brillouin zone. Calculated frequencies of phonons at the center of the Brillouin zone as a function of the unit cell volume are shown in Fig. 9. According to Ref. [34], the lattice parameters decrease at cooling in the paramagnetic phase, thereby reducing the unit cell volume in . Figure 9(a) shows that frequencies of not all polar phonons increase at the compression of the unit cell as in our experiment (see Fig. 3). So, the frequency of the phonon decreases with compression of the unit cell, whereas in our experiment, on the contrary, it increases. Thus, the temperature dependences of not all polar phonons can be explained only by a harmonic change in the unit cell volume. The frequencies of Raman-active phonons in the calculation, see Fig. 9(b), and experiment [97] behave in the same way at the volume changes. Note that the frequencies of the silent phonons in our calculations change rather weakly when the unit cell volume changes.
According to Ref. [34], the lattice parameters and increase, whereas decreases at cooling below the Néel temperature in the antiferromagnetic phase due to the magnetostriction effect. It can be seen that the change in the volume of the unit cell as a result of magnetostriction cannot explain the sign of frequency shift at the antiferromagnetic ordering since is negative for phonons. At the same time, the compression of the axis leads to an increase in its TO and LO frequencies, as shown in Fig. 9(a). The observed phonon frequency shifts at the antiferromagnetic ordering in cannot be explained only due to observed magnetostriction.
| Sym. | Mode | AFM | FM | NM | MD |
|---|---|---|---|---|---|
| 2.23 | 2.30 | 2.26 | -0.031 | ||
| 0.103 | 0.102 | 0.103 | 0.001 | ||
| 1.34 | 1.32 | 1.33 | 0.006 | ||
| 2.55 | 2.53 | 2.54 | 0.011 | ||
| 6.23 | 6.25 | 6.24 | -0.013 | ||
| 2.41 | 2.23 | 2.32 | 0.09 | ||
| 2.64 | 2.62 | 2.63 | 0.008 | ||
| 5.05 | 4.85 | 4.95 | 0.099 |
We have also estimated the dielectric strengths and static dielectric permittivity using Eq. (8) and phonons frequencies for AFM, FM and NM phases from DFT calculations, which are listed in Table 3. There is a good agreement with experimental data from Table 1. Moreover, the calculated signs and relative values of the shifts of the dielectric strengths correspond with the experimental ones for the most polar phonons, as can be seen in Figs. 5(c) and 5(d). The values of the spontaneous magnetodielectric effect obtained from DFT calculations also are in fair agreement with those for low-frequency dielectric permittivity and infrared spectroscopy. Thus, we conclude that the results of our DFT calculations adequately reflect the features of the lattice dynamics related to the antiferromagnetic ordering in .
III.4 Magnon-phonon coupling
After observing compelling evidence of spin-phonon coupling, our investigation delves into exploring the effects of phonon displacements on the magnetic properties of . Our approach begins with formulating the effective Heisenberg model, as:
| (11) |
Here, () represents the unit-length spin operator of the magnetic site (), while denotes the isotropic exchange interaction quantifying interactions between magnetic sites and . Once the exchange interactions are known, we can obtain the magnon frequencies by diagonalizing the Hesigneberg Hamiltonian. Our primary objective centers on scrutinizing the impact of lattice vibrations on the magnon spectra. To achieve this, we compute the perturbations in the exchange interactions elicited by the displacements induced by each distinct phonon mode.
In the case of , the magnetic properties are primarily influenced by the interactions among nearest and next-nearest-neighbors. These interactions are quantified by their respective exchange integrals, denoted as and , which are shown in Fig. 1(a). Table 4 presents the values of and derived from first principles computations for the ground structure of in comparison with experimental data from Refs. [132; 53]. The calculated value of aligns closely with experimental observations, playing a pivotal role in inducing antiferromagnetic behavior in . In contrast, our computation of reveals a discrepancy in sign compared to experiments. Notably, this sign mismatch persists across variations in DFT parameters, exchange-correlation functionals, and methodologies employed to determine the exchange constants. Nevertheless, our findings are consistent with those reported for the isostructural antiferromagnet in the existing literature [133]. Despite the ambiguity surrounding the sign of , we proceed with our analysis based on the consensus regarding the accuracy of the values.
| Method | (meV) | (meV) | Reference |
|---|---|---|---|
| Green’s function | 0.9344 | 1.7500 | This work |
| Energy mapping | 1.034 | 1.5998 | This work |
| Raman scattering | -0.15 | 1.6 | Ref. [53] |
| Neutron scattering | -0.207 | 1.53 | Ref. [132] |
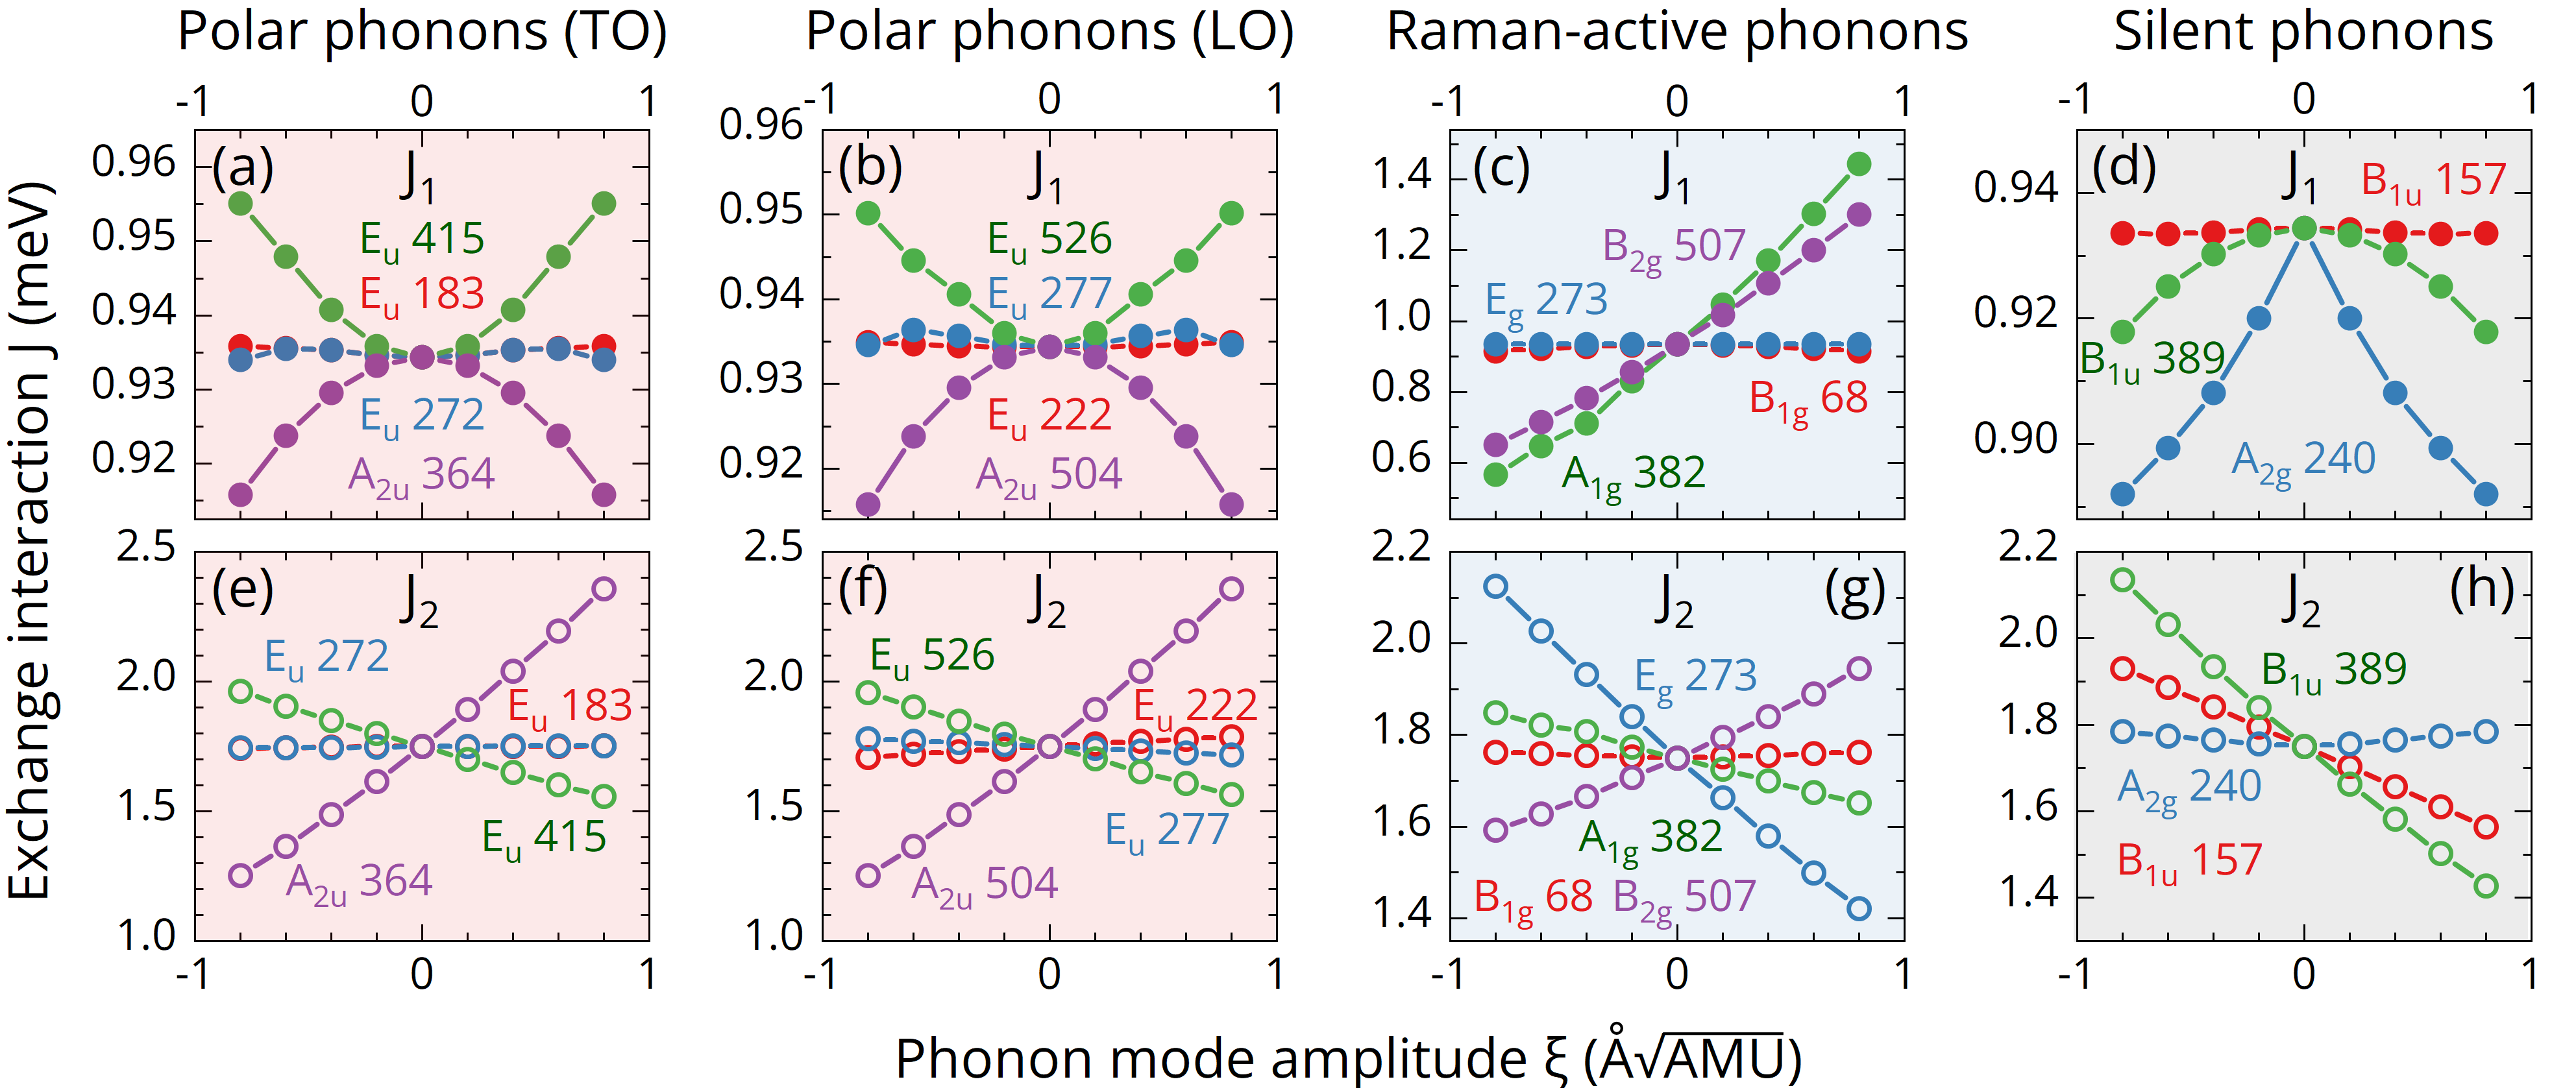
The exchange interactions in the Heisenberg model are described by fixed values. However, the interaction between two magnetic sites depends on the distance that separates them. Consequently, the displacements induced by the phonon modes are anticipated to influence the values of and . This motivates us to express each exchange constant as
| (12) |
where is the exchange interaction computed by using the equilibrium distances, is the phonon amplitude, and labels a particular phonon mode. Furthermore, represents lattice distortions that modify the exchange interactions, which could be induced by strain or optical excitations [134; 135].
The coefficients and on the right-hand side of Eq. (12) quantitatively describe the effect of a particular phonon mode on the exchange interactions. To obtain them, we calculate the exchange interactions of the distorted structures given by frozen phonon modulations for different amplitudes and fit the results to Eq. (12). In Fig. 10, we plot the exchange constants as a function of the phonon amplitudes for each phonon mode. The exchange interactions and are affected significantly under the influence of the phonon modes. A similar strong modulation of the exchange interaction by phonons has been previously reported in the literature [136]. On the other hand, the frequency shifts of phonons at the antiferromagnetic ordering in are rather small, which is indicated by the competing effects of different sign from the dynamical modulation of exchange interactions and by phonons due to the coupling with spins. Besides, we see for that the first- and second-order terms of Eq. (12) suffice to account for the exchange interaction variations, and therefore we neglect higher-order terms.
| Act. | Sym. | Phonon | ||||
|---|---|---|---|---|---|---|
| IR | 0.000 | 0.002 | 0.005 | 0.004 | ||
| 0.000 | 0.002 | -0.049 | -0.004 | |||
| 0.000 | -0.001 | 0.006 | -0.001 | |||
| 0.000 | -0.000 | 0.039 | -0.002 | |||
| 0.000 | 0.032 | -0.252 | 0.017 | |||
| 0.000 | 0.024 | -0.245 | 0.020 | |||
| 0.000 | -0.029 | 0.691 | 0.085 | |||
| 0.000 | -0.029 | 0.691 | 0.085 | |||
| R | 0.000 | -0.028 | 0.000 | 0.018 | ||
| 0.000 | 0.001 | -0.440 | 0.035 | |||
| 0.551 | 0.118 | -0.125 | -0.002 | |||
| 0.406 | 0.065 | 0.219 | -0.030 | |||
| S | 0.000 | -0.001 | -0.229 | -0.004 | ||
| 0.000 | -0.053 | 0.000 | 0.050 | |||
| 0.000 | -0.026 | -0.442 | -0.050 |
In the unperturbed structure of , and have the same value for all possible nearest and next-nearest-neighbor pairs of the Co ions, respectively. This is, generally, not true for the displaced structures since the distances and thus the interactions between neighbors can be different for equivalent pairs. In our case, we see that is the same for different nearest neighbor pairs (4 in total). This is because the phonons at the Brillouin zone center only produce intra-cell displacements, whereas corresponds to an inter-cell interaction. In contrast, the next-nearest-neighbor pairs (16 in total) are split into two equal groups characterized by the expression:
| (13) |
where () describes the interaction between two neighbors when their distance is increased (reduced) during a positive amplitude modulation. These two groups of interactions appear for every phonon mode except for , , and . In Table 5, we show the coupling coefficients for the nearest and next-nearest interactions .
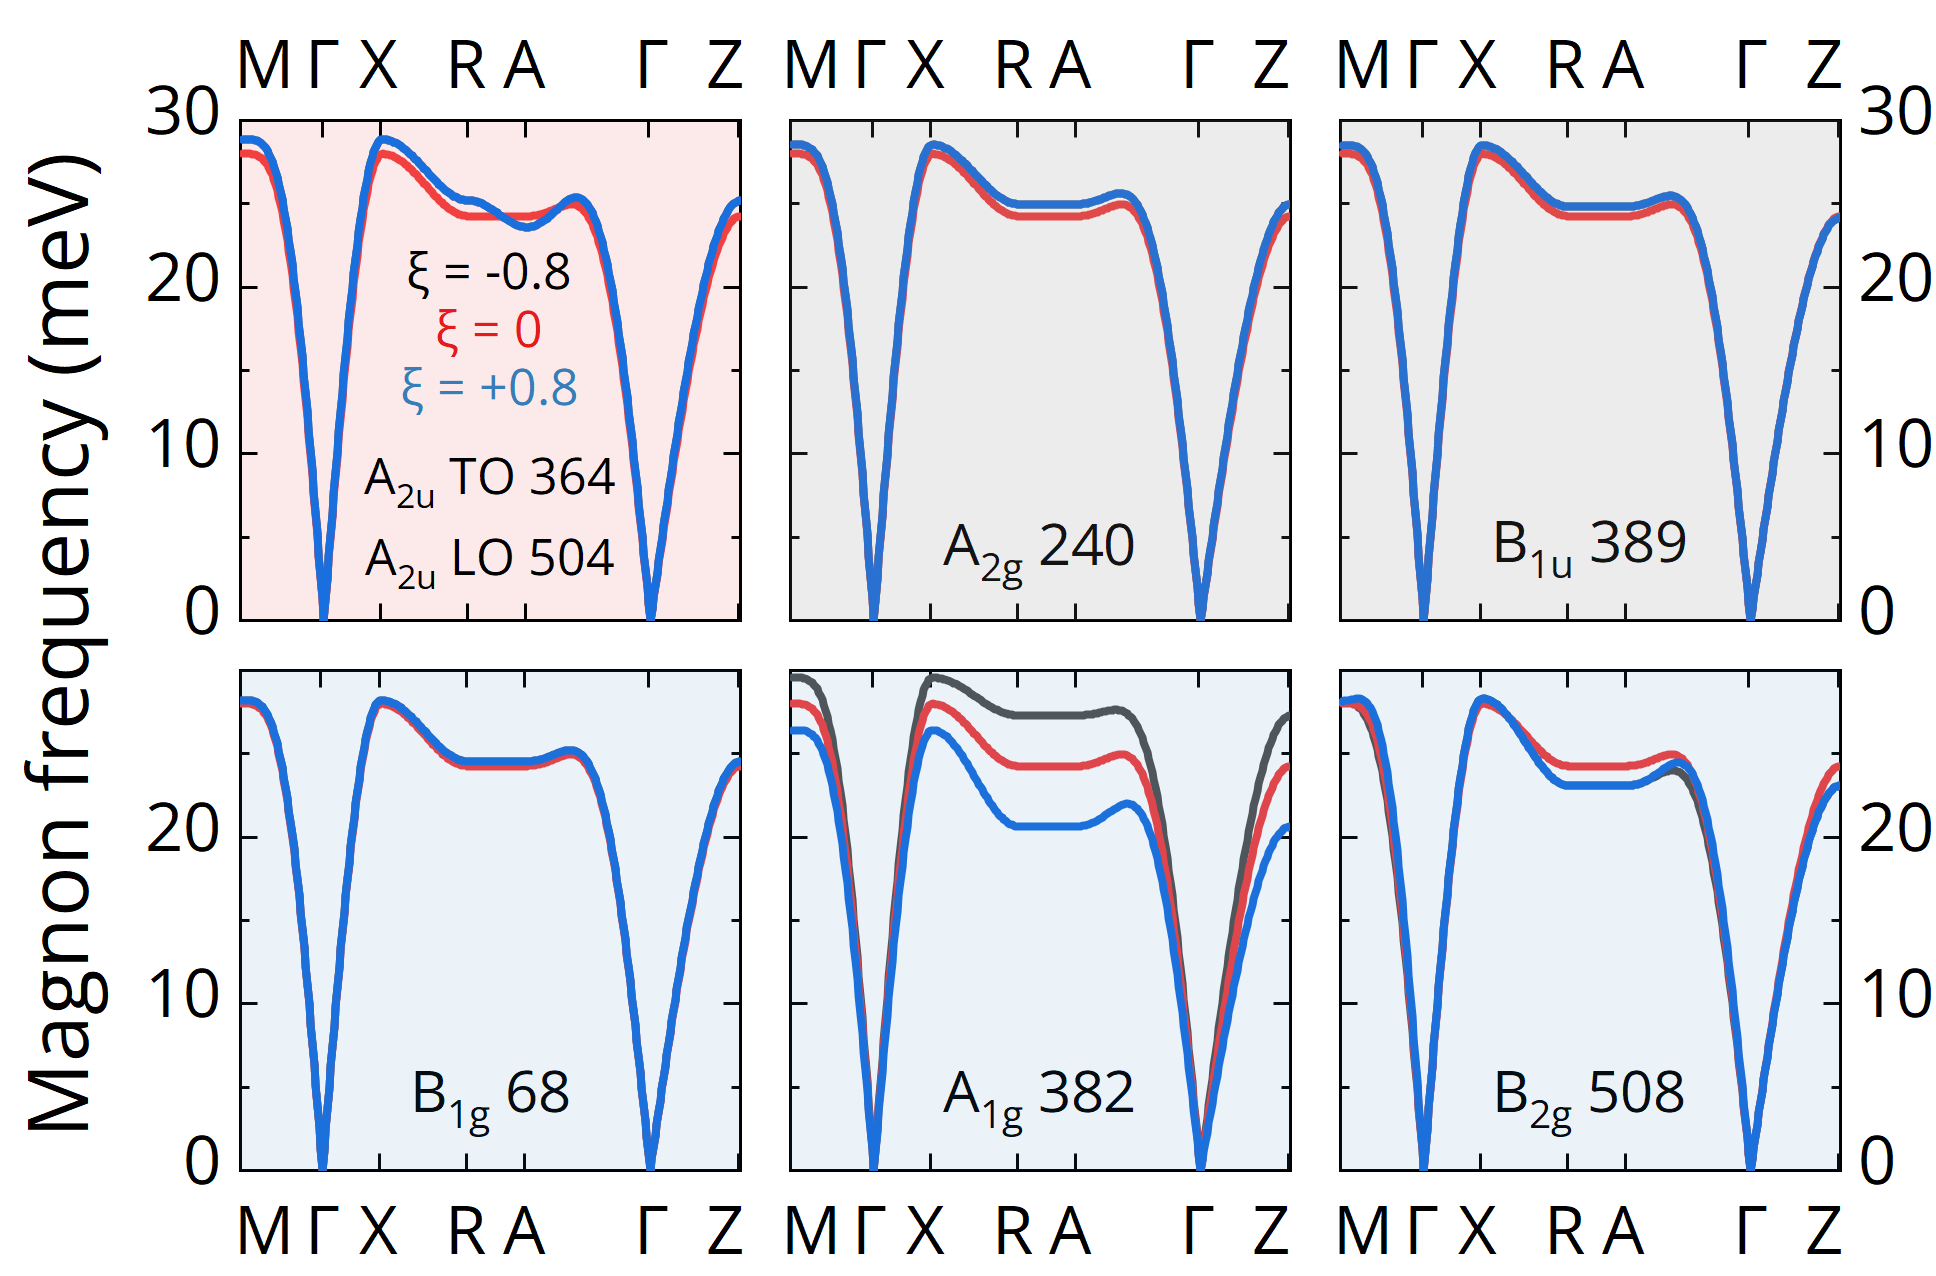
The preceding discussion underscores the anticipated dependence of magnon frequencies on phonon modulations. To scrutinize this relationship, we calculate the magnon spectra corresponding to the distorted structures induced by each phonon mode. The most representative outcomes of these analyses are depicted in Fig. 11. Note that, in general, the magnon (M) frequency at the Brillouin zone center , where is a gyromagnetic ratio, is a magnetic anisotropy field, and is an exchange field [137]. Since accounting for magnetic anisotropy is a challenging task, we did not take it into account in the calculations and assumed that . Thus, the magnon frequency at the point in our calculations is 0 meV whereas in our experiment it was 4.6 meV (37 cm-1). At the Brillouin zone boundaries, the magnon frequencies is determined only by the exchange interactions. The two-magnon (2M) mode frequency 14.2 meV (115 cm-1) allow us to estimate the magnon frequency at the Brillouin zone boundaries as 7.1 meV. This exceeds the calculated values of 24–28 meV (see Fig. 11), which we attribute to a significant discrepancy in the value of the exchange interaction between experiment and theory. Other studies analyze the magnon-phonon hybridization based on the overlap of the magnon and phonon spectra [138; 139]. In contrast, this study only considers the modulations of the magnon spectra coming from phonons at the center of the Brillouin zone and does not discuss of any avoided crossing between phonons and magnons [42].
For most phonons slight variations in the magnon spectra as a result of modulation are observed as shown, for example, for the Raman-active phonon in Fig. 11. Intriguingly, we observe that the most significant alterations in magnon frequencies stem from the mode despite it not possessing the most significant coupling coefficients as can be seen in Fig. 11 and Table 5, respectively. Conversely, modes characterized by more significant coupling coefficients, such as or , exhibit marginal deviations compared to the ground structure. This phenomenon can be elucidated by examining how the Heisenberg Hamiltonian evolves under a given phonon distortion. Specifically, for a designated phonon amplitude , we construct a modified Hamiltonian considering the interactions among the 4 and 16 nearest and next-nearest-neighbors as follows:
| (14) | ||||
The Hamiltonian’s actual form (III.4) reveals that the linear coefficient, , does not affect the magnon dispersion energies, as two types of interactions, and , emerge. Consequently, in , next-nearest-neighbor interactions contribute to magnon-phonon coupling only if they respond quadratically to lattice distortions. This clarifies why many phonon modes do not couple to magnetic response, as they primarily induce linear changes in (i.e., ). Only distortions from and modes notably modify , thereby influencing the magnon spectra as can be seen in Table 5. Therefore, even if a phonon mode can individually alter the exchange interactions, it may not measurably affect the magnetic properties. It should be mentioned that it has been shown experimentally that magnon is strongly coupled to the Raman-active phonon in [41]. But according to our calculation results the effect of influence of the mode to the magnon spectrum is rather small as can be seen in Fig. 11. The discrepancy arises because the experiment focused on studying the magnon at the center of the Brillouin zone, while our calculations did not account for magnetic anisotropy, which is critical for capturing the coupling between magnons and phonons at the point.
IV Conclusions and General Remarks
In summary, we have studied in detail the polar phonons at the point of the Brillouin zone in the rutile antiferromagnet in a wide temperature range, including the antiferromagnetic phase transition by far-infrared and dielectric spectroscopic techniques. We have experimentally observed that all polar phonons’ TO and LO frequencies shift at the antiferromagnetic phase transition. Moreover, our measurements have shown that the low-frequency dielectric permittivity also shifts at due to the spontaneous magnetodielectric effect. Still, the signs of these changes are opposite for the and axes. The combined analysis of these experimental results showed that the observed spontaneous magnetodielectric effect is mostly caused by changes in the frequencies of polar phonons at antiferromagnetic ordering.
Based on our first-principles calculations, we have found that observed shifts of frequencies of all polar phonons are fairly reproduced with antiferromagnetic ordering and unrelated to the unit cell changes due to the magnetostriction in . Thus, according to the calculations, the observed frequency changes of polar phonons and the low-frequency dielectric permittivity results due to spin-phonon coupling and spontaneous magnetodielectric effect are related to the dynamic modulation of the exchange interaction by phonons. In addition, we have observed magnetic excitations in the infrared spectra and identified their magnetodipole origin. First-principles calculations corroborate these observations, emphasizing the coupling between polar phonons and magnons through the dynamic modulation of the exchange interactions.
Notably, the most pronounced impact on the nearest-neighbor coupling is discernible in the Raman phonon mode, evident across both linear and quadratic regimes, albeit to a lesser extent on modes. While certain phonons may lack linear contributions to , they exhibit discernible quadratic contributions, which define the strength of the phonon-magnon coupling [140]. Conversely, concerning the next-nearest-neighbor coupling , myriad infrared, silent, and Raman modes exhibit linear coupling, with the quadratic contributions typically on par with or subordinate to those observed in the scenario. Regardless, significant phonon coupling in magnon spectra manifests predominantly when the quadratic term attains substantial magnitude, notably exemplified in the mode and, to a lesser degree, in the mode. Intriguingly, specific infrared and silent modes exhibit more significant linear coupling than their Raman counterparts.
We believe our results will stimulate further experimental and theoretical studies of nonlinear phononics in the antiferromagnet , in which a nontrivial nonlinear coupling was observed between polar, Raman-active phonons and magnons. The other attractive materials based on the ions with the unquenched orbital angular momentum and strong spin-orbit effects are insulating honeycomb magnets, e.g., and , which are of considerable scientific interest at the present time as a potential Kitaev system with nontrivial spin-phonon couplings which has yet to be revealed [141; 142; 143; 144; 145; 146].
Acknowledgments
We are grateful to V.A. Chernyshev for fruitful scientific discussion. We thank D.A. Andronikova and M.P. Scheglov for the help with the x-ray orientation of single crystal. The single crystal grown by S.V. Petrov was used in experiments. This work was supported by the Russian Science Foundation under grant no. 22-72-00025, https://rscf.ru/en/project/22-72-00025/. R.M.D. acknowledges the support of the Ministry of Science and Higher Education of the Russian Federation (FSWR-2024-0003). N.N.N. and K.N.B. acknowledge support by the research Project No. FFUU-2022-0003 of the Institute of Spectroscopy of the Russian Academy of Sciences. Some calculations included in this article were carried out using the GridUIS-2 experimental testbed. The latter was developed under the Universidad Industrial de Santander (SC3-UIS) High Performance and Scientific Computing Centre with support from UIS Vicerrectoría de Investigación y Extensión (VIE-UIS) and several UIS research groups. A.C.G.C. acknowledge grant No. 202303059C entitled “Optimización de las Propiedades Termoeléctricas Mediante Tensión Biaxial en la Familia de Materiales ( = , , ) Desde Primeros Principios” supported by the LNS - BUAP. The group at West Virginia University thanks the Pittsburgh Supercomputer Center (Bridges2) and San Diego Supercomputer Center (Expanse) through allocation DMR140031 from the Advanced Cyberinfrastructure Coordination Ecosystem: Services & Support (ACCESS) program, which is supported by National Science Foundation grants #2138259, #2138286, #2138307, #2137603, and #2138296. They also recognize the support of West Virginia Research under the call Research Challenge Grand Program 2022 and NASA EPSCoR Award 80NSSC22M0173.
References
- Jungwirth et al. [2016] T. Jungwirth, X. Marti, P. Wadley, and J. Wunderlich, Antiferromagnetic spintronics, Nat. Nanotechnol. 11, 231 (2016).
- Baltz et al. [2018] V. Baltz, A. Manchon, M. Tsoi, T. Moriyama, T. Ono, and Y. Tserkovnyak, Antiferromagnetic spintronics, Rev. Mod. Phys. 90, 015005 (2018).
- Jungwirth et al. [2018] T. Jungwirth, J. Sinova, A. Manchon, X. Marti, J. Wunderlich, and C. Felser, The multiple directions of antiferromagnetic spintronics, Nat. Phys. 14, 200 (2018).
- Němec et al. [2018] P. Němec, M. Fiebig, T. Kampfrath, and A. V. Kimel, Antiferromagnetic opto-spintronics, Nat. Phys. 14, 229 (2018).
- Liu et al. [2019] Z. Liu, Z. Feng, H. Yan, X. Wang, X. Zhou, P. Qin, H. Guo, R. Yu, and C. Jiang, Antiferromagnetic piezospintronics, Adv. Electron. Mater. 5, 1900176 (2019).
- Fukami et al. [2020] S. Fukami, V. O. Lorenz, and O. Gomonay, Antiferromagnetic spintronics, J. Appl. Phys. 128, 070401 (2020).
- Brataas et al. [2020] A. Brataas, B. van Wees, O. Klein, G. de Loubens, and M. Viret, Spin Insulatronics, Phys. Rep. 885, 1 (2020).
- Flórez-Gómez et al. [2022] L. Flórez-Gómez, W. Ibarra-Hernández, and A. C. Garcia-Castro, Lattice dynamics and spin–phonon coupling in the noncollinear antiferromagnetic antiperovskite , J. Magn. Magn. Mater. 562, 169813 (2022).
- Xiong et al. [2022] D. Xiong, Y. Jiang, K. Shi, A. Du, Y. Yao, Z. Guo, D. Zhu, K. Cao, S. Peng, W. Cai, et al., Antiferromagnetic spintronics: An overview and outlook, Fundam. Res. 2, 522 (2022).
- Han et al. [2023] J. Han, R. Cheng, L. Liu, H. Ohno, and S. Fukami, Coherent antiferromagnetic spintronics, Nat. Mater. 22, 684 (2023).
- Meer et al. [2023] H. Meer, O. Gomonay, A. Wittmann, and M. Kläui, Antiferromagnetic insulatronics: Spintronics in insulating 3d metal oxides with antiferromagnetic coupling, Appl. Phys. Lett. 122, 10.1063/5.0135079 (2023).
- Nova et al. [2017] T. F. Nova, A. Cartella, A. Cantaluppi, M. Först, D. Bossini, R. V. Mikhaylovskiy, A. V. Kimel, R. Merlin, and A. Cavalleri, An effective magnetic field from optically driven phonons, Nat. Phys. 13, 132 (2017).
- Streib et al. [2019] S. Streib, N. Vidal-Silva, K. Shen, and G. E. W. Bauer, Magnon-phonon interactions in magnetic insulators, Phys. Rev. B 99, 184442 (2019).
- Juraschek et al. [2020] D. M. Juraschek, P. Narang, and N. A. Spaldin, Phono-magnetic analogs to opto-magnetic effects, Phys. Rev. Research 2, 043035 (2020).
- Juraschek et al. [2021] D. M. Juraschek, D. S. Wang, and P. Narang, Sum-frequency excitation of coherent magnons, Phys. Rev. B 103, 094407 (2021).
- Stupakiewicz et al. [2021] A. Stupakiewicz, C. Davies, K. Szerenos, D. Afanasiev, K. Rabinovich, A. Boris, A. Caviglia, A. Kimel, and A. Kirilyuk, Ultrafast phononic switching of magnetization, Nat. Phys. 17, 489 (2021).
- Afanasiev et al. [2021] D. Afanasiev, J. Hortensius, B. Ivanov, A. Sasani, E. Bousquet, Y. Blanter, R. Mikhaylovskiy, A. Kimel, and A. Caviglia, Ultrafast control of magnetic interactions via light-driven phonons, Nat. Mater. 20, 607 (2021).
- Disa et al. [2021] A. S. Disa, T. F. Nova, and A. Cavalleri, Engineering crystal structures with light, Nat. Phys. 17, 1087 (2021).
- Ueda et al. [2023] H. Ueda, R. Mankowsky, E. Paris, M. Sander, Y. Deng, B. Liu, L. Leroy, A. Nag, E. Skoropata, C. Wang, V. Ukleev, G. S. Perren, J. Dössegger, S. Gurung, C. Svetina, E. Abreu, M. Savoini, T. Kimura, L. Patthey, E. Razzoli, H. T. Lemke, S. L. Johnson, and U. Staub, Non-equilibrium dynamics of spin-lattice coupling, Nat. Commun. 14, 7778 (2023).
- Davies et al. [2024] C. Davies, F. G. N. Fennema, A. Tsukamoto, I. Razdolski, A. V. Kimel, and A. Kirilyuk, Phononic switching of magnetization by the ultrafast Barnett effect, Nature 628, 540 (2024).
- Basini et al. [2024] M. Basini, M. Pancaldi, B. Wehinger, M. Udina, V. Unikandanunni, T. Tadano, M. C. Hoffmann, A. V. Balatsky, and S. Bonetti, Terahertz electric-field-driven dynamical multiferroicity in , Nature 628, 534 (2024).
- Gu et al. [2022] M. Gu, Y. H. Bai, G. P. Zhang, and T. F. George, Spin–phonon dispersion in magnetic materials, J. Phys. Condens. Matter 34, 375802 (2022).
- Guo et al. [2023] Y. Guo, H. Liu, O. Janson, I. C. Fulga, J. van den Brink, and J. I. Facio, Spin-split collinear antiferromagnets: a large-scale ab-initio study, Mater. Today Phys. 32, 100991 (2023).
- Wu et al. [2016] S. M. Wu, W. Zhang, A. KC, P. Borisov, J. E. Pearson, J. S. Jiang, D. Lederman, A. Hoffmann, and A. Bhattacharya, Antiferromagnetic spin seebeck effect, Phys. Rev. Lett. 116, 097204 (2016).
- Li et al. [2019] J. Li, Z. Shi, V. H. Ortiz, M. Aldosary, C. Chen, V. Aji, P. Wei, and J. Shi, Spin Seebeck Effect from Antiferromagnetic Magnons and Critical Spin Fluctuations in Epitaxial films, Phys. Rev. Lett. 122, 217204 (2019).
- Vaidya et al. [2020] P. Vaidya, S. A. Morley, J. van Tol, Y. Liu, R. Cheng, A. Brataas, D. Lederman, and E. Del Barco, Subterahertz spin pumping from an insulating antiferromagnet, Science 368, 160 (2020).
- Lockwood and Cottam [1988] D. J. Lockwood and M. G. Cottam, The spin-phonon interaction in and studied by Raman spectroscopy, J. Appl. Phys. 64, 5876 (1988).
- Schleck et al. [2010] R. Schleck, Y. Nahas, R. P. S. M. Lobo, J. Varignon, M. B. Lepetit, C. S. Nelson, and R. L. Moreira, Elastic and magnetic effects on the infrared phonon spectra of , Phys. Rev. B 82, 054412 (2010).
- Seehra and Helmick [1984] M. S. Seehra and R. E. Helmick, Anomalous changes in the dielectric constants of near its Néel temperature, J. Appl. Phys. 55, 2330 (1984).
- Seehra et al. [1986] M. S. Seehra, R. E. Helmick, and G. Srinivasan, Effect of temperature and antiferromagnetic ordering on the dielectric constants of and , J. Phys. C: Solid State Phys. 19, 1627 (1986).
- Moriya et al. [1956] T. Moriya, K. Motizuki, J. Kanamori, and T. Nagamiya, On the Magnetic Anisotropy of and , J. Phys. Soc. Jpn. 11, 211 (1956).
- Corrêa and Výborný [2018] C. A. Corrêa and K. Výborný, Electronic structure and magnetic anisotropies of antiferromagnetic transition-metal difluorides, Phys. Rev. B 97, 235111 (2018).
- Jauch et al. [2004] W. Jauch, M. Reehuis, and A. J. Schultz, -ray and neutron diffraction studies of : magnetostriction, electron density and magnetic moments, Acta Cryst. A60, 51 (2004).
- Chatterji et al. [2010] T. Chatterji, B. Ouladdiaf, and T. C. Hansen, The magnetoelastic effect in investigated by means of neutron powder diffraction, J. Phys. Condens. Matter 22, 096001 (2010).
- Borovik-Romanov [1960] A. Borovik-Romanov, Piezomagnetism in the antiferromagnetic fluorides of cobalt and manganese, Sov. Phys. JETP 11, 786 (1960).
- Moriya [1959] T. Moriya, Piezomagnetism in , J. Phys. Chem. Solids 11, 73 (1959).
- Phillips et al. [1967] T. G. Phillips, R. L. Townsend, and R. L. White, Piezomagnetism of and - from electron-paramagnetic-resonance pressure experiments, Phys. Rev. Lett. 18, 646 (1967).
- Disa et al. [2020] A. S. Disa, M. Fechner, T. F. Nova, B. Liu, M. Först, D. Prabhakaran, P. G. Radaelli, and A. Cavalleri, Polarizing an antiferromagnet by optical engineering of the crystal field, Nat. Phys. (2020).
- Formisano et al. [2022a] F. Formisano, R. M. Dubrovin, R. V. Pisarev, A. M. Kalashnikova, and A. V. Kimel, Laser-induced THz magnetism of antiferromagnetic , J. Phys. Condens. Matter 34, 225801 (2022a).
- Formisano et al. [2022b] F. Formisano, R. M. Dubrovin, R. V. Pisarev, A. K. Zvezdin, A. M. Kalashnikova, and A. V. Kimel, Laser-induced THz piezomagnetism and lattice dynamics of antiferromagnets and , Ann. Phys. , 169041 (2022b).
- Mashkovich et al. [2021] E. A. Mashkovich, K. A. Grishunin, R. M. Dubrovin, A. K. Zvezdin, R. V. Pisarev, and A. V. Kimel, Terahertz light-driven coupling of antiferromagnetic spins to lattice, Science 374, 1608 (2021).
- Metzger et al. [2023] T. W. Metzger, K. A. Grishunin, C. Reinhoffer, R. M. Dubrovin, A. Arshad, I. Ilyakov, T. V. de Oliveira, A. Ponomaryov, J.-C. Deinert, S. Kovalev, R. V. Pisarev, M. I. Katsnelson, B. A. Ivanov, P. H. van Loosdrecht, A. V. Kimel, and E. A. Mashkovich, Impulsive fermi magnon-phonon resonance in antiferromagnetic , arXiv preprint arXiv:2308.01052 10.48550/arXiv.2308.01052 (2023).
- Ozhogin [1964] V. Ozhogin, The antiferromagnets , , and in strong fields, Soviet Physics JETP-USSR 18, 1156 (1964).
- Ozhogin [1968] V. I. Ozhogin, On the Behavior of in a High Magnetic Field Normal to the Axis, J. Appl. Phys. 39, 1029 (1968).
- Gufan et al. [1974] Y. M. Gufan, K. Kocharyan, A. Prokhorov, and E. Rudashevskii, Dependence of the resonant frequencies of antiferromagnets on the magnetic field, and antiferromagnetic resonance in , JETP 66, 1155 (1974).
- Kharchenko et al. [1982] N. F. Kharchenko, V. V. Eremenko, and L. Belyi, Magnetooptical investigation of the noncollinear state induced in antiferromagnetic cobalt fluoride by a longitudinal magnetic field, Sov. Phys. JETP 55, 490 (1982).
- Gurtovoi et al. [1982] K. G. Gurtovoi, A. S. Lagutin, and V. I. Ozhogin, Noncollinear magnetic phases in a strongly anisotropic antiferromagnet with large dzyaloshinskii interaction, Sov. Phys. JETP 26, 1122 (1982).
- Macfarlane [1970] R. M. Macfarlane, Raman Light Scattering from Excitons and Magnons in Cobalt Fluoride, Phys. Rev. Lett. 25, 1454 (1970).
- Ishikawa and Moriya [1971] A. Ishikawa and T. Moriya, Magnons, Excitons and Light Scattering in Antiferromagnetic , J. Phys. Soc. Jpn. 30, 117 (1971).
- Meloche et al. [2014] E. Meloche, M. G. Cottam, and D. J. Lockwood, One-magnon and exciton inelastic light scattering in the antiferromagnet , Low Temp. Phys. 40, 134 (2014).
- Cipriani et al. [1971] J. Cipriani, S. Racine, and R. Dupeyrat, Raman scattering by two-magnon excitations in , Phys. Lett. A 34, 187 (1971).
- Natoli and Ranninger [1973] C. R. Natoli and J. Ranninger, Two-magnon neutron scattering in , J. Phys. C: Solid State Phys. 6, 370 (1973).
- Meloche et al. [2007] E. Meloche, M. G. Cottam, and D. J. Lockwood, Two-magnon inelastic light scattering in the antiferromagnets and : Experiment and theory, Phys. Rev. B 76, 104406 (2007).
- Cowley et al. [1973] R. Cowley, W. Buyers, P. Martel, and R. Stevenson, Magnetic excitations and magnetic critical scattering in cobalt fluoride, J. Phys. C: Solid State Phys. 6, 2997 (1973).
- Macfarlane and Ushioda [1970] R. M. Macfarlane and S. Ushioda, Light scattering from phonons in , Solid State Commun. 8, 1081 (1970).
- Barker Jr and Ditzenberger [1965] A. S. Barker Jr and J. A. Ditzenberger, Infrared lattice vibrations in , Solid State Commun. 3, 131 (1965).
- Balkanski et al. [1966] M. Balkanski, P. Moch, and G. Parisot, Infrared lattice-vibration spectra in , , and , J. Chem. Phys. 44, 940 (1966).
- Häussler [1981] K. M. Häussler, Infrared spectra of magnetic excitations in , Phys. Status Solidi B 105, K81 (1981).
- Stout and Reed [1954] J. W. Stout and S. A. Reed, The crystal structure of , , , and , J. Am. Chem. Soc. 76, 5279 (1954).
- Costa et al. [1993] M. M. R. Costa, J. A. Paixao, M. J. M. De Almeida, and L. C. R. Andrade, Charge densities of two rutile structures: and , Acta Cryst. B49, 591 (1993).
- Thomson et al. [2014] R. I. Thomson, T. Chatterji, and M. A. Carpenter, : a model system for magnetoelastic coupling and elastic softening mechanisms associated with paramagnetic antiferromagnetic phase transitions, J. Phys. Condens. Matter 26, 146001 (2014).
- Stout and Matarrese [1953] J. W. Stout and L. M. Matarrese, Magnetic Anisotropy of the Iron-Group Fluorides, Rev. Mod. Phys. 25, 338 (1953).
- Erickson [1953] R. A. Erickson, Neutron Diffraction Studies of Antiferromagnetism in Manganous Fluoride and Some Isomorphous Compounds, Phys. Rev. 90, 779 (1953).
- Strempfer et al. [2004] J. Strempfer, U. Rütt, S. P. Bayrakci, T. Brückel, and W. Jauch, Magnetic properties of transition metal fluorides ( = , , , ) via high-energy photon diffraction, Phys. Rev. B 69, 014417 (2004).
- Eremenko et al. [1982] V. V. Eremenko, V. M. Naumenko, S. V. Petrov, and V. V. Pishko, Rearrangement of the spectrum of magnetic excitations of antiferromagnetic with low-concentration impurity, JETP 55, 481 (1982).
- Hohenberg and Kohn [1964] P. Hohenberg and W. Kohn, Inhomogeneous Electron Gas, Phys. Rev. 136, B864 (1964).
- Kohn and Sham [1965] W. Kohn and L. J. Sham, Self-Consistent Equations Including Exchange and Correlation Effects, Phys. Rev. 140, A1133 (1965).
- Blöchl [1994] P. E. Blöchl, Projector augmented-wave method, Phys. Rev. B 50, 17953 (1994).
- Kresse and Furthmüller [1996] G. Kresse and J. Furthmüller, Efficient iterative schemes for ab initio total-energy calculations using a plane-wave basis set, Phys. Rev. B 54, 11169 (1996).
- Kresse and Joubert [1999] G. Kresse and D. Joubert, From ultrasoft pseudopotentials to the projector augmented-wave method, Phys. Rev. B 59, 1758 (1999).
- Monkhorst and Pack [1976] H. J. Monkhorst and J. D. Pack, Special points for Brillouin-zone integrations, Phys. Rev. B 13, 5188 (1976).
- Perdew et al. [2008] J. P. Perdew, A. Ruzsinszky, G. I. Csonka, O. A. Vydrov, G. E. Scuseria, L. A. Constantin, X. Zhou, and K. Burke, Restoring the Density-Gradient Expansion for Exchange in Solids and Surfaces, Phys. Rev. Lett. 100, 136406 (2008).
- Dudarev et al. [1998] S. L. Dudarev, G. A. Botton, S. Y. Savrasov, C. J. Humphreys, and A. P. Sutton, Electron-energy-loss spectra and the structural stability of nickel oxide: An LSDA+U study, Phys. Rev. B 57, 1505 (1998).
- Bousquet and Spaldin [2010] E. Bousquet and N. Spaldin, dependence in the treatment of noncollinear magnets, Phys. Rev. B 82, 220402 (2010).
- Gonze and Lee [1997] X. Gonze and C. Lee, Dynamical matrices, Born effective charges, dielectric permittivity tensors, and interatomic force constants from density-functional perturbation theory, Phys. Rev. B 55, 10355 (1997).
- Togo and Tanaka [2015] A. Togo and I. Tanaka, First principles phonon calculations in materials science, Scr. Mater. 108, 1 (2015).
- Wang et al. [2010] Y. Wang, J. J. Wang, W. Y. Wang, Z. G. Mei, S. L. Shang, L. Q. Chen, and Z. K. Liu, A mixed-space approach to first-principles calculations of phonon frequencies for polar materials, J. Phys. Condens. Matter 22, 202201 (2010).
- [78] ladyteam, LAttice DYnamic tools.
- Liechtenstein et al. [1987] A. I. Liechtenstein, M. I. Katsnelson, V. P. Antropov, and V. A. Gubanov, Local spin density functional approach to the theory of exchange interactions in ferromagnetic metals and alloys, J. Magn. Magn. Mater. 67, 65 (1987).
- He et al. [2021] X. He, N. Helbig, M. J. Verstraete, and E. Bousquet, TB2J: A python package for computing magnetic interaction parameters, Comput. Phys. Commun. 264, 107938 (2021).
- Tellez-Mora et al. [2024] A. Tellez-Mora, X. He, E. Bousquet, L. Wirtz, and A. H. Romero, Systematic determination of a material’s magnetic ground state from first principles, npj Comput. Mater. 10, 20 (2024).
- Soler et al. [2002] J. M. Soler, E. Artacho, J. D. Gale, A. García, J. Junquera, P. Ordejón, and D. Sánchez-Portal, The SIESTA method for ab initio order-N materials simulation, J. Phys. Condens. Matter 14, 2745 (2002).
- Toth and Lake [2015] S. Toth and B. Lake, Linear spin wave theory for single-q incommensurate magnetic structures, J. Phys.: Condens. Matter 27, 166002 (2015).
- Kroumova et al. [2003] E. Kroumova, M. I. Aroyo, J. M. Perez-Mato, A. Kirov, C. Capillas, S. Ivantchev, and H. Wondratschek, Bilbao Crystallographic Server: Useful Databases and Tools for Phase-Transition Studies, Phase Transit. 76, 155 (2003).
- Born and Wolf [2013] M. Born and E. Wolf, Principles of Optics: Electromagnetic Theory of Propagation, Interference and Diffraction of Light (Elsevier, 2013).
- Gervais and Piriou [1974] F. Gervais and B. Piriou, Anharmonicity in several-polar-mode crystals: adjusting phonon self-energy of LO and TO modes in and to fit infrared reflectivity, J. Phys. C: Solid State Phys. 7, 2374 (1974).
- Benoit and Giordano [1988] C. Benoit and J. Giordano, Dynamical properties of crystals of , and . II. Lattice dynamics and infrared spectra, Journal of Physics C: Solid State Physics 21, 5209 (1988).
- Barker [1964] A. S. Barker, Transverse and Longitudinal Optic Mode Study in and , Phys. Rev. 136, A1290 (1964).
- Hemberger et al. [2006] J. Hemberger, T. Rudolf, H.-A. Krug von Nidda, F. Mayr, A. Pimenov, V. Tsurkan, and A. Loidl, Spin-Driven Phonon Splitting in Bond-Frustrated , Phys. Rev. Lett. 97, 087204 (2006).
- Rudolf et al. [2008] T. Rudolf, C. Kant, F. Mayr, and A. Loidl, Magnetic-order induced phonon splitting in from far-infrared spectroscopy, Phys. Rev. B 77, 024421 (2008).
- Kant et al. [2009] C. Kant, J. Deisenhofer, T. Rudolf, F. Mayr, F. Schrettle, A. Loidl, V. Gnezdilov, D. Wulferding, P. Lemmens, and V. Tsurkan, Optical phonons, spin correlations, and spin-phonon coupling in the frustrated pyrochlore magnets and , Phys. Rev. B 80, 214417 (2009).
- Kant et al. [2012] C. Kant, M. Schmidt, Z. Wang, F. Mayr, V. Tsurkan, J. Deisenhofer, and A. Loidl, Universal Exchange-Driven Phonon Splitting in Antiferromagnets, Phys. Rev. Lett. 108, 177203 (2012).
- Wei et al. [2021] B. Wei, Q. Sun, C. Li, and J. Hong, Phonon anharmonicity: a pertinent review of recent progress and perspective, Sci. China Phys. Mech. Astron. 64, 117001 (2021).
- Born and Huang [1954] M. Born and K. Huang, Dynamical Theory of Crystal Lattices (Clarendon press, Oxford, 1954).
- Balkanski et al. [1983] M. Balkanski, R. F. Wallis, and E. Haro, Anharmonic effects in light scattering due to optical phonons in silicon, Phys. Rev. B 28, 1928 (1983).
- Lan et al. [2012] T. Lan, X. Tang, and B. Fultz, Phonon anharmonicity of rutile studied by Raman spectrometry and molecular dynamics simulations, Phys. Rev. B 85, 094305 (2012).
- Cottam and Lockwood [2019] M. G. Cottam and D. J. Lockwood, Spin-phonon interaction in transition-metal difluoride antiferromagnets: Theory and experiment, Low Temp. Phys. 45, 78 (2019).
- Darby [1967] M. I. Darby, Tables of the Brillouin function and of the related function for the spontaneous magnetization, Br. J. Appl. Phys. 18, 1415 (1967).
- Moriya [1966] T. Moriya, Far Infrared Absorption by Two Magnon Excitations in Aniferromagnets, J. Phys. Soc. Jpn. 21, 926 (1966).
- Martel et al. [1968] P. Martel, R. A. Cowley, and R. W. H. Stevenson, Experimental studies of the magnetic and phonon excitations in cobalt fluoride, Can. J. Phys. 46, 1355 (1968).
- Allen and Guggenheim [1971a] S. J. Allen and H. J. Guggenheim, Magnetic Excitations in Antiferromagnetic . I. Spin-Optical-Phonon Interaction, Phys. Rev. B 4, 937 (1971a).
- Allen and Guggenheim [1971b] S. J. Allen and H. J. Guggenheim, Magnetic Excitations in Antiferromagnetic . II. Uniform Magnetic Excitations near k, Phys. Rev. B 4, 950 (1971b).
- Newman and Chrenko [1959] R. Newman and R. M. Chrenko, Infrared Absorption from Splittings in Salts, Phys. Rev. 115, 1147 (1959).
- Lines [1965] M. E. Lines, Magnetic properties of , Phys. Rev. 137, A982 (1965).
- Häussler et al. [1982] K. Häussler, A. Lehmeyer, and L. Merten, Far-Infrared Reflectivity of Optical Magnons in and , Phys. Status Solidi B 111, 513 (1982).
- Johnson and Nethercot [1959] F. M. Johnson and A. H. Nethercot, Antiferromagnetic Resonance in , Phys. Rev. 114, 705 (1959).
- Duarte et al. [1987] J. L. Duarte, J. A. Sanjurjo, and R. S. Katiyar, Off-normal infrared reflectivity in uniaxial crystals: - and -quartz, Phys. Rev. B 36, 3368 (1987).
- Allen and Guggenheim [1968] S. J. Allen and H. J. Guggenheim, Spin-Optical-Phonon Interaction in Antiferromagnetic , Phys. Rev. Lett. 21, 1807 (1968).
- Allen and Guggenheim [1969] S. J. Allen and H. J. Guggenheim, Magnon-Optic Phonon Interaction in Antiferromagnetic , J. Appl. Phys. 40, 999 (1969).
- Mills and Ushioda [1970] D. L. Mills and S. Ushioda, Exciton—Optical-Phonon Coupling in , Phys. Rev. B 2, 3805 (1970).
- Allen Jr and Guggenheim [1971] S. J. Allen Jr and H. J. Guggenheim, Spin waves and excitons in antiferromagnetic , J. Appl. Phys. 42, 1657 (1971).
- Gervais and Arend [1983] F. Gervais and H. Arend, Long-wavelength phonons in the four phases of and effective charges, Z. Physik B - Condensed Matter 50, 17 (1983).
- Vassiliou [1986] J. K. Vassiliou, Pressure and temperature dependence of the static dielectric constants and elastic anomalies of , J. Appl. Phys. 59, 1125 (1986).
- Lowndes and Martin [1970] R. Lowndes and D. Martin, Dielectric constants of ionic crystals and their variations with temperature and pressure, Proceedings of the Royal Society of London. A. Mathematical and Physical Sciences 316, 351 (1970).
- Bartels and Smith [1973] R. A. Bartels and P. A. Smith, Pressure and Temperature Dependence of the Static Dielectric Constants of , , , and , Phys. Rev. B 7, 3885 (1973).
- Wintersgill et al. [1979] M. Wintersgill, J. Fontanella, C. Andeen, and D. Schuele, The temperature variation of the dielectric constant of ”pure” , , , and , J. Appl. Phys. 50, 8259 (1979).
- Fox et al. [1980] D. L. Fox, D. R. Tilley, J. F. Scott, and H. J. Guggenheim, Magnetoelectric phenomena in and , Phys. Rev. B 21, 2926 (1980).
- Seehra and Helmick [1981] M. S. Seehra and R. E. Helmick, Dielectric anomaly in near the magnetic phase transition, Phys. Rev. B 24, 5098 (1981).
- Jahn [1973] I. R. Jahn, Linear Magnetic Birefringence in the Antiferromagnetic Iron Group Difluorides, Phys. Status Solidi B 57, 681 (1973).
- Markovin and Pisarev [1979] P. A. Markovin and R. V. Pisarev, Magnetic, thermal, and elastic refraction of light in the antiferromagnet , JETP 50, 1190 (1979).
- Dubrovin et al. [2021] R. M. Dubrovin, A. C. Garcia-Castro, N. V. Siverin, N. N. Novikova, K. N. Boldyrev, A. H. Romero, and R. V. Pisarev, Incipient geometric lattice instability of cubic fluoroperovskites, Phys. Rev. B 104, 144304 (2021).
- Kumar et al. [2012] A. Kumar, C. J. Fennie, and K. M. Rabe, Spin-lattice coupling and phonon dispersion of from first principles, Phys. Rev. B 86, 184429 (2012).
- Momma and Izumi [2011] K. Momma and F. Izumi, VESTA 3 for three-dimensional visualization of crystal, volumetric and morphology data, J. Appl. Crystallogr. 44, 1272 (2011).
- Barreda-Argüeso et al. [2013] J. A. Barreda-Argüeso, S. López-Moreno, M. N. Sanz-Ortiz, F. Aguado, R. Valiente, J. González, F. Rodríguez, A. H. Romero, A. Muñoz, L. Nataf, and F. Baudelet, Pressure-induced phase-transition sequence in : An experimental and first-principles study on the crystal, vibrational, and electronic properties, Phys. Rev. B 88, 214108 (2013).
- Lee et al. [1994] C. Lee, P. Ghosez, and X. Gonze, Lattice dynamics and dielectric properties of incipient ferroelectric rutile, Phys. Rev. B 50, 13379 (1994).
- Raeliarijaona and Fu [2015] A. Raeliarijaona and H. Fu, Mode sequence, frequency change of nonsoft phonons, and LO-TO splitting in strained tetragonal , Phys. Rev. B 92, 094303 (2015).
- Fredrickson et al. [2016] K. D. Fredrickson, C. Lin, S. Zollner, and A. A. Demkov, Theoretical study of negative optical mode splitting in , Phys. Rev. B 93, 134301 (2016).
- Schubert et al. [2019] M. Schubert, A. Mock, R. Korlacki, and V. Darakchieva, Phonon order and reststrahlen bands of polar vibrations in crystals with monoclinic symmetry, Phys. Rev. B 99, 041201 (2019).
- Granado et al. [1999] E. Granado, A. García, J. A. Sanjurjo, C. Rettori, I. Torriani, F. Prado, R. D. Sánchez, A. Caneiro, and S. B. Oseroff, Magnetic ordering effects in the raman spectra of , Phys. Rev. B 60, 11879 (1999).
- Zhong et al. [1994] W. Zhong, R. D. King-Smith, and D. Vanderbilt, Giant LO-TO Splittings in Perovskite Ferroelectrics, Phys. Rev. Lett. 72, 3618 (1994).
- Khedidji et al. [2021] M. Khedidji, D. Amoroso, and H. Djani, Microscopic mechanisms behind hyperferroelectricity, Phys. Rev. B 103, 014116 (2021).
- Cowley et al. [1975] R. A. Cowley, O. W. Dietrich, and D. A. Jones, Magnetic excitations of mixed / crystals, J. Phys. C: Solid State Phys. 8, 3023 (1975).
- López-Moreno et al. [2016] S. López-Moreno, A. Romero, J. Mejía-López, and A. Muñoz, First-principles study of pressure-induced structural phase transitions in , Phys. Chem. Chem. Phys. 18, 33250 (2016).
- Fechner and Spaldin [2016] M. Fechner and N. A. Spaldin, Effects of intense optical phonon pumping on the structure and electronic properties of yttrium barium copper oxide, Phys. Rev. B 94, 134307 (2016).
- Fechner et al. [2018] M. Fechner, A. Sukhov, L. Chotorlishvili, C. Kenel, J. Berakdar, and N. A. Spaldin, Magnetophononics: Ultrafast spin control through the lattice, Phys. Rev. Mater. 2, 064401 (2018).
- Disa et al. [2023] A. S. Disa, J. Curtis, M. Fechner, A. Liu, A. von Hoegen, M. Först, T. F. Nova, P. Narang, A. Maljuk, A. V. Boris, B. Keimer, and A. Cavalleri, Photo-induced high-temperature ferromagnetism in , Nature 617, 73 (2023).
- Gurevich and Melkov [1996] A. G. Gurevich and G. A. Melkov, Magnetization oscillations and waves (CRC, 1996).
- Chen and Wang [2021] X.-Y. Chen and Y.-P. Wang, One-dimensional model for coupling between magnon and optical phonon, Phys. Rev. B 104, 155132 (2021).
- Wang et al. [2020] L.-W. Wang, L.-S. Xie, P.-X. Xu, and K. Xia, First-principles study of magnon-phonon interactions in gadolinium iron garnet, Phys. Rev. B 101, 165137 (2020).
- Wang et al. [2023] K. Wang, K. Ren, Y. Hou, Y. Cheng, and G. Zhang, Magnon–phonon coupling: from fundamental physics to applications, Phys. Chem. Chem. Phys. 25, 21802 (2023).
- Liu et al. [2020] H. Liu, J. Chaloupka, and G. Khaliullin, Kitaev Spin Liquid in Transition Metal Compounds, Phys. Rev. Lett. 125, 047201 (2020).
- Hong et al. [2021] X. Hong, M. Gillig, R. Hentrich, W. Yao, V. Kocsis, A. R. Witte, T. Schreiner, D. Baumann, N. Pérez, A. U. B. Wolter, Y. Li, B. Büchner, and C. Hess, Strongly scattered phonon heat transport of the candidate Kitaev material , Phys. Rev. B 104, 144426 (2021).
- Li et al. [2022] X. Li, Y. Gu, Y. Chen, V. O. Garlea, K. Iida, K. Kamazawa, Y. Li, G. Deng, Q. Xiao, X. Zheng, Z. Ye, Y. Peng, I. A. Zaliznyak, J. M. Tranquada, and Y. Li, Giant Magnetic In-Plane Anisotropy and Competing Instabilities in , Phys. Rev. X 12, 041024 (2022).
- Feng et al. [2022] K. Feng, S. Swarup, and N. B. Perkins, Footprints of Kitaev spin liquid in the Fano lineshape of Raman-active optical phonons, Phys. Rev. B 105, L121108 (2022).
- Li et al. [2023] N. Li, R. R. Neumann, S. K. Guang, Q. Huang, J. Liu, K. Xia, X. Y. Yue, Y. Sun, Y. Y. Wang, Q. J. Li, Y. Jiang, J. Fang, Z. Jiang, X. Zhao, A. Mook, J. Henk, I. Mertig, H. D. Zhou, and X. F. Sun, Magnon-polaron driven thermal Hall effect in a Heisenberg-Kitaev antiferromagnet, Phys. Rev. B 108, L140402 (2023).
- Zhang et al. [2023] S. Zhang, S. Lee, A. J. Woods, W. K. Peria, S. M. Thomas, R. Movshovich, E. Brosha, Q. Huang, H. Zhou, V. S. Zapf, and M. Lee, Electronic and magnetic phase diagrams of the Kitaev quantum spin liquid candidate , Phys. Rev. B 108, 064421 (2023).