BOLOMETRIC INTERFEROMETRY AND SPECTRAL IMAGING: A QUBIC OVERVIEW
Abstract
The Q & U Bolometric Interferometer for Cosmology (QUBIC) is a new kind of cosmological instrument that uses interferometry to observe the sky. The unique synthesized beam of QUBIC has an important frequency dépendance that we use to increase spectral resolution and perform new component separation methods, allowing us to mitigate foreground contamination in an improved manner.
1 QUBIC Presentation
QUBIC is an experiment located in Argentina, designed to detect the B-modes of polarization in the Cosmic Microwave Background (CMB). The particularity of this instrument is to use interferometry combined with high-sensitivity bolometers to observe the sky. The core of QUBIC is the back-to-back horn array, which produces multiple beams that are optically combined by two convex mirrors to produce an interference pattern on the focal planes. This array comprises 64 horns for the Technical Demonstrator (TD) and 400 for the Full Instrument [1].
2 Spectral-Imaging
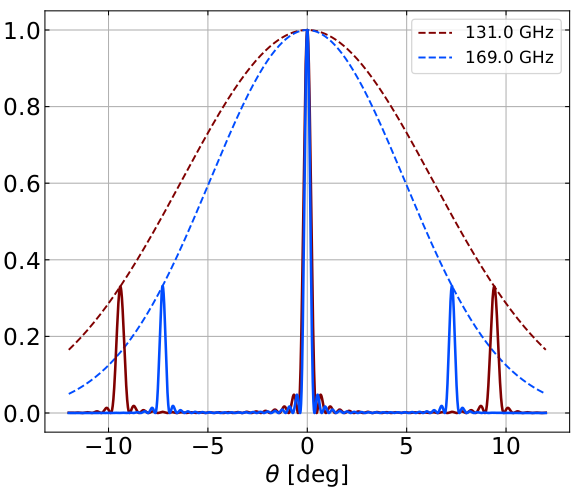
The particularity of QUBIC, the horn array used to perform interferometry, determines the shape of the QUBIC PSF, which we call the synthesized beam. It is composed of a superposition of interferometry fringe patterns (for each pair of horns); the distance between these fringes is inversely proportional to the frequency of the observed signal, exactly as in the Young experiment. The result is that the structure of the obtained beam is also frequency-dependent: the distance between the secondary and central peaks is inversely proportional to frequency. Figure 1 shows a cut through this beam to highlight this effect.
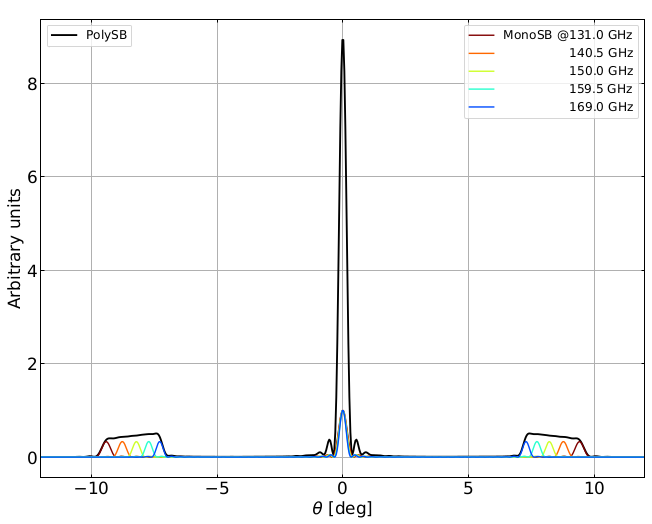
The particularity associated with this synthesized beam is the possibility to perform spectral imaging. When one observes a polychromatic source with QUBIC, one does not observe secondary peaks but ”secondary plateaux” (Figure 1). The idea of spectral imaging is to bin these plateaux in sub-areas, each being related to a sub-frequency band smaller than the instrumental one, increasing our spectral resolution. This feature is particularly useful for foreground mitigation, especially in the case of complex foregrounds such as frequency decorrelated dust [3].
An important advantage of spectral imaging is that it is achieved at the data analysis stage, after data acquisition. So, we can choose afterward how many subbands it is better to split our physical band, depending on the analysis we want to perform.
3 Results
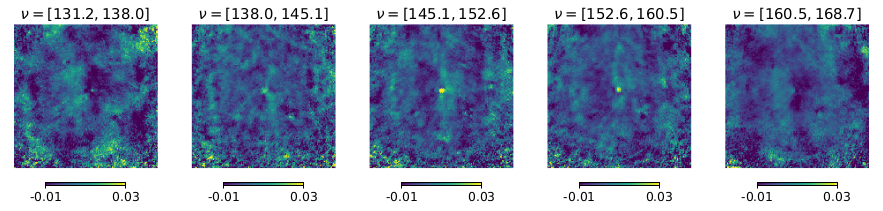
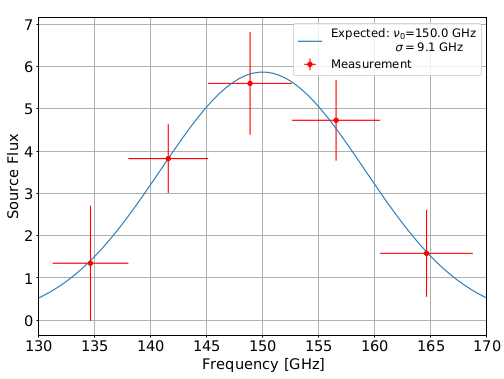
In this section, we present an example of spectral imaging performed in the laboratory. We observed with the QUBIC instrument an artificial monochromatic source, emitting at 150 GHz (with 144 Hz bandwidth) [4]. For an imager observing between 130 GHz & 170 GHz, this monochromatic source would be seen in the associated reconstructed map. With QUBIC, we can use spectral imaging, as described in the previous section, to split the frequency band ([130, 170] GHz) into smaller frequency sub-bands, five in this case (Figure 2). Thus, the monochromatic source can be observed in several frequency maps, we can then reconstruct its spectrum [5]. By doing this, we were able to measure the emission of this source, limited by the QUBIC spectral resolution (theoretical prediction overplotted in blue along with the spectrum data in red in Figure 2). We can anticipate applications beyond component separation methods: applying this method to the Carbon Monoxide line emitting at 230 GHz, inside the frequency band of most CMB experiments. By mapping separately the data associated with this precise frequency using spectral imaging, we can avoid contamination in the rest of the band, improving the characterization of the other foregrounds. A study is underway to apply spectral imaging to mitigate the contamination from the atmosphere in the TOD.
References
References
- [1] C. O’Sullivan et al., “QUBIC VIII: Optical design and performance,” Journal of Cosmology and Astroparticle Physics 04, 040 (2022)
- [2] L. Mousset et al., “QUBIC II: Spectral Imaging”, Journal of Cosmology and Astroparticle Physics 04, 035 (2022)
- [3] M. Regnier et al., ”Identifying frequency decorrelated dust residuals in B-mode maps by exploiting the spectral capability of bolometric interferometry”, Astronomy & Astrophysics, 2024
- [4] S. A. Torchinsky et al., “QUBIC III: Laboratory Characterization”, Journal of Cosmology and Astroparticle Physics 04, 036 (2022)
- [5] G. D’Alessandro et al., ”QUBIC Experiment Toward the First Light”, Journal of Low Temperature Physics 209, 839–848 (2022)