DEDALO: Device for Enhanced Dust Analyses with Light Obscuration sensors
Abstract
Instruments based on light obscuration sensors are widely used for measuring the size distribution of insoluble sub-visible particles in liquid suspensions, being fast and suitable for in situ and real-time measurements. Such instruments are typically calibrated by means of reference polystyrene spherical particles with a specific refractive index, which unavoidably leads to systematic errors when determining the size of particles of different materials. In this paper, we propose a reliable and consistent method to overcome this limitation by setting the refractive index value according to the sample, thus achieving an improved particle size distribution (PSD) measurement. An ad hoc, ready-to-use, open source code with a graphical interface able to drive an in-line instrument and obtain a real-time correction to the PSD has been developed. The method has been extensively validated with several oil emulsions characterized by different refractive index values and the results have been compared with an independent optical method. As an example of application, we have adopted this approach for the analysis of dust suspended in meltwater of an ice core from a glacier in the Aosta Valley (Italy). We believe that our approach will strongly improve the accuracy in characterizing liquid suspensions and reduce discrepancies between data obtained with different methods. The code has been made publicly available at: https://instrumentaloptics.fisica.unimi.it/dedalo/ and on the GitHub page of the corresponding author (https://github.com/LucaTeruzzi/DEDALO).
1 Introduction
Light obscuration is one of the most reliable methods for measuring the size distribution (PSD) and number concentration of sub-visible particles suspended in a liquid [1]. It is also the European Union reference for sizing, according to the ISO21501-3 standard [2]. The liquid suspension is driven through a small cell transilluminated by a laser beam. When a microparticle intercepts the beam, a photodiode detects the corresponding attenuation, thus measuring the optical extinction cross-section, . According to general light scattering laws, is mainly affected by particle size [3, 4], therefore, it is retrieved with relative ease if the refractive index is established first. Instruments based on this working principle are often called Light Obscuration (LO) sensors. They are able to characterize a wide range of particles, as small as in diameter. Additionally, they are fast, easy to use, and can be used in situ or with minimal sample preparation. Therefore, they are suitable for real-time monitoring and process control applications [5, 6]. They provide results within seconds, which is crucial for industrial use, including pharmaceuticals and electronics applications.
The main drawback of instruments providing such mono-parametric measurements is that the refractive index cannot usually be inferred from the light scattering data. In fact, it is customary to assume a one-fits-all value, , which might differ from that of the actual particles under study; no absorption is considered. The standard calibration procedure is usually based on light scattering by polystyrene spheres: it is assumed that the size of a particle is that of the polystyrene sphere that causes the measured attenuation of the laser beam. However, the refractive index of particles that populate real samples can appreciably differ from the reference value and can depend on temperature [7, 8] and pressure [9]. Generally speaking, particles with a larger refractive index extinguish more light than particles with a lower refractive index of the same size. This implies that the size of particles characterized by will be underestimated and vice versa [10]. Moreover, the larger the refractive index deviation from the calibration standard, the less accurate the PSD results are [11]. A larger difference in the refractive index from that of the surrounding medium accentuates this effect [11], some examples being air bubbles in water or oil droplets in water.
Other particle sizing techniques such as dynamic light scattering (DLS), laser diffraction, or Small Angle Light Scattering (LALS) may be used as complementary methods to provide additional information on particle size distribution [12, 13], at the cost of reducing the effectiveness in terms of data throughput. In some cases, the refractive index can be measured or inferred independently [14].
In this paper, we present a ready-to-use software to overcome the limitation of having to fix the refractive index a priori. An open-source Python-based GUI code allows the user to operate an in-line LO instrument and retrieve in real-time the correct PSDs. The algorithm operates on LO data with the refractive index as a free parameter to be set according to the sample composition. The code is named DEDALO (Device for Enhanced Dust Analyses with Light Obscuration sensors).
We validate the method with a range of laboratory-prepared oil emulsions characterized by different refractive index values, ranging from 1.46 to 1.64. Samples have then been analyzed through a Continuous Flow Analysis (CFA) system with a commercial LO device (Abakus particle counter, Klotz GmbH, Germany). An independent instrument (Single Particle Extinction and Scattering method, SPES) installed downstream the Abakus provides both the PSDs and the refractive index, which in principle is known for the samples under study [15, 16, 17]. We point out that all the tested samples are characterized by a real refractive index, thus absorption is negligible in our work.
This study builds on a collaboration between the Instrumental Optics Laboratory of the University of Milan and the EuroCold laboratory of the glaciology and palaeoclimate group at the University of Milan-Bicocca, where all these methods are adopted for characterizing micron-sized dust from ice cores. After validating our code extensively, we performed high-resolution and high throughput measurements of mineral dust in meltwater from cryosphere samples collected on an Alpine glacier currently under study by our group. Beyond the specific application discussed in this work, we believe that the applications of DEDALO could be far more general, ranging from pharmaceutics to water quality assessments and clinical assays.
2 Materials and methods
The samples are oil-in-water emulsions prepared by adding of oil with calibrated refractive index (Cargille laboratories [18]) to of MilliQ water (resistivity , total organic carbon 2 ppb), then shaking the sample. We chose oils with a refractive index ranging from 1.46 to 1.64 ( 0.002 uncertainty, standard measure at and ). Specifically, we prepared eleven samples with a refractive index of 1.46, 1.47, 1.48, 1.50, 1.51, 1.52, 1.53, 1.56, 1.58, and 1.64. The emulsions we obtained have similar PSDs with modes around , reasonably described by log-normal distributions (see below in Section 4). We also prepared two additional samples that contain two independent populations each, by mixing two different immiscible oils in pure water (refractive indices 1.50 and 1.52, 1.50 and 1.56). They have been used as a stress test for the algorithm and verify its ability to operate with mixed emulsions, where at least one of the species (actually both of them) deviates from the ideal refractive index of calibration particles. This is of particular interest in real-world situations, where the refractive index is often unknown and the sample may include a mixture of particles with different refractive indices. Table 1 summarizes the numeric particle concentrations and the corresponding mode for each laboratory-prepared sample.
| Refractive index | Sample concentration [ptc/mL] | Mode [] |
|---|---|---|
| 1.46 | 5.4105 | 1.5 |
| 1.47 | 1.2106 | 1.4 |
| 1.48 | 2.1105 | 1.4 |
| 1.50 | 1.2106 | 1.2 |
| 1.51 | 1.6106 | 1.2 |
| 1.52 | 1.6106 | 1.1 |
| 1.53 | 2.2106 | 1.0 |
| 1.56 | 1.1106 | 0.9 |
| 1.58 | 2.7106 | 0.9 |
| 1.64 | 1.1106 | 0.8 |
| 1.50 and 1.52 | 1.4106 | 1.1 |
| 1.50 and 1.56 | 1.5106 | 0.9 |
The LO instrument (sketched in Figure 1a) we employed for this study is the commercial Abakus particle counter (model LDS23/25bs; Klotz GmbH, Germany).
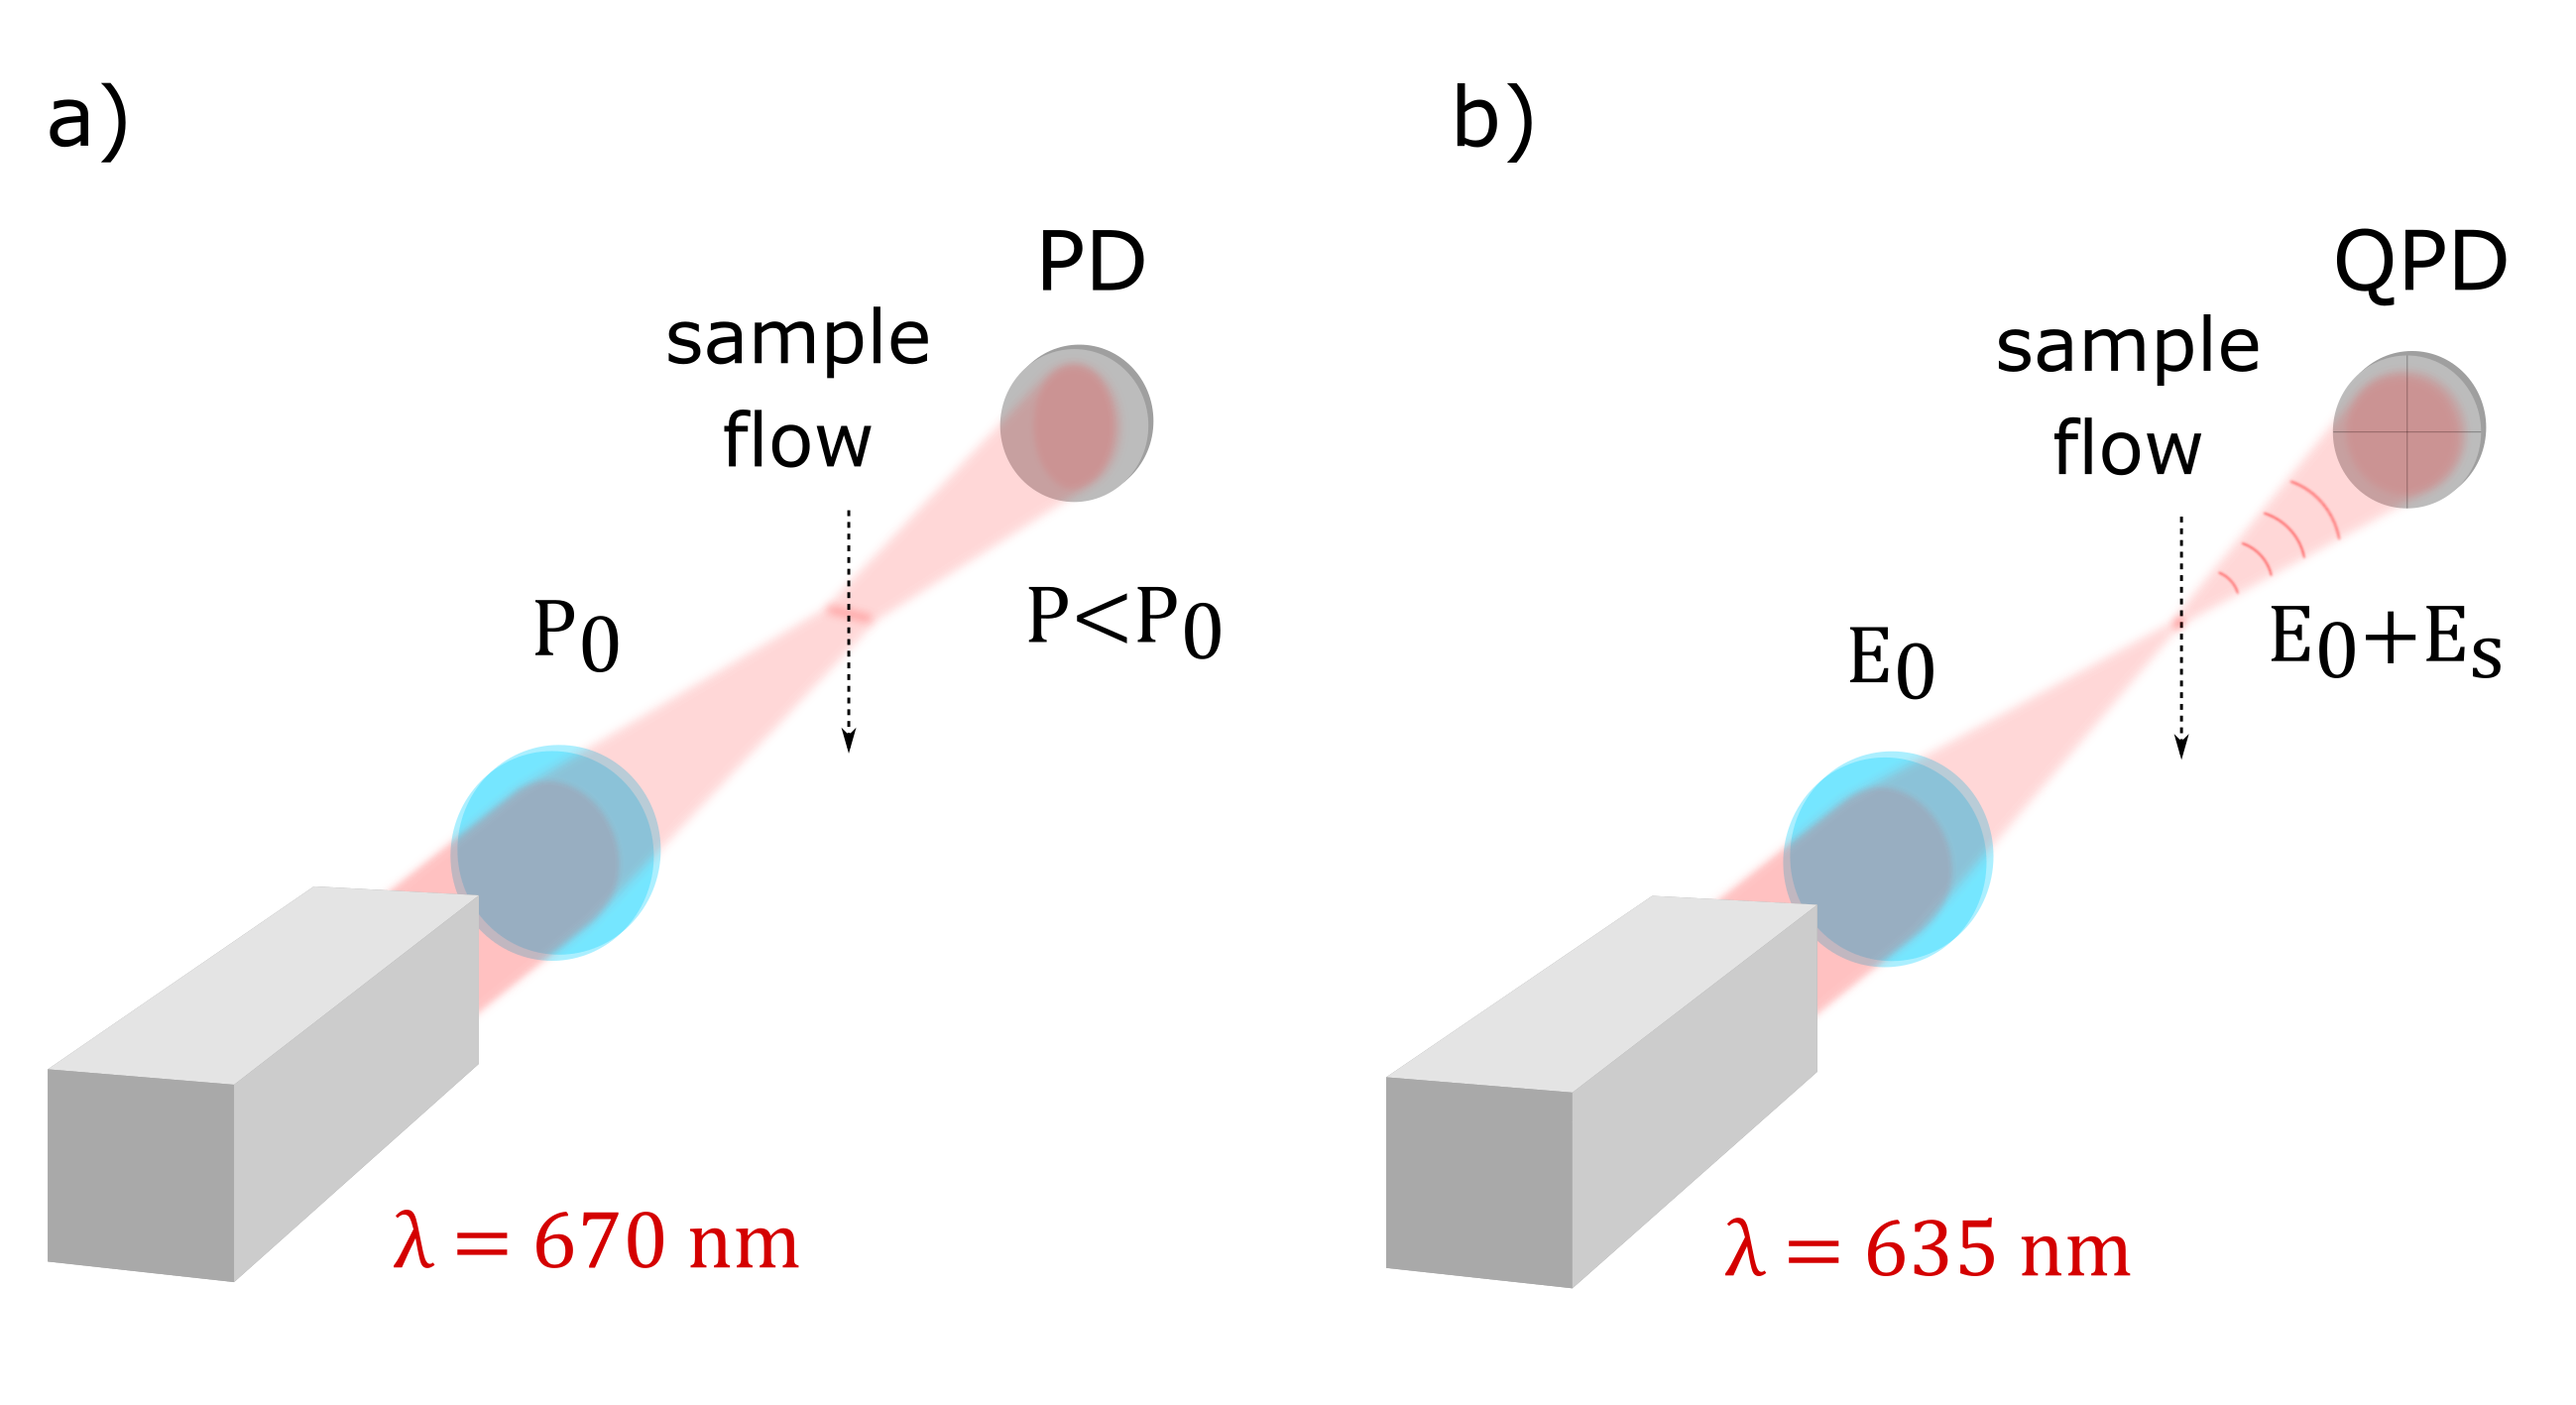
The liquid sample is pumped through a small quartz cell illuminated perpendicularly to the liquid flow direction by a laser beam () with wavelength [19]. The measuring cell has a cross-section of . When a microparticle intercepts the beam, a photodiode measures the decrease in the transmitted power (P<P0), thus . The particle size is therefore retrieved by Mie theory [3], based on reference polystyrene spherical particles with refractive index of 1.58(48) at . The instrument can measure particles in the range . The bin width has been set to for convenience, a prescription that must be taken into account when analyzing LO data. We compare our LO results with data acquired with a SPES instrument, based on a recently developed optical method [15, 16, 20]. The layout of this technique is sketched in Figure 1b. It relies on the far-field self-reference interference between the zero-angle field scattered by a particle passing through a focused laser beam ( 635 nm), ES, and the (much more intense) field transmitted through the sample, [15, 16]. Its cell has the same geometry (including the cross-section) as that of the LO, which ensures the same fluidic conditions. Low concentration in the samples guarantees the single-particle condition is met, however, internal checks are able to reject possible overlaps or spurious signals. We chose this method because the simultaneous measurement of two independent parameters related to and the polarizability of the particle, , makes it possible to obtain quantitative information about both the refractive index and the size of individual particles. The small difference in the operating wavelengths of the two instruments has been considered as regards the refractive index of the samples. The comparatively small difference in the refractive index has been found to be negligible for the correction to the size inversion and can be disregarded for our purposes (see Appendix A).
3 Structure of the code
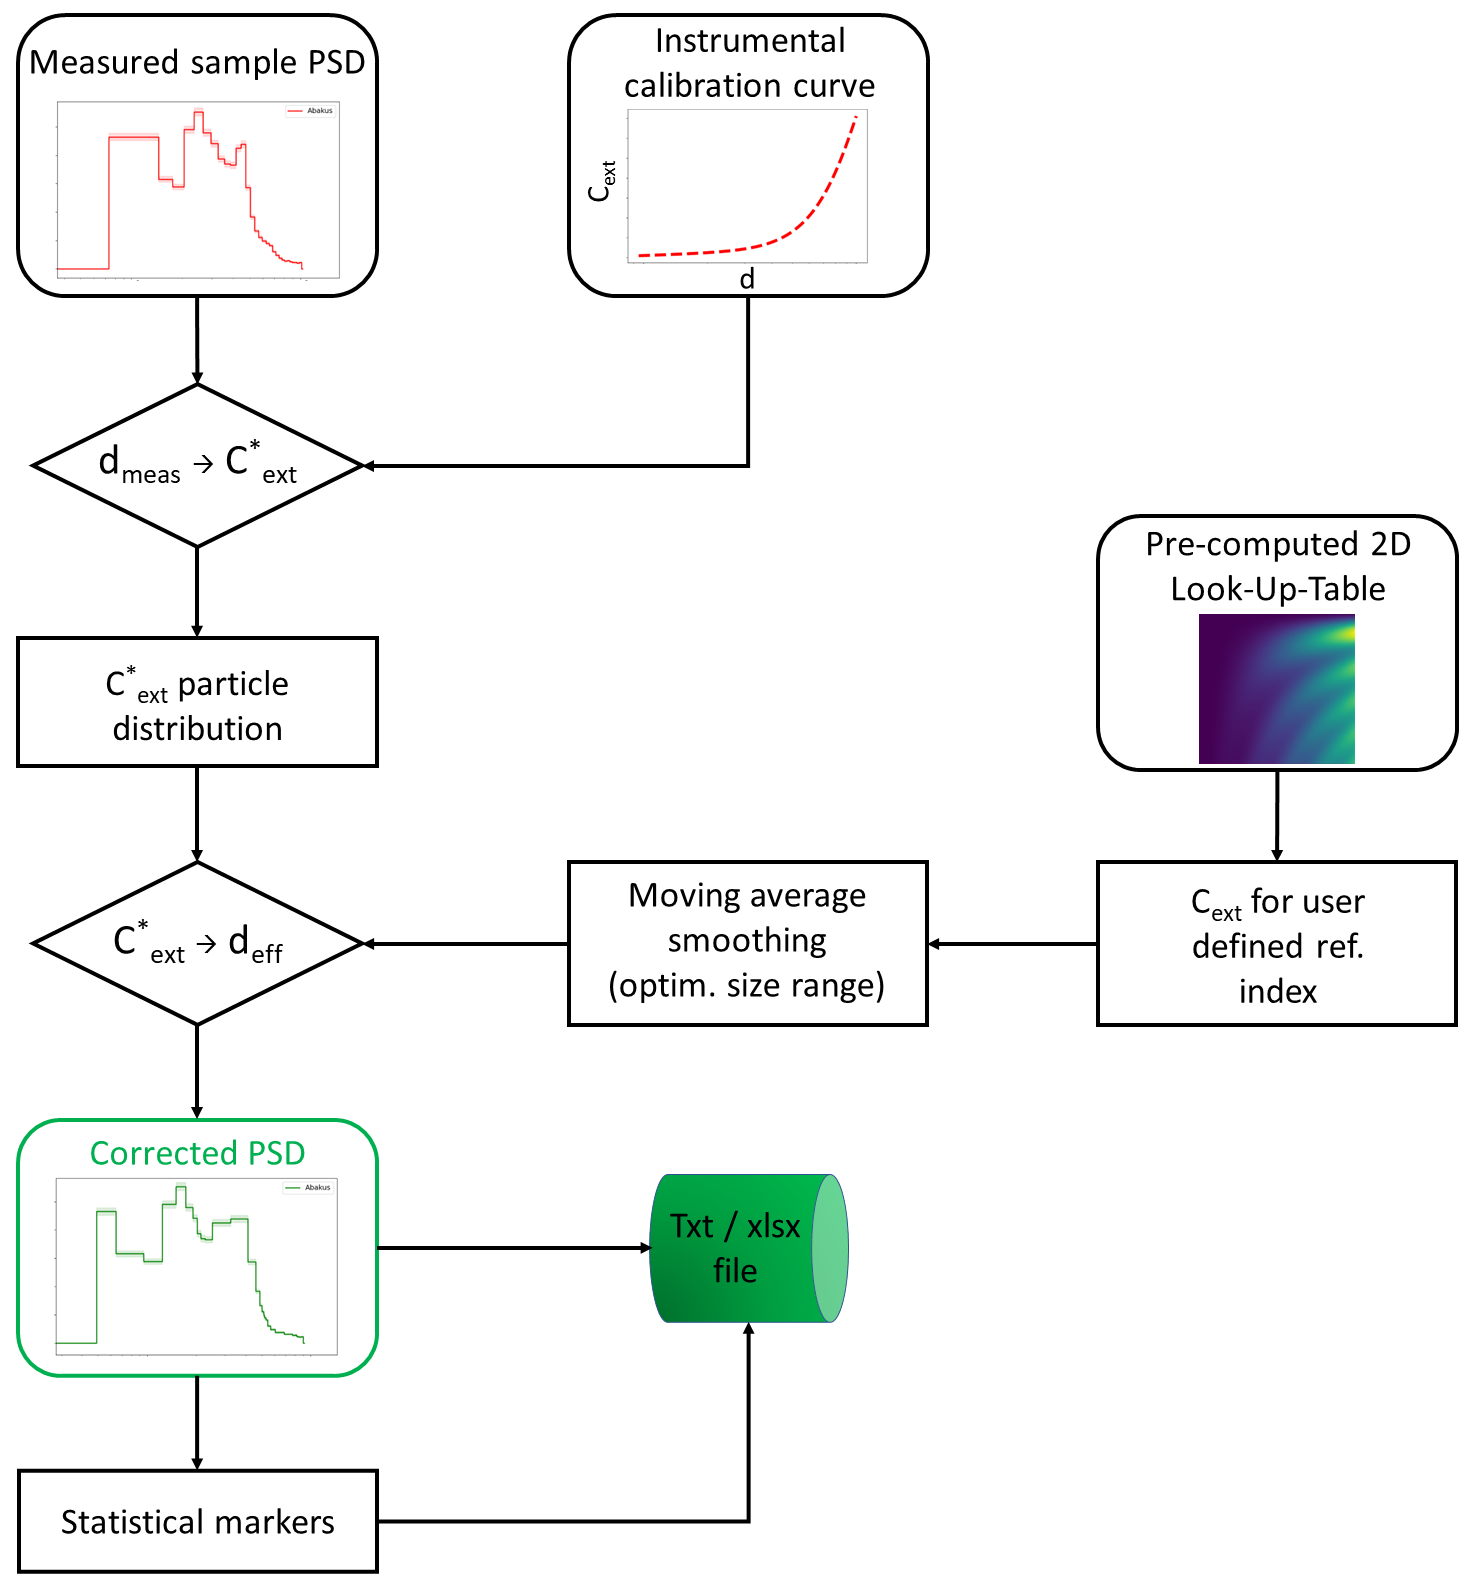
DEDALO is an open-source Python-based GUI software that allows to operate an in-line LO instrument and further analyze the data by compensating for the refractive index according to the sample composition. In addition, DEDALO recovers the numeric concentration of the sample, which is not provided by the instrument. The algorithm computes analytically with Mie scattering theory [4, 3]; smoothing functions are then used (see below) as customary in traditional instruments. The general workflow is sketched in Figure 2 and can be summarized as follows:
-
i)
the instrumental calibration curve is retrieved by measuring mono-disperse suspensions of polystyrene spheres;
-
ii)
the sample PSD is measured;
-
iii)
each bin of the measured PSD is converted into its corresponding bin by computing their limits with the calibration curve, thus obtaining a new histogram by counting the number of detected particles within each bin;
-
iv)
the lower and upper limits of the bins are converted into the corresponding diameters through Mie theory with the new refractive index; in order to save computational resources a pre-computed look-up table is used;
-
v)
the corrected PSD is written on files (both spreadsheet and text file), together with some statistical markers such as the PSD mode diameter and the distribution quantiles.
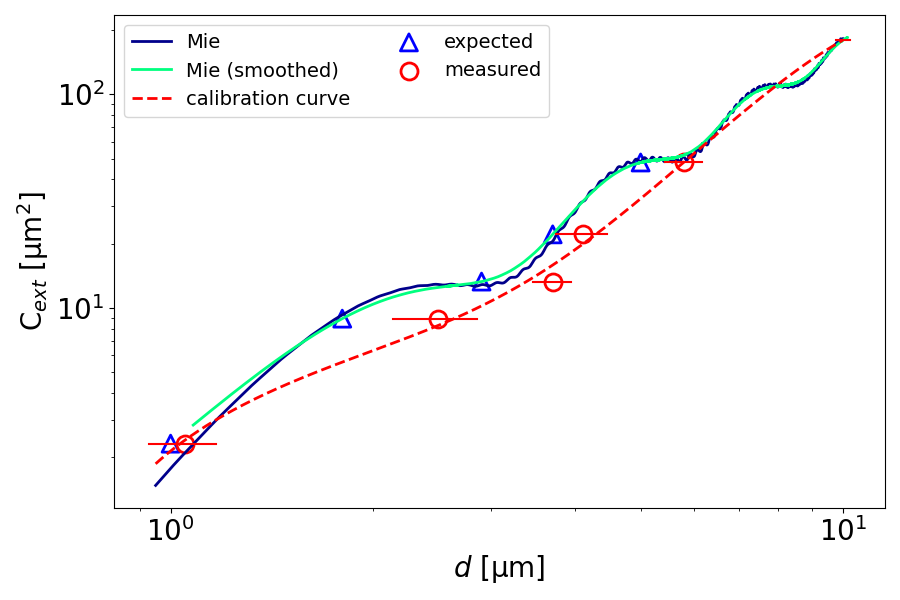
Commercial LO instruments do not typically allow the user to access raw data. A histogram of the particle counts within a given size bin is generated by inverting data for each particle through a calibration curve obtained from the Mie function vs , as discussed for example in [21]. It is convenient to set the instrument in such a way that the width of the bins is uniform throughout the size range. We set the bin width to . The calibration curve can be estimated by means of several measurements performed with mono-disperse polystyrene spheres. In Figure 3, we report on the plane the experimental results of LO measurements (red circles) for , , , and calibrated polystyrene spheres and the corresponding expected positions (blue triangles). For each nominal diameter, was computed through Mie theory and compared to the particle size reported by the LO instrument. The Mie curve is also reported with a blue solid line, while the green one represents a smoothed Mie curve. The LO calibration curve (red dashed line) has been obtained as a fourth-degree polynomial interpolation of the LO data in this plane:
| (3.1) |
where is the particle diameter in and is in ; the degree of the interpolating polynomial, limited by the number of available data points, is the smallest that maximizes compatibility with the real curve. Polynomial coefficients are listed in Table 2. We stress that the calibration curve does depend on the specific instrument or calibration, so that it must be characterized by measuring calibrated spheres, as discussed above. This step is preliminary to any further operation to recover the values corresponding to the diameters limiting the bins of the histogram provided by the instrument.
| dimensionless | ||||
| +1.02 |
As a first step, DEDALO converts the lower and upper limits of each size bin into the values retrieved through the calibration curve (red dashed). Then, a histogram is obtained by counting the number of detected particles within each bin. Finally, the limits of the bins are converted again into the corresponding diameters using Mie theory with a refractive index that best suits the sample under consideration and the histogram values are divided by the corresponding bin width. We introduce a smoothing procedure to damp any local non-monotonic behavior of the Mie functions vs with a moving-average within a size range wide. DEDALO dynamically adjusts the size range of the moving average depending on the desired refractive index. In Figure 3, the smoothed function for polystyrene is reported in green.
The core of the DEDALO algorithm is a pre-computed look-up table (LUT, Figure 4a-b) obtained by varying particle diameter and refractive index and calculating the values through Mie theory. The use of the LUT instead of recomputing Mie functions saves a considerable amount of computational time.

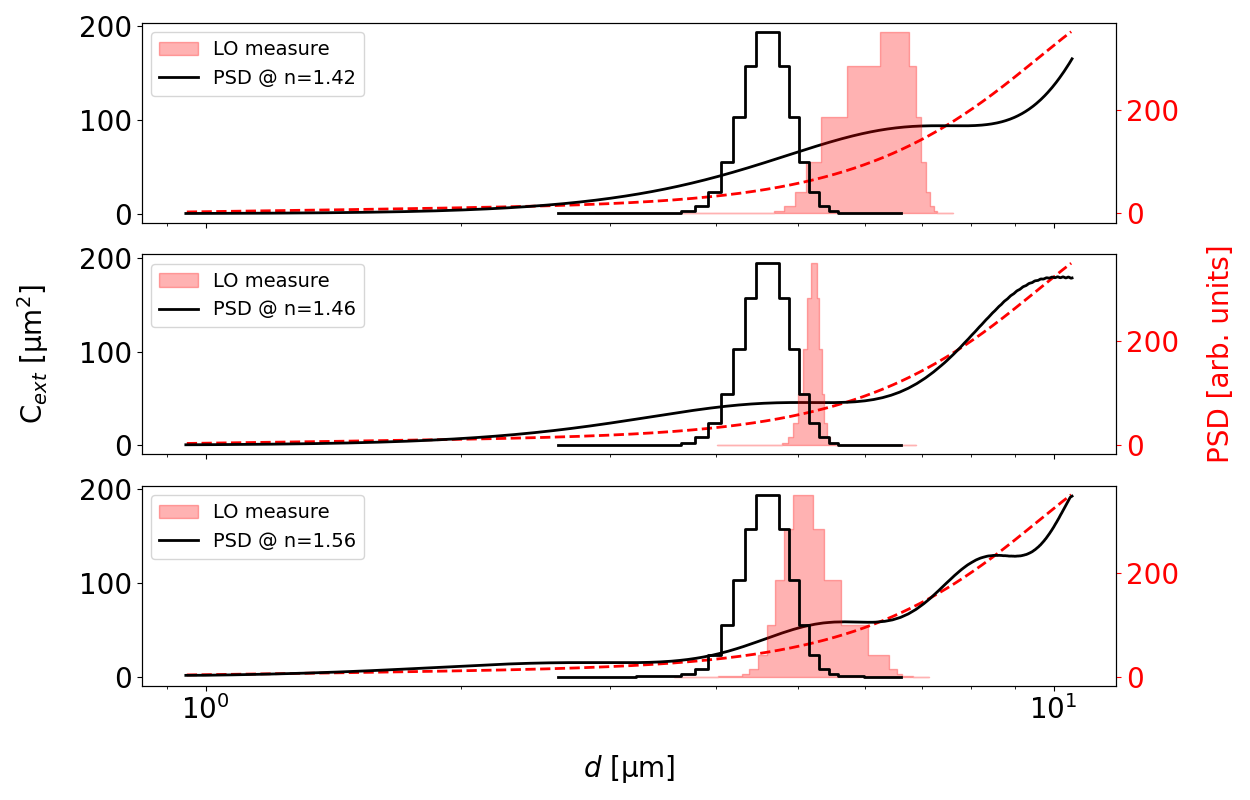
For any given , a size is associated through the LUT to each bin, hence the corresponding histogram value. The LUT has been calculated over a size range of and a refractive index range of . The minimum value of is determined by that of pure water at the operative wavelength of (). In Figure 5, the algorithm working procedure is shown for hypothetical samples with , and , all of them characterized by a Gaussian PSD with average and variance (black and white histograms). Red histograms are the hypothetical results of measurements providing the PSD obtained through LO. DEDALO allows to recover the effective Gaussian histograms from them. The red dashed line represents the calibration curve, adopted here to convert into . The black solid curves are obtained from the LUT for the considered refractive index, to convert into . As discussed in more detail below, the remarkable difference between the distributions proves the need to consider the true refractive index to avoid systematic errors in the PSDs. Following the manufacturer’s indications, the instrumental calibration curve should be characterized periodically and each time the instrument is subject to relevant changes that could affect the results.
DEDALO allows the user to operate the LO instrument in-line, requiring only the value of the flow rate as an input. This is just to calculate particle concentrations based on particle counts. During the measurement, DEDALO shows the instantaneous ( integration time) and the time-integrated PSD, as well as the instantaneous numeric concentration of the sample. A continuous monitoring of the working parameters is provided. The instantaneous and time-integrated PSDs are shown in the interface and are written into a file, together with some statistical markers such as the PSD mode diameter and the distribution quantiles. For convenience, the data is copied into a spreadsheet file as well as a plain text file, to comply with most data visualization tools.
4 Results
The DEDALO algorithm proved to be effective in measuring samples with refractive indices ranging from 1.46 to 1.64, using emulsions as a case study. We also tested the system by mixing two emulsions with known and controlled volume fractions, once analyzed separately. While absorption was negligible for all the analyzed samples, we note that it is not a strict requirement of the method nor the protocol. In fact, in case of absorbing particles, DEDALO can still account for absorption by changing the inversion curve. The choice to operate with samples such as those shown in Table 1 stems mainly from the intention to develop and validate DEDALO under the best possible operating conditions for the LO device, i.e. when using dielectric materials and the spherical approximation applies. Conversely, absorbing nano- and micro-particles are typically characterized by non-spherical shapes and a rather irregular morphology.
The samples were flown into the LO and SPES instruments with a constant flow rate of 2 mL/min; the two instruments were connected in series, thus, the samples can be safely considered statistically the same. The flow has been chosen to minimize any possible deformation of the oil droplets due to shear. While it was not possible to set flow rates lower than 1 mL/min due to the limits of the LO measuring capabilities, we have verified that the chosen flow rate does not significantly affect the spherical geometry thanks to the measurement of two independent parameters obtained simultaneously by the SPES instrument. [22]. Moreover, SPES provides histogram as raw data, giving a unique check to the output of DEDALO from each LO measurement.
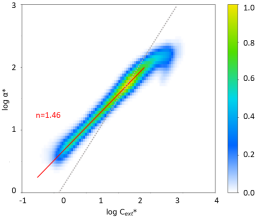
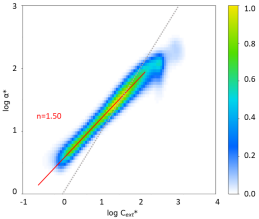
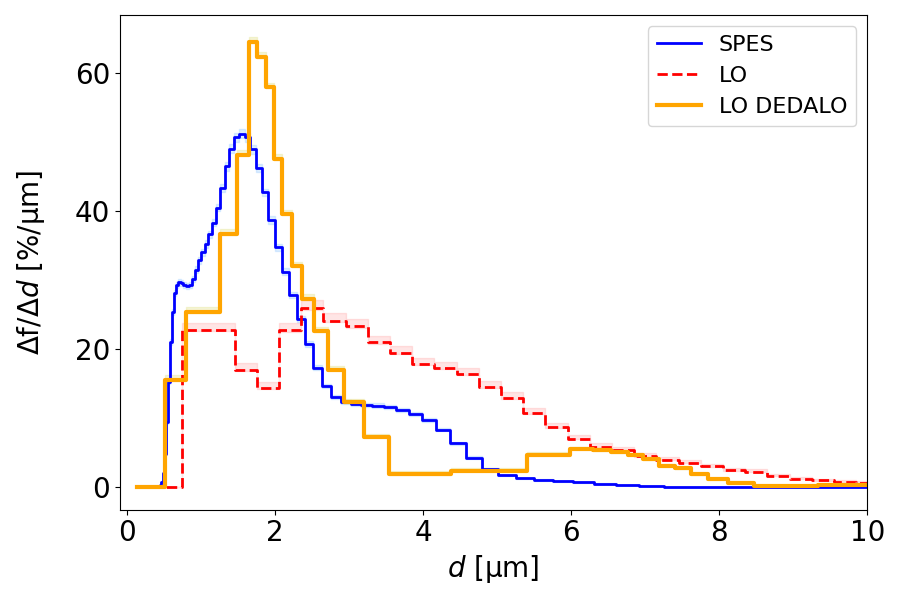
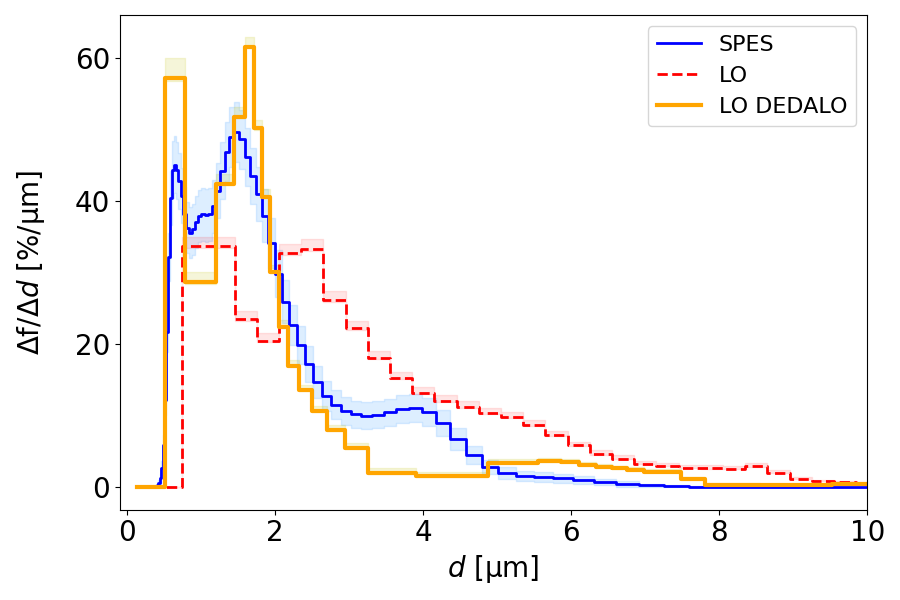
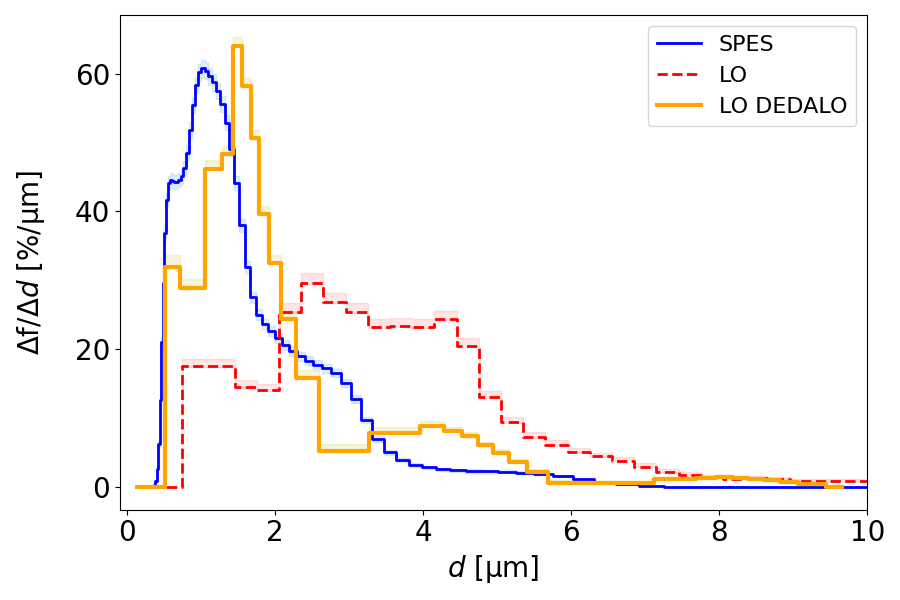
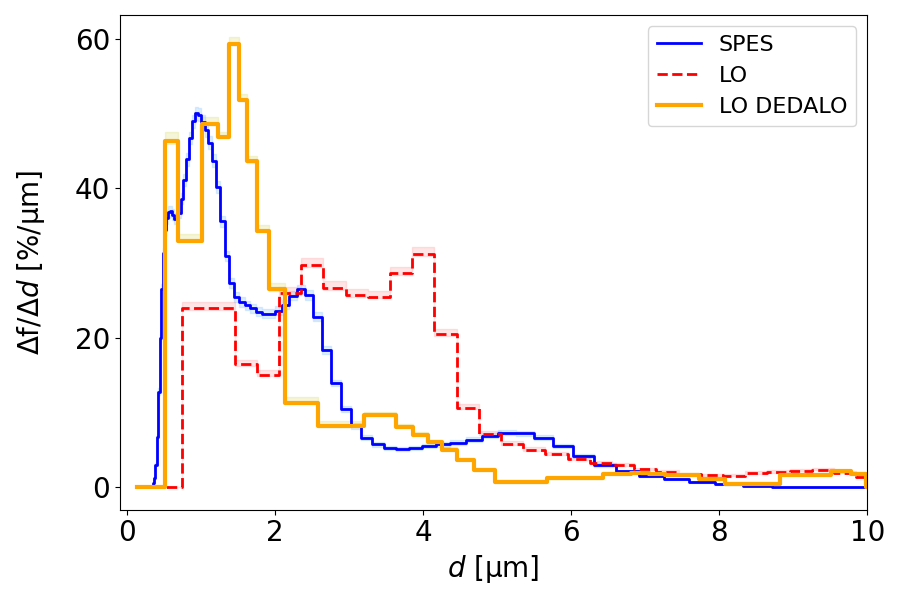
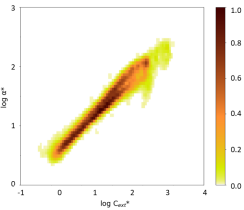
Figures 6-9 report some of the results we obtained with single and mixed oil emulsion, respectively. In Figure 6a-b SPES experimental results are shown as 2D histograms reporting the relative number of particles measured within each 2D bin, as a function of the dimensionless extinction cross-section (/4) and polarizability (), being the wavenumber. Besides using SPES as a double-check for the particle sizing, we could also determine the refractive index of the samples independently, by fitting Mie curves to the experimental data. The agreement with the expected values of is good for all the samples: the standard deviation ranges from 210-2 in the case of single oil emulsion up to 410-2 referring to emulsions obtained by mixing two oils with different . This is a further indication that the particles behave as uniform spheres.
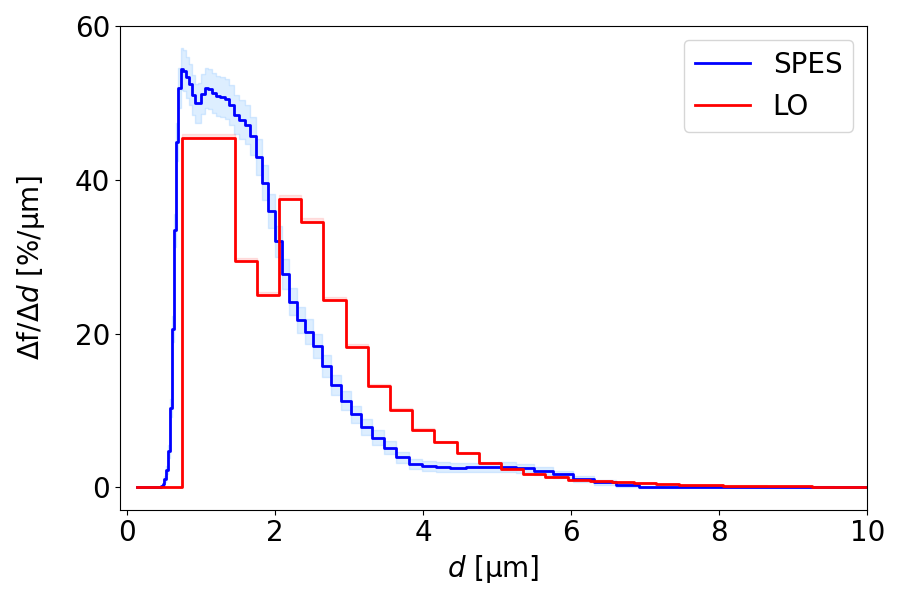
Figures 6c-d report the PSDs measured by SPES (blue histograms) and LO, both before and after processing data through DEDALO (red dashed histogram and orange histogram respectively). The PSDs are obtained by dividing the counts by the corresponding bin width [23]. Finally, PSDs are normalized to the total number of detected particles. Thus, the area of each rectangle is equal to the fraction () of particles in the corresponding bin. After our correction, the PSDs obtained from LO data appear in much more agreement with those obtained from SPES. The uncorrected PSDs are shifted toward larger diameters: this is due to the specific behavior of the calibration curve adopted by the LO instrument. It is worth noting that, by considering samples with increasing refractive index (see Figure 7 and Figure 8), we observe an increasing disagreement. This is due to the non-monotonic behavior of the Mie functions, occurring at smaller diameters for increasing , as evident from Figure 4b-c.
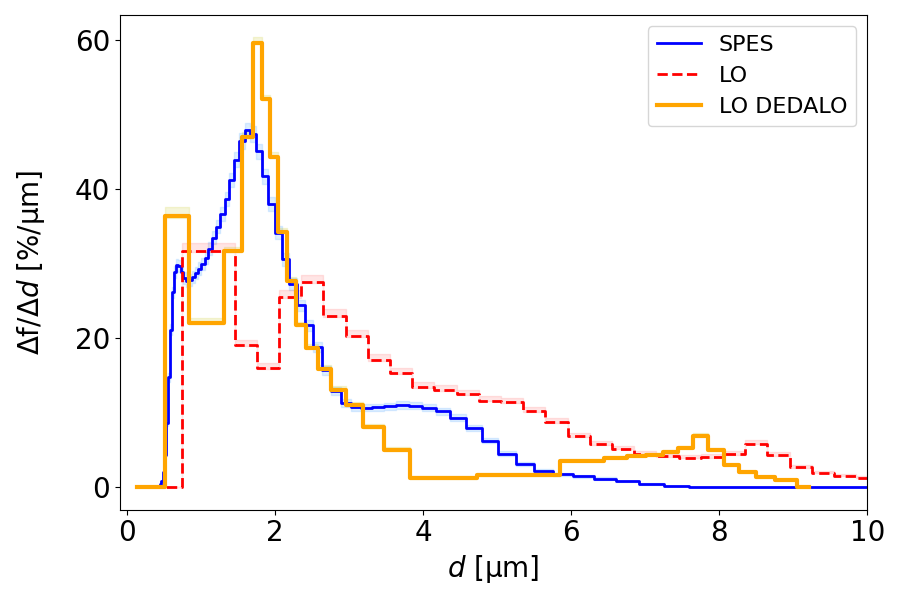
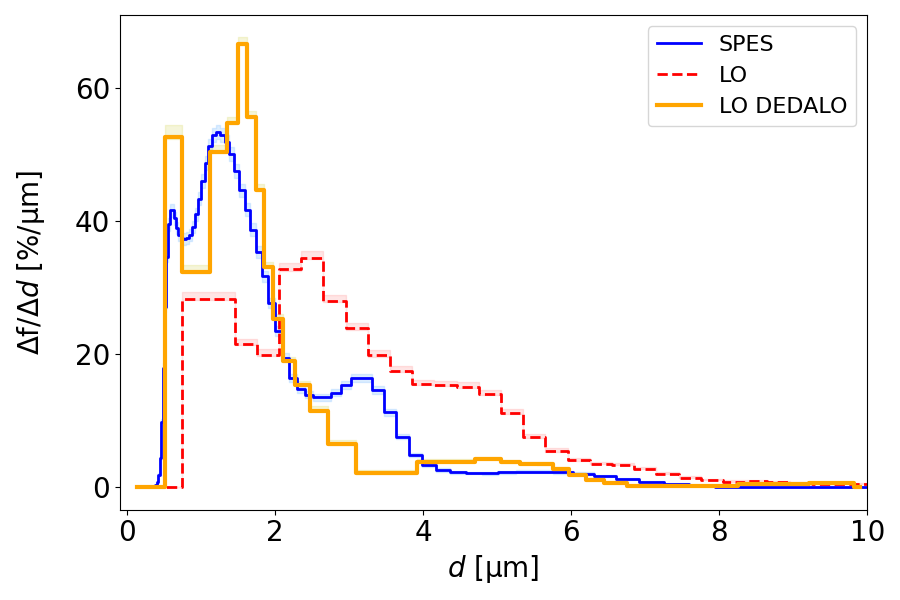
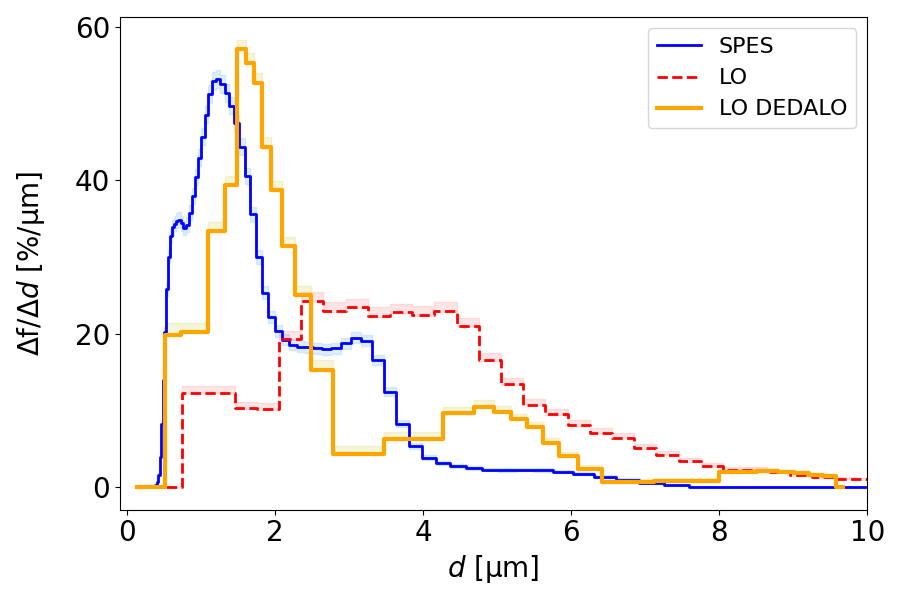
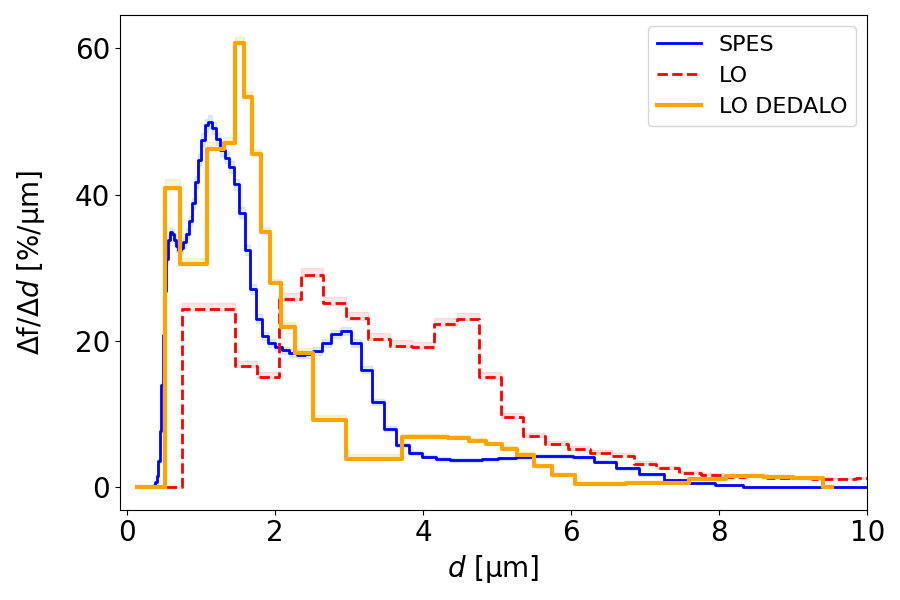
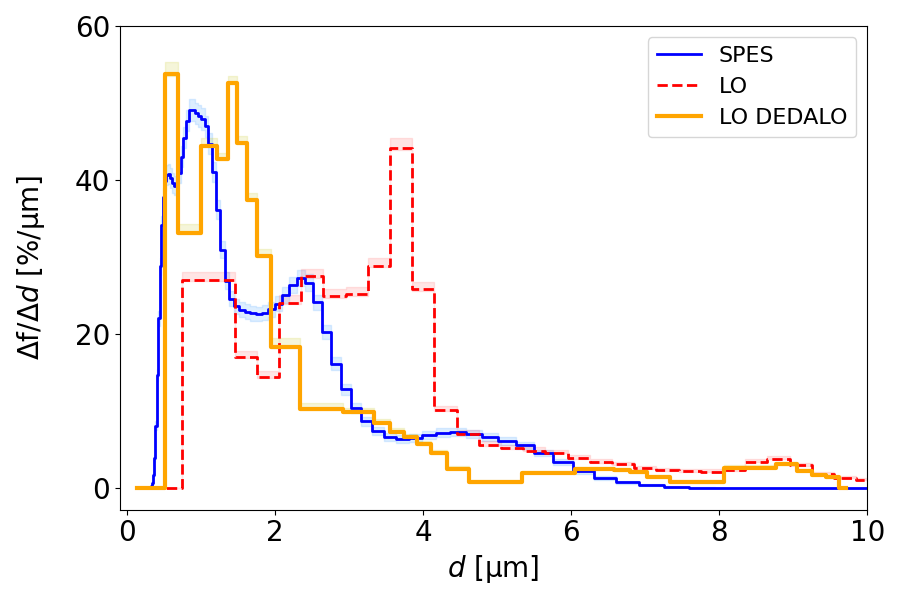
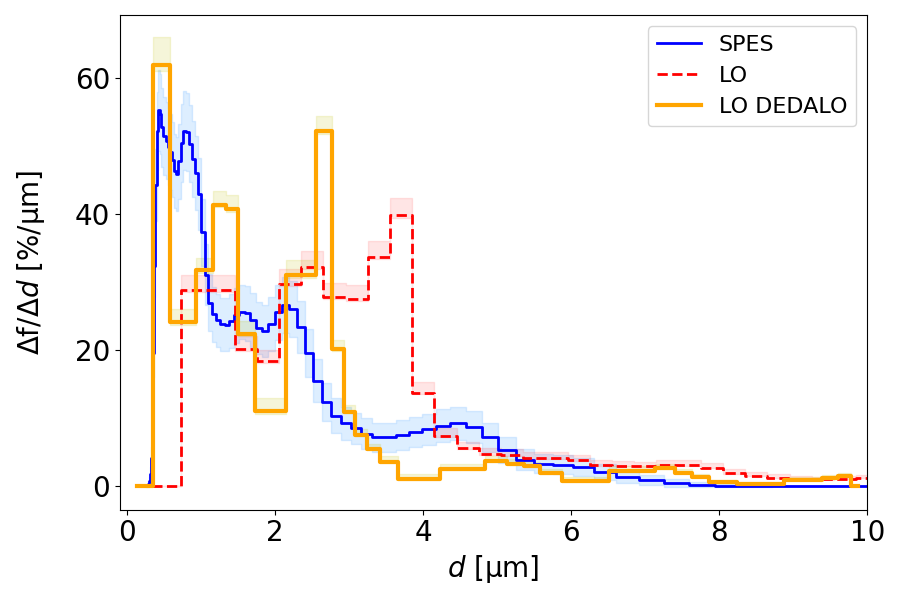
A remarkable artifact appears for 1 where the recovered PSDs (orange histograms) appear extremely underestimated compared with SPES data (blue histograms). This artifact is due to the specific behavior of the in that size region and the corresponding calibration curve. As it is evident in Figure 3, the extinction curve is steeper than the calibration, thus introducing the artifact represented by a minimum around 2 in all the original LO curves (red dashed). The current implementation of the code does not compensate for these artifacts.
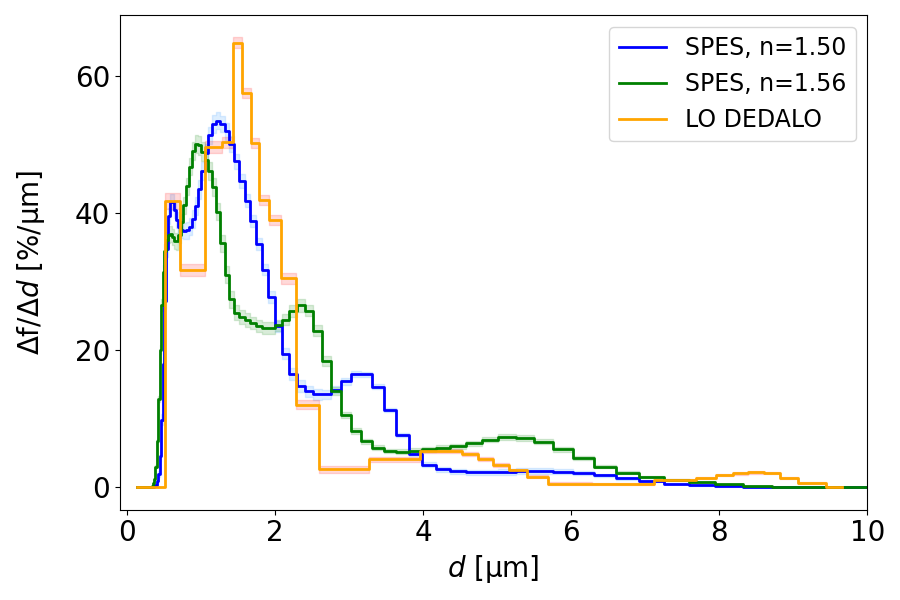
In Figure 9 we show the results obtained by mixing two emulsions with different refractive indices, a typical real-case scenario in most real-world applications. Since LO devices access one parameter () no way is there to distinguish different species in samples composed of several materials. On the contrary, in Figure 9a-b SPES clearly shows the two populations of oil spheres composing the emulsion, thus evidencing the unavoidable artifacts when inverting with one index. Nevertheless, by knowing the refractive indices we can attempt to compensate for the difference between the given oils and polystyrene calibration. In the case of a mixture of suspensions, we propose to use an effective refractive index. In Figure 9c-d we compare the PSDs of each mixed emulsion as measured by LO (red histogram) and the PSDs of the two constituent oil emulsions separately measured by SPES (blue and green histograms, respectively the emulsions with the lower and the higher refractive index). The same PSDs from the SPES instrument are also reported in Figure 9e-f with the PSD obtained through DEDALO (orange histograms) by inverting LO data considering an effective refractive index as the average of the refractive indices of each component.

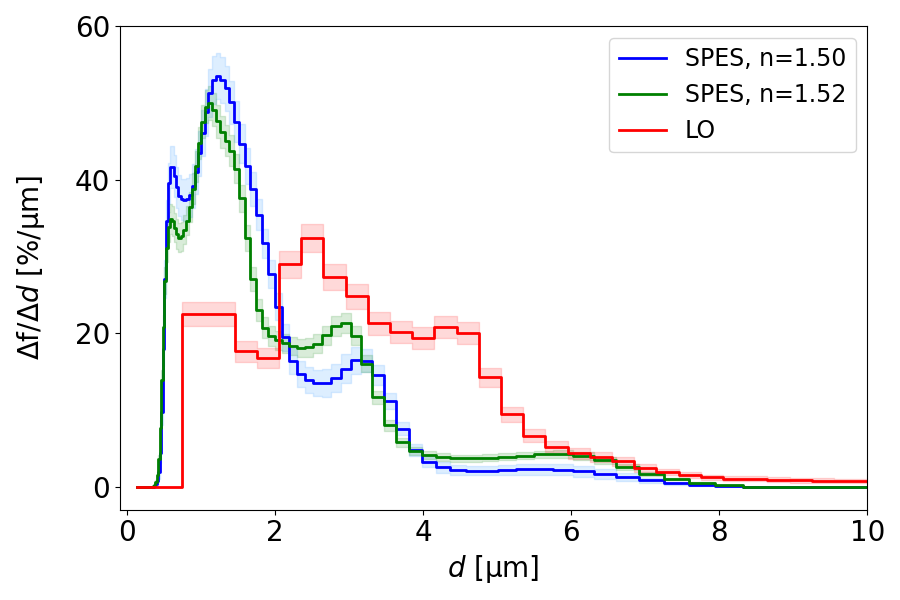
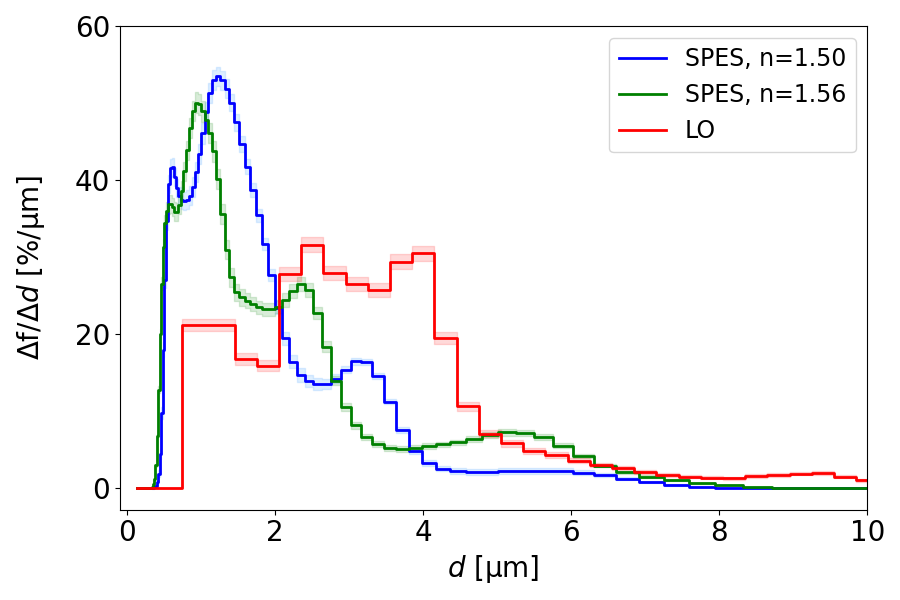
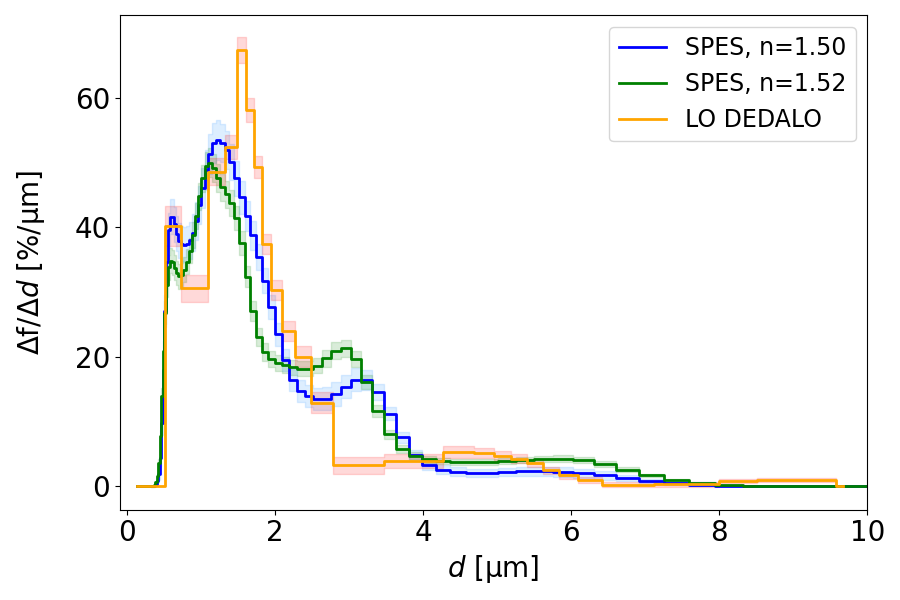
These results show that, despite the use of DEDALO to account for the effective refractive index of the mixed emulsion, the PSD is less accurate than that obtained from the single oil emulsions obtained by SPES. Still, DEDALO will always be more reliable in terms of PSDs than the unprocessed LO.
5 Discussion
To quantify the reliability of DEDALO, a statistical approach has been considered. The Pearson correlation coefficient between SPES and LO PSDs before and after the algorithm application was computed as
| (5.1) |
where and define the PSD referring to SPES and LO respectively and the sum is carried out over the bins of each histogram. and are the average values of the corresponding size distributions, according to the definition
| (5.2) |
This correlation coefficient defines the ratio between the covariance of the two PSDs and the product of their standard deviations; thus, it is essentially a normalized measurement of their covariance, such that the result always has a value between (fully anti-correlated variables) and 1 (fully correlated variables).
Figure [10] shows the correlation coefficient between SPES and LO instruments PSDs before (blue squares) and after (orange triangles) DEDALO execution for all the tested emulsions.
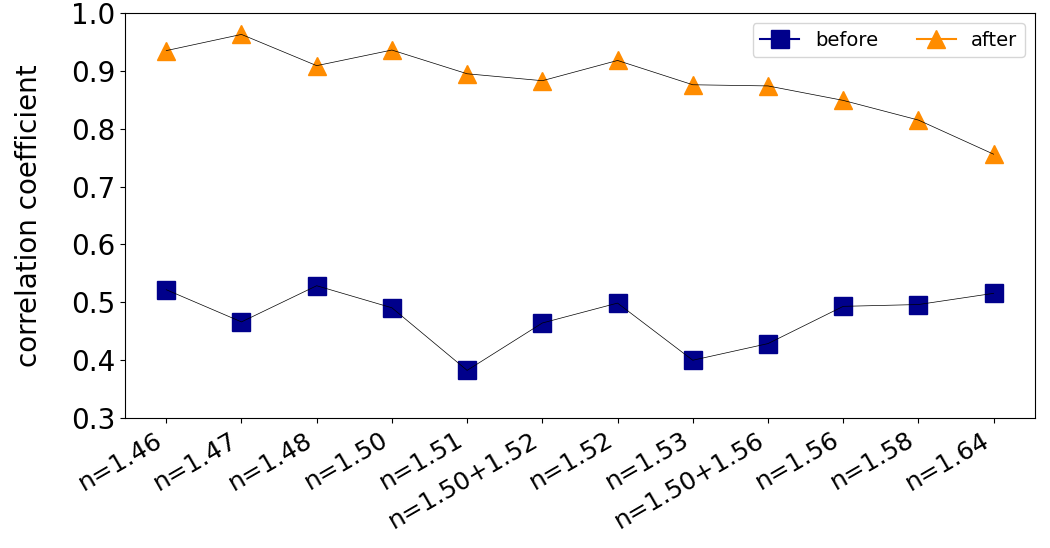
It is possible to appreciate a considerable improvement (correlation-wise) between the data directly recorded by the LO instrument and those processed by DEDALO. Our results show a good correlation for almost all the indices 0.8 while the original LO data are limited below 0.5. The algorithm described in this work considerably improves particle sizing accuracy and measurement quality, as well as the agreement with the data from other light scattering techniques such as the one considered here. As expected, the larger the difference between the target refractive index and that of the polystyrene calibration standard, the larger the correction. Furthermore, in the case of low values of the refractive index, Mie scattering theory gives Cext curves that are considerably smoother and more monotonic. Therefore, the inversion is inherently less prone to artifacts. The effectiveness of DEDALO is further confirmed by the strongly improved comparability between the PSDs geometric median () after the algorithm processing. By describing PSDs as log-normal distributions, the geometric median can be expressed as , where defines the average particle diameter weighted on the histogram bin values. These results are reported in Figure 11.
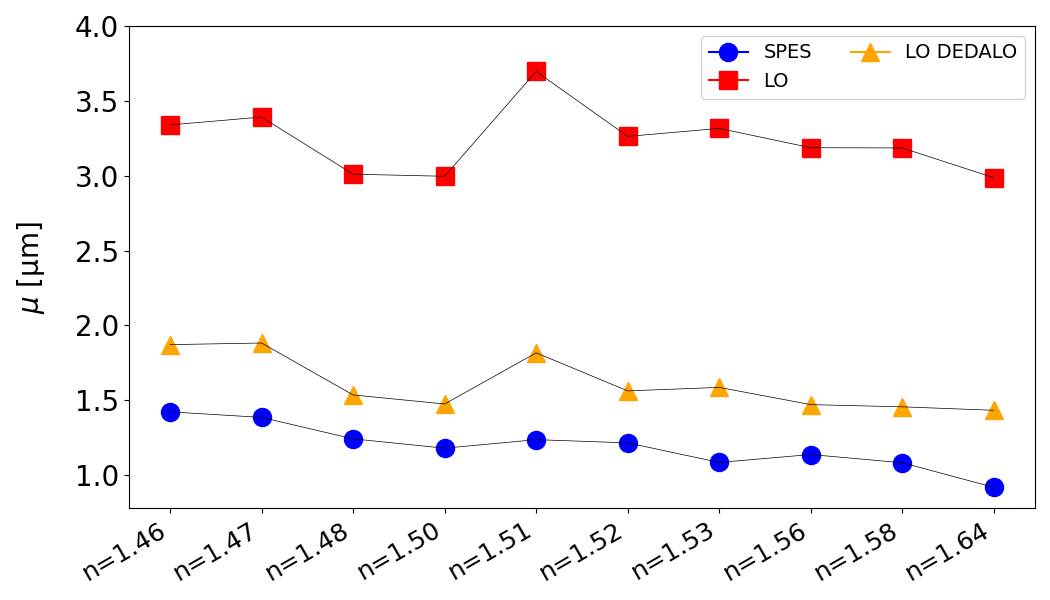
The LO instrument gives a median diameter clearly overestimated compared to the SPES measurement (by more than a factor of 2). The same data processed using DEDALO are much closer to the expected values, within 25 for all considered samples.
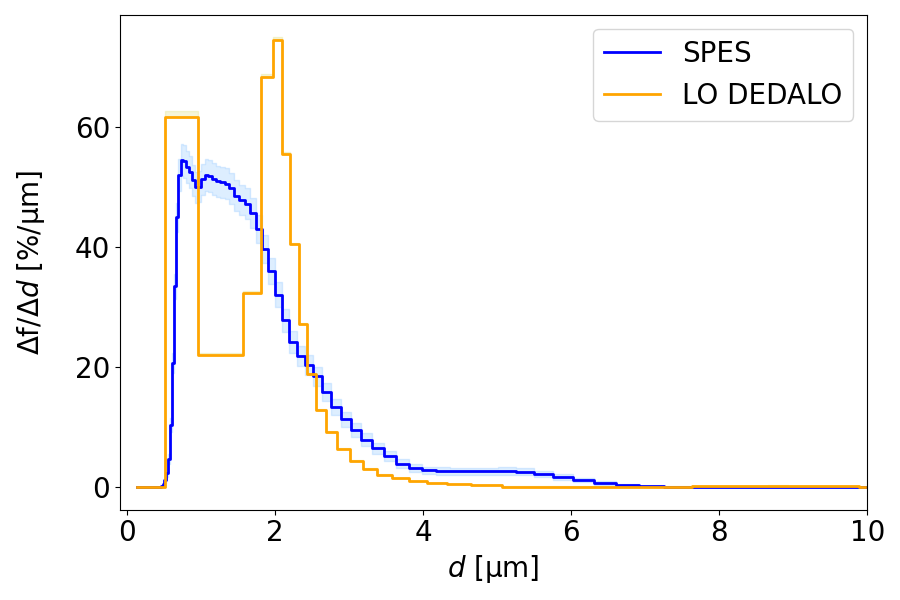
As a practical application, we report the results obtained by applying DEDALO to perform accurate and high-resolution PSDs measurements in meltwater from the cryosphere, as commonly done through LO instruments [24, 25, 26]. Figure 12 shows the results obtained from the CFA measurement of an ice core from the Rutor Glacier, Aosta Valley (Italy), approximately 60 cm long, under study with the scope of a characterization of the solid content of ice. The PSD obtained from a traditional LO measurement differs significantly from SPES data (red histogram and blue histogram in Figure 12a, respectively). By applying DEDALO’s algorithm, this discrepancy can be compensated to a good extent (Figure 12b). The refractive index set for this purpose is 1.45. Quantitatively, in terms of Pearson’s correlation coefficient, from an initial value of DEDALO allows for a peak of . Finally, Figure 12c shows the particle concentration measured by both instruments as the depth of the ice core increases. The close agreement between the two curves confirms the reliability of the LO measurement.

6 Conclusions
We have described a novel open-source Python-based GUI application that improves the procedures to recover the size of a particle from the data obtained through single-particle Light Obscuration sensors. By taking into account the most suitable refractive index based on the sample composition, we remove a strong assumption commonly adopted to extract size from the raw data in this kind of instruments. Since these data are not typically available, we use the calibration curve to recover the from the size values provided by the instrument. Therefore, by introducing the sample refractive index, we are able to get a size that is reasonably much closer to the real one. As expected, the PSDs are appreciably affected by the choice of assuming one specific refractive index, as commonly exploited in commercial instruments. Comparing to the measurements obtained with an independent optical technique, we show that DEDALO is capable of partially compensating this effect. Our method can improve the accuracy in particle sizing by Light Obscuration measurements in several fields [5, 6]. Our data clearly show that the PSDs obtained with DEDALO are more reliable compared to those compliant with the corresponding ISO standard [2].
Upon testing with different kinds of oil emulsions, DEDALO proved to be reliable and consistent over a wide range of refractive indices, from 1.46 up to 1.64, both for single refractive index solutions and in the case of mixtures composed of multiple substances. We observed that some limitations arise for large values of the refractive index; this is mainly due to the oscillations in the trend as size increases, which become more and more frequent with increasing and hence alter the reconstruction. In the specific case of mineral dust, for which the (effective) refractive index value can span from about to , the effectiveness of DEDALO has been tested as well by analyzing a 60 cm ice core from the Rutor Glacier, Aosta Valley. By applying the proposed inversion algorithm, the correlation coefficient between the PSDs measured by the LO instrument and by another independent optical method (SPES) has more than doubled. In addition, the strong agreement of the particle concentration curves measured with the two techniques further confirms DEDALO reliability and high-resolution for PSDs measurements in meltwater from the cryosphere. Even more generally, after the extensive validation of our code we believe that DEDALO could potentially have many further applications in pharmaceutical and industrial quality control processes, determining the size distribution of different types of organic samples: commercial plastic polymers such as PVC or PMMA ( and at 670 nm respectively), some organic compounds including urea () and cellulose () and many hydrocarbons with refractive indices ranging from 1.32 up to 1.43 [27].
DEDALO has been implemented with an ad hoc graphical user interface which easily allows to drive an in-line instrument. This application was initially developed with the aim of conducting reliable, high-resolution measurements of mineral dust stored in both the polar and Alpine cryosphere, within a collaboration with the paleoclimate and glaciology group at the University of Milano-Bicocca.
The algorithm is publicly available on the website of the Instrumental Optics Laboratory of the Physics Department of the University of Milan (https://instrumentaloptics.fisica.unimi.it/dedalo/) and on the GitHub page of the corresponding author (https://github.com/LucaTeruzzi/DEDALO). Being written in Python 3.10, the algorithm can run on all operative systems without compatibility issues. For Windows systems, DEDALO executable that does not need to be compiled manually is also available. It will be continuously updated with new functionalities and cross-platform compatibility.
Appendix A Oil refractive index dependence on wavelength
For each oil considered in this work, the refractive index as a function of the wavelength () has been computed through Cauchy equation
| (A.1) |
| Reference | [] | [] | |
|---|---|---|---|
| 1.46 | 1.45 | 4.07103 | 4.16107 |
| 1.47 | 1.46 | 4.40103 | 6.54107 |
| 1.48 | 1.47 | 4.73103 | 8.92107 |
| 1.50 | 1.48 | 5.39103 | 1.37108 |
| 1.51 | 1.49 | 5.72103 | 1.60108 |
| 1.52 | 1.50 | 6.05103 | 1.84108 |
| 1.53 | 1.51 | 6.37103 | 2.08108 |
| 1.56 | 1.54 | 7.36103 | 2.79108 |
| 1.58 | 1.55 | 8.05103 | 3.66108 |
| 1.64 | 1.60 | 1.03104 | 8.11108 |
Figure 13 shows the refractive index variation with wavelength for all the analyzed samples. The two wavelengths corresponding to the operative values of LO ( 670 nm) and SPES ( 635 nm) instruments are also highlighted with a red solid line and a red dashed line respectively.
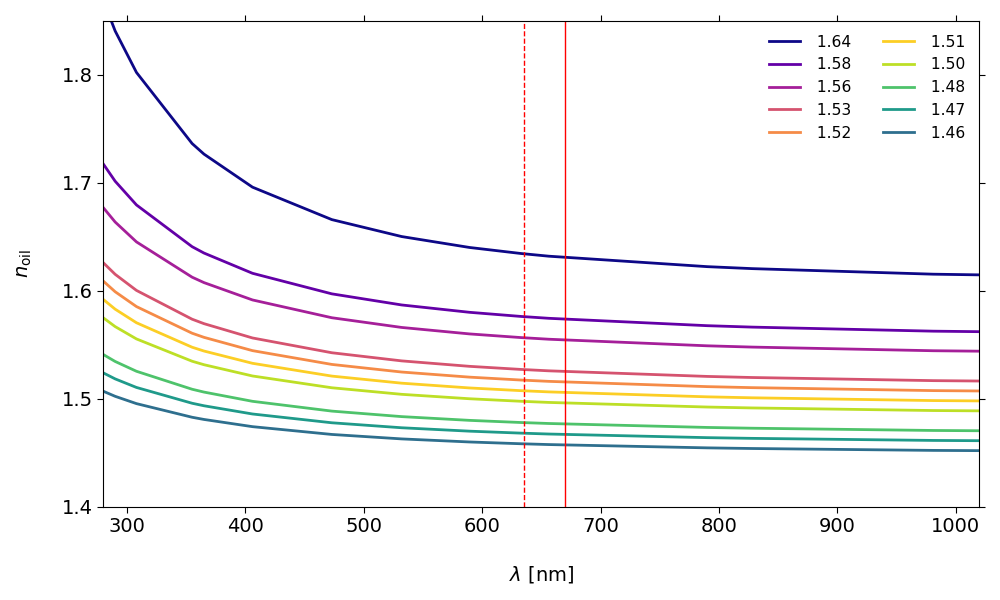
In addition, in Table 4 the refractive index values evaluated at 670 nm and 635 nm and their difference () are reported.
| Reference | 635 nm | 670 nm | |
|---|---|---|---|
| 1.46 | 1.458 | 1.457 | 110-3 |
| 1.47 | 1.468 | 1.467 | 110-3 |
| 1.48 | 1.478 | 1.476 | 210-3 |
| 1.50 | 1.497 | 1.496 | 310-3 |
| 1.51 | 1.507 | 1.505 | 210-3 |
| 1.52 | 1.517 | 1.515 | 210-3 |
| 1.53 | 1.527 | 1.525 | 210-3 |
| 1.56 | 1.556 | 1.554 | 210-3 |
| 1.58 | 1.576 | 1.574 | 310-3 |
| 1.64 | 1.634 | 1.631 | 310-3 |
The expected difference in refractive index, in the order of 10-3, is clearly much smaller than the error derived by fitting the SPES data (10-2, as reported in Section 4). Thus, it is negligible to the correction to size inversion and can be disregarded to our purposes.
Acknowledgments
This work has is the result of a collaboration with the EuroCold Lab (European Cold Laboratory Facilities) and the paleoclimate and glaciology group at the University of Milan-Bicocca. We acknowledge Tiziano Sanvito and Marco Pallavera of EOS S.r.l. for their valuable support.
References
- [1] USP. General Chapters: <788> Particulate Matter in Injections, Pharmacop. Forum 28 (2012), USP32-NF27.
- [2] ISO21501-3 Determination of particle size distribution – Single particle light interaction methods – Light extinction liquid-borne particle counter. Standard No. ISO21501-3, Int Org Standard, Geneva, CH (2019).
- [3] H. C. van de Hulst, Light Scattering by Small Particles, Dover Publications Inc., New York (1981).
- [4] C. F. Boren, D. R. Huffman, Absorption and Light Scattering by Small Particles, Wiley Science Paperback Series, New York (1998).
- [5] L. L. Wang, P. DeRose and A. K. Gaigalas, Assignment of the number of equivalent reference fluorophores to dyed microspheres, Journal of Research of National Institute of Standards and Technology 121 (2016), 264–281.
- [6] E. S. Novik, A. V. Dorenskaya, N. A. Borisova and O. V. Gunar, Subvisible Particulate Matter in Therapeutic Protein Injections, Pharmaceutical Chemistry Journal 53 (2019), 353-360.
- [7] S. N. Kasarova, N. G. Sultanova and I. D. Nikolov, Temperature dependence of refractive characteristics of optical plastics, J. Phys. Conf. Ser. 253 (2010), 012028.
- [8] A. Moujoud, Z. Saddiki, T. Touam, S.I. Najafi Measurement of the refractive-index variations with temperature of hybrid sol–gel glasses, Thin Solid Films 422 (2002), 161–165.
- [9] R. M. Waxler and C. E. Weir, Effect of pressure and temperature on the refractive indices of benzene, carbon tetrachloride, and water J. Res. Natl. Bur. Stand. A Phys. Chem. 67A(2) (1963), 163-171.
- [10] Y. Liu and P. H. Daum, The Effect of Refractive Index on Size Distributions and Light Scattering Coefficients Derived from Optical Particle Counter, J. Aerosol Sci., 31(8) (2000), 945-957.
- [11] T. Werk, D. B. Volkin and H. C. Mahler, Effect of solution properties on the counting and sizing of subvisible particle standards as measured by light obscuration and digital imaging methods, Eur. J. Pharm. Sci. 53 (2014), 95–108.
- [12] D. C. Ripple and P. C. DeRose , Primary determination of particle number concentration with Light Obscuration and dynamic imaging particle counters, J. Res. Natl. Inst. Stan. 123 (2018), 1-21.
- [13] D. C. Ripple and Z. Hu, Correcting the relative bias of Light Obscuration and flow imaging particle counters, Pharm. Res. 33 (2016), 653–672.
- [14] A. R. Quiroz, G. Quèbatte, F. Stump, C. Finkler, J. Huwyler, R. Schmidt, H. C. Mahler, A. V. Koulov, and M. Adler, Measuring subvisible particles in protein formulations using a modified Light Obscuration sensor with improved detection capabilities, Anal. Chem. 87 (2015), 6119-6124.
- [15] M. A. C. Potenza, T. Sanvito and A. Pullia, Measuring the complex field scattered by single submicron particles, AIP Advances 5(11) (2015) 117222.
- [16] L. Cremonesi, A. Passerini, A. Tettamanti, B. Paroli, B. Delmonte, S. Albani, F. Cavaliere, D. Viganò, G. Bettega, T. Sanvito, A. Pullia and M. A. C. Potenza, Multiparametric optical characterization of airborne dust with single particle extinction and scattering, Aerosol Sci. Technol. 54(4) (2020), 353-366.
- [17] M. A. C. Potenza, C. Cella, B. Paroli, C. Lenardi and P. Milani, Single particle optical extinction and scattering allows real time quantitative characterization of drug payload and degradation of polymeric nanoparticles, Sci Rep 5 (2016), 18228.
- [18] https://www.cargille.com/refractive-index-liquids/
- [19] U. Ruth, Concentration and Size Distribution of Microparticles in the NGRIP Ice Core (Central Greenland) during the Last Glacial Period PhD thesis, Bremen Universitat (2002).
- [20] S. Villa, T. Sanvito, B. Paroli, A. Pullia, B. Delmonte, and M. A. C. Potenza, Measuring shape and size of micrometric particles from the analysis of the forward scattered field, J. Appl. Phys. 119 (2016), 224901.
- [21] M. F. Simonsen, L. Cremonesi, G. Baccolo, S. Bosch, B. Delmonte, T. Erhardt, H. A. Kjær, M. A. C. Potenza, A. Svensson and P. Vallelonga, Particle shape accounts for instrumental discrepancy in ice core dust size distributions, Clim. Past 14 (2018), 601–608.
- [22] M. A. C. Potenza and L. Cremonesi, On the quasi-universality of the forward light scattering lobe for micrometric objects, J. Quant. Spectrosc. Radiat. Transf. 278 (2022), 108028.
- [23] W. C. Hinds, Aerosol Technology, Properties, Behavior and Measurement of Airborne Particles, Wiley Science, New York (1999).
- [24] F. Lambert, M. Bigler, J. P. Steffensen, M. Hutterli, and H. Fischer, Centennial mineral dust variability in high-resolution ice core data from Dome C, Antarctica, Clim. Past 8 (2012), 609–623.
- [25] F. Lambert, B. Delmonte, J. R. Petit, M. Bigler, P. R. Kaufmann, M. A. Hutterli, T. F. Stocker, U. Ruth, J. P. Steffensen and V. Maggi, Dust-climate couplings over the past 800,000 years from the EPICA Dome C ice core, Nature 452 (2008), 616–619.
- [26] A. Wegner, H. Fischer, B. Delmonte, J. R. Petit, T. Erhardt, U. Ruth, A. Svensson, B. Vinther and H. Miller, The role of seasonality of mineral dust concentration and size on glacial/interglacial dust changes in the EPICA Dronning Maud Land ice core, J. Geophys. Res. Atmos., 120 (2015), 9916–9931.
- [27] https://refractiveindex.info/