Galaxy evolution in compact groups – II. Witnessing the influence of major structures in their evolution
Compact groups (CGs) of galaxies are an extreme environment for the morphological transformations and the cessation of star formation in galaxies. However, despite initially being conceived as isolated systems, it is now widely recognised that many of them are not as isolated as expected. Our objective is to understand the dynamics of CGs, as well as how the environment surrounding CGs impacts their morphological and physical properties. To achieve this, we selected a sample of 340 CGs in the Stripe 82 region, with a total of 1083 galaxies, and a sample of 2281 field galaxies as a control sample. We find that at least 27% of our sample of CGs are part of major structures, i.e. non-isolated CGs. We find a bimodality in the effective radius ()-Sérsic index () plane for all transition galaxies (those with and ) in CGs. Additionally, transition galaxies in isolated CGs populate more densely the plane for . In contrast, transition galaxies in non-isolated CGs have smoothly increasing values, suggesting these galaxies have already suffered morphological transformation, and primarily contribute to the distribution of more compact galaxies in the plane for all transition galaxies in CGs. We also find significant differences in the specific star-formation rate (sSFR) distribution between the late-type galaxies (LTGs) (those with and ) in non-isolated CGs and the same type of galaxies in the control sample, suggesting that the evolution of LTGs differs in non-isolated CGs. Moreover, Early-type galaxies (those with and ) and transition galaxies in non-isolated CGs have lower sSFR values and a higher fraction of quenched galaxies, compared to those in isolated CGs. Based on our results, we propose an evolutionary scenario where the major structures in which the CGs are embedded accelerate the morphological transformations of their galaxy members, and also facilitates preprocessing. Our findings highlight the importance of considering the larger structures in which CGs may be located, when analysing the properties of their galaxy members, as this can significantly affect the evolution of CGs and their galaxies.
Key Words.:
galaxies: groups: general - galaxies: evolution - galaxies: interactions1 Introduction
Galaxy groups and clusters play a significant role in helping us understand how the surrounding environment shapes the evolution of galaxies. In the -CDM model (Peebles 1984), galaxy clusters mainly grow via the accretion of galaxies, both individually and in groups that have already undergone environmental effects, known as pre-processing (Zabludoff & Mulchaey 1998, Fujita 2004, Pallero et al. 2019, Donnari et al. 2021), which has been supported by observations of groups falling into clusters (Eckert et al. 2014, Haines et al. 2015, Lopes et al. 2024). Compact groups (CGs) of galaxies, characterized by high densities comparable to cluster cores and a low-velocity dispersion, provide an excellent opportunity to study the effects of galaxy-galaxy interactions (Hickson 1982). Observational studies and simulations suggest that CGs consist of a combination of virialized groups (Gomez-Flechoso & Dominquez-Tenreiro 1997, Gómez-Flechoso & Domínguez-Tenreiro 2001), chance alignments, where they are merely a projection effect (Mamon 1986, Hernquist et al. 1995, Tovmassian et al. 2006, Hartsuiker & Ploeckinger 2020), collapsed groups, which refer to bound substructures within clusters, and nodes (Díaz-Giménez & Mamon 2010, Zheng & Shen 2021, Taverna et al. 2022, Taverna et al. 2023). This shows that the physical nature of CGs is still not well understood, which is a challenge at the observational level as there is no access to the 3D information of each CG.
CGs have been classified in three main types by Coziol et al. (2004), based on their internal dynamic and galaxy properties. Type A CGs are predominantly characterized by low-velocity dispersions with a median of 135 , and contain a large fraction of late-type spirals with active star formation or AGN. Type B CGs have intermediate velocity dispersions with a median of 302 , and consist of a significant fraction of interacting or merging galaxies. Type C CGs have high velocity dispersions with a median of 567 , and are dominated by elliptical galaxies that are passive. These authors suggest that CGs evolve from Type A to Type C, proposing that the evolutionary state of a CG increases with its velocity dispersion. Additionally, the environment surrounding the sample of CGs studied by Coziol et al. (2004) was analyzed by other authors. For example, Ribeiro et al. (1998)) found that these CGs could be either locally isolated or surrounded by galaxies, suggesting that these CGs are part of major structures. Therefore, Coziol et al. (2004) suggests that the evolution of CGs not part of major structures must be regulated by their own masses, while those linked to major structures depend on the masses of the major structures, with the most dynamically evolved CGs found in the most massive structures. Coziol et al. (2004) propose that this may result from galaxies in CGs evolving more rapidly when these groups are located within massive structures. Alternatively, it is suggested that the formation of CGs embedded in massive structures may have preceded the formation of isolated CGs.
The more dynamically evolved CGs have higher velocity dispersion and a lower fraction of late-type galaxies (LTGs) than less evolved systems (Hickson 1982, Moura et al. 2020, Diaz-Gimenez et al. 2021). Within this context, it is worth highlighting a recent study done by Zheng & Shen (2021), where they found that the CGs in their sample are not necessarily isolated; some of them are embedded in major structures, others called “predominant CGs”,i.e. groups that have more galaxies in addition to those in the CG catalogue, but these additional galaxies are fainter than the CG members. Others are called “split CGs” because part of their members belong to at least two different groups. One of the most significant findings in that work is that the dynamics of CGs within major structures are influenced by the mass of these major structures. In this context, understanding the properties and dynamics of CGs and their connections to larger-scale structures is crucial for interpreting the environmental effects on galaxy evolution in these systems, as suggested by Díaz-Giménez & Zandivarez (2015) and Taverna et al. (2023).
In Montaguth et al. (2023) we published the first of a series of papers, aimed at understanding better the role of CGs in the pre-processing of galaxies. In that first work (Montaguth et al. 2023) we estimated the Sérsic index and the effective radius of each galaxy, in a sample of 340 CGs and a control sample of field galaxies by modeling the galaxies’ surface brightness. We found that galaxies in CGs have smaller effective radii compared to the galaxies in the control sample, suggesting possible influences from tidal interactions. Additionally, we classified galaxies based on their morphology using the colour and Sérsic index (). Specifically, we defined “transition galaxies” as those with a lower Sérsic index () and red colours (). Upon comparing these galaxies between CGs and the control sample, we identified a peculiar population of galaxies that was absent in the control sample. These CG galaxies are characterized by their smaller radius and larger compared to their counterparts in less dense environments, indicating an ongoing morphological transformation. This finding agrees with previous works, such as those done by Bitsakis et al. (2016) and Coenda et al. (2012), which have also noted the effective transformation of spiral galaxies into early-type galaxies within CGs.
Moreover, we found that CGs hosted a higher fraction of quenched galaxies than the control sample. Additionally, variations in star formation rates were evident, suggesting that environmental effects favor the cessation of star formation, in agreement with previous studies (Johnson et al. 2007, Gallagher et al. 2008, Walker et al. 2010, 2013). In the first paper, we studied all the CGs together. However, one clue to understanding the evolution of galaxies in these CGs lies in studying their surrounding environment. Considering this information, the following questions naturally arise: are the CGs responsible for the morphological transformation of galaxies that we find in Montaguth et al. (2023)? Or is the environment in which the CGs are embedded which generates this transformation? How significant is the impact of the major structure where the CGs are located on the physical transformation of galaxies?
Our goal here, in the second paper of this series, is to understand how the dynamical state of a CG is affecting the evolutionary stage of its members and to discern what is the role of the larger-scale environment in the evolution of CG of galaxies. To achieve this, we will use the morphological parameters calculated in Montaguth et al. (2023) and complement them with data from the GALEX-SDSS-WISE LEGACY CATALOG (GSWLC, Salim et al. 2018) which provides star formation rate information. The outline of this paper is as follows: we describe the data used, our process for selecting CGs and control field samples in Section 2; our methodology to classify galaxies according to their morphology, the dimensionless crossing time, and the compactness of each CG is described in Section 3. We present and discuss our results in Sections 4 and 5; and finally, our conclusions and summary are laid out in Section 6. Throughout this paper we have adopted a flat cosmology with , , and (Spergel et al. 2003).
2 Data
In this Section, we briefly describe our criteria for selecting the CGs and their galaxies, and the control sample of field galaxies. To identify CGs, we used two catalogues: Sohn et al. (2016) and Zheng & Shen (2020). The latter is the largest catalogue to date, and the catalogue by Sohn et al. (2016) complements it well by providing information on low-redshift CGs that were excluded from the Zheng & Shen (2020) due to their limit in magnitude of -band . Sohn et al. (2016) use redshifts from SDSS-DR12 (Alam et al. 2015) and complement them with data from the FAST spectrograph at Fred Lawrence Whipple Observatory (Fabricant et al. 1998). On the other hand, the redshifts used by Zheng & Shen (2020) are from SDSS-DR14 (Abolfathi et al. 2018), LAMOST (Luo et al. 2015), and GAMA (Liske et al. 2015). From these catalogs, we identified CGs in the Stripe 82 region (Abazajian et al. 2009) and obtained the coordinates, redshift of each galaxy, and velocity dispersion of each CG. As we mentioned in Montaguth et al. (2023), we selected galaxies in this region because it is associated with the first data release of the Southern Photometric Local Universe Survey (S-PLUS) project (Mendes de Oliveira et al. 2019), an ongoing imaging survey that uses a robotic 0.8m aperture telescope located at the Cerro Tololo Inter-American Observatory (CTIO) in Chile. The S-PLUS survey employs the Javalambre 12-band magnitude system, consisting of 5 broad-band filters (, , , , ) and 7 narrow-band filters centred on notable stellar spectral features and it has been used to study the morphological and physical properties of galaxies in clusters (e.g., Lima-Dias et al. 2021,2024) and in CGs in our first work of Montaguth et al. (2023). We note, however, that the analysis shown in this paper is based on the Data Release 3 (DR3) of S-PLUS (Almeida-Fernandes et al. 2022), where the photometry has been improved. We then cross-matched the coordinates from Sohn et al. and Zheng & Shen catalogues with the S-PLUS catalogue, and we obtained a total of 340 CGs with 1083 galaxies, within a redshift range from 0.015 to 0.197. For further details about the S-PLUS survey and its photometry, we refer the reader to Mendes de Oliveira et al. (2019) and Almeida-Fernandes et al. (2022), respectively.
For the control sample of field galaxies, we used the catalogue by Yang et al. (2007) and selected the galaxies that were labelled as single-member groups and that are in Stripe 82. From this catalogue we selected the coordinates, and then crossmatched again with the S-PLUS catalogue, finding in total . From this sample, we used a Monte Carlo algorithm to obtain a subsample of 2281 galaxies, ensuring they share the same range in apparent magnitude in the -band and redshift range as the galaxies in CGs. Further details on the sample selection process can be found in Montaguth et al. (2023).
3 Methodology
3.1 Morphological classification
The key parameters used to analyze the morphology of galaxies, the Sérsic index () and the effective radius (), are obtained for each galaxy in our samples and for each available filter, with the MegaMorph code (Bamford et al. 2011; Häußler et al. 2013; Vika et al. 2013). This code uses the GALFITM algorithm tomodel the surface brightness of a galaxy using a two-dimensional analytical function and extends these to multiple wavelengths using Chebyshev polynomials. The best fit is determined using the Levenberg-Marquardt algorithm, which minimizes . We fit all the galaxies with a single component model using a Sérsic profile (Sersic 1968), with the Sérsic index determining the shape of the light profile. In this paper we want to explore the connection between the dynamics and physical/structural parameters of CGs galaxies. For this reason, we will only focus on the values of and in the band, since in Montaguth et al. (2023), we already explored the relationship of structural parameters with wavelength. However, incorporating multiple wavelengths into the fitting process enhances the precision of the parameters. Research conducted by Vika et al. (2013) demonstrates significant reductions in both, statistical and systematic uncertainties, associated with structural parameter measurements when using MegaMorph with SDSS filters (, , , , ) compared with the results obtained with GALFIT on the same filters but performing the fit filter by filter (Peng et al. 2002, Peng et al. 2010). We note that we have a wide range of S/N for our galaxy images, ranging from 10 to 1600 in the -band, which may potentially impact the derivation of structural parameters. However, the code’s authors111Subsection: How biased are the size and luminosity measurements by low signal-to-noise when you can’t see outer regions of galaxies? https://users.obs.carnegiescience.edu/peng/work/galfit/TFAQ.html emphasize that the uncertainties of the fittings must be taken into account when analyzing the structural parameters derived from GALFIT. They simulated galaxies with different Sérsic profiles and added noise to see if GALFIT could recover the original values used to model the galaxies. They found that in the case of galaxies with higher noise, the original value can be recovered if the uncertainties from the fit measurements are considered.
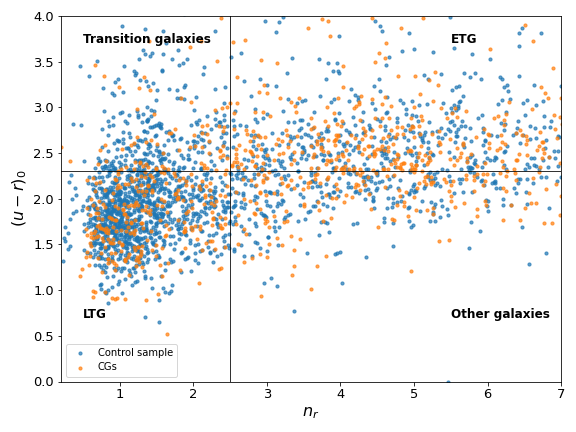
In this work, we classify galaxies according to their morphology, as defined in Montaguth et al. (2023). This classification is based on the Sérsic index in the -band () and the colours, following the criteria proposed by Vika et al. (2015). In contrast to Montaguth et al. (2023), here we have applied the k-correction to the colour . Therefore the colour used for the morphological classification is k-corrected. We made this correction because Vika et al. (2015) show that this technique remains effective up to z, while our sample extends up to z. We employ the publicly available software package of Blanton & Roweis (2007) in version to obtain de-reddened model magnitudes at . Figure 1 shows the k-corrected colour - diagram. The horizontal line represents the colour and the vertical line represents a Sérsic index . The lower-left quadrant defines our selection of late-type galaxies (LTG), the upper-left quadrant, contains what we name transition galaxies, the upper-right quadrant, early-type galaxies (ETGs), and galaxies in the lower-right quadrant are named as ”other galaxies”.
3.2 Star formation rate and stellar masses
We complement the morphological classification with information on the star formation rate (SFR) and stellar mass for each galaxy. In the case of the SFRs, we used the values published by Salim et al. (2018) who derived the SFRs through spectral energy distribution fitting on GALEX, SDSS, and WISE data. These authors use the CIGALE code (Noll et al. 2009) to perform a SED fitting to each galaxy. In this catalogue, we find information for and of the galaxies in CGs and in the control sample, respectively. To estimate the stellar mass (), we use an empirical relation proposed by Taylor et al. (2011). This empirical relation is based on the rest-frame colour and the absolute magnitude in the -band for each galaxy (for a more detailed estimation see Montaguth et al. 2023). We note that this stellar mass estimate is consistent with those obtained from SED fitting by Salim et al. (2018), within a difference in dex of . Using these parameters we derived the specific star formation rate (sSFR) for the galaxies in our samples that have the SFR values in Salim et al. (2018) catalogue.
3.3 Dynamical state of the CGs: dimensionless crossing time and compactness
One convenient method for estimating the dynamical state of a group is by using the dimensionless crossing time, . It corresponds to the period of time it takes for a galaxy to pass through a group (Moura et al. 2020). is the Hubble-Lemaitre constant, and the crossing time, , was defined by Hickson et al. (1992) as:
where is the three-dimensional velocity dispersion defined as , is the median of the radial velocities of galaxies in the group, and is the median of velocity errors squared, which was estimated using the estimated errors in the redshift. We use the value for radial velocities and their errors already obtained in the catalogues of the CGs. represents the median of the two-dimensional galaxy-galaxy separation vector in kpc. We estimated it by first calculating the separation in angular distances (in arcsec) between each galaxy in the CGs. Then, we determined the median of these separations in arcseconds for each group and converted it to linear distances (in kpc), according to the distance of each group.
We also estimate the compactness parameter, which was defined by Hickson (1982) as the surface brightness of the group. This is the total magnitude of the group galaxies averaged over the smallest circle containing the galaxies:
where is the apparent magnitude in -band of each galaxy in the group, and is the angular radius of the smallest circle, in arcseconds, which contains all the galaxies within the group. We consider this parameter with the purpose of identifying whether the compactness of CGs has any relation to their dynamical state.
4 Results
4.1 Dynamical status of the CGs
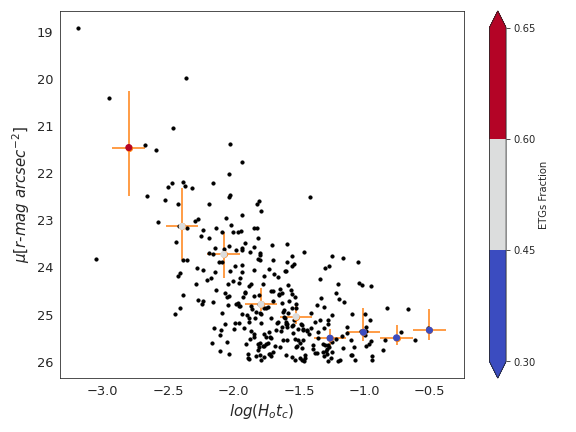
Figure 2 shows the compactness as a function of the dimensionless crossing time. The small black dots represent the values for each CG, and the large filled circles with different colours and error bars represent the median values, where the bar on the x-axis is the size of the bin used to estimate the median and the length of the y-axis is the statistical error of a confidence interval (CI) using bootstrapping. In the top panel of Figure 2, colours of the filled circles represent the median fraction of LTGs, whereas, in the bottom panel, colours indicate the ETG median fraction. We find that CGs with fainter compactness exhibit higher dimensionless crossing times and, an increase in the median fraction of LTGs. Consequently, we observe an increase in the fraction of ETGs for smaller values and brighter compactness values.
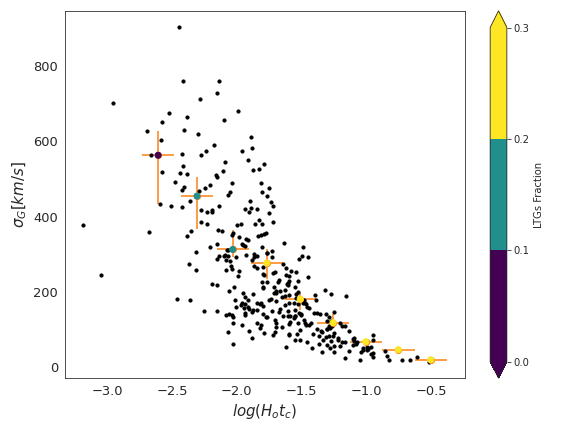
Figure 3 is similar to Figure 2, but in this case, the dimensionless crossing time is compared with the velocity dispersion () of the CG. We find that CGs with lower have higher values of and thus a larger fraction of LTGs. Whereas the opposite is true for the CGs with a high fraction of ETGs. This is in agreement with the results presented by Moura et al. (2020), who found that when dividing the CGs in low- (high-) with ( ), the CGs with low- have larger crossing times and high fractions of spirals than those having high-.
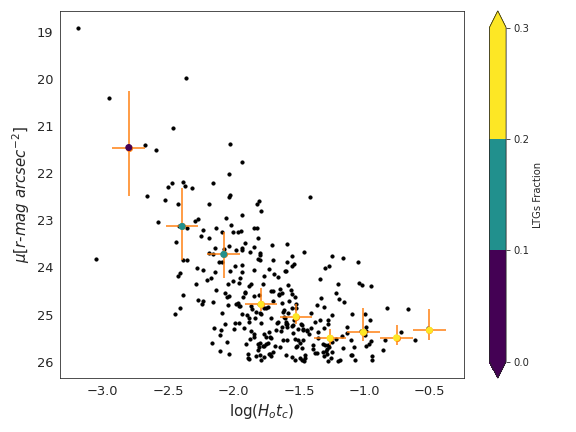
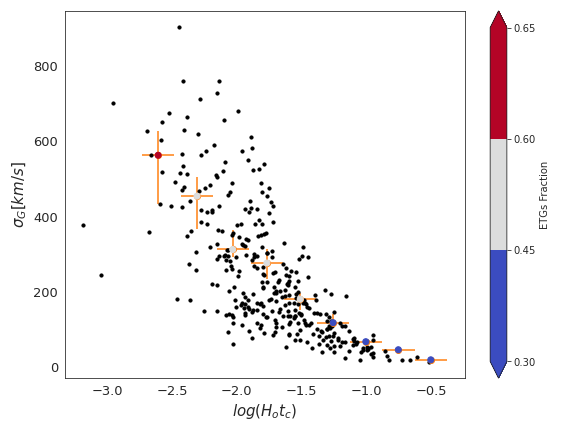
In summary, we find that parameters such as crossing time, velocity dispersion, compactness, and LTG/ETG fractions provide clues about the evolutionary stage of a CG. Indeed, CGs having low-velocity dispersion, faint compactness, and a higher LTG fraction display high crossing times values, suggesting that they are at an early stage of interaction, or just formed (Moura et al. 2020). In general terms, these systems are less evolved than those CGs with higher velocity dispersion, brighter compactness, and lower fraction of LTGs.
4.2 Connection between velocity dispersion and morphological transformation
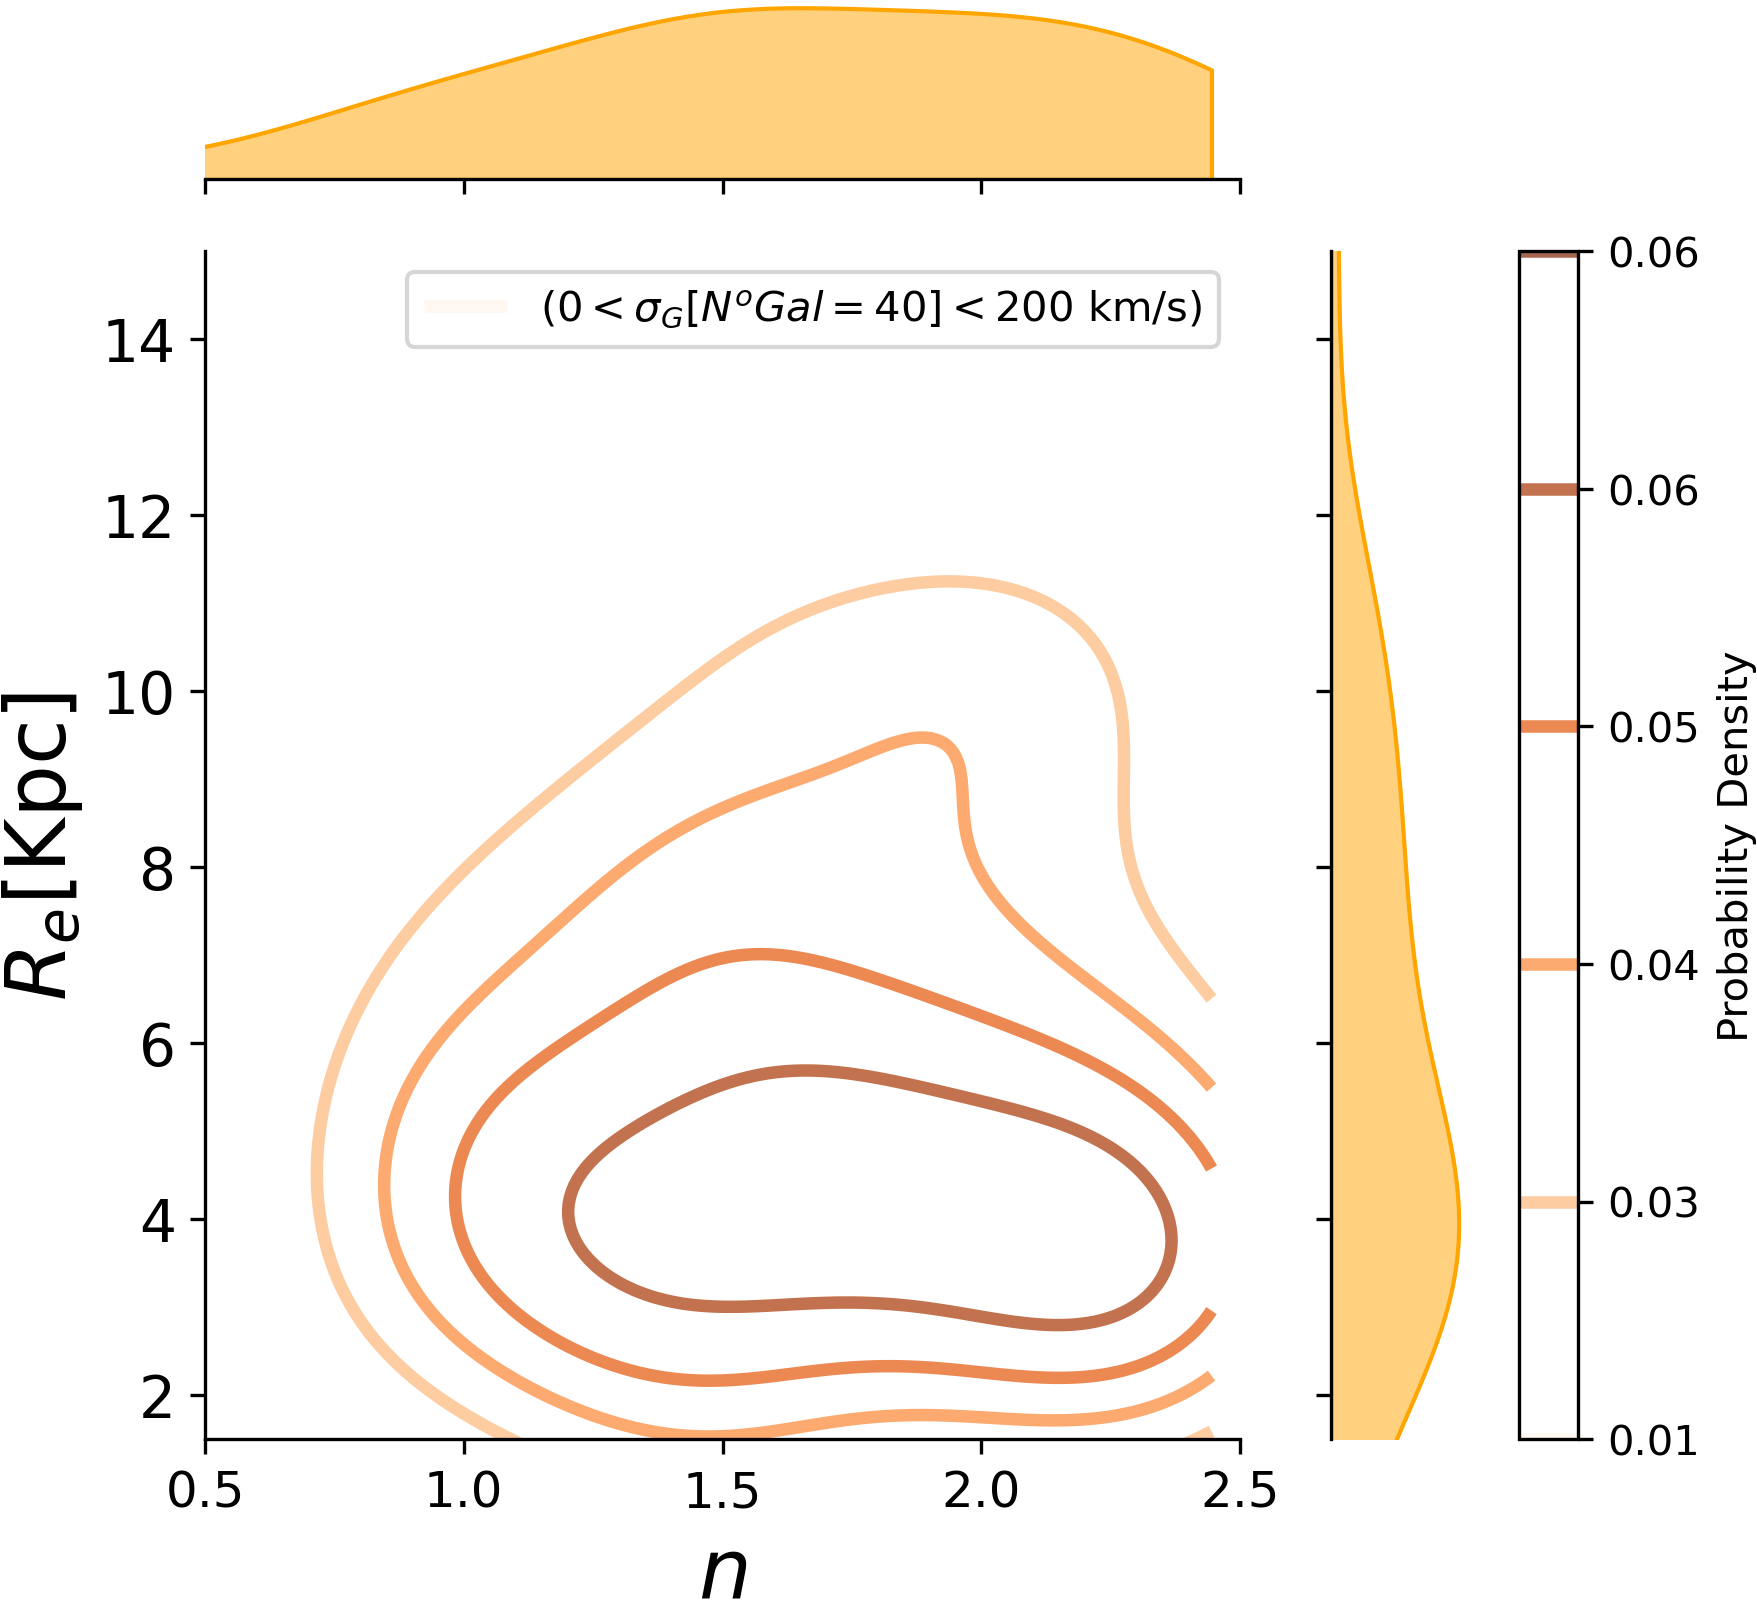
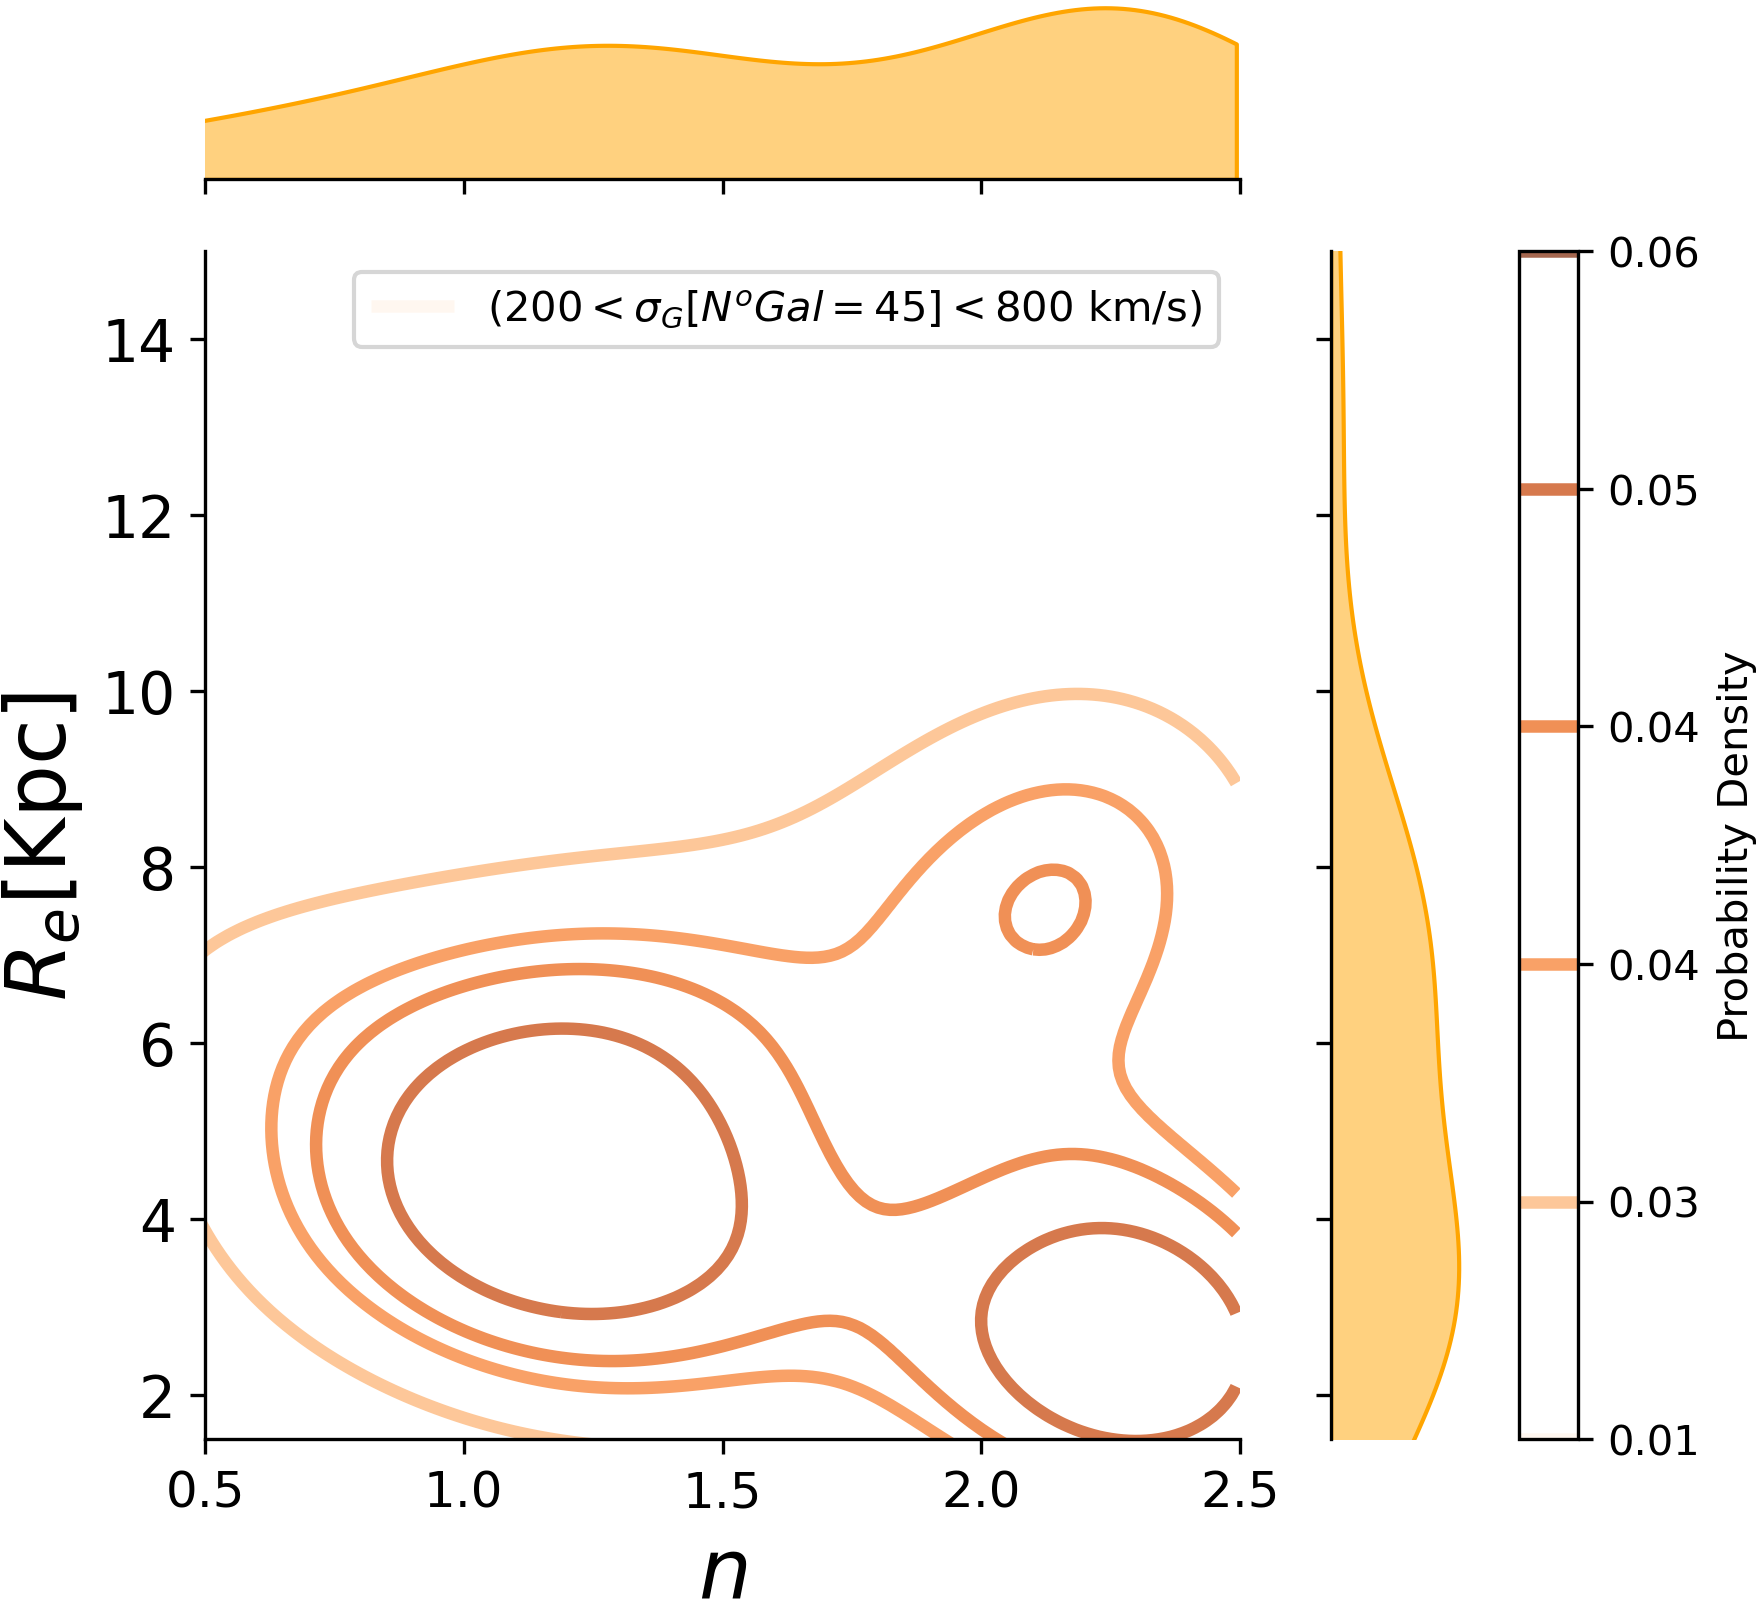
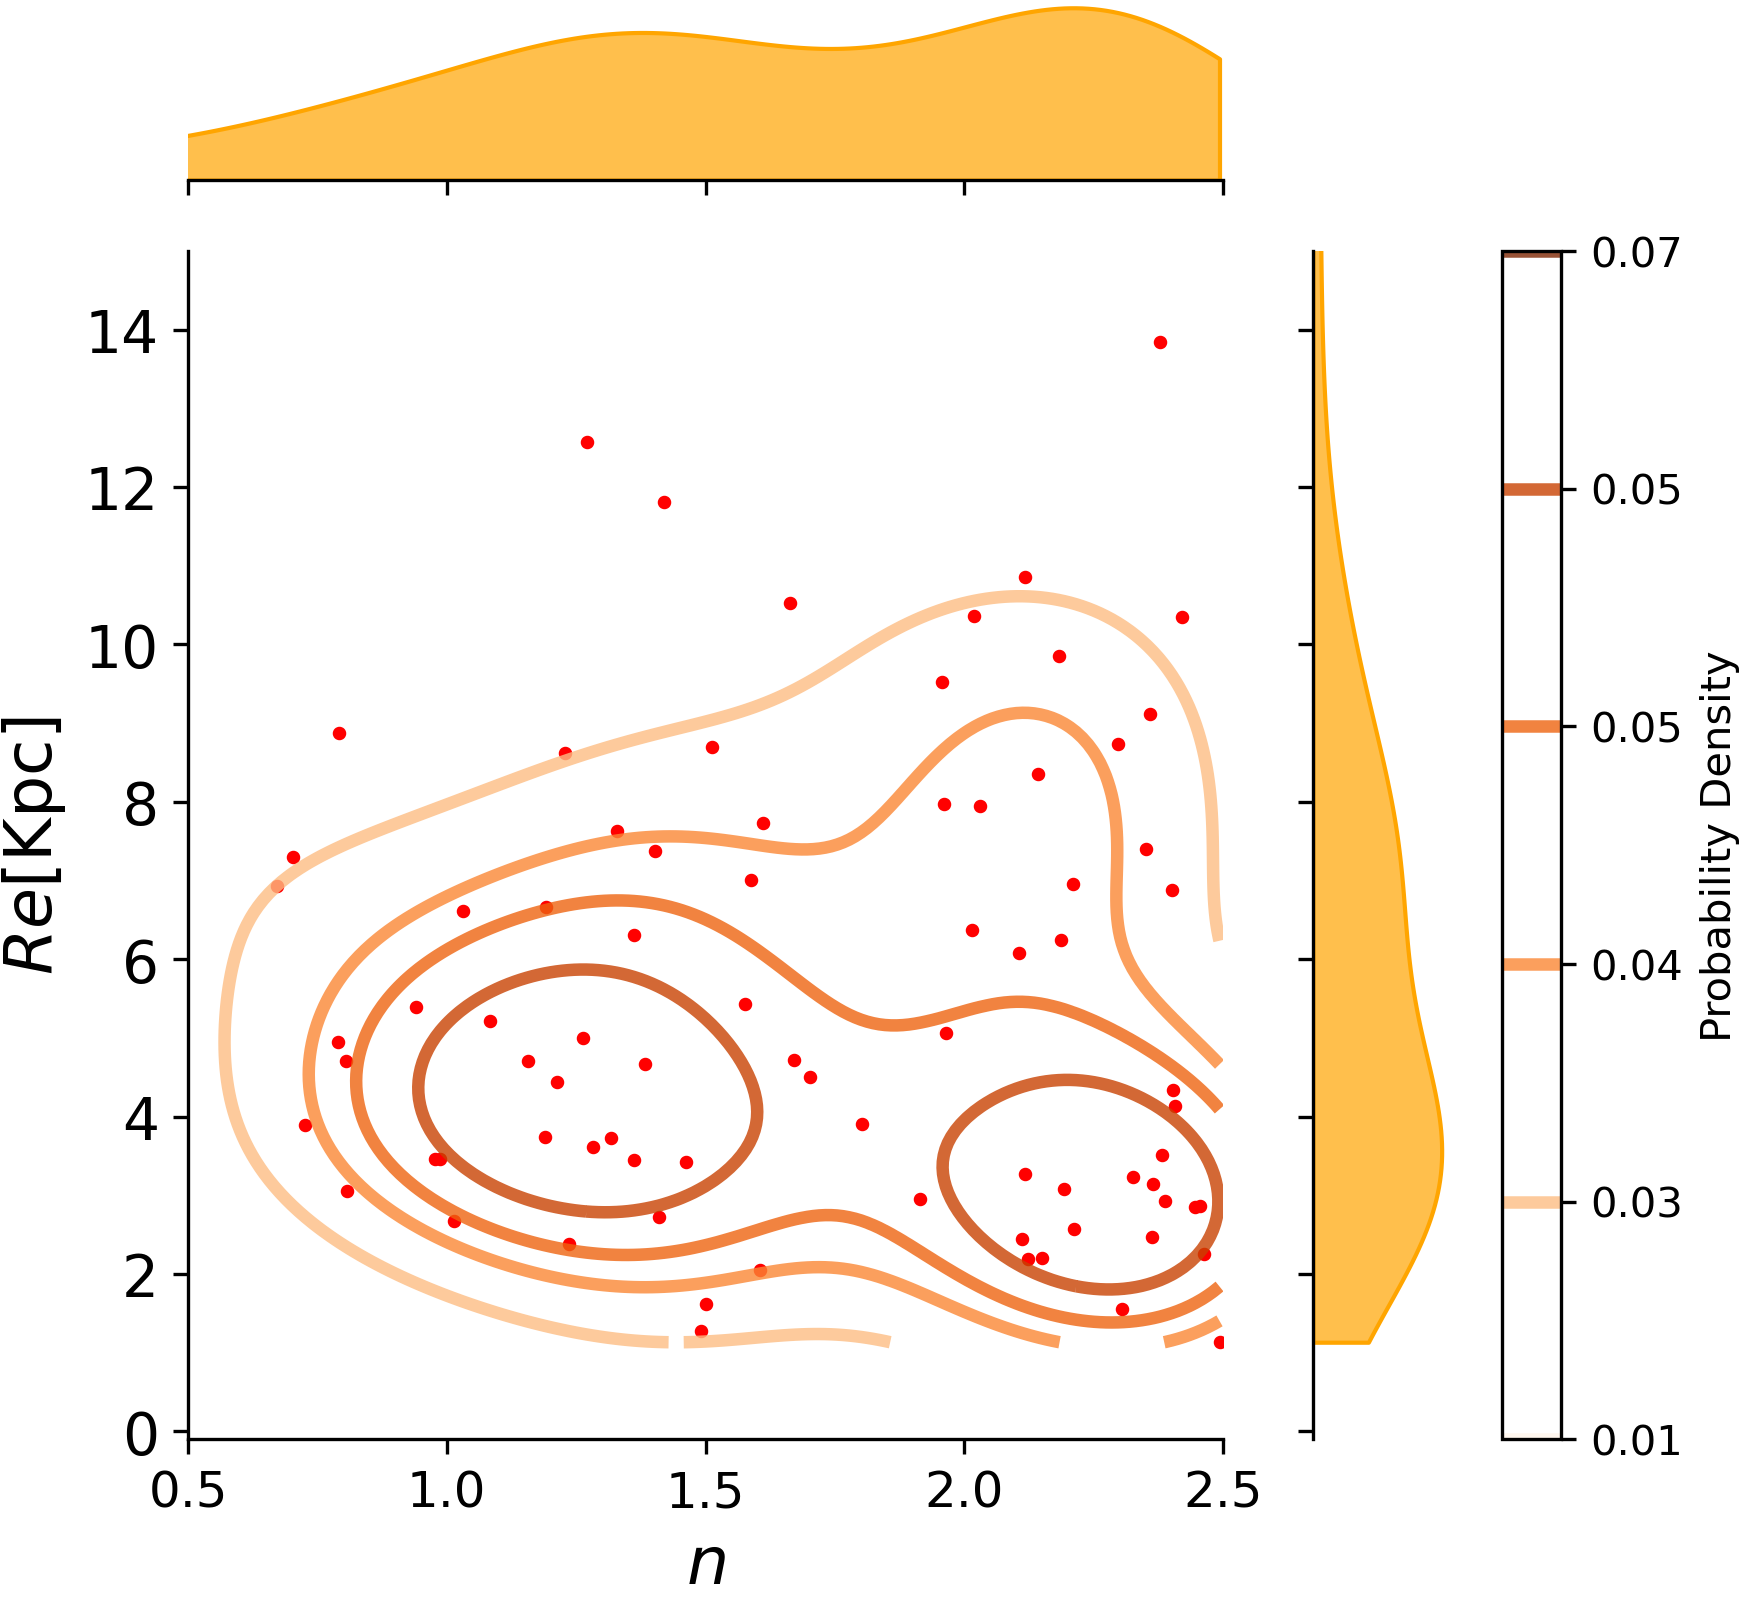
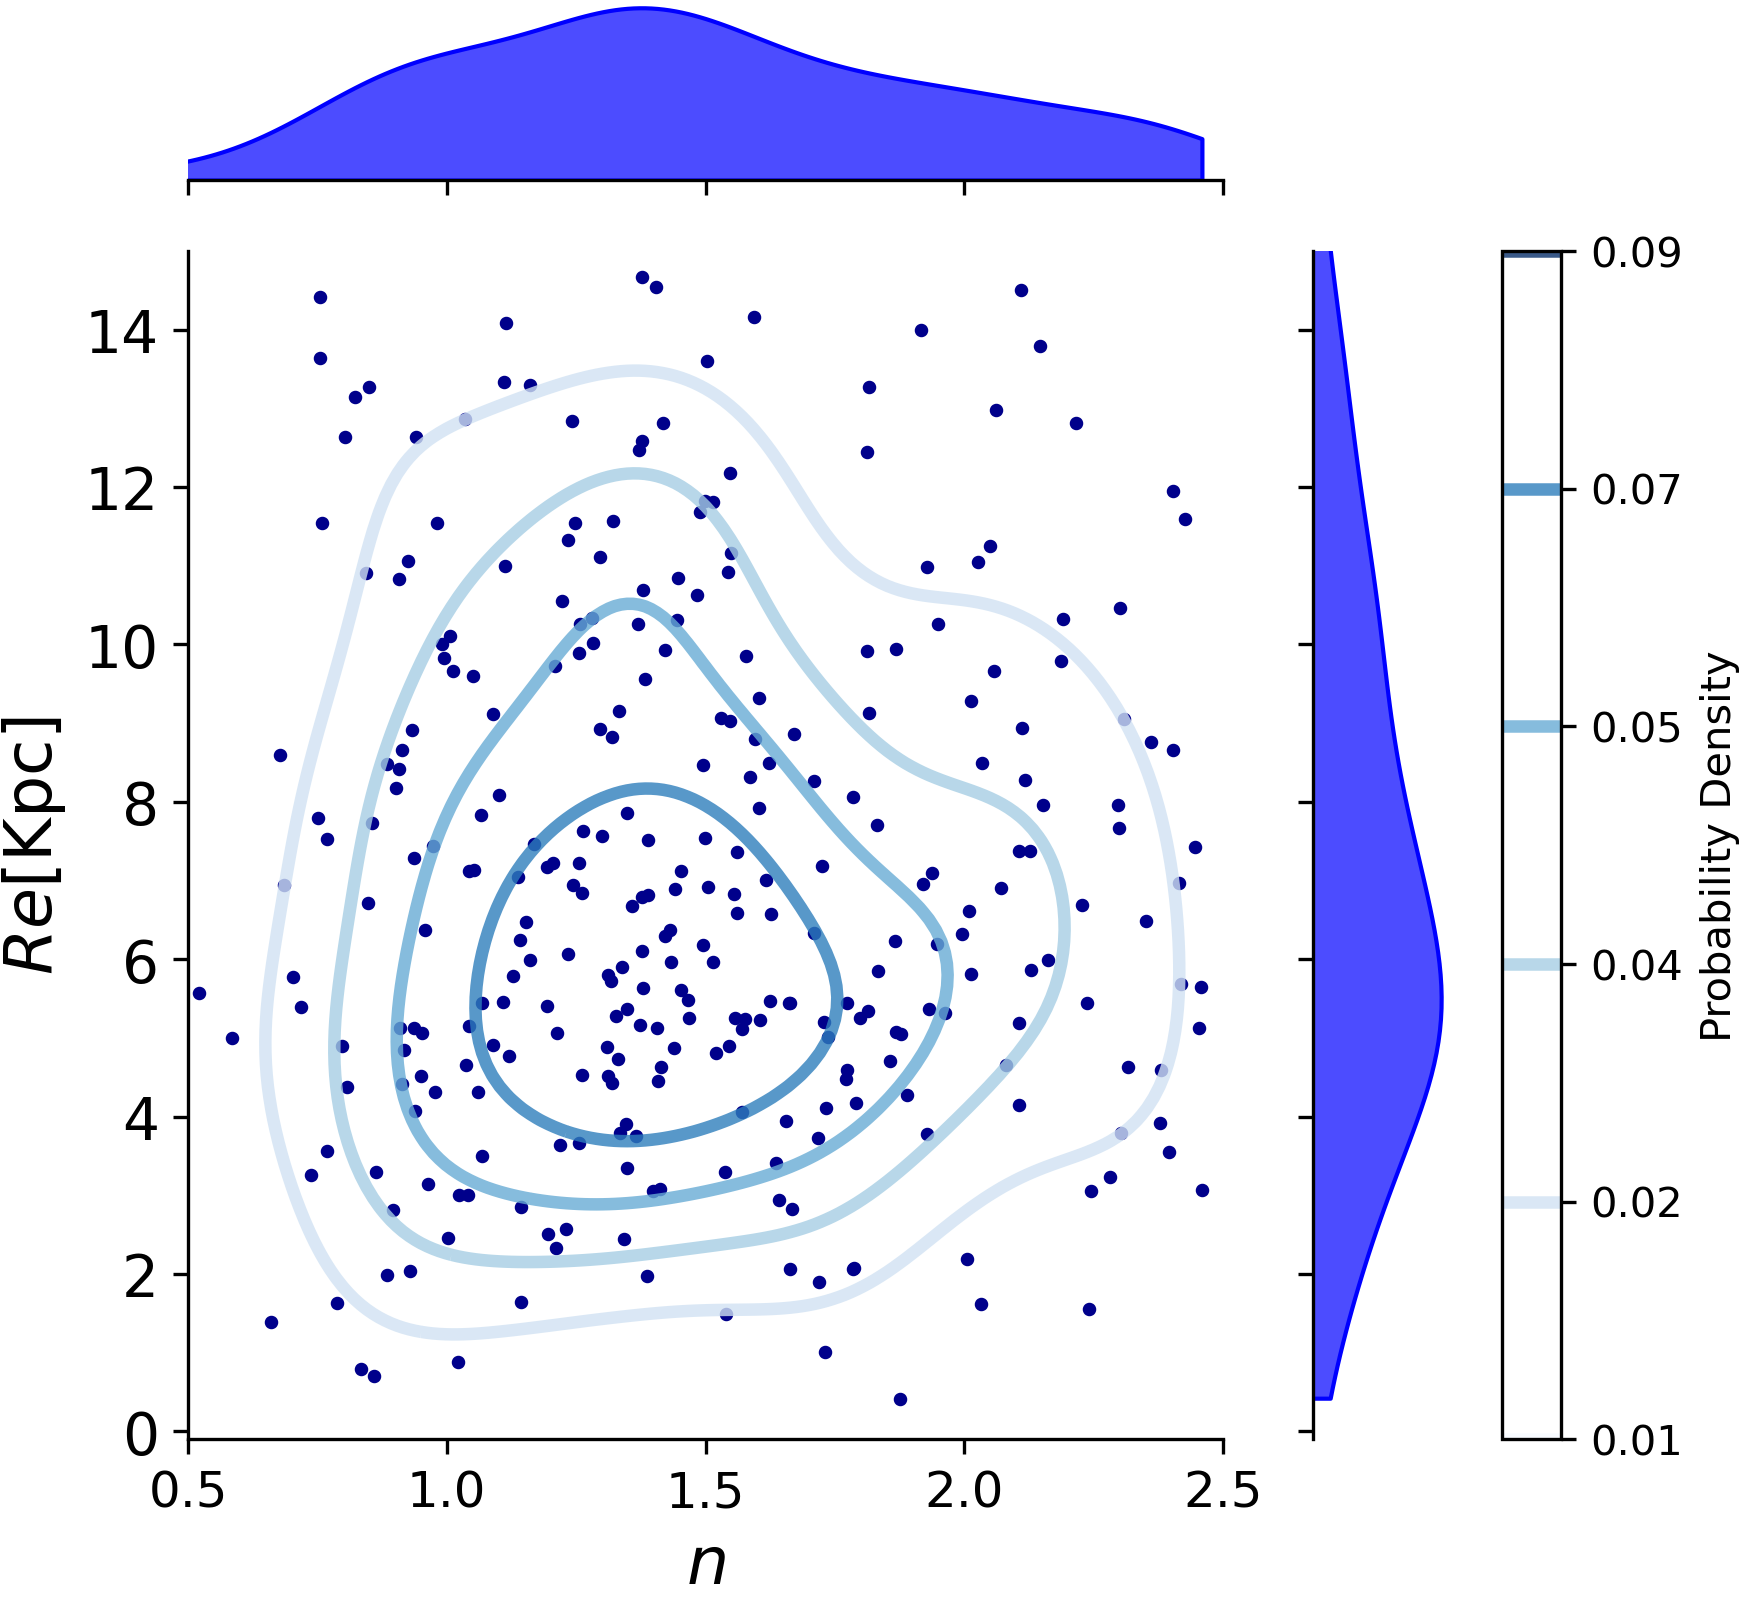
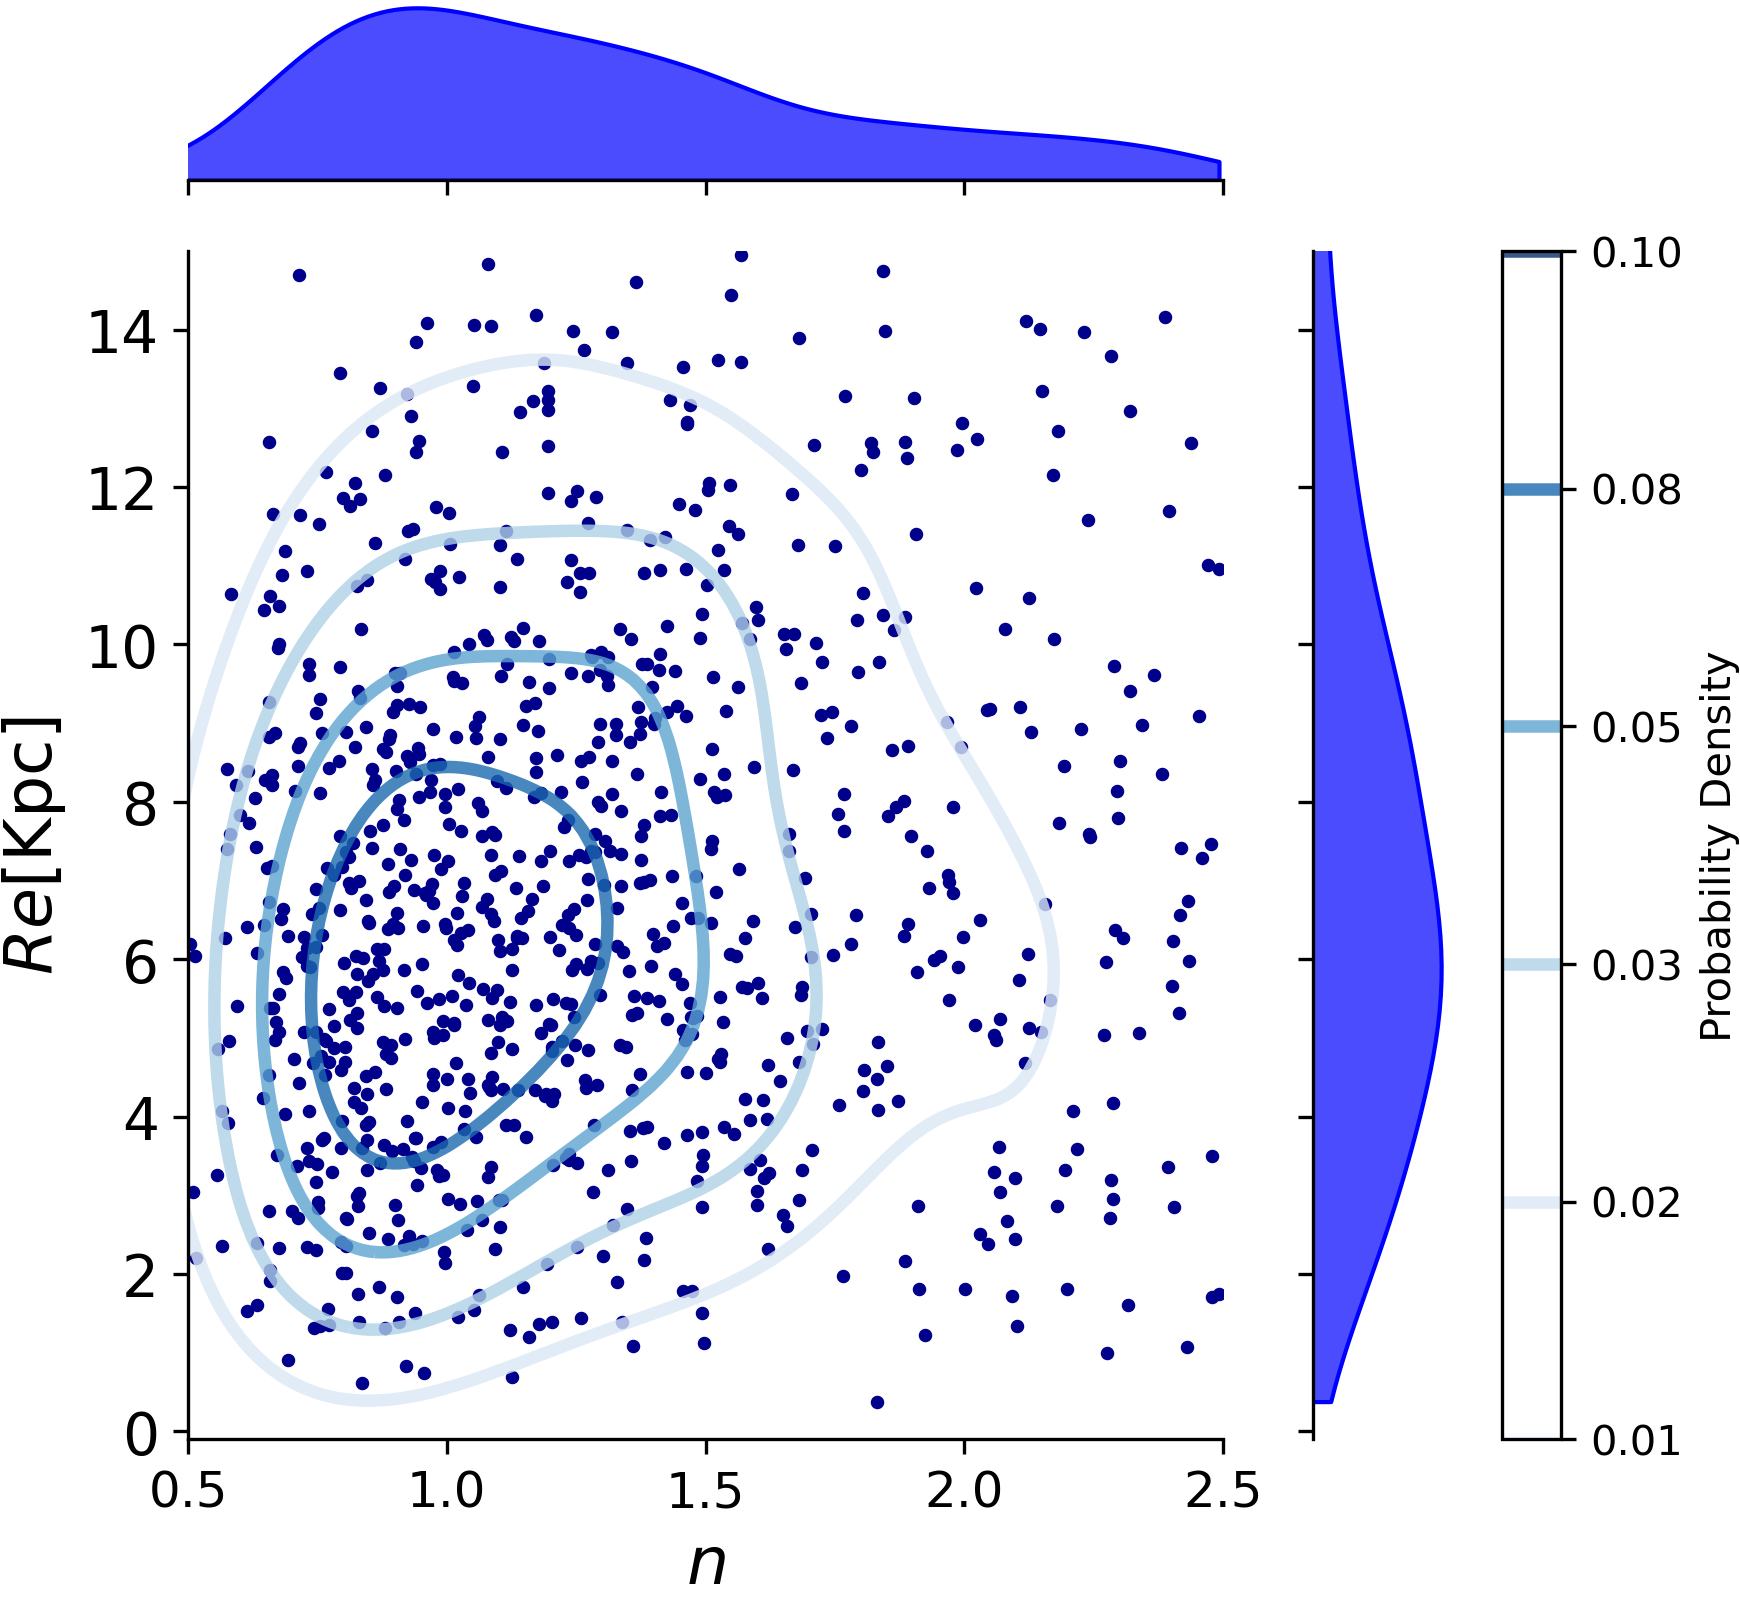
In Montaguth et al. (2023), we discovered a bimodality in the distribution in the plane for transition galaxies in CGs. There we found a population of peculiar galaxies that are more concentrated (larger ) and smaller (lower ) compared to transition galaxies in the control sample. As stated above, previous studies have shown that there is a strong relationship in CGs between the galaxy morphology and the velocity dispersion (Hickson et al. 1988, Coziol et al. 2004), such that CGs with a high-velocity dispersion contain fewer LTGs, which we also found in this work (see Figure 3). This morphology-velocity dispersion relationship is more important in CGs than in cluster or loose groups (Mamon 1986). Additionally, the velocity dispersion is a good proxy of the group’s mass. For this reason, Figure 4 shows the as a function of for transition galaxies in CGs. The top left panel shows transition galaxies in CGs with velocity dispersions between . The top right panel shows galaxies in CGs with velocity dispersions ranging between . For comparison, the bottom left panel shows transition galaxies for all CGs. Finally, the bottom right panel shows transition galaxies in the control sample. We note that we choose a cut in given that it is the typical velocity dispersion of CGs (Hickson 1982). To create these contour plots, we employed a Kernel Density Estimator to aid in visualizing the distribution of our data. Consequently, the colours of the contours represent the joint probability density of . We observe that transition galaxies within CGs, with velocity dispersions () lower than do not exhibit a bimodal distribution in . However, we note that the contours extend to values greater than in , corresponding to the region where the peculiar galaxy population is found in this diagram. The bimodal distribution in the plane becomes evident for CGs with . Furthermore, the marginal plot for reveals a higher fraction of galaxies with , accounting for of the galaxies. This suggests that the process of morphological transformation accelerates in CGs with velocity dispersions exceeding , as observed in this range for the peculiar population, which have already undergone morphological transformation. Conversely, at velocities lower than , galaxies may be undergoing transformation by increasing their Sérsic index slowly and becoming more spheroidal in shape. Another scenario that might contribute to the increase in Sérsic index for galaxies in the low velocity dispersion bin involves galaxies that are merging. However, it is important to highlight that the merger rate is not expected to be high, as it has been reported to be around 7% (Zepf 1993). A similar analysis with LTGs, considering the same two bins of as above and plotting the contours as a function of , is shown in Figure 5. In this case, we observe that as the velocity dispersion of the CGs increases, the distribution of does not change; in both bins the contours extend up to values of in .
| intervals [] | Percentage of ETGs | Percentage of transition galaxies | Percentage of LTGs |
|---|---|---|---|
| 0-200 (175) | |||
| 200-800 (165) |
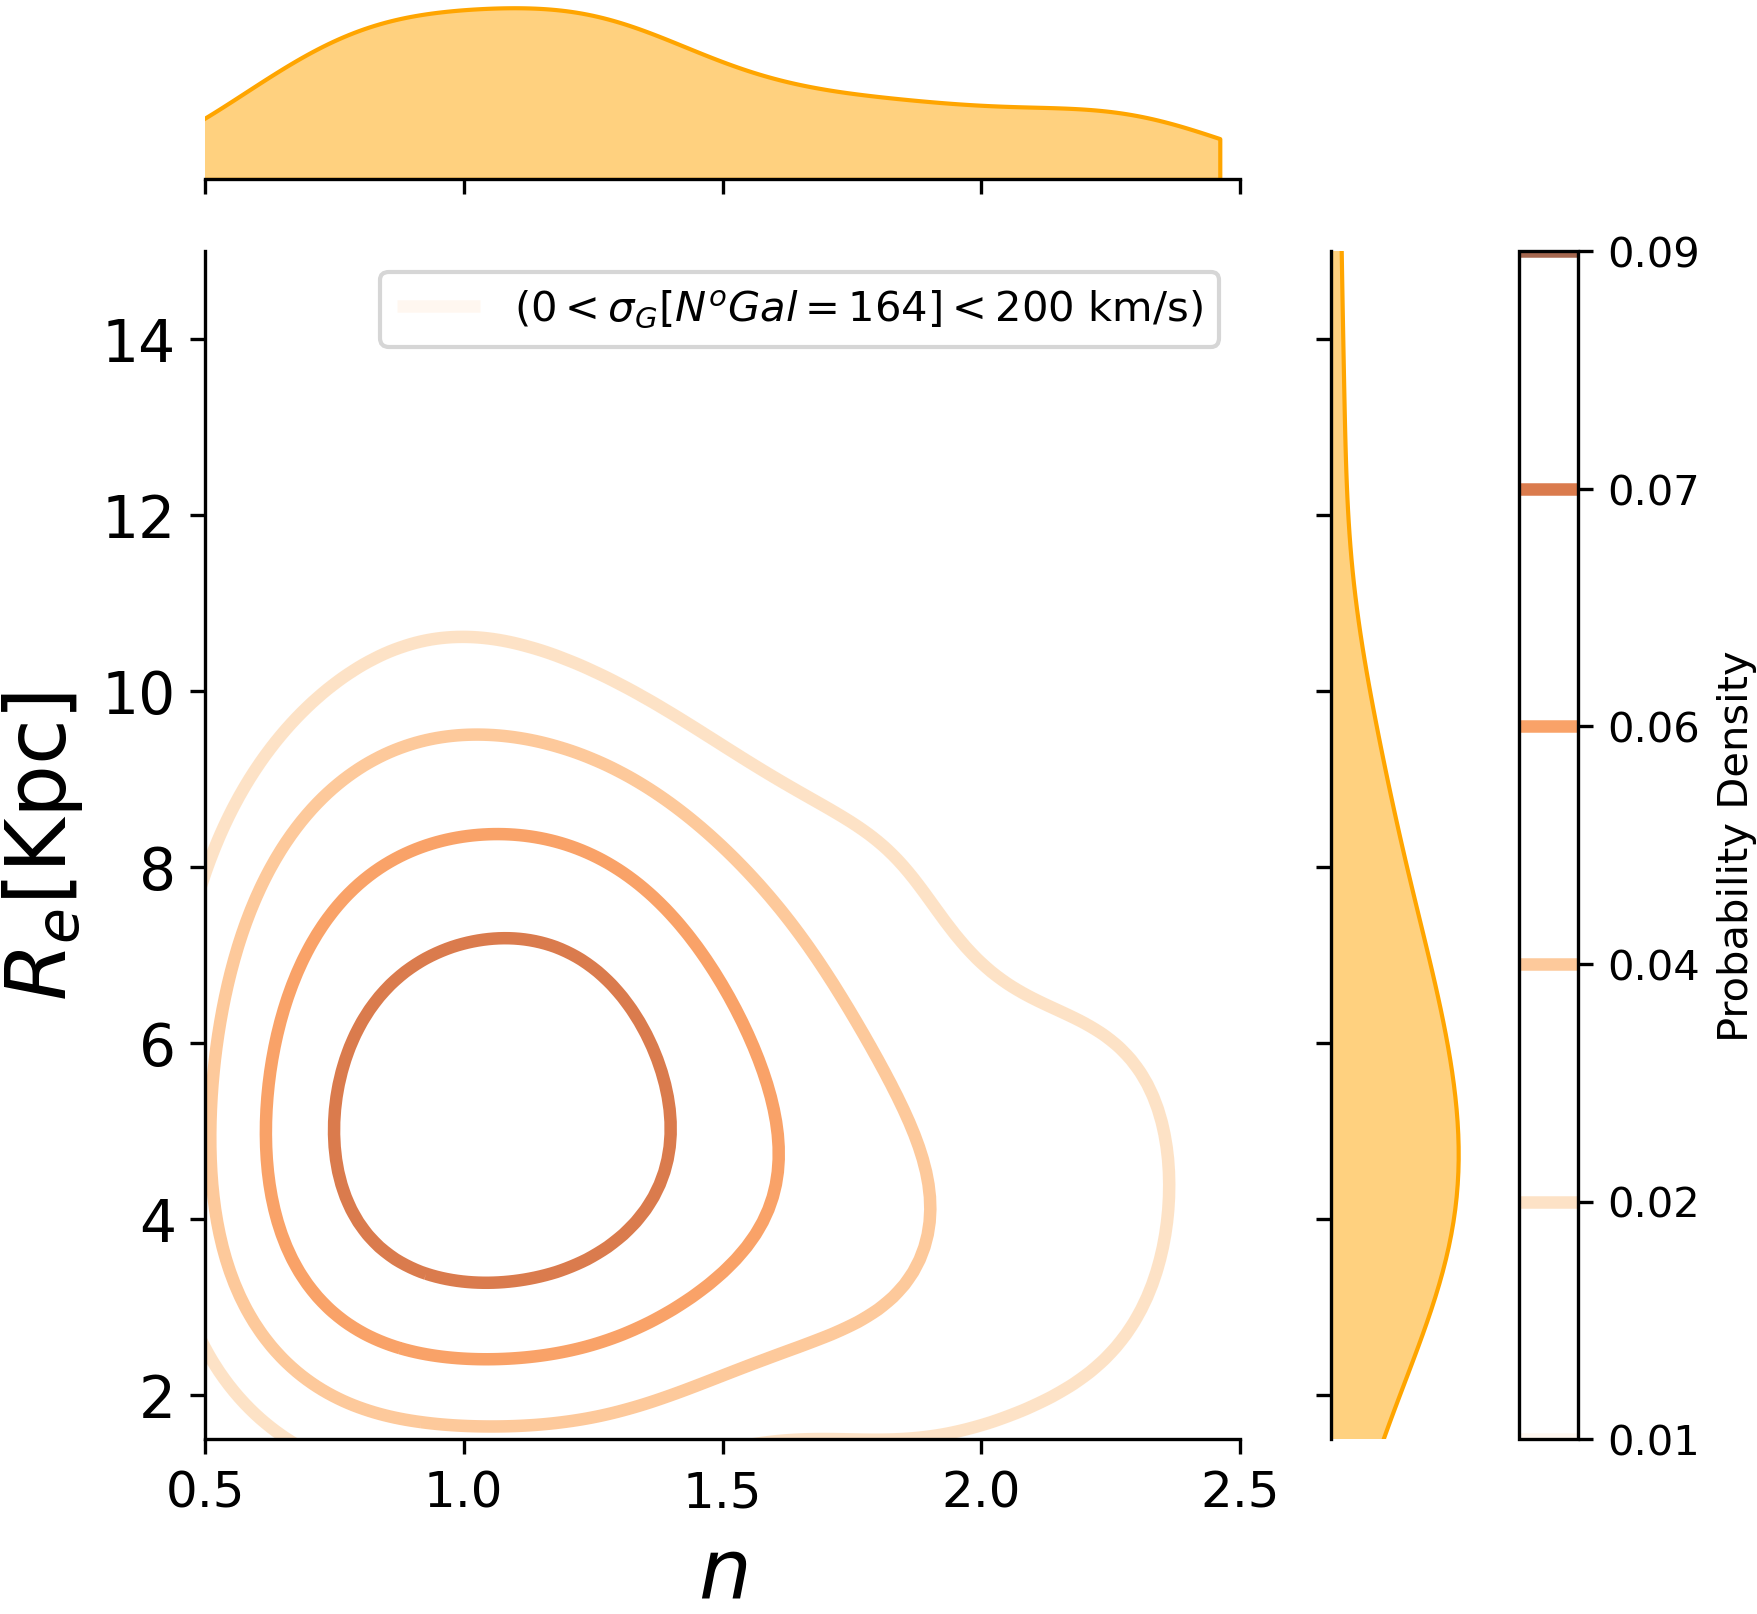
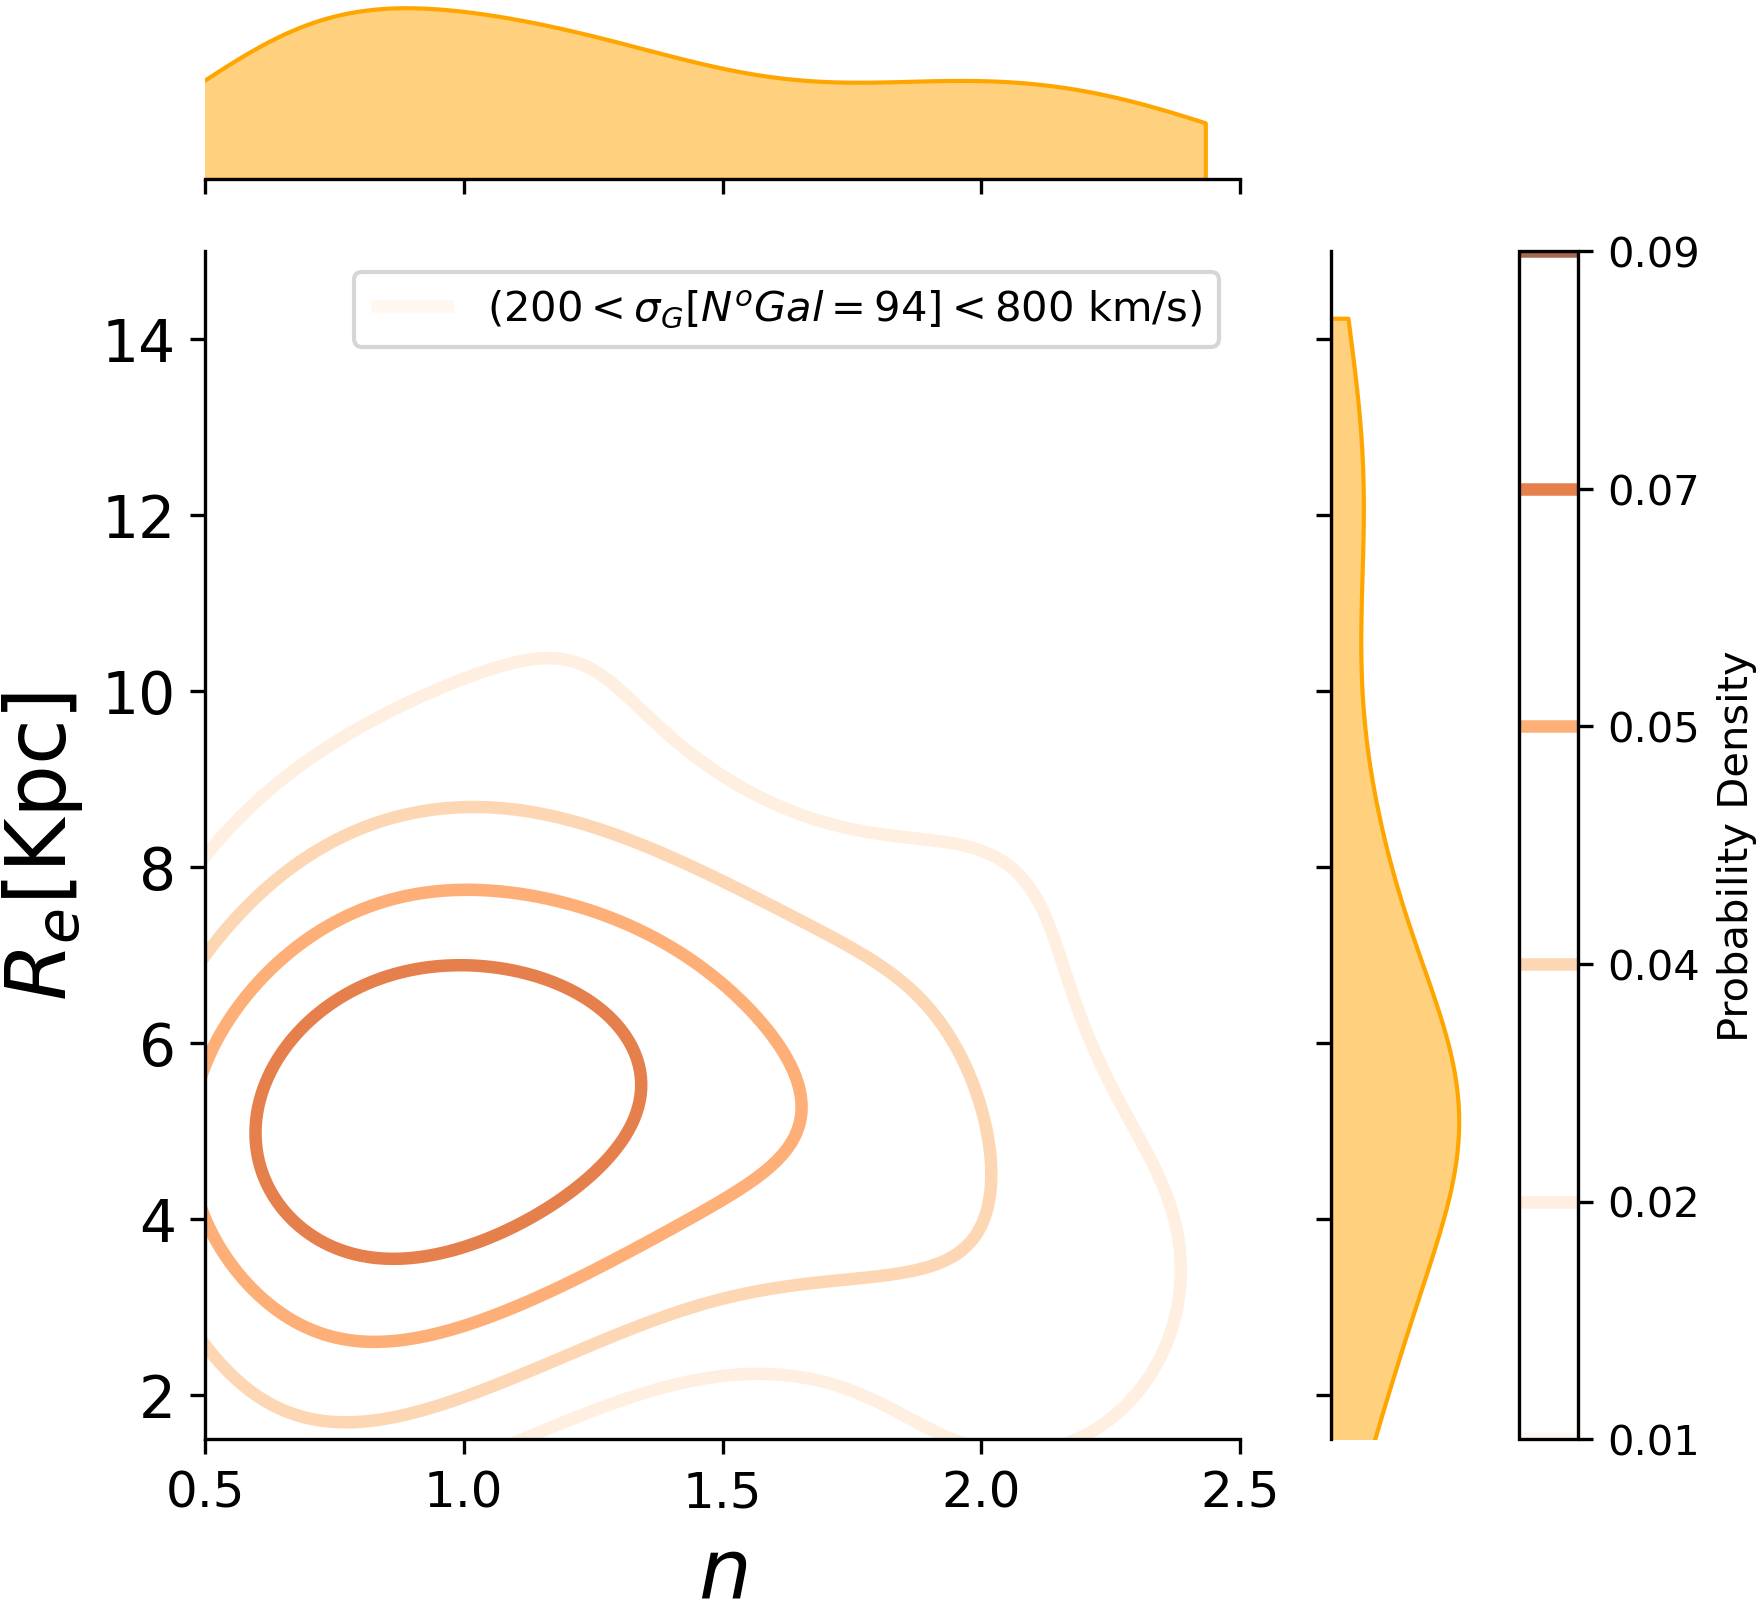
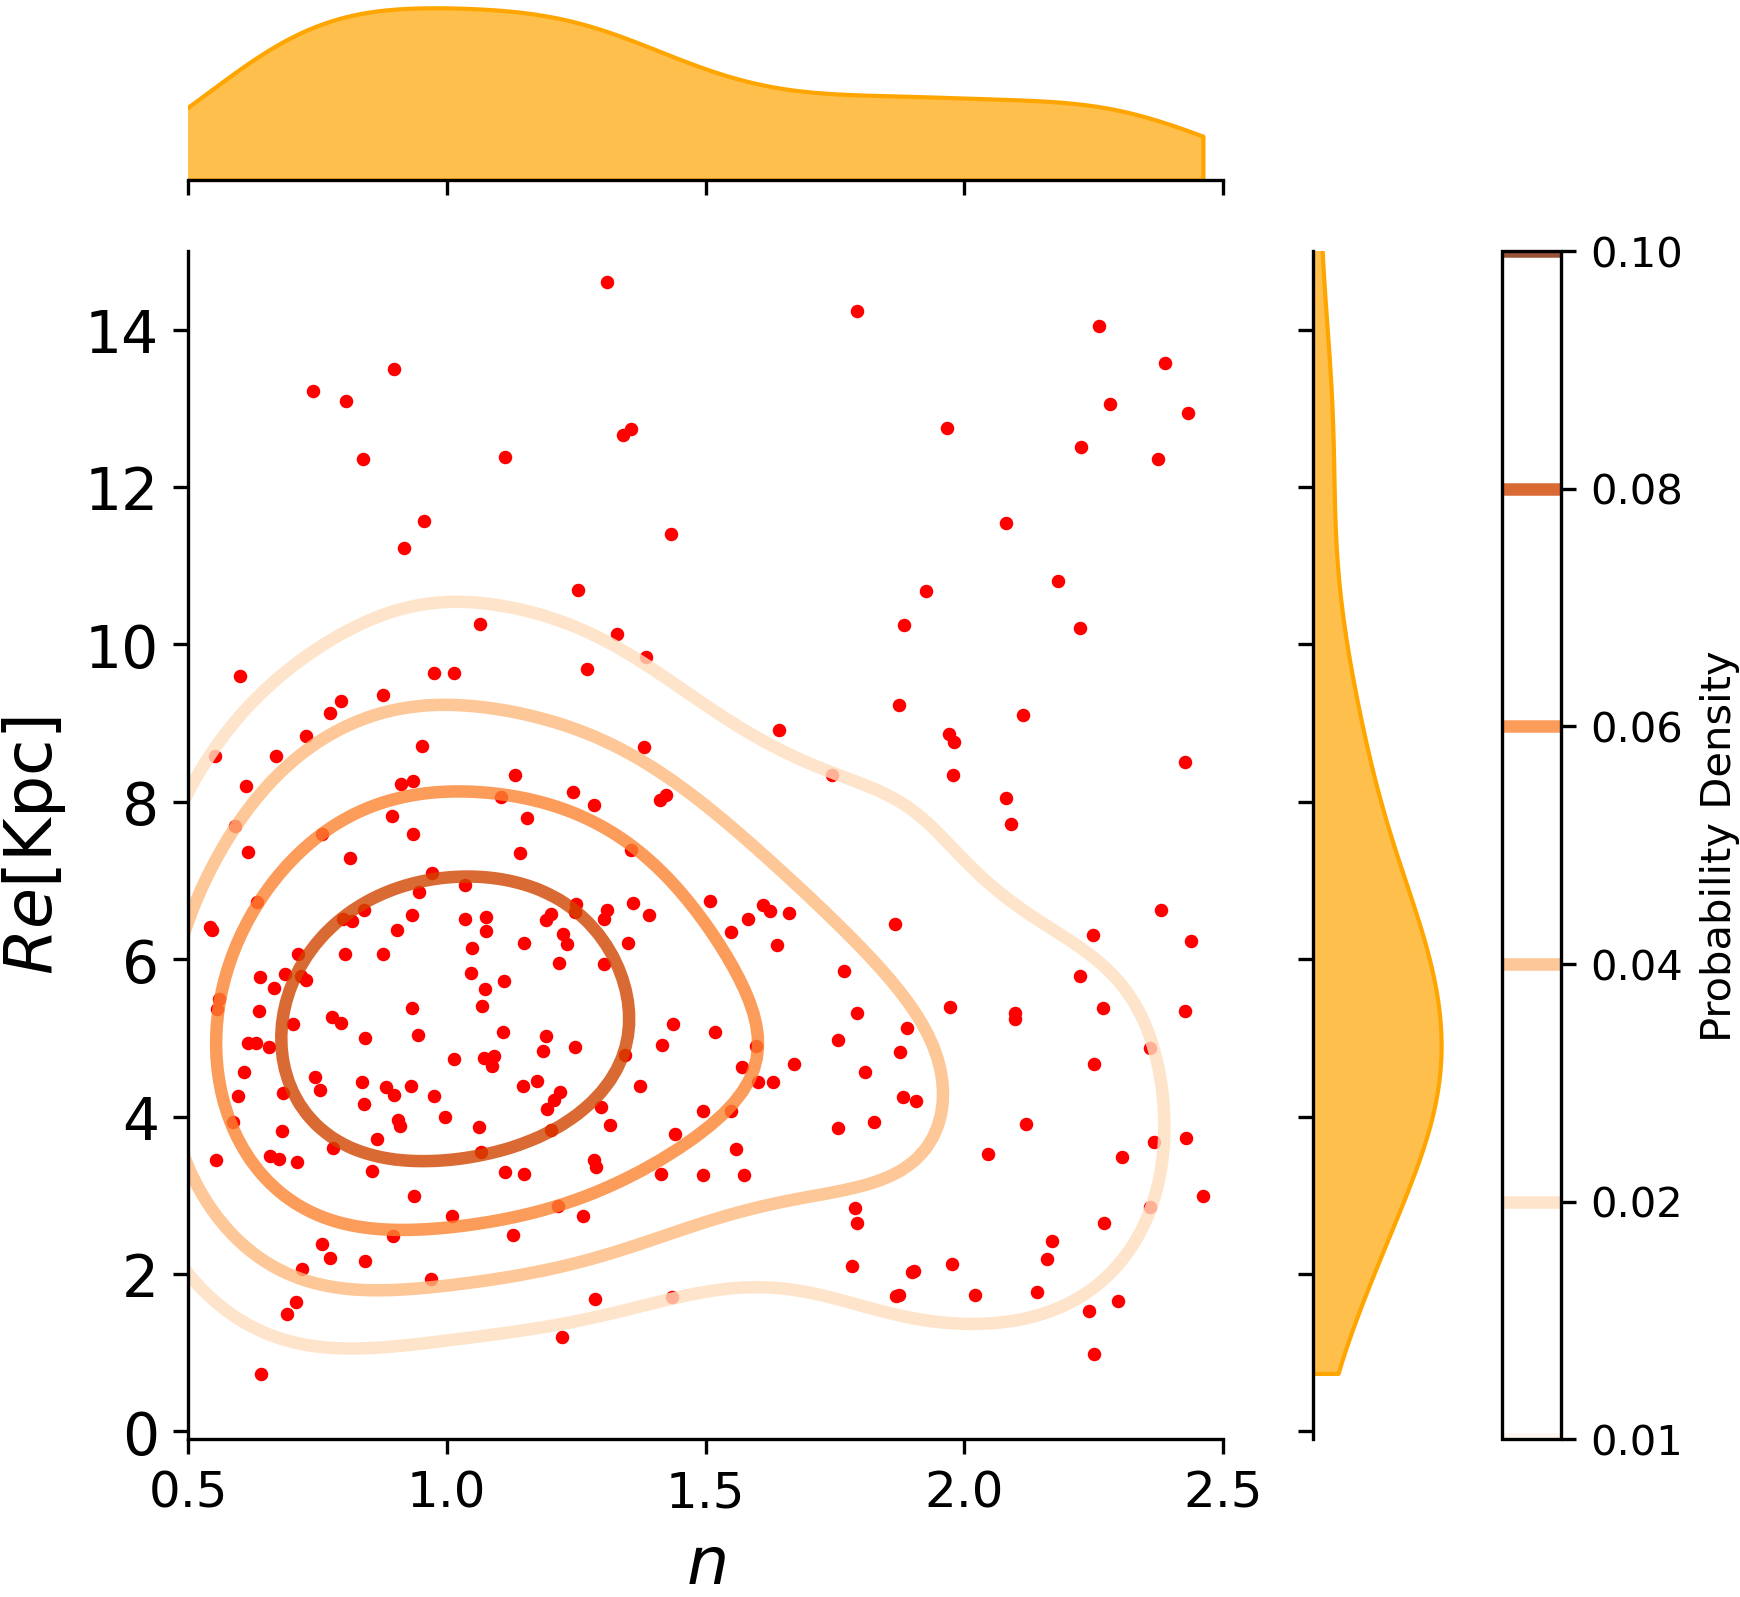
In Table 1, we illustrate the percentage of each morphological type according to each sigma bin. The percentage of LTGs decreases in CGs with higher dispersion velocities, while the percentage of ETGs increases. For transition galaxies, the percentage is similar in both ranges.
4.3 The surrounding environment of CGs in our sample
We explore the environment of our CGs sample in the Yang et al. (2007) catalogue, in agreement with the methodology followed by Zheng & Shen (2021). In this catalogue the structures are classified based on the halo-based group method, which employs an iterative approach to estimate the mass of the group. In short, it starts by estimating the luminosity and centre of each group using the Friends-Of-Friends (FOF) algorithm (Davis et al. 1985). Then, it calculates the average mass-to-light ratios of the groups, initially assuming for the first iteration, where represents the luminosity of all group members with and . Subsequent iterations use ratios from the previous step. This mass estimation is used to derive the size and velocity dispersion of the hosting halo, with the halo size determined by the radius where the average mass density is 180 times that of the Universe’s average density at a given redshift. These parameters are then used to determine group membership in redshift space, and if a new member is identified, the process iterates to reevaluate the group’s centre and other parameters. Therefore Yang et al. (2007) used a different criterion to select the groups in their sample, which is not biased by the isolation and compactness criteria used to select the CGs by Sohn et al. (2016) and Zheng & Shen (2020).
We select all the groups and galaxies in the Stripe 82 that are included in the catalogue by Yang et al. (2007) and perform a cross-match between the right ascension and declination positions of the galaxies in Yang et al.’s groups and the galaxies in our sample of CGs. From this cross-match, we identify the IDs of the groups included in Yang et al. (2007) that had at least one galaxy that, according to our catalogue, is a galaxy in a CG. Using these group IDs, we selected all the galaxies that belong to the groups found by Yang et al. (2007). We find that CGs that we have in our sample are identified as belonging to structures studied by Yang et al. (2007), which corresponds to of our sample. From these CGs, are located in major structures (groups and clusters) or have satellite galaxies beyond three times the radii of the CG and we will call these CGs as non-isolated from now on. This corresponds to 27% of the 340 CGs originally selected in this study. This fraction of non-isolated CGs is what is also found in other studies (ranging from to from a given sample of CGs are non-isolated, e.g., Barton et al. 1998, Andernach & Coziol 2005, Díaz-Giménez & Zandivarez 2015, Zheng & Shen 2021). From the that is left out of the 226, of the CGs share the same members in both Yang et al. (2007) and our catalogue. Adopting Zheng & Shen (2021)’s terminology, we name these systems as isolated CGs. Indeed, there are no additional galaxies detected by Yang within their when compared to the galaxies in our catalogue of those CGs. The remaining 25% of CGs identified by Yang et al. (2007) involve fewer galaxies than in our sample. This difference is likely attributed to the velocity selection criteria applied by Zheng & Shen (2020), which potentially overestimates the number of CG members. To summarize, we find that out of 226 CGs that also were identified by Yang et al. (2007), 35% of them are isolated, and 40% are non-isolated. In the following two subsections, we consider only the galaxies in this 75% of the 226 CGs, which corresponds to a total of 170 CGs.
We found that of non-isolated CGs have lower than ; have between , and have greater than . Therefore, of the non-isolated CGs have a higher velocity dispersion than the average typically attributed to CGs, which is (Hickson et al. 1992). It is important to consider this result because, as we have presented, there is a relationship between the morphology and dynamics of CGs (see Figure 3). Additionally, Zheng & Shen (2021) and Taverna et al. (2023), found that the velocity dispersion of the CG increases with the density of the environment in which it is located, as it will be discussed in section 5.2. This might suggest that these non-isolated CGs have recently fallen into these larger structures or are not dynamically individual subsystems but are more likely the result of chance alignments within larger systems. In the case of the first hypothesis Zheng & Shen (2021) find that the embedded CGs in the outer parts of major structures are dynamically colder than the galaxies in the major structures. This suggests that these external CGs might, at least, consist of recently accreted groups. This is because it is expected that after the first pericentric passage, the group will disassemble and virialize, especially in structures like clusters (Benavides et al. 2020, Haggar et al. 2022). In the second scenario, Mamon (1986) and Zheng & Shen (2021) suggest that CGs in the inner parts of major structures could be dominated by chance alignments. In addition, simulations show that between of CGs are chance alignments within larger groups (Taverna et al. 2022, Hartsuiker & Ploeckinger 2020).These percentages vary depending on the assumed cosmology and the definition of CGs, as in some studies only those with four or more galaxies are considered, while in others also CGs with three members are considered. Additionally, Tzanavaris et al. (2014) propose that CGs are chance alignments in poor groups.
4.4 Morphogical transformation: Isolated vs. non-isolated CGs
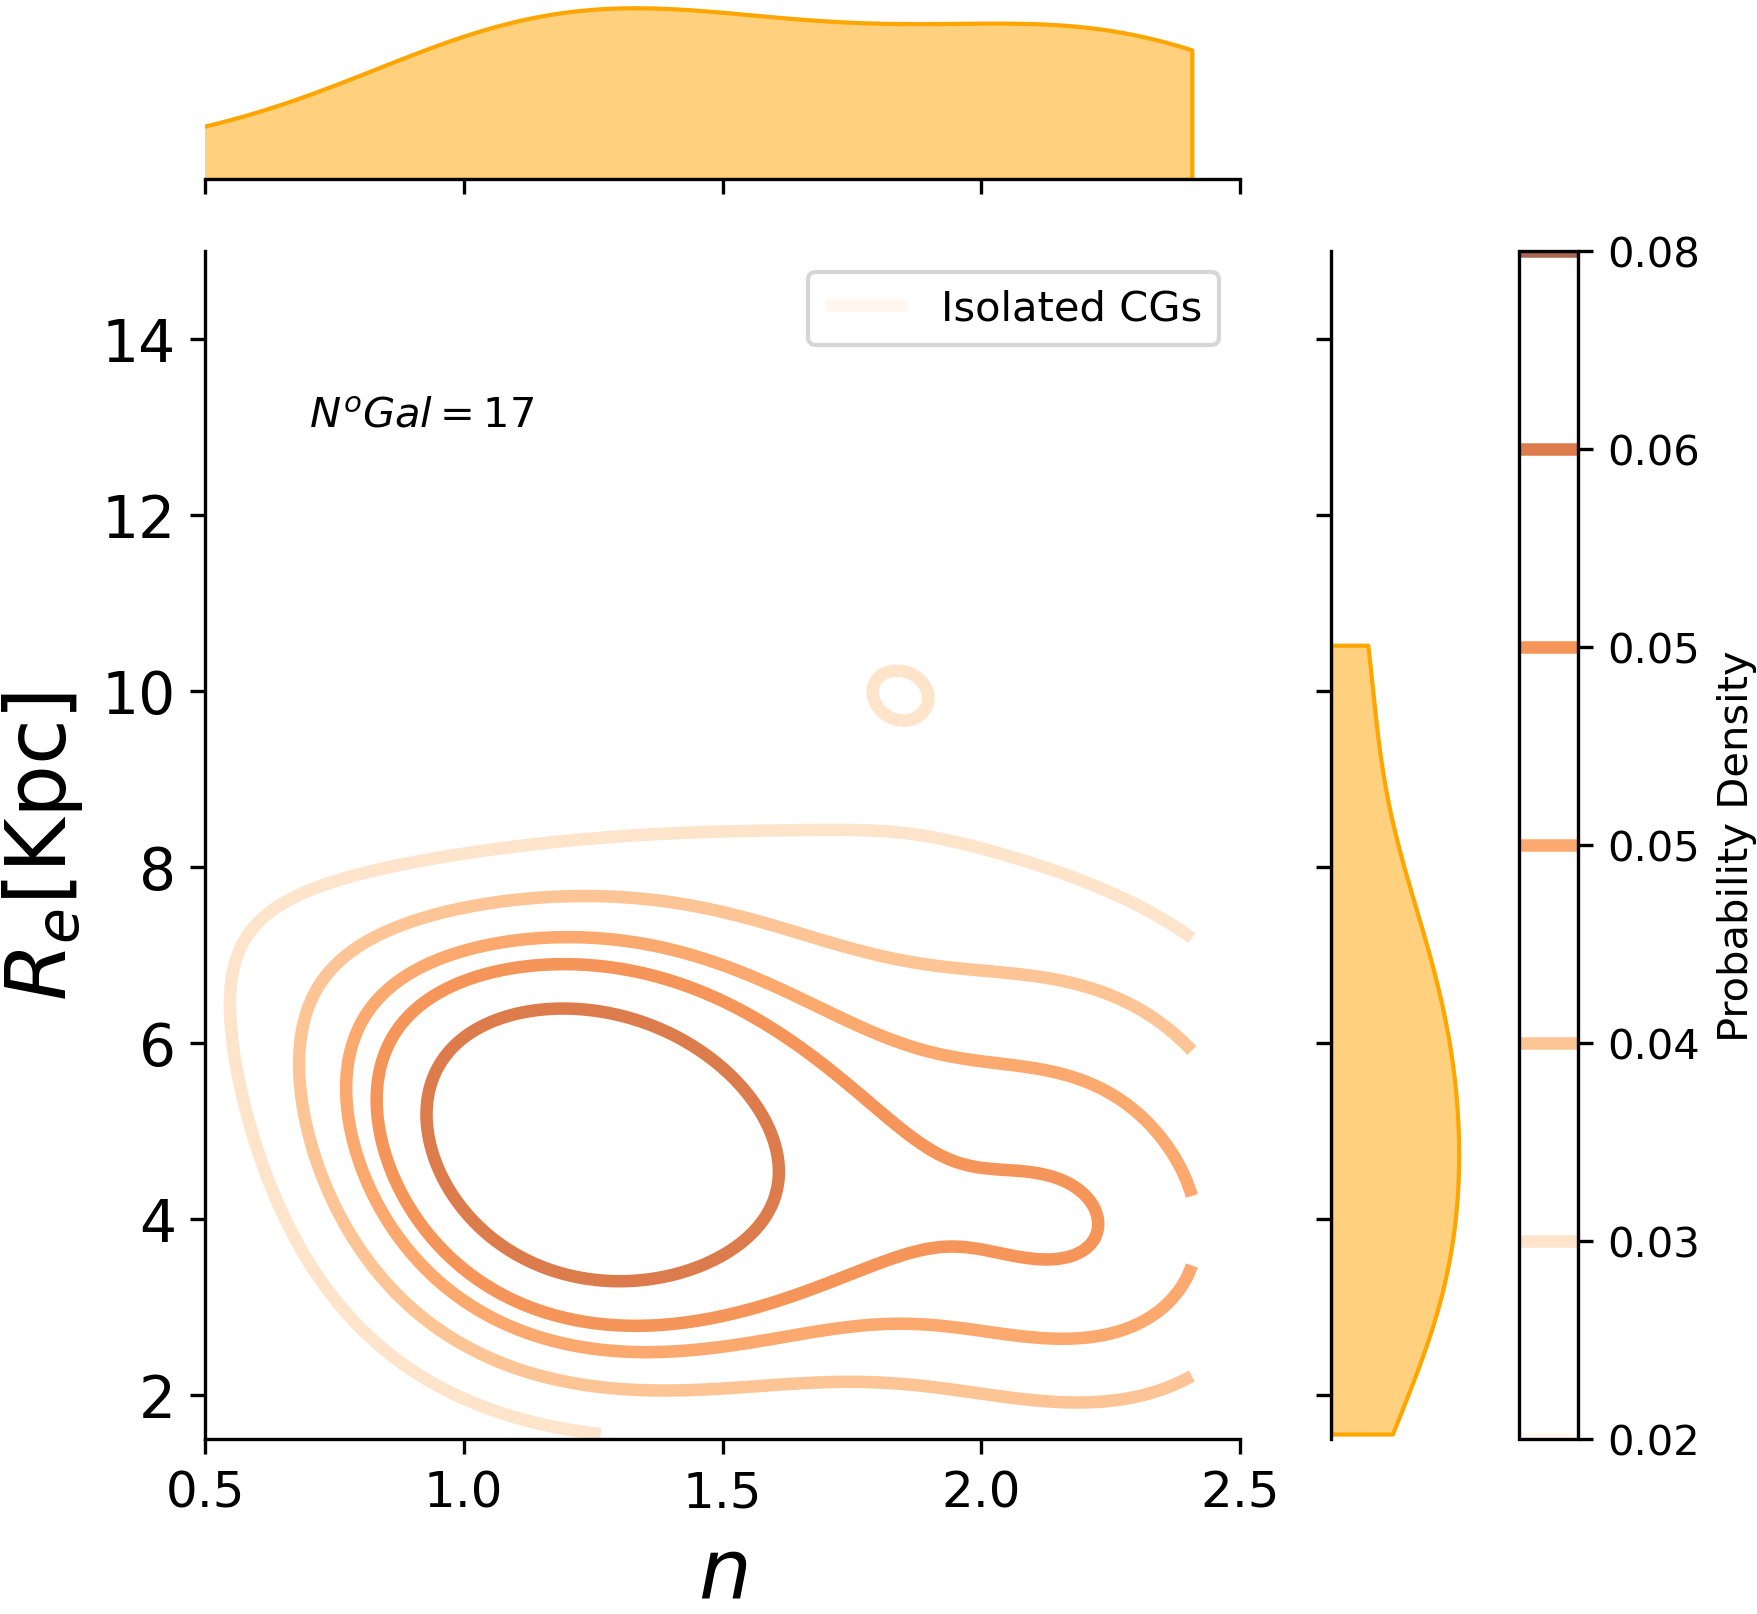
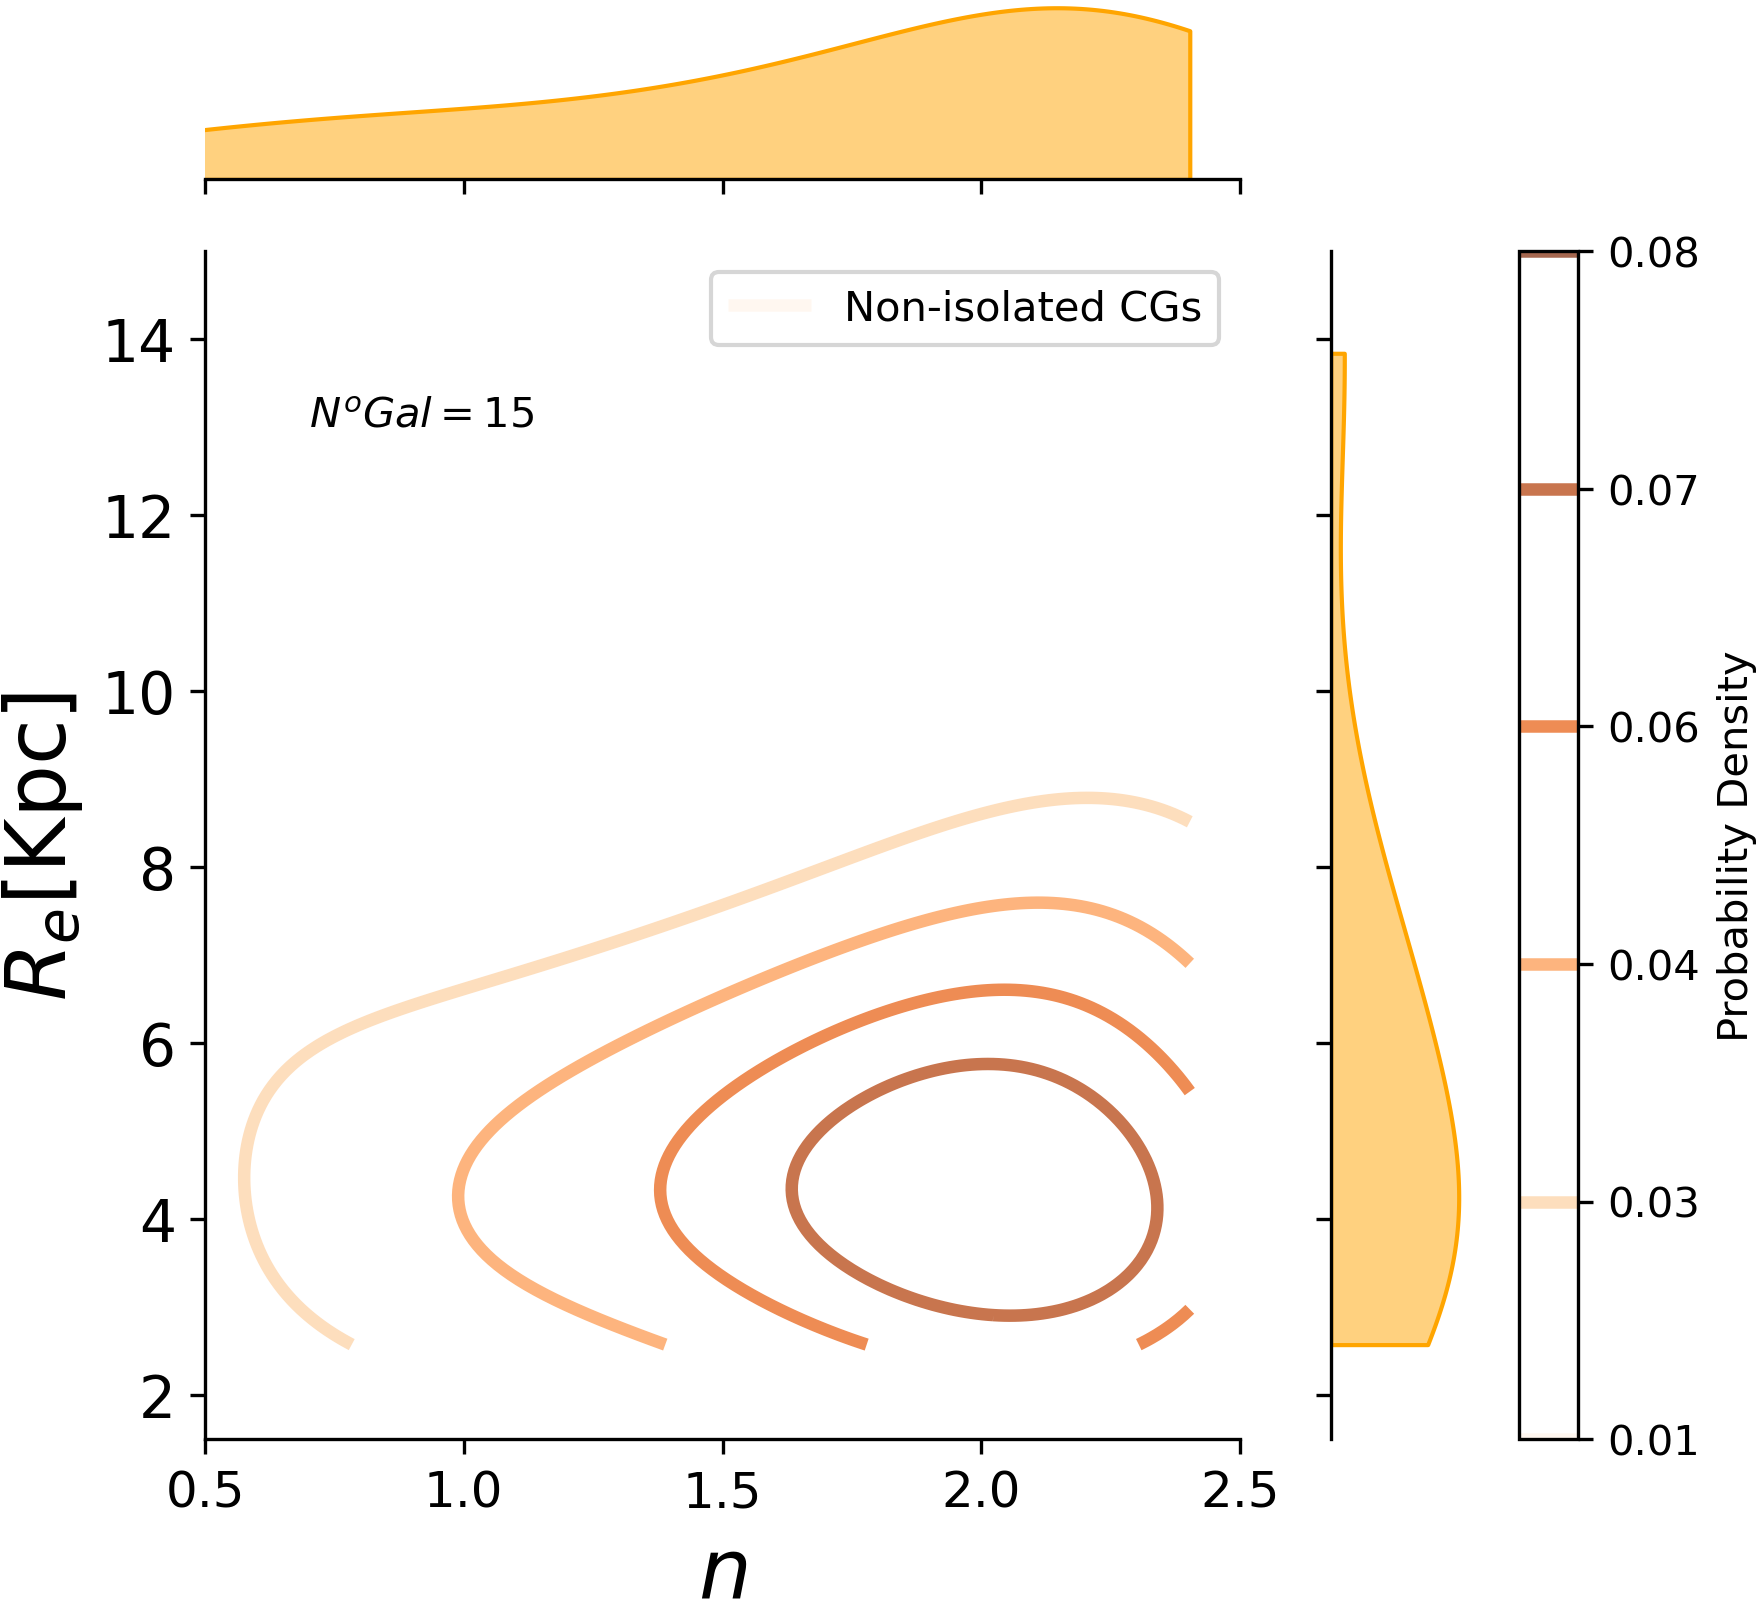
Figure 6 shows the effective radius as a function of the Sérsic index for transition galaxies in CGs in each environment (top for isolated GCs and bottom for non-isolated CGs). For transition galaxies in isolated CGs we do not find the bimodal distribution in the plane that we observed for all transition galaxies (see bottom left panel in Figure 4). In fact, we observe that there is a high density in the plane for . However, the contours for isolated CGs tend to stretch towards higher values of and lower values of , where we find the population of peculiar galaxies within CGs. In the case of the distribution of non-isolated CGs (see bottom panel of Figure 6), we also do not observe the bimodality seen in all the transition galaxies in the plane. Instead, the values are already higher, reaching the values of the peculiar galaxies population, i.e., . This finding suggests that the morphological transformation process appears to be more gradual in isolated CGs, whereas non-isolated CGs significantly populate the region of peculiar galaxies. This indicates that for most transition galaxies, the morphological transformation in non-isolated CGs has already occurred. Although it is important to note that Figure 6 should not be directly compared with Figure 4, because the first contains a subset of all the galaxies shown in Figure 4.
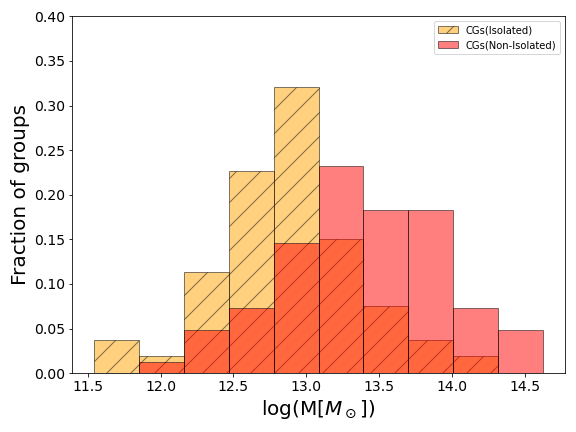
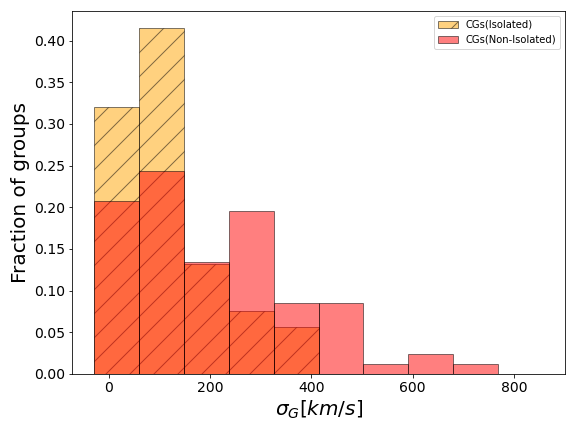
In Figure 7, we show the fraction of groups where the CGs are located as a function of total stellar mass estimated by Yang et al. (2007) (top panel). In yellow, we show isolated CGs, and in orange, the non-isolated ones. Isolated CGs have lower mass distributions, while non-isolated CGs reach higher values. This implies that group mass is crucial for accelerating the morphological transformations observed in non-isolated CGs. In the next section, we will discuss the impact of these masses on the cessation of the SFR. We also present the fraction of CGs as a function of the velocity dispersion of each CG (bottom panel in Figure 7), following the same color pattern. We find that isolated CGs have typically lower values of , while non-isolated ones reach higher values. Only 27% of isolated CGs reach greater than , while there are 55% of non-isolated CGs with velocity dispersion exceeding .
4.5 sSFR: Isolated and Non-isolated CGs vs. less dense environment
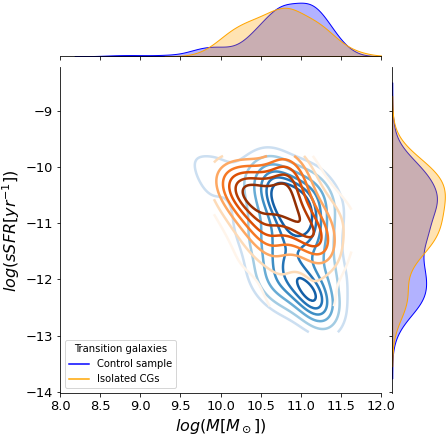
To investigate the influence of the CG environment on the sSFR distribution, in Figure 8 we show the sSFR as a function of stellar mass. In the top panels, we show the distribution of galaxies in isolated CGs as orange contours, for each population: ETGs, transition galaxies, and LTGs from left to right panels, while the control sample galaxies are depicted by blue contours. In the lower panels, the orange contours illustrate the distribution of galaxies in non-isolated CGs.
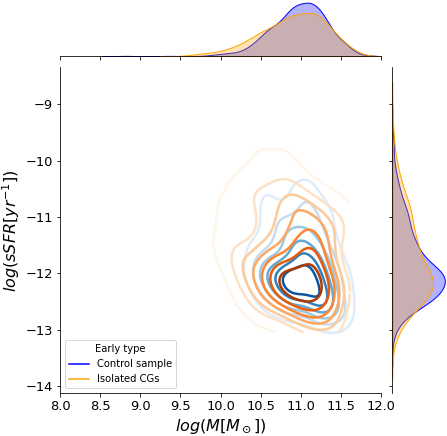
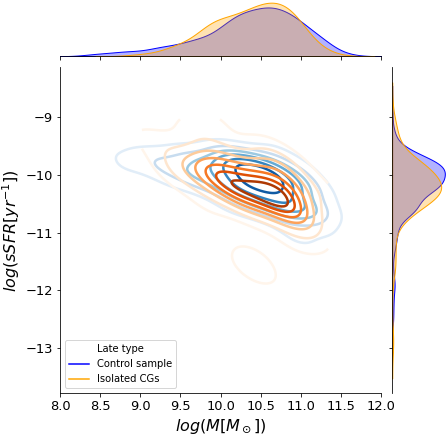
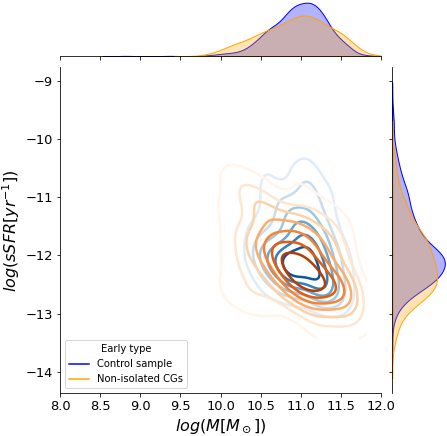
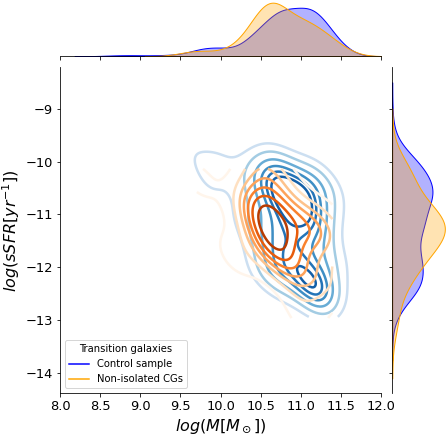
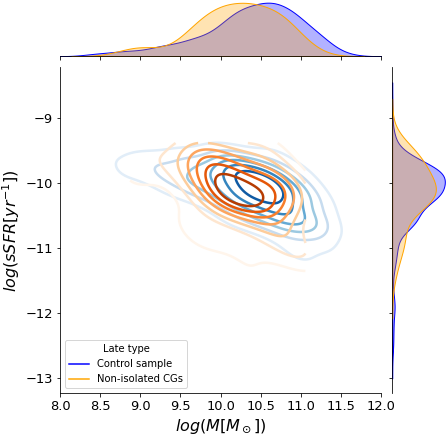
In the upper-left plot of Figure 8, we can see that for ETGs in isolated CGs compared to the control sample, there is no difference in sSFR as a function of mass. For transition galaxies, a clear bimodality is observed for the control sample, as shown in the upper middle panel of Figure 8. However, for transition galaxies in CGs, the bimodality is not as evident, though there is a subtle bimodality in the sSFR histogram. Meanwhile, LTGs in isolated CGs show a peak with a lower sSFR value compared to the distribution of the control sample, as seen in the upper right plot of Figure 8.
In the case of non-isolated CGs (bottom panels of Figure 8), the ETGs reach slightly lower values of sSFR compared to the control sample, as seen in the left panel. For transition galaxies in non-isolated CGs, the bimodality observed in isolated CGs is no longer present, and the distribution is unimodal with a peak in the middle of the bimodality observed for the control sample, as seen in the middle panel. The distribution of sSFR for LTGs in non-isolated CGs is wider than the corresponding distribution for galaxies in the control sample.
To assess the statistical significance of these visual differences in the sSFR distribution across various morphological types when comparing the two environments mentioned in previous paragraphs, we present in Table 2 the median of for each population in both isolated and non-isolated CGs. We find that the median of sSFR is lower in non-isolated CGs compared with isolated CGs except for the LTGs which are similar.
The corresponding p-value obtained from a Kolmogorov-Smirnov (KS) test (An 1933, Smirnov 1948) is shown in Table 2. This test will be used to determine whether the sSFR distribution in isolated CGs (p-value indicated outside the parentheses) or non-isolated CGs (values within parentheses) matches the distribution seen in the control sample.
Based on the KS test, we find that the sSFR distribution of LTGs located in isolated CGs shows no significant difference with the control sample. However, the distribution differs for non-isolated CGs compared with the control sample. For ETGs and transition galaxies, the sSFR distributions do not differ for isolated and non-isolate CGs with respect to the control sample distribution.
In Table 2, the percentage of quenched galaxies in isolated and non-isolated CGs is also shown, where we consider a galaxy to be quenched if , based on the criterion proposed by Wetzel et al. (2013). However, we would like to emphasize that this value is close to the value that defined the bimodality observed in transition galaxies in the control sample (see Figure 8), which is . To estimate this value, we fitted two Gaussians and took the point where they intersect. This value can be used to define when a galaxy is quenched, but we selected the Wetzel et al. (2013) criterion to ensure comparability with other studies. Non-isolated CGs have a higher percentage of quenched galaxies for ETGs and transition galaxies compared to the isolated CGs, and this difference is particularly more significant for transition galaxies. Simulations indicate that galaxies tend to enter a quenched state preferentially in structures with masses ranging from to (Pallero et al. 2019). This mass range is close to the peak of the mass distribution of non-isolated CGs, as we can observe in Figure 7. For LTGs, there is no difference in the fraction of quenched galaxies between isolated and non-isolated CGs.
| Quenched galaxies | |||||
|---|---|---|---|---|---|
| Median for isolated CGs | Median for non-isolated CGs | Isolated CGs | Non-isolated CGs | ||
| ETG | 0.27 () | ||||
| TG | 0.09 (0.18) | ||||
| LTG | 0.14 (0.59) | ||||
5 Discussion
In this study, we examine the morphology characteristics ( and ) and sSFR of galaxies within a sample of CGs, selected using the catalogues by Sohn et al. (2016) and Zheng & Shen (2020). This sample is then subdivided into isolated and non-isolated CGs, following the analysis done by Yang et al. (2007). We explore how these properties change based on the environment in which the CGs are situated. Our findings reveal notable differences between isolated and non-isolated CGs, particularly in the population of ETGs and transition galaxies, where non-isolated CGs exhibit lower sSFR and a higher fraction of quenched galaxies and more compact and concentrated transition galaxies. In the following section, we delve deeper into our results, comparing them with other studies, and propose an evolutionary scenario based on these observational outcomes.
5.1 Can the environment of the CGs influence a physical transformation?
In Montaguth et al. (2023) we compared the same sample of CGs analysed in this work with a control field sample, and suggested that environmental effects lead to a higher proportion of quenched galaxies and a lower median sSFR in CGs. This indicates a cessation of star formation, regardless of galaxy type, where a possible explanation for these differences could be tidal interactions, shocks, and turbulence (Alatalo et al. 2015, Bitsakis et al. 2016), for the specific sample that we studied in that work. In this work, we find that both isolated CGs and non-isolated CGs have higher fractions of quenched galaxies compared to the control sample, and that this fraction is higher for non-isolated CGs with respect to the isolated counterpart. For isolated CGs, the mechanism that likely contributes to their higher fraction of quenched galaxies compared to the field is tidal interactions, which can produce neutral gas loss and heating, enriching the intra-group medium. Additionally, we find that there are statistically significant differences in the distribution of sSFR between the control sample and the CGs, but only for LTGs in non-isolated CGs (see Section 4.5). In the case of non-isolated CGs a possible scenario is that galaxies may experience different mechanisms depending on the mass of the group they belong to, resulting in this higher percentage of quenched galaxies. For non-isolated CGs located in low-mass structures, galaxy interactions are expected to be the main driver of transformations. However, for non-isolated CGs in more massive structures mechanisms such as ram-pressure stripping (e.g., Roberts et al. 2021) and galaxy harassment (e.g., Moore et al. 1996) are more likely to contribute to the differences observed with the KS-test for LTGs.
These non-isolated CGs exhibit higher velocity dispersions (see the bottom panel in Figure 7), resulting in smaller crossing times, which is indicative of a more dynamically evolved state compared to the isolated CGs. This dynamical difference allows us to observe a lower sSFR and a larger fraction of quenched galaxies in non-isolated CG. Thus, the physical properties of the CG galaxies are affected by interactions between galaxies within the CG and, the interaction of the CG with its surrounding environment.
5.2 Evolutionary scheme: The role of the dynamics in CGs and its connection with major structures
As presented in Section 4, there is a clear relation between the dynamics of CGs and the morphological transformation. Additionally, we find that approximately 27% of all CGs we studied are not isolated, and their surrounding environment affects in different ways the observed morphological transformation. These non-isolated CGs exhibit lower sSFR compared to their isolated counterparts. Furthermore, according to Zheng & Shen (2021), CGs embedded in larger structures exhibit a correlation between their velocity dispersion and the values displayed by its parent structure (i.e., a larger group or cluster) in which they are embedded. This relationship follows an almost one-to-one pattern for CGs with velocity dispersions less than 500 , such that as the velocity dispersion of the structures that contain the CGs increases, the velocity dispersion of the CGs also increases. However, for velocity dispersion higher than 500 , the CGs are on average 20%-40% below the one-to-one relation. Additionally, we find that 55% of the non-isolated CGs in our sample have a velocity dispersion higher than 200 , which is the average velocity dispersion of the CGs (Hickson et al. 1992). Therefore, by having the velocity dispersion of CGs we can speculate if these systems are part of larger structures. In any case, a detailed spectroscopic analysis of the CGs environment is required to fully understand their connection with larger-scale structures. It is important to note that what we call non-isolated CGs are, in fact, a mixture of embedded and predominant CGs defined by Zheng & Shen (2021). The embedded CGs are found in major structures, and the luminosity of the CG is lower than the luminosity of the other galaxies in the major structure. While predominant CGs have higher luminosity than the additional galaxies in the major structure. The correlation between the velocity dispersion of the parent group and the CGs found by Zheng & Shen (2021) is only for embedded CGs, as they did not explore the case of predominant CGs. Recently Taverna et al. (2023) studied the properties of 1368 CGs catalogued by Zandivarez et al. (2022) using SDSS DR16. They found that the velocity dispersion of the CG increases with the density of the environment in which it is located.
Combining the results from Section 4.2, we can further categorise CGs into three distinct stages, allowing us to propose an evolutionary scheme, based on the morphological characteristics of their members and the environments they inhabit. These stages allow us additionally to establish correlations with the velocity dispersion of the systems, as mentioned in Section 4.3. High values in this context may indicate a stronger association between the dynamics of CGs and the larger-scale structures they are embedded in. In Figure 9, we represent how these three stages correlate. In the first stage, there are CGs rich in LTGs, with larger crossing times, which are in an initial or less dynamical evolved state and isolated. In this stage the transition galaxies start to become smaller and more compact, appearing as a peculiar galaxy population in CGs, with respect to the control sample, in the diagram. Tidal forces pull matter out of the galaxies, which increases the amount of neutral gas in the intra-group medium. This HI gaseous component medium has been observed by several authors (e.g. Verdes-Montenegro et al. 2001, Jones et al. 2022, Cheng et al. 2023). The second stage includes CGs with a lower fraction of LTGs and smaller crossing times. Here the environment in which the CGs are located plays a relevant role in the evolution of the galaxies accelerating the transformation process that we observe in the transition galaxies, increasing the population of galaxies that characterises the CGs, that is the “peculiar” population of transition galaxies. In this stage, there is a combination of tidal effects produced by galaxy-galaxy interactions inside the CGs, and the interaction of the CG with its surrounding environment. Finally, in the last stage probably most of the transition galaxies have already suffered the morphological transformation that we observe in systems with lower . It is possible that during this stage, CGs may begin to disrupt within the major structures they inhabit.
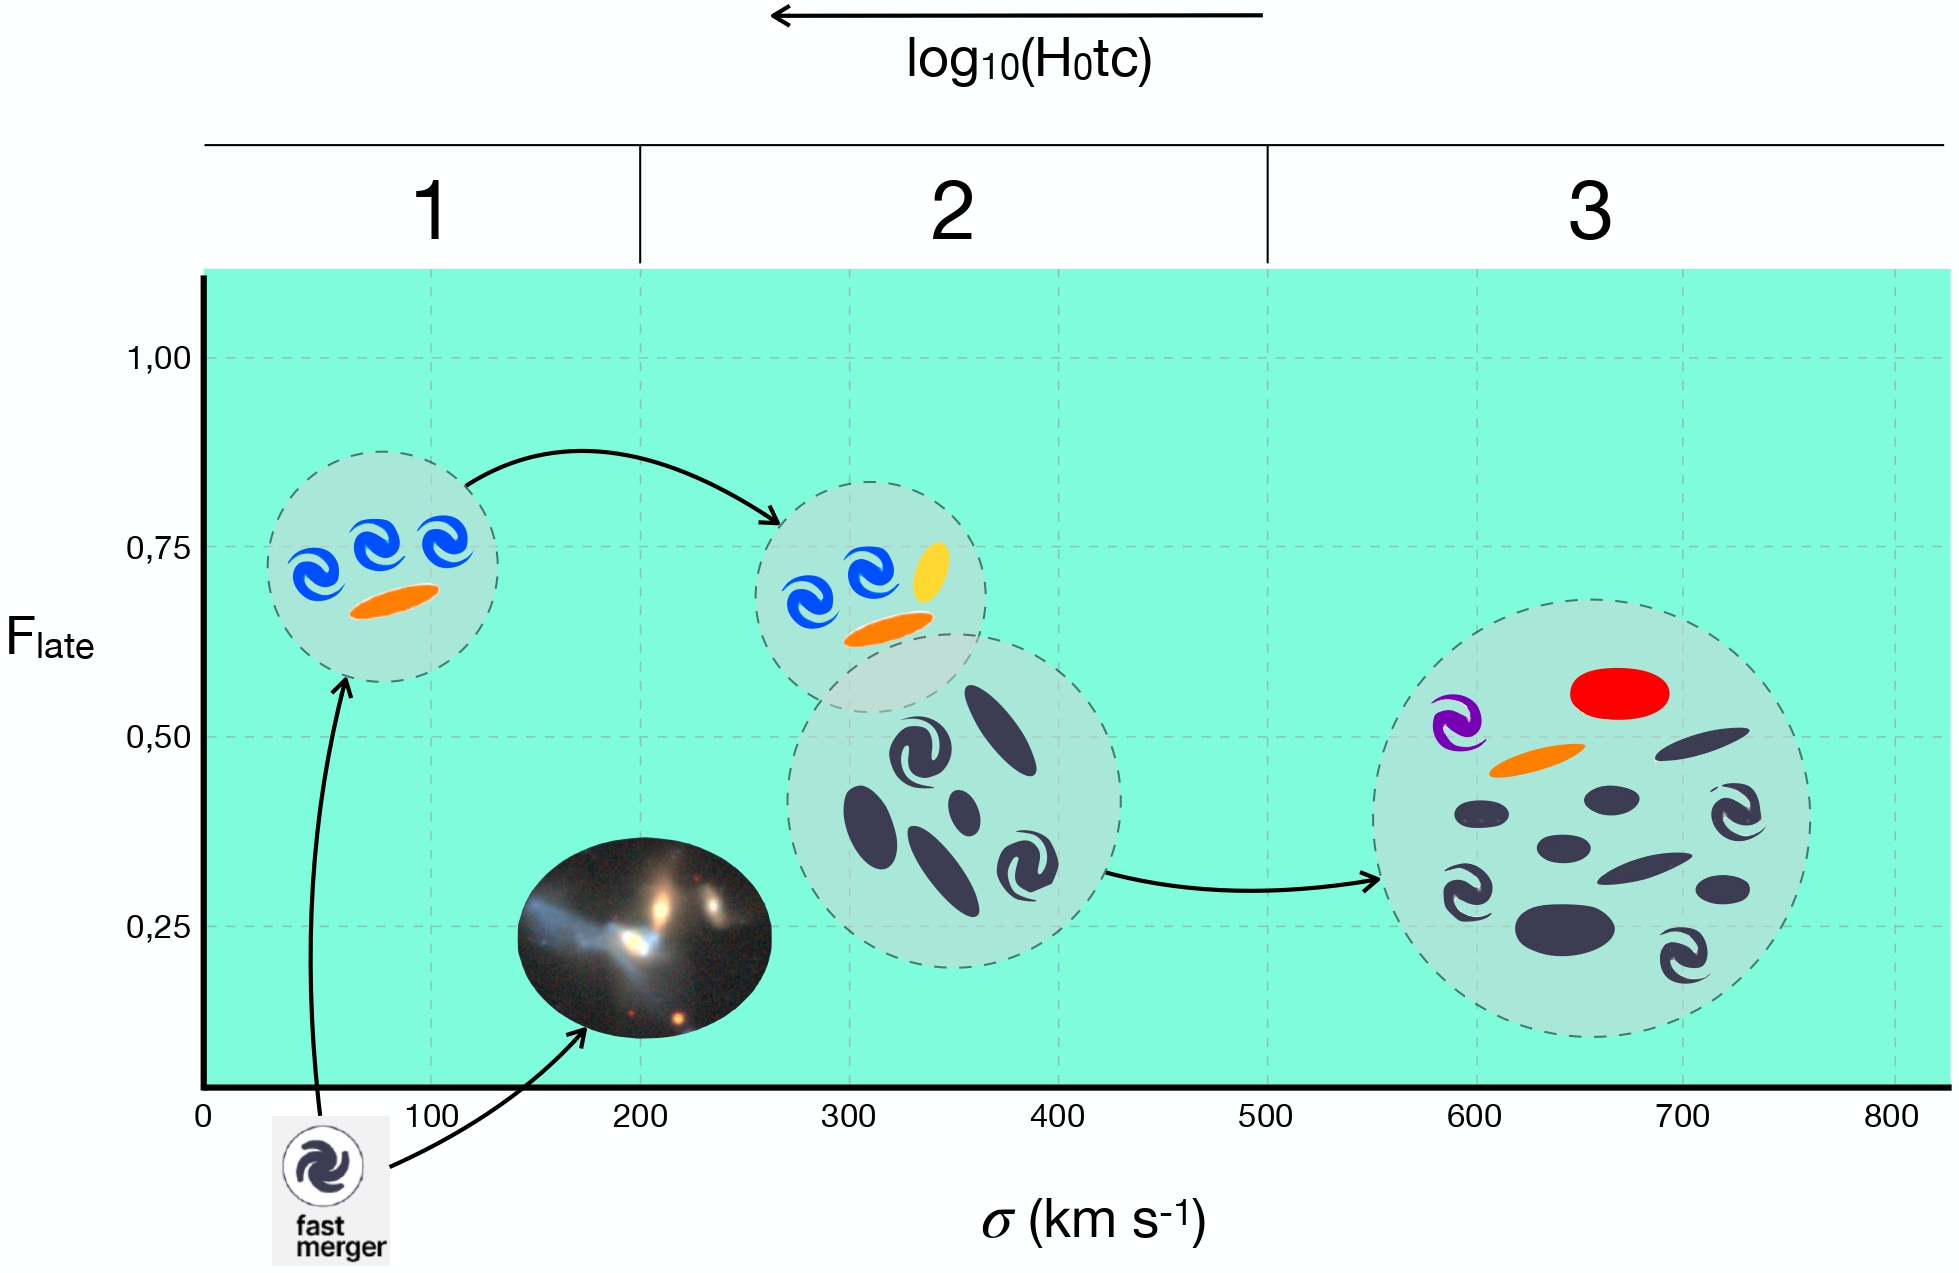
Therefore, we suggest that CGs can evolve from scenarios 1 to 3. CGs in stage 1 have three potential ways of evolving: The first one is that these CGs will merge, due to dynamical friction (Mamon 1992, Jiang et al. 2008), since the merger rate in groups is inverse to the of the group/cluster. The second one is that other groups can accrete them or they can accrete other galaxies and reach stage 2, and the third is to remain virialized depending on the mass of the halo containing it (Gómez-Flechoso & Domínguez-Tenreiro 2001). In stages 2 and 3 the CGs and their environment can be accreted by major structures, which accelerates and promotes the morphological transformation of the transition galaxies. Hence, the CGs would move from top to bottom in our scheme presented in Figure 9, decreasing the fraction of LTGs, and from left to right, increasing their velocity dispersion. The increase in velocity dispersion may be related to a growing mass of the CGs due to the accretion of galaxies or because the CGs are being accreted by other groups. In the first case, this would probably only be seen as a slight increase in velocity dispersion, while in the second case, the dynamics of the CGs would be dominated by the larger structure in which they are embedded. In both cases, in these groups, we would see the morphological transformation of their galaxies accelerated and low values in the crossing time. According to simulations, when a group falls into structures like clusters, the group becomes dynamically hotter, even though the relative velocity of the group remains, on average, lower than the galaxies in the cluster. Additionally, it is expected that after the first pericentric passage, the group will disintegrate (Bahé et al. 2019, Benavides et al. 2020, Haggar et al. 2022). Our proposed evolutionary scenario is in agreement with Coziol et al. (2004), who suggest that the formation of CGs embedded in massive structures was earlier than the formation of isolated CGs, which is also supported by Tovmassian et al. (2006). However, we note that the study done by Coziol et al. (2004) was based on a small sample of Hickson CGs, where only of CGs were isolated, the other were parts of the major structures (groups and clusters).
Our results (sections 4.4 and 4.5) support the idea that CGs could be responsible for the morphological transformation of galaxies, which is accelerated by the environment in which they are located. They are also responsible for quenching the star formation of galaxies, where the environment again plays a relevant role, by accelerating this process. An extreme example that supports this scenario is the CG falling into the Abell 1367 cluster (Blue infalling group, Cortese et al. 2006). Indeed, Cortese et al. (2006) showed that due to the combination of the effect of the tidal forces in the CG, combined with the ram-pressure of the intra-cluster medium, the galaxies of the CG fragmented, and the ionized gas was ejected, generating the HII regions that are observed close to the galaxies of the CG. Hence, the evolution of galaxies in CGs is affected both by the local environment, i.e., by the fact of being in CGs, and also by the fact that these CGs are part of major structures. This should be taken into account when analysing CGs, given that there is a complex interplay of physical phenomena occurring at both local and major scales.
6 Summary and Conclusions
This work is the second paper of a series aimed at understanding the evolution of galaxies in CGs. In this study we examine 340 compact groups (CGs) located in the Stripe 82 region selected from the catalogues published by Sohn et al. (2016) and Zheng & Shen (2020). We subdivide our sample of CGs into isolated and non-isolated, following a previous study done by Zheng & Shen (2021) and by using the catalogue published by Yang et al. (2007). Our goal is to understand the dynamics of CGs as well as how the environment surrounding them impacts the morphological and physical properties of their galaxy members. We compare our results against a sample of field galaxies, in order to determine the differences within a less dense environment. Galaxies are classified into early-type (ETG), late-type (LTG), and transition galaxies based on their Sérsic index and colour. In the following, we summarize our main findings:
-
1.
For our entire sample of CGs we confirm the existence of a correlation between the dimensionless crossing time (dynamical state) and the velocity dispersion (see Figure 2). Thus, a CG with a higher velocity dispersion, higher compactness, a lower fraction of LTGs, and lower crossing times, are dynamically more evolved than those CGs with shorter velocity dispersion, a higher fraction of LTGs, and larger crossing times.
-
2.
CGs with higher velocity dispersions exhibit a clear bimodal distribution of their transition galaxies in the plane. However, this bimodality is not clear for transition galaxies located in CGs having lower velocity dispersion CGs. This suggests an accelerated morphological transformation process in higher velocity dispersion CGs, where peculiar galaxy populations prevail. Conversely, lower velocity dispersion CGs may indicate a slower morphological transformation, possibly due to gradual changes thanks to the tidal interactions. Although we cannot rule out the scenario that mergers within the CG might also contribute to the morphological transformation. This suggests that the CG environment is ideal for studying the morphological changes that galaxies undergo.
-
3.
We find that at least of our 340 CGs are non-isolated, i.e., they are in major structures.
-
4.
We find that the non-isolated CGs have a wider range of velocity dispersion, reaching . 55% of these non-isolated CGs have velocities dispersion greater than 200 km/s. On the contrary, the isolated CGs have a narrower range, reaching , where only 27% of the isolated CGs reach . Therefore, the value of the velocity dispersion may indicate whether the CG is isolated or not.
-
5.
We find that the transition galaxies in isolated or non-isolated CGs do not follow the same bimodal distribution as all transition galaxies, but they contribute to one of the two parts of this bimodality. Indeed, for transition galaxies in isolated CGs, we find a high density in the plane for , suggesting that most of these galaxies have not yet undergone morphological transformation. In contrast, the distribution in non-isolated CGs increases smoothly towards higher values, approaching the value of the peculiar galaxy population. This indicates that the galaxies have already undergone a morphological transformation. These findings suggest that the large-scale environment where the CGs reside accelerates morphological transformation.
-
6.
We observe statistical differences in the sSFR distributions for LTGs in non-isolated CGs compared to the control sample, using a KS-test. Therefore, the distributions of LTGs in non-isolated CGs do not follow the same distribution as the control sample.
-
7.
We find that the fraction of quenched galaxies is higher for ETGs and transition galaxies in non-isolated CGs than in isolated CGs and the control sample. This indicates that larger structures favor quenching within CG galaxies, hence, the physical properties of CG galaxies are influenced by interactions among galaxies within the CG, as well as interactions between the CG and its surrounding environment.
-
8.
The results summarized above motivated us to propose an evolutionary scenario for CGs, considering their connection to major structures. In this scenario, the major structures where CGs are embedded accelerate the quenching process in CG galaxies and their morphological transformation (see Figure 9). This, subsequently, influences the CG dynamics because non-isolated CGs have higher velocity dispersions than the isolated ones, suggesting that the dynamics of non-isolated CGs are dominated by the major structure where the CGs are located.
These results add valuable evidence in support of CGs as places of galaxy transformation and evolution raising the opportunity to develop future research of the environments of CGs. We highlight with this work the importance of carrying out detailed studies of the environment in which the CGs are found in order to further understand galaxy evolution in these systems. As a follow-up, we plan to use 3D data from MaNGA (Wake et al. 2017) to study the physical and kinematic properties of some of the galaxies in our sample, in order to understand in detail the physical phenomena that are occurring in this sample of galaxies in CGs.
Acknowledgements.
G.P.M acknowledges financial support from ANID/”Beca de Doctorado Nacional”/21202024. G.P.M, A.M., F.A.G., and R.D gratefully acknowledge support by the ANID BASAL project FB210003, and funding from the Max Planck Society through a “PartnerGroup” grant. G.P.M and A.M acknowledge support by the FONDECYT Regular grant 1212046. F.A.G acknowledge support by the FONDECYT Regular grant 1211370. ST-F acknowledges the financial support of ULS/DIDULS through a regular project number PR222133. MG acknowledges support from FAPERJ grant n. E-26/211.370/2021. JAHJ acknowledges support from FAPESP, process number 2021/08920-8.SP acknowledges the financial support of the Conselho Nacional de Desenvolvimento Científico e Tecnológico (CNPq) Fellowship 300936/2023-0. DEO-R acknowledges the financial support from the Chilean National Agency for Research and Development (ANID), InES-Género project INGE210025. SP acknowledges the financial support of the Conselho Nacional de Desenvolvimento Científico e Tecnológico (CNPq) Fellowships 300936/2023-0 and 301628/2024-6. The S-PLUS project, including the T80-South robotic telescope and the S-PLUS scientific survey, was founded as a partnership between the Fundação de Amparo à Pesquisa do Estado de São Paulo (FAPESP), the Observatório Nacional (ON), the Federal University of Sergipe (UFS), and the Federal University of Santa Catarina (UFSC), with important financial and practical contributions from other collaborating institutes in Brazil, Chile (Universidad de La Serena), and Spain (Centro de Estudios de Física del Cosmos de Aragón, CEFCA). We further acknowledge financial support from the São Paulo Research Foundation (FAPESP), the Brazilian National Research Council (CNPq), the Coordination for the Improvement of Higher Education Personnel (CAPES), the Carlos Chagas Filho Rio de Janeiro State Research Foundation (FAPERJ), and the Brazilian Innovation Agency (FINEP). The authors are grateful for the contributions of CTIO staff in helping in the construction, commissioning and maintenance of the T80-South telescope and camera. We are also indebted to Rene Laporte and INPE, as well as Keith Taylor, for their important contributions to the project. We also thank CEFCA staff for their help with T80-South. Specifically, we thank Antonio Marín-Franch for his invaluable contributions in the early phases of the project, David Cristóbal-Hornillos and his team for their help with the installation of the data reduction package jype version 0.9.9, César Íñiguez for providing 2D measurements of the filter transmissions, and all other staff members for their support.References
- Abazajian et al. (2009) Abazajian, K. N., Adelman-McCarthy, J. K., Agüeros, M. A., et al. 2009, ApJS, 182, 543
- Abolfathi et al. (2018) Abolfathi, B., Aguado, D. S., Aguilar, G., et al. 2018, ApJS, 235, 42
- Alam et al. (2015) Alam, S., Albareti, F. D., Allende Prieto, C., et al. 2015, ApJS, 219, 12
- Alatalo et al. (2015) Alatalo, K., Appleton, P. N., Lisenfeld, U., et al. 2015, ApJ, 812, 117
- Almeida-Fernandes et al. (2022) Almeida-Fernandes, F., SamPedro, L., Herpich, F. R., et al. 2022, MNRAS, 511, 4590
- An (1933) An, K. 1933, Giorn Dell’inst Ital Degli Att, 4, 89
- Andernach & Coziol (2005) Andernach, H. & Coziol, R. 2005, in Astronomical Society of the Pacific Conference Series, Vol. 329, Nearby Large-Scale Structures and the Zone of Avoidance, ed. A. P. Fairall & P. A. Woudt, 67–76
- Bahé et al. (2019) Bahé, Y. M., Schaye, J., Barnes, D. J., et al. 2019, MNRAS, 485, 2287
- Bamford et al. (2011) Bamford, S. P., Häußler, B., Rojas, A., & Borch, A. 2011, in Astronomical Society of the Pacific Conference Series, Vol. 442, Astronomical Data Analysis Software and Systems XX, ed. I. N. Evans, A. Accomazzi, D. J. Mink, & A. H. Rots, 479
- Barton et al. (1998) Barton, E. J., de Carvalho, R. R., & Geller, M. J. 1998, AJ, 116, 1573
- Benavides et al. (2020) Benavides, J. A., Sales, L. V., & Abadi, M. G. 2020, Monthly Notices of the Royal Astronomical Society, 498, 3852
- Bitsakis et al. (2016) Bitsakis, T., Dultzin, D., Ciesla, L., et al. 2016, MNRAS, 459, 957
- Blanton & Roweis (2007) Blanton, M. R. & Roweis, S. 2007, AJ, 133, 734
- Cheng et al. (2023) Cheng, C., Xu, C. K., Appleton, P. N., et al. 2023, ApJ, 954, 74
- Coenda et al. (2012) Coenda, V., Muriel, H., & Martínez, H. J. 2012, A&A, 543, A119
- Cortese et al. (2006) Cortese, L., Gavazzi, G., Boselli, A., et al. 2006, A&A, 453, 847
- Coziol et al. (2004) Coziol, R., Brinks, E., & Bravo-Alfaro, H. 2004, AJ, 128, 68
- Davis et al. (1985) Davis, M., Efstathiou, G., Frenk, C. S., & White, S. D. M. 1985, ApJ, 292, 371
- Díaz-Giménez & Mamon (2010) Díaz-Giménez, E. & Mamon, G. A. 2010, MNRAS, 409, 1227
- Díaz-Giménez & Zandivarez (2015) Díaz-Giménez, E. & Zandivarez, A. 2015, A&A, 578, A61
- Diaz-Gimenez et al. (2021) Diaz-Gimenez, E., Zandivarez, A., & Mamon, G. 2021, Monthly Notices of the Royal Astronomical Society, 503, 394
- Donnari et al. (2021) Donnari, M., Pillepich, A., Nelson, D., et al. 2021, MNRAS, 506, 4760
- Eckert et al. (2014) Eckert, D., Molendi, S., Owers, M., et al. 2014, A&A, 570, A119
- Fabricant et al. (1998) Fabricant, D., Cheimets, P., Caldwell, N., & Geary, J. 1998, PASP, 110, 79
- Fujita (2004) Fujita, Y. 2004, Publications of the Astronomical Society of Japan, 56, 29
- Gallagher et al. (2008) Gallagher, S. C., Johnson, K. E., Hornschemeier, A. E., Charlton, J. C., & Hibbard, J. E. 2008, ApJ, 673, 730
- Gómez-Flechoso & Domínguez-Tenreiro (2001) Gómez-Flechoso, M. A. & Domínguez-Tenreiro, R. 2001, ApJ, 549, L187
- Gomez-Flechoso & Dominquez-Tenreiro (1997) Gomez-Flechoso, M. A. & Dominquez-Tenreiro, R. 1997, in Astronomical Society of the Pacific Conference Series, Vol. 117, Dark and Visible Matter in Galaxies and Cosmological Implications, ed. M. Persic & P. Salucci, 524
- Haggar et al. (2022) Haggar, R., Kuchner, U., Gray, M. E., et al. 2022, Monthly Notices of the Royal Astronomical Society, 518, 1316
- Haines et al. (2015) Haines, C. P., Pereira, M. J., Smith, G. P., et al. 2015, ApJ, 806, 101
- Hartsuiker & Ploeckinger (2020) Hartsuiker, L. & Ploeckinger, S. 2020, MNRAS, 491, L66
- Häußler et al. (2013) Häußler, B., Bamford, S. P., Vika, M., et al. 2013, MNRAS, 430, 330
- Hernquist et al. (1995) Hernquist, L., Katz, N., & Weinberg, D. H. 1995, ApJ, 442, 57
- Hickson (1982) Hickson, P. 1982, The Astrophysical Journal, 255, 382
- Hickson et al. (1988) Hickson, P., Kindl, E., & Huchra, J. P. 1988, ApJ, 331, 64
- Hickson et al. (1992) Hickson, P., Mendes de Oliveira, C., Huchra, J. P., & Palumbo, G. G. 1992, ApJ, 399, 353
- Jiang et al. (2008) Jiang, C. Y., Jing, Y. P., Faltenbacher, A., Lin, W. P., & Li, C. 2008, ApJ, 675, 1095
- Johnson et al. (2007) Johnson, K. E., Hibbard, J. E., Gallagher, S. C., et al. 2007, AJ, 134, 1522
- Jones et al. (2022) Jones, M. G., Verdes-Montenegro, L., Moldon, J., et al. 2022, arXiv e-prints, arXiv:2211.15687
- Lima-Dias et al. (2021) Lima-Dias, C., Monachesi, A., Torres-Flores, S., et al. 2021, MNRAS, 500, 1323
- Lima-Dias et al. (2024) Lima-Dias, C., Monachesi, A., Torres-Flores, S., et al. 2024, MNRAS, 527, 5792
- Liske et al. (2015) Liske, J., Baldry, I. K., Driver, S. P., et al. 2015, MNRAS, 452, 2087
- Lopes et al. (2024) Lopes, P. A. A., Ribeiro, A. L. B., & Brambila, D. 2024, MNRAS, 527, L19
- Luo et al. (2015) Luo, A. L., Zhao, Y.-H., Zhao, G., et al. 2015, Research in Astronomy and Astrophysics, 15, 1095
- Mamon (1986) Mamon, G. A. 1986, ApJ, 307, 426
- Mamon (1992) Mamon, G. A. 1992, ApJ, 401, L3
- Mendes de Oliveira et al. (2019) Mendes de Oliveira, C., Ribeiro, T., Schoenell, W., et al. 2019, Monthly Notices of the Royal Astronomical Society, 489, 241
- Montaguth et al. (2023) Montaguth, G. P., Torres-Flores, S., Monachesi, A., et al. 2023, Monthly Notices of the Royal Astronomical Society, 524, 5340
- Moore et al. (1996) Moore, B., Katz, N., Lake, G., Dressler, A., & Oemler, A. 1996, Nature, 379, 613
- Moura et al. (2020) Moura, T. C., de Carvalho, R. R., Rembold, S. B., et al. 2020, MNRAS, 493, 3238
- Noll et al. (2009) Noll, S., Burgarella, D., Giovannoli, E., et al. 2009, A&A, 507, 1793
- Pallero et al. (2019) Pallero, D., Gómez, F. A., Padilla, N. D., et al. 2019, MNRAS, 488, 847
- Peebles (1984) Peebles, P. J. E. 1984, ApJ, 284, 439
- Peng et al. (2002) Peng, C. Y., Ho, L. C., Impey, C. D., & Rix, H.-W. 2002, AJ, 124, 266
- Peng et al. (2010) Peng, C. Y., Ho, L. C., Impey, C. D., & Rix, H.-W. 2010, AJ, 139, 2097
- Ribeiro et al. (1998) Ribeiro, A. L. B., de Carvalho, R. R., Capelato, H. V., & Zepf, S. E. 1998, ApJ, 497, 72
- Roberts et al. (2021) Roberts, I. D., van Weeren, R. J., McGee, S. L., et al. 2021, A&A, 652, A153
- Salim et al. (2018) Salim, S., Boquien, M., & Lee, J. C. 2018, ApJ, 859, 11
- Sersic (1968) Sersic, J. L. 1968, Atlas de Galaxias Australes
- Smirnov (1948) Smirnov, N. 1948, The annals of mathematical statistics, 19, 279
- Sohn et al. (2016) Sohn, J., Geller, M. J., Hwang, H. S., Zahid, H. J., & Lee, M. G. 2016, The Astrophysical Journal Supplement Series, 225, 23
- Spergel et al. (2003) Spergel, D. N., Verde, L., Peiris, H. V., et al. 2003, ApJS, 148, 175
- Taverna et al. (2022) Taverna, A., Díaz-Giménez, E., Zandivarez, A., & Mamon, G. A. 2022, MNRAS, 511, 4741
- Taverna et al. (2023) Taverna, A., Salerno, J. M., Daza-Perilla, I. V., et al. 2023, MNRAS, 520, 6367
- Taylor et al. (2011) Taylor, E. N., Hopkins, A. M., Baldry, I. K., et al. 2011, MNRAS, 418, 1587
- Tovmassian et al. (2006) Tovmassian, H., Plionis, M., & Torres-Papaqui, J. P. 2006, A&A, 456, 839
- Tzanavaris et al. (2014) Tzanavaris, P., Gallagher, S. C., Hornschemeier, A. E., et al. 2014, The Astrophysical Journal Supplement Series, 212, 9
- Verdes-Montenegro et al. (2001) Verdes-Montenegro, L., Yun, M. S., Williams, B. A., et al. 2001, A&A, 377, 812
- Vika et al. (2013) Vika, M., Bamford, S. P., Häußler, B., et al. 2013, MNRAS, 435, 623
- Vika et al. (2015) Vika, M., Vulcani, B., Bamford, S. P., Häußler, B., & Rojas, A. L. 2015, Astronomy & Astrophysics, 577, A97
- Wake et al. (2017) Wake, D. A., Bundy, K., Diamond-Stanic, A. M., et al. 2017, AJ, 154, 86
- Walker et al. (2013) Walker, L. M., Butterfield, N., Johnson, K., et al. 2013, ApJ, 775, 129
- Walker et al. (2010) Walker, L. M., Johnson, K. E., Gallagher, S. C., et al. 2010, AJ, 140, 1254
- Wetzel et al. (2013) Wetzel, A. R., Tinker, J. L., Conroy, C., & van den Bosch, F. C. 2013, MNRAS, 432, 336
- Yang et al. (2007) Yang, X., Mo, H. J., van den Bosch, F. C., et al. 2007, ApJ, 671, 153
- Zabludoff & Mulchaey (1998) Zabludoff, A. I. & Mulchaey, J. S. 1998, ApJ, 496, 39
- Zandivarez et al. (2022) Zandivarez, A., Díaz-Giménez, E., & Taverna, A. 2022, MNRAS, 514, 1231
- Zepf (1993) Zepf, S. E. 1993, ApJ, 407, 448
- Zheng & Shen (2020) Zheng, Y.-L. & Shen, S.-Y. 2020, The Astrophysical Journal Supplement Series, 246, 12
- Zheng & Shen (2021) Zheng, Y.-L. & Shen, S.-Y. 2021, ApJ, 911, 105