Toward data-driven research: preliminary study to predict surface roughness in material extrusion using previously published data with Machine Learning
Abstract
Purpose. Material extrusion is one of the most commonly used approaches within the additive manufacturing processes available. Despite its popularity and related technical advancements, process reliability and quality assurance remain only partially solved. In particular, the surface roughness caused by this process is a key concern. To solve this constraint, experimental plans have been exploited to optimize surface roughness in recent years. However, the latter empirical trial and error process is extremely time- and resource-consuming. Thus, this study aims to avoid using large experimental programs to optimize surface roughness in material extrusion.
Methodology. This research provides an in-depth analysis of the effect of several printing parameters: layer height, printing temperature, printing speed and wall thickness. The proposed data-driven predictive modeling approach takes advantage of Machine Learning models to automatically predict surface roughness based on the data gathered from the literature and the experimental data generated for testing.
Findings. Using 10-fold cross-validation of data gathered from the literature, the proposed Machine Learning solution attains a 0.93 correlation with a mean absolute percentage error of 13 %. When testing with our own data, the correlation diminishes to 0.79 and the mean absolute percentage error reduces to 8 %. Thus, the solution for predicting surface roughness in extrusion-based printing offers competitive results regarding the variability of the analyzed factors.
Originality. Although Machine Learning is not a novel methodology in additive manufacturing, the use of published data from multiple sources has barely been exploited to train predictive models. As available manufacturing data continue to increase on a daily basis, the ability to learn from these large volumes of data is critical in future manufacturing and science. Specifically, the power of Machine Learning helps model surface roughness with limited experimental tests.
Research limitations. There are limitations in obtaining large volumes of reliable data, and the variability of the material extrusion process is relatively high.
keywords:
Additive manufacturing , Machine Learning , Material extrusion , Predictive material extrusion modeling , Surface roughnessThis version of the paper has been accepted for publication after peer review and is available on Emerald Insight at: https://doi.org/10.1108/RPJ-01-2023-0028
©This author accepted manuscript is deposited under a Creative Commons Attribution Noncommercial 4.0 International (CC BY-NC) license. This means that anyone may distribute, adapt, and build upon the work for non-commercial purposes, subject to full attribution. If you wish to use this manuscript for commercial purposes, please contact: permissions@emerald.com.
1 Introduction
Nowadays, data are a pivotal asset for the world economy. In fact, the term data economy is becoming popular [Carvalho and Kazim, 2022]. Large amounts of data are created, captured, copied and consumed every year. Consequently, the IDC Global Data Sphere report established the size of global data in 59 zettabytes as a baseline [Zillner et al., 2021]. Science is aware of the shift toward more data-oriented research. The increasing availability of data creates new possibilities to develop more accurate and reliable models that may help verify or reject research hypotheses. However, it is still not easy to access most data or to even obtain properly curated data to be used [Hey et al., 2009]. Mainly, scientific research combines both open and sub-scripted books, conference proceedings and journals. However, in science, there is no common standard for arranging data for publication, and there are times when data are simply missing from the studies.
Traditionally, linear regression models have largely been used in research to investigate the causal relationship between multiple independent variables and dependent variables [Efendi et al., 2023]. However, these models are based on strong assumptions, such as normally distributed errors, which may be violated when large data sets from different sources are used [Thongpeth et al., 2021]. Therefore, these traditional statistical approaches are not good enough when it comes to addressing big data issues. The Machine Learning (ml) models are good alternatives to linear regression without the normality assumption (i.e., when the relationship between the outcome and its determinants is non-linear) [Thongpeth et al., 2021]. In this sense, artificial intelligence allows patterns to be identified in data by training computers [Shu and Ye, 2022]. Over the last few decades, there have been great advances in the artificial intelligence field. Applications of various levels of complexity have been developed for a wide range of industrial sectors to solve very different types of problems. For example, the automotive, fishing, food and beverage industries are introducing these techniques [Carou et al., 2022]. In fact, advanced predictive modeling is essential to ensure high-quality products and to further optimize processes. Particularly, advancements in data analytics [Awan et al., 2021] will benefit the smart manufacturing sector [Cui et al., 2020, Carou et al., 2022].
In engineering, research efforts are mainly conducted by research labs that develop experimental research using their own means. Despite the fact that these efforts are connected to the literature, some studies are developed around the same hypothesis and methodologies, making the conclusions redundant. Additionally, some efforts may not be reproducible and, therefore, are of little value. According to Kozlov [2023], science in the twenty-first century is less disruptive than science in the mid-twentieth century. Moreover, research is more oriented toward obtaining incremental advances. This explanation is based on a study of a large set of manuscripts (45 million) and patents (3.9 million), which states that less departure from previous literature results in less disruptive research. However, although the research is based on the literature, the large quantity of published research makes it impossible for researchers to have comprehensive and accurate knowledge of the current state-of-the-art due to the lack of capabilities and resources to process this information. In other words, researchers may not know some key data, verified hypotheses, and general know-how. In contrast, when provided with huge amounts of data, artificial intelligence can obtain knowledge from those sources to help develop new adequate research projects.
Presently, additive manufacturing is being extensively used in the automotive and electronic industries [Leal et al., 2017, Saengchairat et al., 2017, Böckin and Tillman, 2019] and in healthcare products [Zadpoor and Malda, 2017, Rezvani Ghomi et al., 2021], among many other cases. Its economic and flexible nature stands out as a relevant advantage [Ford et al., 2016]. It can be classified into seven processes [Wu et al., 2019]: (i) binder jetting, (ii) directed energy deposition, (iii) material extrusion, (iv) material jetting, (v) powder bed fusion, (vi) vat polymerization, and (vii) sheet lamination.
Material extrusion was first intended for prototyping applications though its potential enables the creation of fully functional products. This process is of special interest because it is the most commonly used approach. This is due to the existence of affordable solutions and the variety of usable materials (mainly plastic) [Messimer et al., 2019].
Unfortunately, even though the use of material extrusion is increasing and becoming more mature, process reliability and quality assurance remain an open challenge [Baumers et al., 2017]. During the last few decades, many experimental studies have been presented to optimize the printing parameters that might have an effect on the printing results [Panda et al., 2015, 2017]. Specifically, material extrusion processes have been thoroughly revised to enhance surface quality [Pérez et al., 2018], form (cylindrical, staircase error, flatness and straightness of parts) [Haghighi and Li, 2018] and mechanical resistance, among others [Moreno et al., 2021]. For instance, printed parts are subjected to the staircase effect, which depends on the layer height and face inclination [Paul and Anand, 2015]. Issues such as the staircase effect can be limited by diminishing the layer height [Gupta et al., 2022]. However, the generalizability of these parameter optimization studies is limited regarding dimensional accuracy. According to a study by Golab et al. [2022] "The variety of optimal printing parameter values suggests that unique solutions exist for each combination of machine, material, and artefact".
Among the studies on quality assurance, both the research community and related enterprises have considered surface finish [Wu et al., 2019]. In particular, surface roughness is a critical constraint that usually comes as a specification in engineering products [Demircioglu et al., 2013]. In light of this, analyzing the influence of the processing conditions becomes crucial to meet the part’s requirements. In the specific case of surface roughness, the lower, the better.
Different approaches have been used to analyze surface roughness in material extrusion, including analytical [Chohan et al., 2016, Lalehpour and Barari, 2018, Ehsanul Haque et al., 2019, Wang et al., 2019] and experimental [Pérez et al., 2018]. However, very limited effort has been directed to ml approaches, particularly for studies using published data. Based on all of the above, it is hypothesized that by using the available published data, a model can be developed to predict outputs in manufacturing processes without needing to perform large, costly and time-consuming experimental plans.
In this study, the objective is to focus on the material extrusion process. In this sense, the study is developed as a preliminary analysis to predict surface quality in material extrusion by utilizing ml. Specifically, this article aims to analyze the influence of layer height, printing speed, printing temperature and wall thickness on surface roughness using published data and experimental data. Consequently, these models might demonstrate that surface roughness can be modeled avoiding the need to perform large experimental programs by taking advantage of the aforementioned data from the literature.
The article is organized in the following way. Section 2 reviews related work on predictive modeling in material extrusion, considering both traditional ml and Deep Learning (dl) models for surface roughness prediction. Section 3 describes our novel proposal. Section 4 presents the experimental results. Finally, Section 5 identifies the main conclusions and Section 6 presents the main limitations of the study and insights for future research.
2 Related work
A variety of factors exist that directly affect the printing process and can be controlled programmatically (e.g., layer height). Accordingly, the Ultimaker Cura printer, one of the most popular software for 3d printers, offers over 400 different settings in the custom mode. However, some factors cannot be controlled before the printing process takes place (e.g., vibrations).
In the specific case of surface roughness, considerable effort has been carried out to identify the potential factors that most affect printed parts. These efforts have resulted in a generally accepted body of knowledge about the most important factors that might affect surface roughness: bed temperature, fan speed, infill density and pattern, layer height, printing speed and temperature, type and state of the material, type of printer, and wall line count [Bikas et al., 2016, Hällgren et al., 2016, Bourell et al., 2017, Umaras and Tsuzuki, 2017, Pérez et al., 2018, Li et al., 2019b]. This background was mainly gathered by testing the experimental designs developed by the research community. In general, the experimental studies confirm that layer height is critical for surface roughness [Pérez et al., 2018], but the effect of other printing parameters on surface roughness is not well-known yet. For instance, Mendricky and Fris [2020] identified the influence of printing speed on surface roughness, whereas Yang et al. [2020] found that this factor did not influence this output. Consequently, there is still a research gap that requires more testing to validate published findings.
Among data mining research applied to additive manufacturing, traditional approaches [Barrios and Romero, 2019, Li et al., 2019b, a, Wu et al., 2019, Liu et al., 2021] and dl or Neural Networks (nn) approaches [Hooda et al., 2021, Kandananond, 2021, Tripathi and Singla, 2021, Saad et al., 2022] deserve attention. However, the use of the former nn models is limited due to the huge amount of training data needed.
Barrios and Romero [2019] proposed a ml-based solution for surface roughness in material extrusion. Specifically, the authors exploited the Decision Tree (dt) and Random Forest (rf) models, along with J48 and Random Tree (rt) combined with the L27 array-based Taguchi method. The outcome allows the end users to efficiently and effectively set the flow rate, layer height, print acceleration, speed and temperature parameters.
Li et al. [2019b] presented a more sophisticated data-driven solution with an ensemble ml model to predict surface roughness in two stages (offline and online). For the offline operation mode, classification and regression trees were used to train the system. Afterward, the testing stage was performed in online mode. Note that the surface roughness was estimated in a unique direction. Moreover, the MakerBot Replicator Plus 3d printer was used to obtain the parts. Wu et al. [2019] presented a similar ml-based work, and the prediction accuracy was subsequently enhanced by Li et al. [2019a]. Particularly, they based their model on the parabolic curve and linear straight-line surface profile representation method.
More recently, Hooda et al. [2021] used ml models to predict the optimum deposition angle. The training data were obtained from the Ultimaker Cura software using different geometries for the Prusa i3 printer. The authors used Linear and Logistic Regression (lr), dt, rf and Support Vector Machine (svm) models, along with Multi-layer Perceptron and nn. In the end, the rf classifier offered the best results. Kandananond [2021] also used Multi-layer Perceptrons. More in detail, they applied two training methods (weight backtracking-resilient backpropagation and globally convergent resilient backpropagation) to compare the effect of the number of neurons in hidden layers.
Tripathi and Singla [2021] analyzed the impact of several parameters on surface roughness using dl. However, the authors did not use K-fold cross-validation, leaving this method for future work, and admitted the need for larger amounts of data. Similarly, Jiang et al. [2022b] presented a theoretical solution for surface roughness in material-extruded products. The authors concluded that extrusion temperature and layer thickness are the most relevant factors. Finally, although the use of nn is limited due to the huge amount of training data needed, Saad et al. [2022] analyzed the influence of several network structures on the printing process, using the coefficient of determination as a representative parameter in their study.
More closely related to our work, Liu et al. [2021] presented a detailed study on additive manufacturing to endorse the application of ml models. Their study is based on data gathered from 121 articles in the literature on powder laser-based additive manufacturing of the Ti-6Al-4V alloy. When dealing with data mining, the authors identified some important drawbacks, such as: “[…]these data do not consistently record composition, micro-structure, thermal history, part shape and orientation, starting powder composition and density, and other important process and material properties[…]”. Despite the limitations, the authors proved that ml can be used as a starting point for further analysis.
The ability to learn from these large volumes of data will be critical in future manufacturing and science. The traditional approaches require a lot of testing and are highly demanding. To the best of our knowledge, this is the first research study to combine multi-source data sets and ml techniques to train a surface roughness predictive model in material extrusion. The main objective is to combine data from the literature in order to (i) reduce time and resource constraints, and (ii) analyze the coherence of the literature data from different printing machines.
3 Materials and methods
Figure 1 details the system scheme developed for the surface roughness prediction experimental plan, which it is composed of three stages: (i) data acquisition (Section 3.1 and 3.2); (ii) ml modeling (Section 3.3), including feature analysis and selection processes (Section 3.3.1); and (iii) evaluation (Section 3.4). In Section 3.5, the computer requirements and implementations are described.
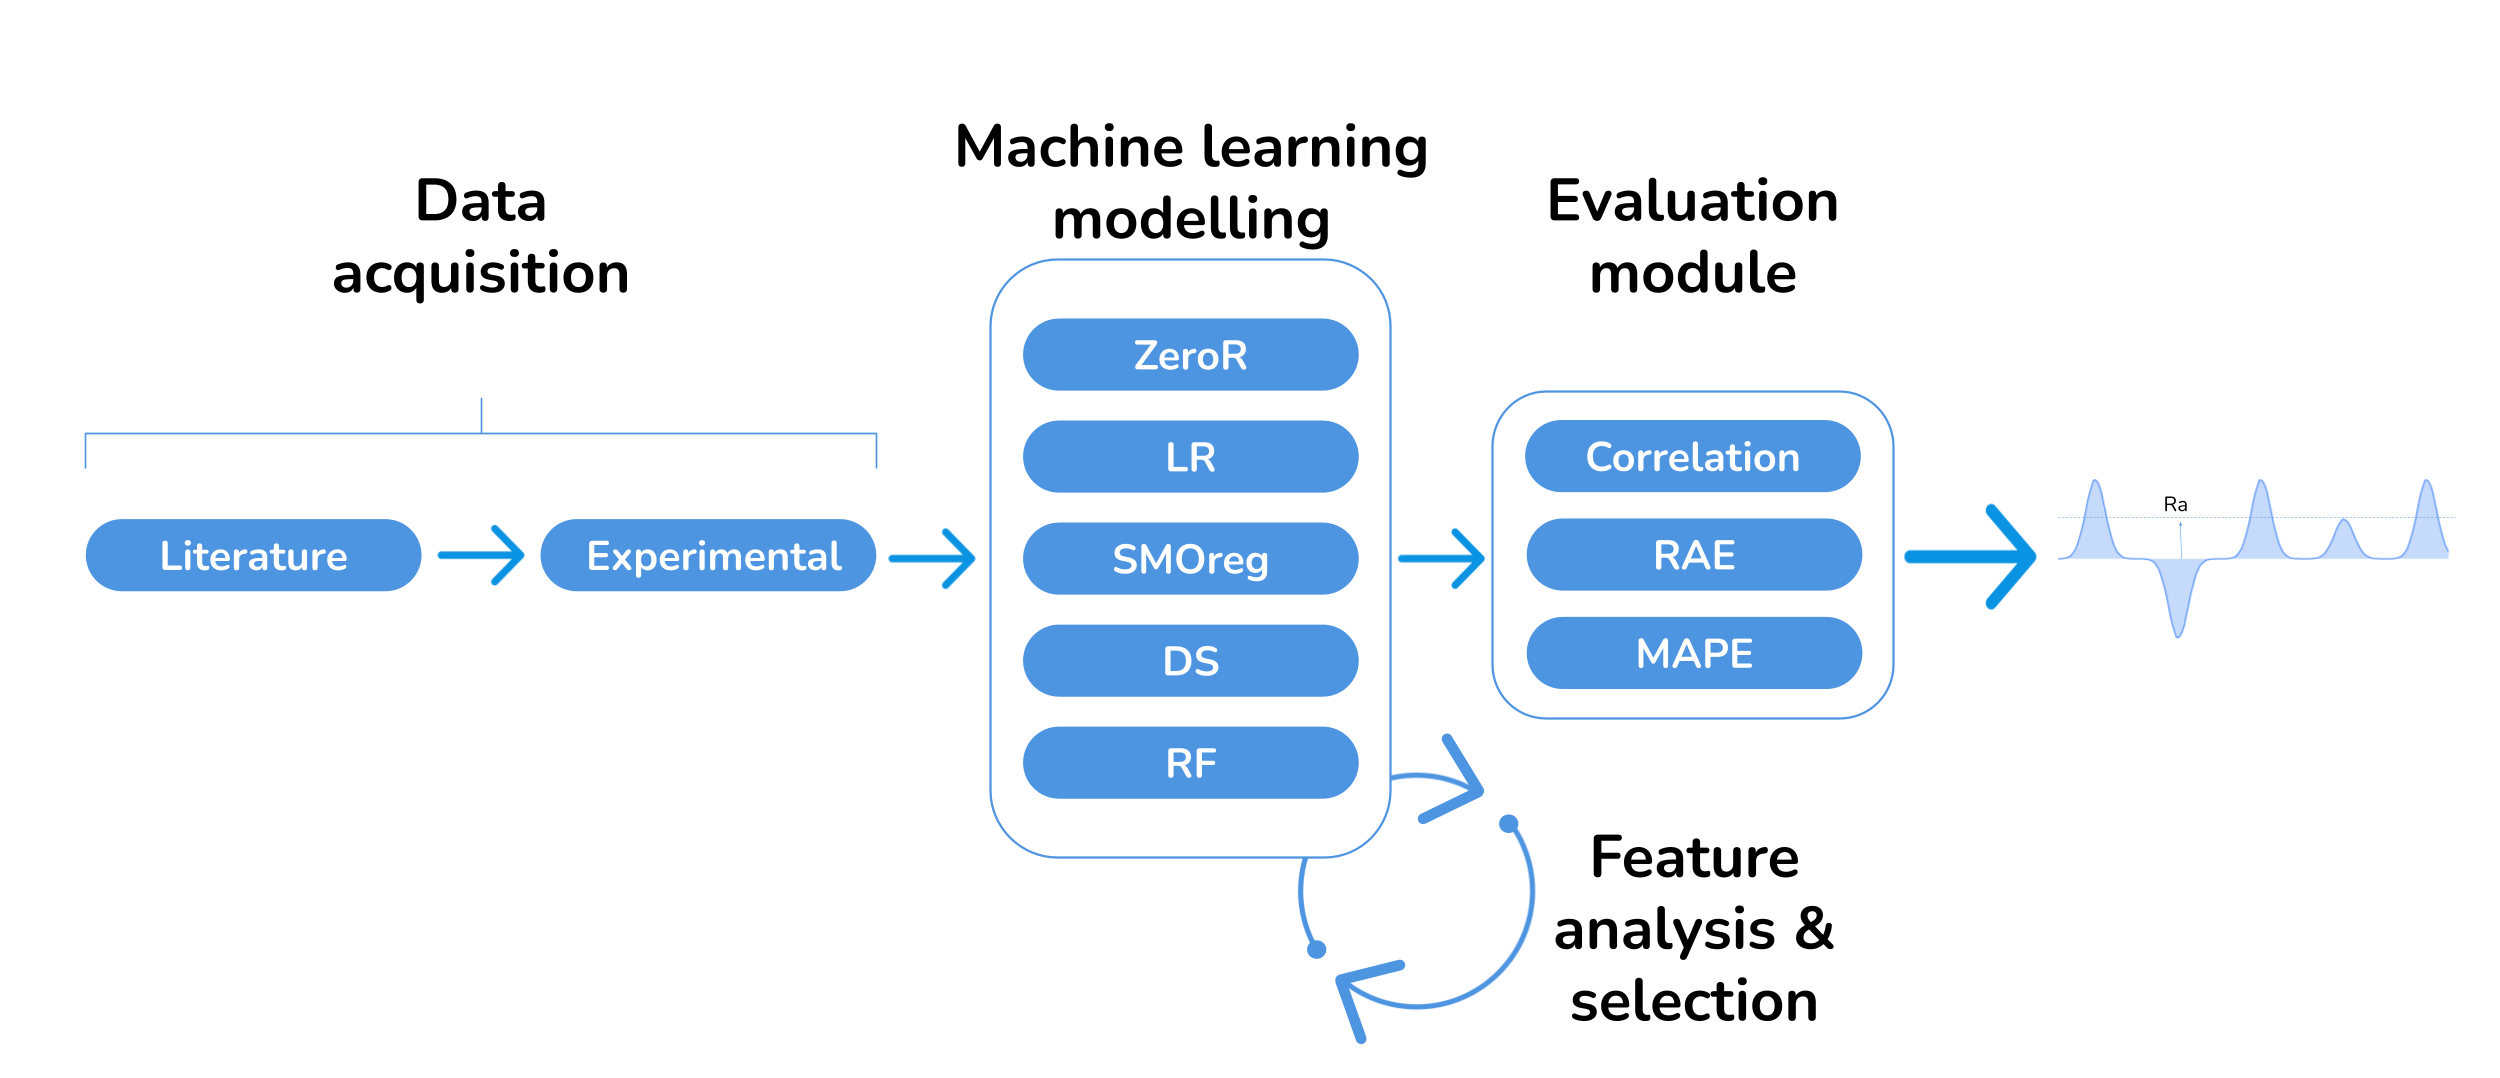
Initially, data acquisition was performed to create an adequate and reliable experimental data set. Afterward, an optimal ml model was created to predict the surface roughness based on the training data set. In the end, data from experimental tests were used to validate the model.
3.1 Data acquisition
Data were obtained from published experimental studies in the literature [Alsoufi and Elsayed, 2017, Peng and Yan, 2018, Aslani et al., 2020, Buj-Corral et al., 2021, Morampudi et al., 2021, Taşdemir, 2021, Vambol et al., 2021]. Several manuscripts were discarded based on criteria, such as not indicating the measuring surface or only presenting graphs rather than the recorded values. Furthermore, a testing data set was obtained by experimental testing. The former data are composed of 100 training values, whereas the latter data are composed of 128 experimental values. Note that the final data set111Available at https://bit.ly/3RIEA8i, April 2023. is similar in size to other state-of-the-art studies [Gu et al., 2018, Jiang et al., 2022a, Westphal and Seitz, 2022].
In this study, the experimental data set (used for testing) is 28 % larger than the merged data set retrieved from the literature (used for training). However, the latter smaller data set includes data related to different printers; therefore, different printing patterns will contribute to creating a general ml model. The ultimate objective is to validate whether the general data set from the literature is able to predict the surface roughness of a different printer in different laboratory environments.
3.2 Experimental plan
To create a data set to validate the models, an experimental plan consisting of 16 tests was defined. The samples were printed with four varying factors. The combinations were selected with the objective to analyze these four factors with a limited number of samples. The printing tests were performed using polylactic acid (pla)), which is characterized by the data listed in Table 1. The material selection helps to model the outcome by taking into account that different materials require different printing parameters, such as bed temperature and printing temperature.
The printed samples consisted of cylindrical pieces of 30 mm diameter and 60 mm height that were printed via the Ultimaker S5 (referred to as printer us5) and the Ultimaker 3 extended (referred to as printer u3) using the Ultimaker Cura 4.13.1 software. The resolution of the two printers was 20-200 µm. The nozzle had a diameter of 0.4 mm. The factors analyzed included the following: layer height, printing speed, printing temperature and wall thickness. In addition, the infill density was 20 %. Thus, two sets of eight samples were printed with each of the printers. The full breakdown can be seen in Table 2.
| Composition | pla (polylactic resin) - 99 % CAS: 9051-89-2 |
| Density | 1.24 g/cm3 |
| Diameter | 1.75 ± 0.03 mm |
| Printing temperature | 220 ± 20 ºC |
| Melting temperature | 180 ºC |
| Sample | Printer | Layer | Printing | Printing | Wall | Infill |
| height (mm) | speed (mm/s) | temperature (°C) | thickness (mm) | density (%) | ||
| 1 | us5 | 0.15 | 60 | 200 | 2 | 20 |
| 2 | us5 | 0.23 | 60 | 200 | 2 | 20 |
| 3 | us5 | 0.30 | 60 | 200 | 2 | 20 |
| 4 | us5 | 0.23 | 60 | 215 | 2 | 20 |
| 5 | us5 | 0.23 | 60 | 230 | 2 | 20 |
| 6 | us5 | 0.23 | 60 | 200 | 1 | 20 |
| 7 | us5 | 0.23 | 60 | 200 | 3 | 20 |
| 8 | us5 | 0.23 | 40 | 200 | 2 | 20 |
| 9 | u3 | 0.15 | 60 | 200 | 2 | 20 |
| 10 | u3 | 0.23 | 60 | 200 | 2 | 20 |
| 11 | u3 | 0.30 | 60 | 200 | 2 | 20 |
| 12 | u3 | 0.23 | 60 | 215 | 2 | 20 |
| 13 | u3 | 0.23 | 60 | 230 | 2 | 20 |
| 14 | u3 | 0.23 | 60 | 200 | 1 | 20 |
| 15 | u3 | 0.23 | 60 | 200 | 3 | 20 |
| 16 | u3 | 0.23 | 40 | 200 | 2 | 20 |
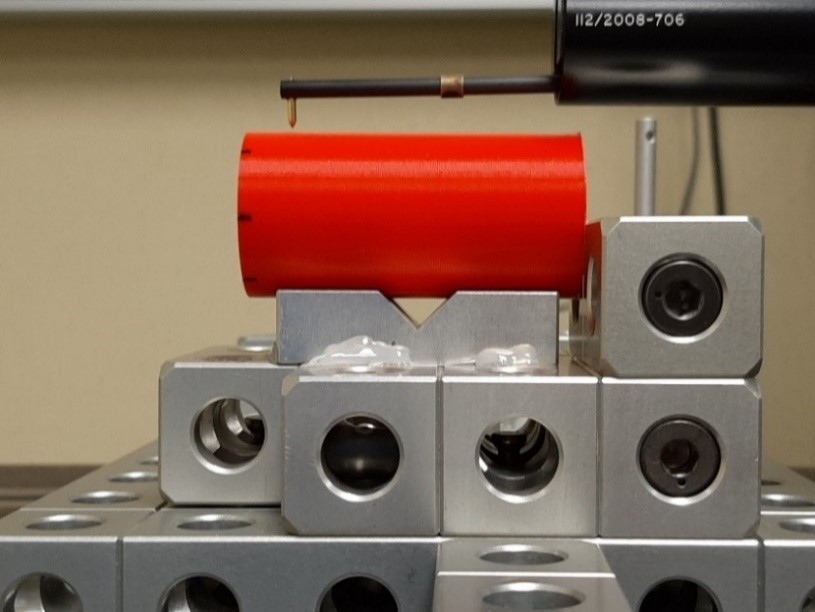
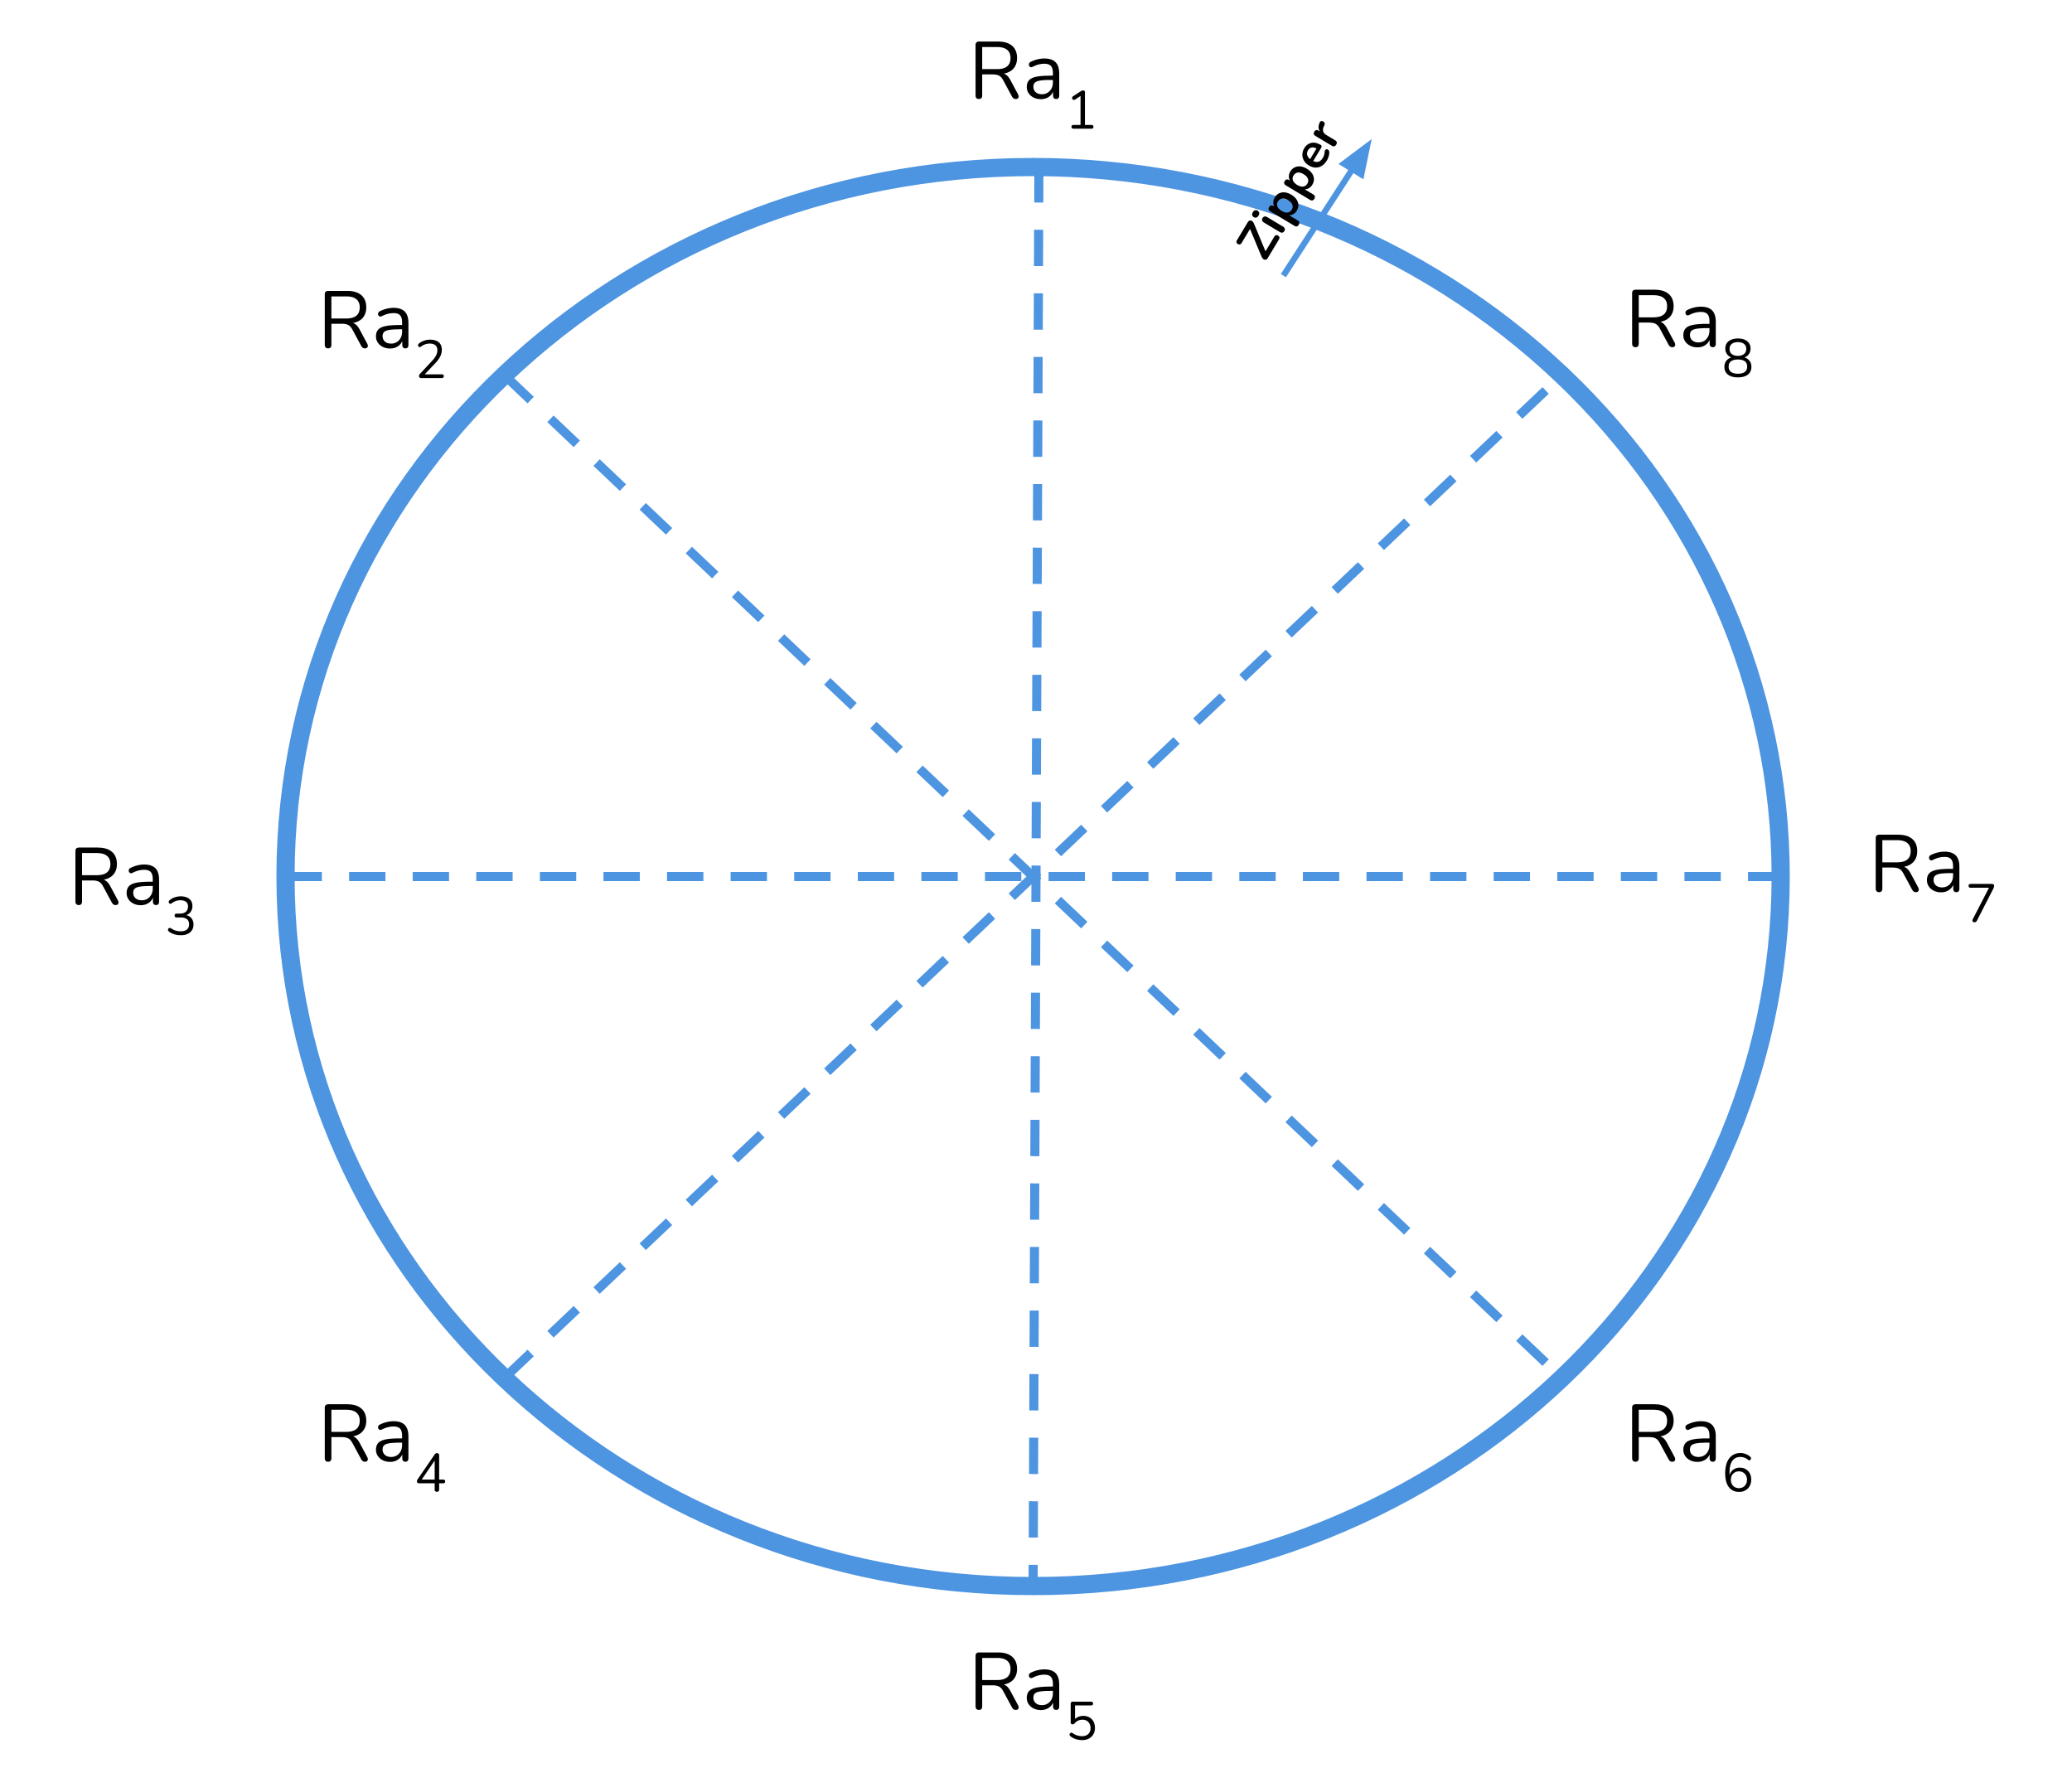
The arithmetic average roughness (Ra) was computed as the response variable. The ISO 4287 standard was used to record the roughness using five cut-offs of 8 mm. Thus, a length of 40 mm was evaluated because the expected surface roughness values were higher than 10 m. To measure the surface roughness, a Taylor Hobson profilometer was used (see Figure 2). The surface roughness measurement was performed in eight different locations for each sample. Figure 3 details the eight positions with a 45º separation. The average surface roughness at these eight positions is defined as Ra1, Ra2, Ra3, Ra4, Ra5 Ra6, Ra7, and Ra8.
3.3 Machine Learning modeling
Since the literature data are collected from different printers and acquisition environments, the correlation between the layer height feature and the target feature in the literature merged data set (0.82 in Table 3) can be used as a baseline and motivation to apply a more sophisticated multi-modal approach to extract patterns with greater precision. Table 3 shows the linear correlations between all of the features in the study and the target feature, regardless of the model used. Accordingly, different ml models were selected to evaluate the data set using diverse analysis perspectives.
| Printing parameter | Significance |
| Layer height | 0.82 |
| Nozzle diameter | 0.35 |
| Wall thickness | 0.16 |
| Infill density | 0.09 |
| Printing temperature | 0.06 |
| Printing speed | -0.03 |
| Shape | -0.21 |
The models were trained and tested with 10-fold cross-validation [Berrar, 2019] using the data from the literature exclusively. The latter process consists of using different parts of the experimental data set over multiple iterations for both training and testing models. Consequently, it is possible to estimate the precision with which a model will be able to predict new samples in a real scenario. The latter process also contributes to minimizing data selection randomization during evaluation. In the end, the proposed model is validated using our own data gathered throughout this project.
Two operation modes in ml-based solutions exist that depend on the feasible values of the target feature: (i) nominal and (ii) categorical. This work belongs to the first group. Thus, the ml models seek to infer the best mathematical equation to fit the training data acting as regressor models. Motivated by their good performance in related studies in the literature [Barrios and Romero, 2019, Hooda et al., 2021], the following models were selected:
-
•
ZeroR [Sangeorzan, 2020] is a rule-based model that operates with the mean of the data.
-
•
lr [Pal and Bharati, 2019] uses the Akaike criterion for model selection and is capable of handling weighted instances.
-
•
smoreg [Assim et al., 2020] implements a specific svm for regression problems.
-
•
Decision Stump (ds) [Uskov et al., 2021] belongs to the group of tree algorithms and is one of the most basic.
-
•
rf [Schonlau and Zou, 2020] belongs to the group of tree algorithms, but follows a more complex approach than ds. Particularly, it is composed of a set of trees that finally ends up assembled into one to make a prediction.
For the ml models, we selected implementations from Weka ml software in Java: ZeroR222Available at https://weka.sourceforge.io/doc.stable-3-8/weka/classifiers/rules/ZeroR.html, April 2023., lr333Available at https://weka.sourceforge.io/doc.dev/weka/classifiers/functions/LinearRegression.html, April 2023., smoreg444Available at https://weka.sourceforge.io/doc.dev/weka/classifiers/functions/SMOreg.html, April 2023., ds555Available at https://weka.sourceforge.io/doc.dev/weka/classifiers/trees/DecisionStump.html, April 2023., and rf666Available at https://weka.sourceforge.io/doc.dev/weka/classifiers/trees/RandomForest.html, April 2023..
The aforementioned models are executed with default parameters. Based on the results in Table 3, the correlation between the input features and the surface roughness target will be higher in the ml models and will have more complex relationships among them, ensuring competing results. Furthermore, for both the experimental data and the data gathered from the literature, the data variability is assumed to be minimal. Otherwise, the ml models will not converge, and the results will be extremely low.
3.3.1 Feature analysis and selection
This module exhibits a circular behavior (i.e., first, the features are optimized, and then, the model is re-evaluated). Using feature ranking techniques, a list of the most relevant features is obtained, excluding those that negatively influence the model. Afterward, the ml models are evaluated. Note that the feature selection seeks to (i) eliminate redundant features, (ii) improve the results, and (iii) reduce the complexity of the model in terms of the number of features used.
3.4 Evaluation module
When ml models act as classifiers, they are traditionally evaluated using metrics such as accuracy, precision and recall, because of the limited number of values available to predict the target feature. However, when they are used as regressors, as in this study, the unlimited target values support the use of correlation analysis and relative absolute error (rae, see Equation 1) where and correspond to the forecast and actual values, respectively.
| (1) |
The former metric assesses the model’s adaptability to the target feature variations (decreases and increases). The rae metric evaluates the predicted value’s average-percentual deviation from the expected one. However, in a problem with sparse target values, such as this case (the surface roughness values range from 3.88 to 32.79 m for the training data, and in the experimental data, from 8.53 to 27.02 m), the rae metric may provide rather despairing results. The latter is due to the fact that the rae metric weighs using the average of the actual values of surface roughness. Consequently, the mean absolute percentage error (mape) metric was also computed to perform a much more precise evaluation of the ml models (see Equation 2). mape metric is a measure of the error between forecast and actual values with respect actual values, whereas the rae metric measures the error with respect to the deviation of mean actual values. Thus, based on similar works in the literature [Rahmati and Vahabli, 2015, Vahabli and Rahmati, 2016], mape is the most appropriate metric to assess the surface roughness prediction model.
| (2) |
The tolerance error (te) shown by the printers must also be taken into account as the lower limit. Accordingly, te values have been reported to oscillate between 10 and 40 % in the literature [Kairn et al., 2021]. In the end, combining the aforementioned metrics allows us to assess the effectiveness of the proposed solution from a complete perspective.
3.5 Experimental setting and implementations
The experiments were performed on a computer with the following specifications:
-
•
Operating system: Ubuntu 18.04.2 lts 64 bits
-
•
Processor: IntelCore i9-9900K 3.60 GHz
-
•
RAM: 32 GB DDR4
-
•
Disk: 500 GB (7200 rpm SATA) + 256 GB SSD
4 Results and discussion
The experimental results and the development of the ml models are described; and the results obtained and the limitations of the proposed method are discussed.
4.1 Machine Learning modeling
Table 4 presents the surface roughness results obtained for the 16 samples manufactured with the aforementioned printing conditions. Note the variability in the surface roughness values. For the same sample and printer, the surface roughness can reach values up to 27.02 m (see sample 14). Moreover, compared to the Ultimaker S5, the Ultimaker 3 extended printer attains up to 8.52 m more in average surface roughness (see the comparison between samples 6 and 14 in Table 5).
| Sample |
|
|
|
|
|
|
|
|
|
||||||||||||||||||
| 1 | 8.64 | 9.39 | 9.22 | 9.84 | 9.70 | 8.53 | 8.84 | 9.28 | 9.18 | ||||||||||||||||||
| 2 | 15.70 | 15.95 | 15.83 | 16.63 | 16.34 | 16.26 | 16.22 | 16.33 | 16.16 | ||||||||||||||||||
| 3 | 22.61 | 22.76 | 22.33 | 21.89 | 20.87 | 22.17 | 22.11 | 22.52 | 22.03 | ||||||||||||||||||
| 4 | 15.28 | 15.64 | 15.86 | 16.77 | 14.98 | 15.16 | 15.95 | 16.15 | 15.72 | ||||||||||||||||||
| 5 | 16.29 | 16.35 | 16.53 | 15.51 | 16.99 | 15.26 | 15.91 | 16.55 | 16.17 | ||||||||||||||||||
| 6 | 15.70 | 15.52 | 15.53 | 14.81 | 16.58 | 15.82 | 15.37 | 15.82 | 15.64 | ||||||||||||||||||
| 7 | 15.14 | 15.44 | 14.93 | 15.76 | 15.83 | 14.48 | 15.61 | 15.51 | 15.34 | ||||||||||||||||||
| 8 | 15.68 | 16.30 | 16.19 | 17.01 | 15.95 | 15.30 | 16.62 | 16.18 | 16.15 | ||||||||||||||||||
| 9 | 10.19 | 11.79 | 11.29 | 11.87 | 10.90 | 10.84 | 9.55 | 10.53 | 10.87 | ||||||||||||||||||
| 10 | 17.62 | 18.57 | 19.74 | 18.14 | 16.10 | 16.81 | 16.79 | 17.29 | 17.63 | ||||||||||||||||||
| 11 | 21.65 | 21.90 | 21.98 | 22.00 | 21.14 | 22.08 | 21.99 | 21.41 | 21.77 | ||||||||||||||||||
| 12 | 17.10 | 16.36 | 17.65 | 18.44 | 16.61 | 18.31 | 15.66 | 18.27 | 17.30 | ||||||||||||||||||
| 13 | 17.55 | 18.84 | 17.60 | 17.26 | 16.06 | 15.76 | 15.55 | 17.73 | 16.99 | ||||||||||||||||||
| 14 | 26.49 | 27.02 | 26.25 | 26.00 | 22.70 | 21.57 | 21.47 | 21.81 | 24.16 | ||||||||||||||||||
| 15 | 17.17 | 17.31 | 18.31 | 16.97 | 16.11 | 17.44 | 16.25 | 17.42 | 17.12 | ||||||||||||||||||
| 16 | 18.09 | 18.72 | 19.03 | 18.53 | 17.09 | 16.89 | 17.80 | 18.97 | 18.14 |
|
|
|
|
|
|
|
|
|
|
||||||||||||||||||||
| 1, 9 | 1.55 | 2.40 | 2.07 | 2.03 | 1.20 | 2.31 | 0.71 | 1.25 | 1.69 | ||||||||||||||||||||
| 2, 10 | 1.92 | 2.62 | 3.91 | 1.51 | 0.24 | 0.55 | 0.57 | 0.96 | 1.47 | ||||||||||||||||||||
| 3, 11 | 0.96 | 0.86 | 0.35 | 0.11 | 0.27 | 0.09 | 0.12 | 1.11 | 0.26 | ||||||||||||||||||||
| 4, 12 | 1.82 | 0.72 | 1.79 | 1.67 | 1.63 | 3.15 | 0.29 | 2.12 | 1.58 | ||||||||||||||||||||
| 5, 13 | 1.26 | 2.49 | 1.07 | 1.75 | 0.93 | 0.50 | 0.36 | 1.18 | 0.82 | ||||||||||||||||||||
| 6, 14 | 10.79 | 11.50 | 10.72 | 11.19 | 6.12 | 5.75 | 6.10 | 5.99 | 8.52 | ||||||||||||||||||||
| 7, 15 | 2.03 | 1.87 | 3.38 | 1.21 | 0.28 | 2.96 | 0.64 | 1.91 | 1.78 | ||||||||||||||||||||
| 8, 16 | 2.41 | 2.42 | 2.84 | 1.52 | 1.14 | 1.59 | 1.18 | 2.79 | 1.99 |
Table 6 details the classification results obtained with 10-fold cross-validation. The correlation value of the best classifier, rf, is 0.93 (0.11 higher than the baseline established in Table 3). Although the rae reaches 30.16 %, the mape is 13.01 %. The latter value means that the surface roughness prediction presents an accuracy of 87 %. These values are considered competitive taking into account that data come from different sources (i.e., different printing environments, materials and printers). For the rest of the classifiers, especially in the case of the smoreg and lr models, the results obtained are close to these values, which endorses the steady nature of the final data set.
| zeror | lr | smoreg | ds | rf | |
| Correlation | -0.28 | 0.90 | 0.91 | 0.74 | 0.93 |
| rae (%) | 100.00 | 38.50 | 36.24 | 58.27 | 30.16 |
| mape (%) | 50.22 | 17.54 | 16.04 | 24.00 | 13.01 |
Table 7 shows the correlation, error values, rae and mape for each of the aforementioned algorithms that were trained with the data sets from the literature and tested with the original experimental data set. Notably, the ZeroR model predicts the mean of the analyzed values, resulting in a correlation of 0 and an error of 100 %, which confirms that the data set is complex and that there is no predominant target class. The results improve when the lr model is used, resulting in a correlation of 0.73, which supports that the model is capable of detecting patterns. However, the rae is still very high (108.55 %). There is no improvement in the metrics when using the smoreg algorithm. In the latter case, the correlation remains at 0.70, and the rae reaches 164.41 %. Therefore, it can be concluded that this type of algorithm is not suitable for predicting surface roughness in material extrusion. The alternative is to opt for a tree-based model. Thus, the most basic classifier, ds, is selected. With this algorithm, the value of the correlation is maintained at 0.70, equal to smoreg, but the rae drops to the value obtained with the lr model, with an error of 107.18 %. The best performance is obtained with the rf model, with the correlation value improving to 0.79, and the mape metric reducing to 8 % (i.e., the accuracy of the model reaches 92 %). Consequently, rf seems to be the best algorithm for predicting surface roughness even though the rae is relatively high due to the nature of this metric as indicated in Section 3.4.
| zeror | lr | smoreg | ds | rf | |
| Correlation | 0.00 | 0.73 | 0.70 | 0.70 | 0.79 |
| rae (%) | 100.00 | 108.55 | 164.41 | 107.18 | 49.88 |
| mape (%) | 17.08 | 18.83 | 28.70 | 17.51 | 8.00 |
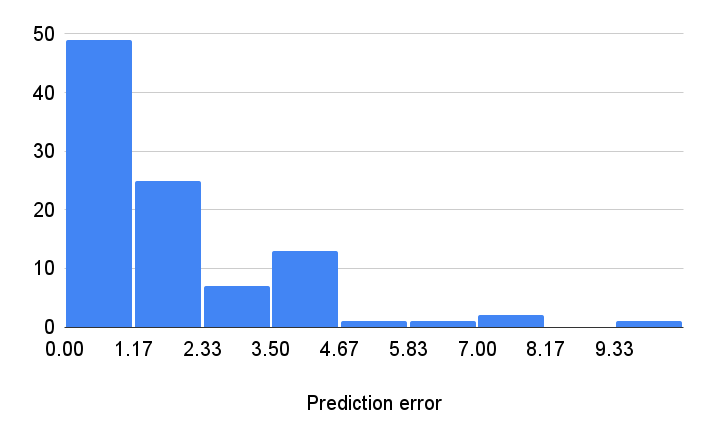
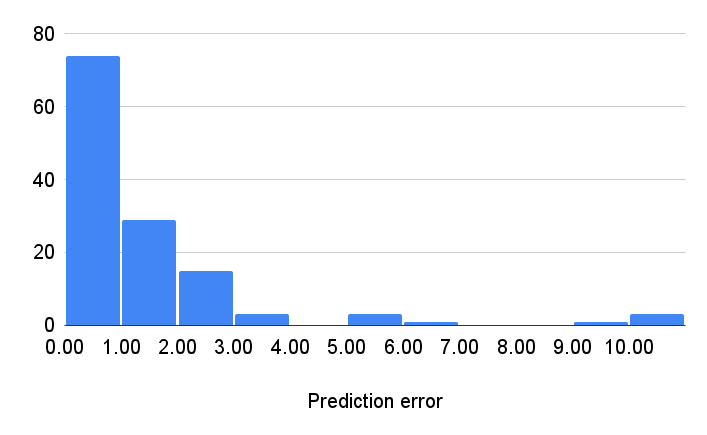
In the end, Figure 4 shows the histogram of the prediction error for both training and testing, which corresponds to the difference between the forecast and actual value for each sample. Thus, the histogram collects the absolute errors as ranges. Note that most of the values are concentrated in lower deviation zones.
4.1.1 Feature analysis and selection
For optimization purposes, assessing the influence of the printing parameters on the response variable is particularly interesting. Accordingly, an analysis of the significance of each selected printing parameter and three parameters available in the data set obtained from the literature (layer height, nozzle diameter, wall thickness, infill density, printing temperature, printing speed and shape) is performed using ClassifierAttributeEval777Available at https://weka.sourceforge.io/doc.dev/weka/attributeSelection/ClassifierAttributeEval.html, April 2023. on the data sets gathered from the literature to evaluate the worth of an attribute by using the rf model. Table 8 ranks these parameters based on their relevance.
| Printing parameter | Significance |
| Layer height | 3.15 |
| Nozzle diameter | 0.48 |
| Wall thickness | 0.24 |
| Infill density | 0.15 |
| Printing temperature | 0.01 |
| Printing speed | -0.04 |
| Shape | -0.20 |
Based on the results, the most significant parameter is layer height. This agrees with the general knowledge of the process [Pérez et al., 2018]. The nozzle diameter is the second most important factor, whereas wall thickness lies in third place. In the end, printing speed and temperature are barely relevant. However, in the experimental data, the nozzle diameter remains unchanged with a value of 0.4 mm, as previously mentioned. It should be noted that the average nozzle diameter of the training data set was 0.39 mm.
Figure 5 (a) plots the surface roughness against the layer height for the two selected 3d printers, demonstrating that the surface roughness increases with the layer height. The relationship between wall thickness and surface roughness is not straightforward as the latter case (see Figure 5 (b)). In both cases, the Ultimaker S5 results in lower surface roughness. Therefore, the influence of the printer is critical. Taking into account that the results of the experimental testing data depend on the printer, the same is true when dealing with the training data. This confirms that the material extrusion process lacks repeatability when it comes to surface quality.
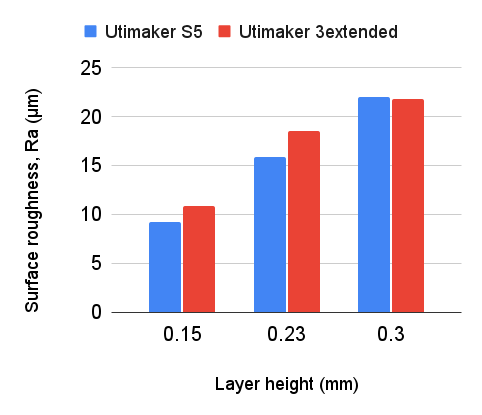
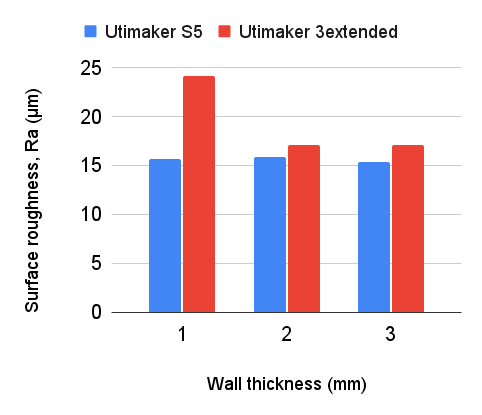
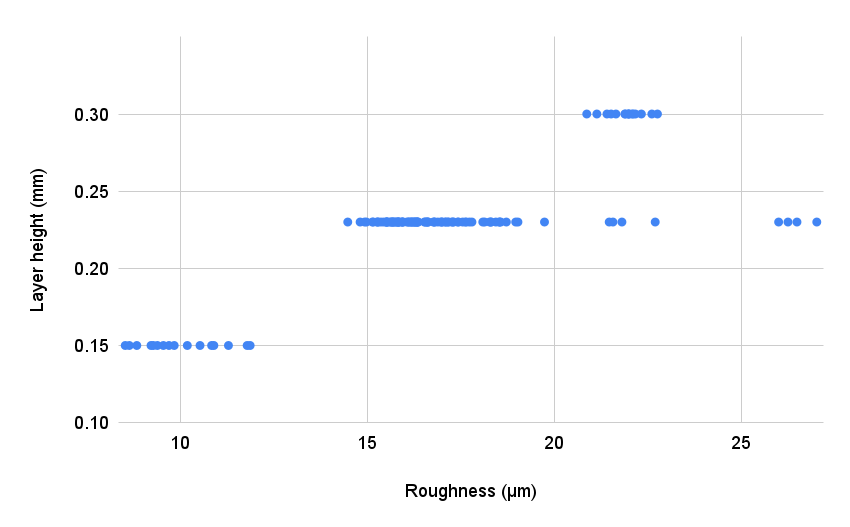
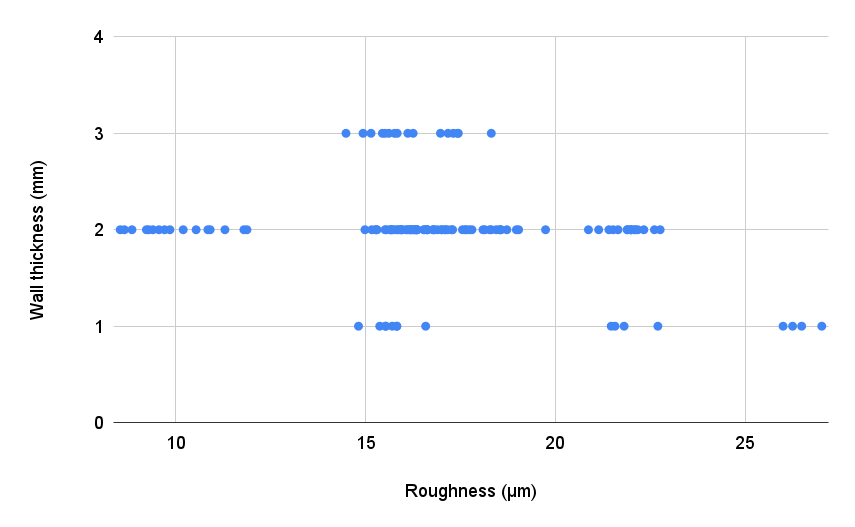
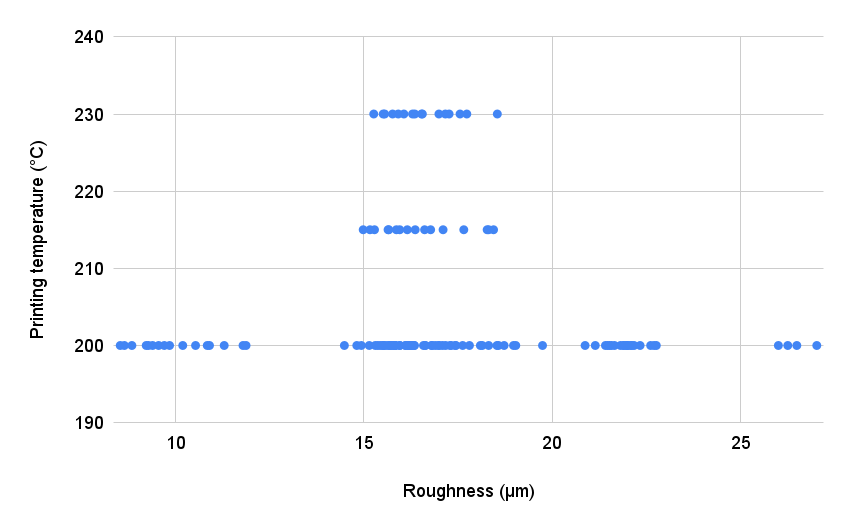
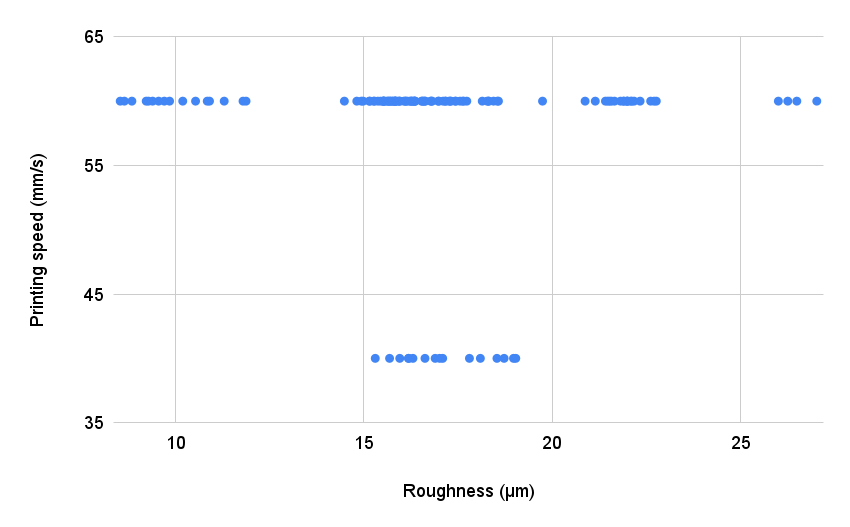
Figure 6 details the variation of the most significant printing parameters from the experimental data for testing from Table 8, along with the surface roughness in decreasing order of significance for the ml model. In light of the illustrations, the layer height is the only one that exhibits a clear, direct linear relationship with regard to surface roughness, demonstrating that it is the parameter with the highest significance. However, based on the values shown in the rest of the graphs for wall thickness, printing temperature and printing speed, there are additional and more complex relationships with surface roughness in the experimental data. Thus, a simple correlation analysis may not be effective enough for this research problem. Take the case of a surface roughness higher than µm as a representative example. In this case, surface roughness cannot be exclusively inferred using the layer height parameter, but might feasibly be detected by an ml model when combined with data of wall thickness, printing temperature and printing speed.
5 Conclusion
The present study proposes using ml models to predict the surface roughness of parts printed using the material extrusion approach. As input data, this study takes advantage of previously published data and is presented as a preliminary application of this methodology.
The results of the study help identify the following conclusions: (i) the use of published data largely allows researchers to diminish the need to perform costly and time-consuming experiments; (ii) ml algorithms have proven to be a good tool for analyzing data and building models to study surface roughness in material extrusion; (iii) the correlations among the models were determined using only published data, and published and experimental data being 0.93 and 0.79, respectively, for the rf model; (iv) when addressing the error, it should be noted that the values are relatively low (mape metric: training 13 %, training and testing 8 %); (v) the analysis of the printing parameters’ significance agrees with the existing knowledge of the process, with layer height being the most critical parameter.
6 Limitations and future work
Certain limitations in the presented methodology for modeling surface roughness appear in a number of ways: (i) access to data from some published papers is not available; (ii) some measuring methodologies are not fully described, including details on the used standard, filters, cut-off and other relevant characteristics, which make it impossible to identify the measured features; (iii) the configuration complexity of the printing process may result in significant differences among data, such as variations in the type of printer, the fan setups and the build plate, resulting in undesired variability.
In summary, despite the limitations, the proposed solution can help obtain insights from the material extrusion printing process and aid designers and researchers in optimizing this process to improve the surface quality of their products. However, future work is still needed. For instance, (i) there is a need to elaborate larger data sets for training and testing; (ii) additional printing factors should be included in the analysis, such as printing orientation and the influence of the machine settings on surface roughness; (iii) the Deep Learning models can be tested; (iv) generalization must be further researched. In this sense, both the training and the testing data sets should include different samples and contexts.
In addition, the proposed methodology should be identified as a general approach that can be further used in other manufacturing processes to predict other types of variables. The present study proves that it is possible to take advantage of the published data to improve the knowledge of the printing process with limited effort in terms of time and money investment for carrying out experiments. Although data-driven research requires large investments in data curation, with easy access guaranteed to data for researchers and general users [Hey et al., 2009], there are still large opportunities to work under data-driven research in manufacturing in the coming years.
Abbreviations
Decision Stump (ds), Decision Tree (dt), Deep Learning (dl), Logistic Regression (lr), Machine Learning (ml), mean absolute percentage error (mape), Neural Networks (nn), polylactic acid (pla), Random Forest (rf), Random Tree (rt), relative absolute error (rae), Support Vector Machine (svm), tolerance error (te).
Data availability
The data are publicly available\@footnotemark.
Acknowledgements
This study was partially supported by the Xunta de Galicia grants ED481B-2021-118 and ED481B-2022-093, Spain. The authors would like to thank Mr Javier Rodríguez and the Laboratorio Oficial de Metrología de Galicia for their support.
References
- Alsoufi and Elsayed [2017] Alsoufi, M.S., Elsayed, A.E., 2017. How Surface Roughness Performance of Printed Parts Manufactured by Desktop FDM 3D Printer with PLA+ is Influenced by Measuring Direction. American Journal of Mechanical Engineering 5, 1–12. doi:10.12691/ajme-5-5-4.
- Aslani et al. [2020] Aslani, K.E., Chaidas, D., Kechagias, J., Kyratsis, P., Salonitis, K., 2020. Quality performance evaluation of thin walled pla 3d printed parts using the taguchi method and grey relational analysis. Journal of Manufacturing and Materials Processing 4, 47. doi:10.3390/jmmp4020047.
- Assim et al. [2020] Assim, M., Obeidat, Q., Hammad, M., 2020. Software Defects Prediction using Machine Learning Algorithms, in: Proceedings of the International Conference on Data Analytics for Business and Industry: Way Towards a Sustainable Economy, IEEE. pp. 1–6. doi:10.1109/ICDABI51230.2020.9325677.
- Awan et al. [2021] Awan, U., Shamim, S., Khan, Z., Zia, N.U., Shariq, S.M., Khan, M.N., 2021. Big data analytics capability and decision-making: The role of data-driven insight on circular economy performance. Technological Forecasting and Social Change 168, 120766. doi:10.1016/j.techfore.2021.120766.
- Barrios and Romero [2019] Barrios, Romero, 2019. Decision Tree Methods for Predicting Surface Roughness in Fused Deposition Modeling Parts. Materials 12, 2574. doi:10.3390/ma12162574.
- Baumers et al. [2017] Baumers, M., Beltrametti, L., Gasparre, A., Hague, R., 2017. Informing additive manufacturing technology adoption: total cost and the impact of capacity utilisation. International Journal of Production Research 55, 6957–6970. doi:10.1080/00207543.2017.1334978.
- Berrar [2019] Berrar, D., 2019. Cross-Validation, in: Encyclopedia of Bioinformatics and Computational Biology. Academic Press, pp. 542–545. doi:10.1016/B978-0-12-809633-8.20349-X.
- Bikas et al. [2016] Bikas, H., Stavropoulos, P., Chryssolouris, G., 2016. Additive manufacturing methods and modelling approaches: a critical review. The International Journal of Advanced Manufacturing Technology 83, 389–405. doi:10.1007/s00170-015-7576-2.
- Böckin and Tillman [2019] Böckin, D., Tillman, A.M., 2019. Environmental assessment of additive manufacturing in the automotive industry. Journal of Cleaner Production 226, 977–987. doi:10.1016/j.jclepro.2019.04.086.
- Bourell et al. [2017] Bourell, D., Kruth, J.P., Leu, M., Levy, G., Rosen, D., Beese, A.M., Clare, A., 2017. Materials for additive manufacturing. CIRP annals 66, 659–681. doi:10.1016/j.cirp.2017.05.009.
- Buj-Corral et al. [2021] Buj-Corral, I., Bagheri, A., Sivatte-Adroer, M., 2021. Effect of Printing Parameters on Dimensional Error, Surface Roughness and Porosity of FFF Printed Parts with Grid Structure. Polymers 13, 1213. doi:10.3390/polym13081213.
- Carou et al. [2022] Carou, D., Sartal, A., Davim, J.P., 2022. Machine Learning and Artificial Intelligence with Industrial Applications. Springer. doi:10.1007/978-3-030-91006-8.
- Carvalho and Kazim [2022] Carvalho, G., Kazim, E., 2022. Themes in data strategy: thematic analysis of ‘A European Strategy for Data’ (EC). AI and Ethics 2, 53–63. doi:10.1007/s43681-021-00102-y.
- Chohan et al. [2016] Chohan, J.S., Singh, R., Boparai, K.S., 2016. Mathematical modelling of surface roughness for vapour processing of abs parts fabricated with fused deposition modelling. Journal of Manufacturing Processes 24, 161–169. doi:10.1016/j.jmapro.2016.09.002.
- Cui et al. [2020] Cui, Y., Kara, S., Chan, K.C., 2020. Manufacturing big data ecosystem: A systematic literature review. Robotics and Computer-Integrated Manufacturing 62, 101861. doi:10.1016/j.rcim.2019.101861.
- Demircioglu et al. [2013] Demircioglu, P., Bogrekci, I., Durakbasa, N.M., 2013. Micro scale surface texture characterization of technical structures by computer vision. Measurement 46, 2022–2028. doi:10.1016/j.measurement.2013.02.012.
- Efendi et al. [2023] Efendi, R., Nawi, N.M., Deris, M.M., Burney, S.A., et al., 2023. Cleansing of inconsistent sample in linear regression model based on rough sets theory. Systems and Soft Computing 5, 200046. doi:10.1016/j.sasc.2022.200046.
- Ehsanul Haque et al. [2019] Ehsanul Haque, M., Banerjee, D., Bikash Mishra, S., Kumar Nanda, B., 2019. A Numerical Approach to Measure the Surface Roughness of FDM Build Part. Materials Today: Proceedings 18, 5523–5529. doi:10.1016/j.matpr.2019.07.659.
- Ford et al. [2016] Ford, S., Mortara, L., Minshall, T., 2016. The Emergence of Additive Manufacturing: Introduction to the Special Issue. Technological Forecasting and Social Change 102, 156–159. doi:10.1016/j.techfore.2015.09.023.
- Golab et al. [2022] Golab, M., Massey, S., Moultrie, J., 2022. How generalisable are material extrusion additive manufacturing parameter optimisation studies? a systematic review. Heliyon , e11592doi:10.1016/j.heliyon.2022.e11592.
- Gu et al. [2018] Gu, G.X., Chen, C.T., Buehler, M.J., 2018. De novo composite design based on machine learning algorithm. Extreme Mechanics Letters 18, 19–28. doi:10.1016/j.eml.2017.10.001.
- Gupta et al. [2022] Gupta, A.K., Krishnanand, Taufik, M., 2022. The effect of process parameters in material extrusion processes on the part surface quality: A review. Materials Today: Proceedings 50, 1234–1242. doi:10.1016/j.matpr.2021.08.110.
- Haghighi and Li [2018] Haghighi, A., Li, L., 2018. Study of the relationship between dimensional performance and manufacturing cost in fused deposition modeling. Rapid Prototyping Journal 24, 395–408. doi:10.1108/RPJ-11-2016-0177.
- Hällgren et al. [2016] Hällgren, S., Pejryd, L., Ekengren, J., 2016. Additive Manufacturing and High Speed Machining -cost Comparison of short Lead Time Manufacturing Methods. Procedia CIRP 50, 384–389. doi:10.1016/j.procir.2016.05.049.
- Hey et al. [2009] Hey, A.J., Tansley, S., Tolle, K.M., et al., 2009. The fourth paradigm: data-intensive scientific discovery. volume 1. Microsoft research Redmond, WA. doi:10.1109/JPROC.2011.2155130.
- Hooda et al. [2021] Hooda, N., Chohan, J.S., Gupta, R., Kumar, R., 2021. Deposition angle prediction of Fused Deposition Modeling process using ensemble machine learning. ISA Transactions 116, 121–128. doi:10.1016/j.isatra.2021.01.035.
- Jiang et al. [2022a] Jiang, M., Mukherjee, T., Du, Y., DebRoy, T., 2022a. Superior printed parts using history and augmented machine learning. npj Computational Materials 8, 1–10. doi:10.1038/s41524-022-00866-9.
- Jiang et al. [2022b] Jiang, S., Hu, K., Zhan, Y., Zhao, C., Li, X., 2022b. Theoretical and Experimental Investigation on the 3D Surface Roughness of Material Extrusion Additive Manufacturing Products. Polymers 14, 293. doi:10.3390/polym14020293.
- Kairn et al. [2021] Kairn, T., Talkhani, S., Charles, P.H., Chua, B., Lin, C.Y., Livingstone, A.G., Maxwell, S.K., Poroa, T., Simpson-Page, E., Spelleken, E., Vo, M., Crowe, S.B., 2021. Determining tolerance levels for quality assurance of 3D printed bolus for modulated arc radiotherapy of the nose. Physical and Engineering Sciences in Medicine 44, 1187–1199. doi:10.1007/s13246-021-01054-7.
- Kandananond [2021] Kandananond, K., 2021. Surface roughness prediction of FFF-fabricated workpieces by artificial neural network and Box–Behnken method. International Journal of Metrology and Quality Engineering 12, 17. doi:10.1051/ijmqe/2021014.
- Kozlov [2023] Kozlov, M., 2023. ’disruptive’science has declined-and no one knows why. Nature , 1–1doi:10.1038/d41586-022-04577-5.
- Lalehpour and Barari [2018] Lalehpour, A., Barari, A., 2018. A more accurate analytical formulation of surface roughness in layer-based additive manufacturing to enhance the product’s precision. The International Journal of Advanced Manufacturing Technology 96, 3793–3804. doi:10.1007/s00170-017-1448-x.
- Leal et al. [2017] Leal, R., Barreiros, F.M., Alves, L., Romeiro, F., Vasco, J.C., Santos, M., Marto, C., 2017. Additive manufacturing tooling for the automotive industry. The International Journal of Advanced Manufacturing Technology 92, 1671–1676. doi:10.1007/s00170-017-0239-8.
- Li et al. [2019a] Li, L., Haghighi, A., Yang, Y., 2019a. Theoretical modelling and prediction of surface roughness for hybrid additive–subtractive manufacturing processes. IISE Transactions 51, 124–135. doi:10.1080/24725854.2018.1458268.
- Li et al. [2019b] Li, Z., Zhang, Z., Shi, J., Wu, D., 2019b. Prediction of surface roughness in extrusion-based additive manufacturing with machine learning. Robotics and Computer-Integrated Manufacturing 57, 488–495. doi:10.1016/j.rcim.2019.01.004.
- Liu et al. [2021] Liu, S., Stebner, A.P., Kappes, B.B., Zhang, X., 2021. Machine learning for knowledge transfer across multiple metals additive manufacturing printers. Additive Manufacturing 39, 101877. doi:10.1016/j.addma.2021.101877.
- Mendricky and Fris [2020] Mendricky, R., Fris, D., 2020. Analysis of the accuracy and the surface roughness of fdm/fff technology and optimisation of process parameters. Tehnicki vjesnik - Technical Gazette 27. doi:10.17559/TV-20190320142210.
- Messimer et al. [2019] Messimer, S., Pereira, T., Patterson, A., Lubna, M., Drozda, F., 2019. Full-Density Fused Deposition Modeling Dimensional Error as a Function of Raster Angle and Build Orientation: Large Dataset for Eleven Materials. Journal of Manufacturing and Materials Processing 3, 1–27. doi:10.3390/jmmp3010006.
- Morampudi et al. [2021] Morampudi, P., Ramana, V.V., Prabha, K.A., Swetha, S., Rao, A.B., 2021. 3D-printing analysis of surface finish. Materials Today: Proceedings 43, 587–592. doi:10.1016/j.matpr.2020.12.085.
- Moreno et al. [2021] Moreno, R., Carou, D., Carazo-Álvarez, D., Gupta, M.K., 2021. Statistical models for the mechanical properties of 3D printed external medical aids. Rapid Prototyping Journal 27, 176–186. doi:10.1108/RPJ-02-2020-0033.
- Pal and Bharati [2019] Pal, M., Bharati, P., 2019. Introduction to Correlation and Linear Regression Analysis, in: Applications of Regression Techniques. Springer, pp. 1–18. doi:10.1007/978-981-13-9314-3_1.
- Panda et al. [2015] Panda, B.N., Bahubalendruni, M.V.A.R., Biswal, B.B., 2015. A general regression neural network approach for the evaluation of compressive strength of fdm prototypes. Neural Computing and Applications 26, 1129–1136. doi:10.1007/s00521-014-1788-5.
- Panda et al. [2017] Panda, B.N., Bahubalendruni, R.M., Biswal, B.B., Leite, M., 2017. A cad-based approach for measuring volumetric error in layered manufacturing. Proceedings of the Institution of Mechanical Engineers, Part C: Journal of Mechanical Engineering Science 231, 2398–2406. doi:10.1177/0954406216634746.
- Paul and Anand [2015] Paul, R., Anand, S., 2015. Optimization of layered manufacturing process for reducing form errors with minimal support structures. Journal of Manufacturing Systems 36, 231–243. doi:10.1016/j.jmsy.2014.06.014.
- Peng and Yan [2018] Peng, T., Yan, F., 2018. Dual-objective Analysis for Desktop FDM Printers: Energy Consumption and Surface Roughness. Procedia CIRP 69, 106–111. doi:10.1016/j.procir.2017.11.084.
- Pérez et al. [2018] Pérez, M., Medina-Sánchez, G., García-Collado, A., Gupta, M., Carou, D., 2018. Surface Quality Enhancement of Fused Deposition Modeling (FDM) Printed Samples Based on the Selection of Critical Printing Parameters. Materials 11, 1382. doi:10.3390/ma11081382.
- Rahmati and Vahabli [2015] Rahmati, S., Vahabli, E., 2015. Evaluation of analytical modeling for improvement of surface roughness of fdm test part using measurement results. The International Journal of Advanced Manufacturing Technology , 823–829doi:10.1007/s00170-015-6879-7.
- Rezvani Ghomi et al. [2021] Rezvani Ghomi, E., Khosravi, F., Neisiany, R.E., Singh, S., Ramakrishna, S., 2021. Future of additive manufacturing in healthcare. Current Opinion in Biomedical Engineering 17, 100255. doi:10.1016/j.cobme.2020.100255.
- Saad et al. [2022] Saad, M.S., Nor, A.M., Rahim, I.A., Syahruddin, M.A., Darus, I.Z.M., 2022. Optimization of fdm process parameters to minimize surface roughness with integrated artificial neural network model and symbiotic organism search. Neural Computing and Applications 34, 17423–17439. doi:10.1007/S00521-022-07370-7/TABLES/11.
- Saengchairat et al. [2017] Saengchairat, N., Tran, T., Chua, C.K., 2017. A review: additive manufacturing for active electronic components. Virtual and Physical Prototyping 12, 31–46. doi:10.1080/17452759.2016.1253181.
- Sangeorzan [2020] Sangeorzan, L., 2020. Effectiveness analysis of ZeroR and J48 classifiers using Weka toolkit. Bulletin of the Transilvania University of Brasov. Series III: Mathematics and Computer Science 12, 481–486. doi:10.31926/but.mif.2019.12.61.2.25.
- Schonlau and Zou [2020] Schonlau, M., Zou, R.Y., 2020. The random forest algorithm for statistical learning. The Stata Journal: Promoting communications on statistics and Stata 20, 3–29. doi:10.1177/1536867X20909688.
- Shu and Ye [2022] Shu, X., Ye, Y., 2022. Knowledge discovery: Methods from data mining and machine learning. Social Science Research , 102817doi:10.1016/j.ssresearch.2022.102817.
- Taşdemir [2021] Taşdemir, V., 2021. Investigation of Dimensional Integrity and Surface Quality of Different Thin-Walled Geometric Parts Produced via Fused Deposition Modeling 3D Printing. Journal of Materials Engineering and Performance 30, 3381–3387. doi:10.1007/s11665-021-05809-x.
- Thongpeth et al. [2021] Thongpeth, W., Lim, A., Wongpairin, A., Thongpeth, T., Chaimontree, S., 2021. Comparison of linear, penalized linear and machine learning models predicting hospital visit costs from chronic disease in Thailand. Informatics in Medicine Unlocked 26, 100769. doi:10.1016/j.imu.2021.100769.
- Tripathi and Singla [2021] Tripathi, A., Singla, R., 2021. Surface Roughness Prediction of 3D Printed Surface Using Artificial Neural Networks, in: Lecture Notes in Mechanical Engineering. Springer, pp. 109–120. doi:10.1007/978-981-15-9956-9_11.
- Umaras and Tsuzuki [2017] Umaras, E., Tsuzuki, M.S., 2017. Additive Manufacturing - Considerations on Geometric Accuracy and Factors of Influence. IFAC-PapersOnLine 50, 14940–14945. doi:10.1016/j.ifacol.2017.08.2545.
- Uskov et al. [2021] Uskov, V.L., Bakken, J.P., Putta, P., Krishnakumar, D., Ganapathi, K.S., 2021. Smart education: Predictive analytics of student academic performance using machine learning models in weka and dataiku systems, in: Proceedings of the Smart Innovation, Systems and Technologies Conference, pp. 3–17. doi:10.1007/978-981-16-2834-4_1.
- Vahabli and Rahmati [2016] Vahabli, E., Rahmati, S., 2016. Application of an rbf neural network for fdm parts’ surface roughness prediction for enhancing surface quality. International Journal of Precision Engineering and Manufacturing 17, 1589–1603. doi:10.1007/s12541-016-0185-7.
- Vambol et al. [2021] Vambol, O., Kondratiev, A., Purhina, S., Shevtsova, M., 2021. Determining the parameters for a 3D-printing process using the fused deposition modeling in order to manufacture an article with the required structural parameters. Eastern-European Journal of Enterprise Technologies 2, 70–80. doi:10.15587/1729-4061.2021.227075.
- Wang et al. [2019] Wang, P., Zou, B., Ding, S., 2019. Modeling of surface roughness based on heat transfer considering diffusion among deposition filaments for FDM 3D printing heat-resistant resin. Applied Thermal Engineering 161, 114064. doi:10.1016/j.applthermaleng.2019.114064.
- Westphal and Seitz [2022] Westphal, E., Seitz, H., 2022. Machine learning for the intelligent analysis of 3D printing conditions using environmental sensor data to support quality assurance. Additive Manufacturing 50, 102535. doi:10.1016/j.addma.2021.102535.
- Wu et al. [2019] Wu, D., Wei, Y., Terpenny, J., 2019. Predictive modelling of surface roughness in fused deposition modelling using data fusion. International Journal of Production Research 57, 3992–4006. doi:10.1080/00207543.2018.1505058.
- Yang et al. [2020] Yang, H., Ji, F., Li, Z., Tao, S., 2020. Preparation of hydrophobic surface on pla and abs by fused deposition modeling. Polymers 12, 1539. doi:10.3390/polym12071539.
- Zadpoor and Malda [2017] Zadpoor, A.A., Malda, J., 2017. Additive Manufacturing of Biomaterials, Tissues, and Organs. Annals of Biomedical Engineering 45, 1–11. doi:10.1007/s10439-016-1719-y.
- Zillner et al. [2021] Zillner, S., Gomez, J.A., García Robles, A., Hahn, T., Bars, L.L., Petkovic, M., Curry, E., 2021. Data economy 2.0: From big data value to ai value and a european data space, in: The Elements of Big Data Value. Springer, Cham, pp. 379–399. doi:10.1007/978-3-030-68176-0\_16.