Revealing the learning process in reinforcement learning agents through attention-oriented metrics
Abstract
The learning process of a reinforcement learning (RL) agent remains poorly understood beyond the mathematical formulation of its learning algorithm. To address this gap, we introduce attention-oriented metrics (ATOMs) to investigate the development of an RL agent’s attention during training. We tested ATOMs on three variations of a Pong game, each designed to teach the agent distinct behaviours, complemented by a behavioural assessment. Our findings reveal that ATOMs successfully delineate the attention patterns of an agent trained on each game variation, and that these differences in attention patterns translate into differences in the agent’s behaviour. Through continuous monitoring of ATOMs during training, we observed that the agent’s attention developed in phases, and that these phases were consistent across games. Finally, we noted that the agent’s attention to its paddle emerged relatively late in the training and coincided with a marked increase in its performance score. Overall, we believe that ATOMs could significantly enhance our understanding of RL agents’ learning processes, which is essential for improving their reliability and efficiency.
1 Introduction
Understanding the learning process of a deep Reinforcement Learning (RL) agent is critical for improving its transparency and performance. However, the mechanisms unfolding during an agent’s learning phase remain largely unknown beyond the mathematical formulations of its algorithm and optimisation process. Therefore, new metrics are needed to provide insights into what an RL agent learns about its environment and its task during training.
Currently, the primary indicator of an agent’s learning progress is its performance score derived from task-specific rewards. While necessary to optimize an agent Watkins and Dayan [1992], Konda and Tsitsiklis [1999], Mnih et al. [2013], this performance score provides a very limited view of an agent’s development during learning and fails to explain or predict certain behaviours in the testing phase. For instance, RL agents have been observed exploiting faulty reward functions Clark and Amodei [2016] while achieving high performance scores during training, or showing significant divergence during the test phase despite similar training performances Cobbe et al. [2019]. These examples underscore the limitations of this metric in fully understanding an agent’s behaviours and development.
In this context, explainable AI (XAI) methods can complement the limitation of the performance score by providing an insight into an agent understanding of its environment and task through the explanation of its decisions Verma et al. [2018], Shu et al. [2017]. However, the explanation format given by these methods - which may be a decision tree Liu et al. [2019], a structural causal model Madumal et al. [2020] or a set of linguistic rules Hein et al. [2017] - is often too complex to be tracked during learning. Methods focused on saliency maps on the other hand, are easier to compute and are more versatile but are mostly used in a qualitative way to explain the behaviour of trained agent Zeiler and Fergus [2014], Zhou et al. [2016], Weitkamp et al. [2018], Selvaraju et al. [2017]. As a results XAI techniques do not give information during the learning phase of an agent.
In this work we introduce attention-oriented metrics (ATOMs) to gain insight into an agent’s learning process through the development of its attention. ATOMs is derived from saliency maps and combine the traceability of the performance score metric with the explanatory power of XAI and quantify an agent’s attention on the objects within its environment. Specifically, ATOMs encompass two levels of description:
-
•
the ranked attention on individual objects (hierarchical-attention), and
-
•
the attention on combinations of such objects (combinatorial-attention).
To systematically evaluate ATOMs’ ability to give information about what an RL agent has learned, we created three variation of a Pong game. Each variation required the agent to learn distinct behaviour. In addition to these games, we designed a behavioural experiment to test if the agent’s attention described by ATOMs translated into their observed behaviour Atrey et al. [2019].
Our main contributions are:
-
•
We introduce ATOMs that quantify an agent’s attention to objects in its environment, using Hierarchical-attention and Combinatorial-attention metrics.
-
•
We present three variation of the Pong game, each designed to induce distinct behaviour in agents.
-
•
We show that ATOMs can provide insights into what an agent has learned about its game and that successfully trained agents developed similar, game-specific, attention patterns.
-
•
We used ATOMs to follow the development of an agent’s attention during its training and identified distinct phases of attention patterns common to all agents in our experiments. Additionally, we found that the agent’s self-attention developed late in the learning and coincided with a significant increase in its performance score.
2 Related work
Explainable RL
Explainable RL methods have been developed to elucidate the decision-making process in RL agents. Some methods aim to enhance the interpretability of the policy an agent has learned. This is achieved by encoding the policy in a human-understandable form, such as a decision tree Liu et al. [2019], Coppens et al. [2019], Roth et al. [2019], a set of linguistic rules Hein et al. [2017] or a domain specific (programming) language Verma et al. [2018]. Other methods decompose a complex policy into several simpler ones such as in Shu et al. [2017] where the general policy is decomposed into local policies corresponding to elementary skills that have been manually annotated by humans. The global, more complex policy is then employed to determine which local policy to apply along the agent’s trajectory. Alternative techniques propose a justification for the model actions using structural causal models Madumal et al. [2020] or a justification for the general policy with a language understandable by humans Hayes and Shah [2017], van der Waa et al. [2018]. Last but not least, a number of methods rely on visual explanations of an agent’s behaviour. These include projection methods Zahavy et al. [2016] that use the agent’s neural population activity to display the pattern learned by its network. Whilst previous studies on saliency maps tend to focus on fully trained models, we propose using them to study the learning dynamics that occur during model training.
Saliency maps
Saliency maps have widely been used to explain predictions of deep image classifiers in computer vision, but have been increasingly used as an exploratory tool for RL models Zeiler and Fergus [2014], Zhou et al. [2016], Weitkamp et al. [2018], Selvaraju et al. [2017]. There are two main types of saliency maps: gradient based Greydanus et al. [2018] and perturbation-based Puri et al. [2019] methods. Gradient-based methods estimate the significance of each input pixel on the network’s decision-making process by analyzing the gradient with respect to these pixels. In contrast, perturbation-based methods estimate this influence by individually altering each pixel and observing the resultant effect on the network’s choice of action. Nonetheless, perturbation-based methods necessitate multiple forward passes for each input, which rend them significantly computationally expensive Xing et al. [2023]. Gradient-based methods are faster, but are also subject to noise. We chose Layer-wise Relevance Propagation (LRP) Bach et al. [2015], Lapuschkin et al. [2019], as it can be computed efficiently, while overcoming the noise problem many gradient methods share.
3 Methods
3.1 Experimental setup
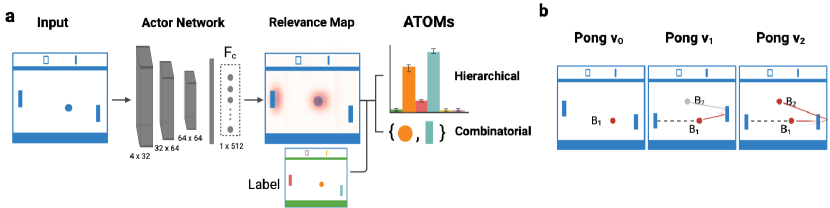
Data were recorded in actor-critic agents (A2C; Konda and Tsitsiklis [1999]) from the Stable Baseline 3 repository Raffin et al. [2021]. We study the actor network of each agent, responsible for the choice of action. This network is composed of three convolutional layers (size 4x32, 32x64 64x64) followed by a linear layer (size 1x512) that we will refer to as (Fig 1 a) and a final output layer. Throughout the remainder of this paper, we will use the terms ’agent’ and ’actor network’ synonymously. The agent’s strategy was derived from the activity of neurons in the linear layer (). This layer is located just before the output layer and encompasses the final world-model on which the agent choose its action. ATOMs are computed from this layer.
3.2 Attention-Oriented Metrics (ATOMs)
ATOMs are composed of two metrics evaluating different aspects of an agent’s attention: the hierarchical-attention and the combinatorial-attention metrics. The hierarchical-attention evaluates the degree of attention given to an individual object compared to the other objects. In contrast, the combinatorial-attention evaluates how much attention an agent pays simultaneously to different combinations of objects. This simultaneous attention could be an indicator of a latent variable encoded by the neuron. Here we characterize the Pong game by its constituent objects: the paddles of the agent and its opponent, their respective displayed score, both balls (B1 and B2) and the walls. Figure 1 a illustrates the process to extract these two metrics.
Both metrics composing ATOMs are derived from the attention of the neurons in the layer that are relevant to an action. Specifically, this attention is measured by computing Layer-Wise Relevance Propagation (LRP; Bach et al. [2015], Lapuschkin et al. [2019]). For a model output (here at the action node), LRP calculates a relevance score for each neuron in the previous layer. Due to its conservation property, relevance can be propagated layer-by-layer up until the input (here images) resulting in a relevance map per layer. To generate input images (consisting of pixels p) used for the LRP analysis, we let an agent play the game for ten episodes. Subsequently, we filtered the input to ensure all objects are present and have a spacing of 10 pixels between them to prevent overlap. We then sampled a total of 200 frames and automatically labeled the objects within each frame. Let and be the original and the labeled version of the input set, respectively. We focus on the attention of neurons influencing action choices, identifying relevant neurons in the layer using LRP.
For each input, :
-
1.
Calculate the relevance scores and select neurons that account for 90% of the total relevance . This filtering step is used to avoid noise components and decrease ATOMs computational time.
-
2.
Generate relevance maps at the model input for each neuron
-
3.
Identify the objects highlighted by the relevance maps.
Hierarchical-attention
We first characterize an agent’s attention by identifying which objects are most important to the network’s decision-making. We do this by using a hierarchical-attention metric , to measure the importance of each object. For objects , the hierarchical-attention metric and its components are defined as follows:
| (1) | ||||
| (2) |
and denotes all pixels .
Combinatorial-attention
We then incorporate the combinations of objects that an agent simultaneously attends to by using the combinatorial-attention metric . For a subset of objects , the combinatorial-attention metric is defined as follows:
| (3) | ||||
| (4) |
where with and .
An illustration of different combination of objects looked at by neurons in the layer can be found in appendix LABEL:combinatorial_attention_example (figure LABEL:fig:example_combin_attention). The impact of the threshold on the results of the combinatorial-attention metric is discussed in appendix LABEL:threhold_value_combinatorial_attention.
3.3 Measurements of ATOMs during training
The frequency of evaluation (), denoting how often the metrics were extracted, was chosen for each game based on the training dynamics observed. We set for version , for version and for version . The choice of for each game was influenced by the number of epochs required for the network to demonstrate an increase in training score in the respective game. It’s important to note that different frequencies could be selected based on the desired granularity for studying the evolution of the metrics. Our selected frequencies aimed to balance the need for detailed metric tracking with the practical constraints of computational resources and training time.
3.4 Designing Pong variations
We implemented three different variations of the Pong game: v0, v1, and v2. Each variant builds on the classic Pong gameplay where two agents compete with each other, each controlling a paddle to score points by returning the ball to the opponent’s side. A point is awarded when the ball passes the opponent’s paddle and an episode terminate when a player accumulates 21 points. For training, a reward of +1 or -1 is assigned depending on which side scores. v0 maintains traditional gameplay. In v1, two balls are present (B1 and B2), but only B1 counts for scoring while B2 is used as a distraction. In v2, both B1 and B2 are integral, but B2 only interacts with the agent’s paddle, awarding +1 for a rebound and -1 if it passes the paddle. Additionally, in v2, the agent must reach 41 points, while the opponent needs only 21 to win. Figure 1b illustrates the three game variations. Details regarding the game implementation and the rules can be found in Appendix LABEL:Game.
3.5 Evaluating agent behaviour: Dual Ball Discrimination Test
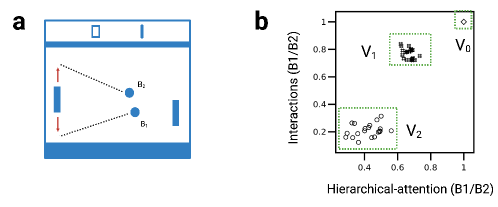
A major difference between the three game variations is the importance of ball B1 and ball B2. As the latter only yield rewards in v2 we expect the behaviour of the agents toward B2 to change between games. To quantitatively evaluate agent behaviour, we implemented the Dual Ball Discrimination Test, wherein the agent is put in a situation enforcing a choice between both balls. This experiment involved generating 100 unique trajectories from various initial positions and velocities, designed such that both balls reach the agent’s x-coordinate simultaneously while maintaining a separation exceeding the length of the paddle. Consequently, the agent can interact with only one of the balls and we can analyse any systematic preference for B1 or B2. An illustration of the test is displayed figure 3 a.
4 Experiments
4.1 Evaluation of ATOMs
We evaluated the capacity of ATOMs to provide relevant information about what an agent has learned. To this end, we computed ATOMs on 50 fully trained agents for each game variation: v0, v1, v2. Agents were trained using different random initialization (details regarding agent training protocols are provided in LABEL:RL-training-procedure).
Different game variations induce game-specific attention pattern.
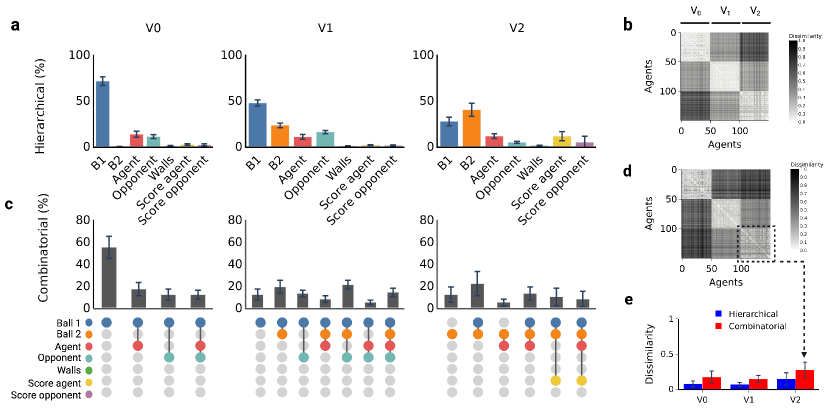
The hierarchical-attention (figure 2 a) shows that trained agents attended to the expected aspects of the game. Notably, agents trained on v0 and v1 payed more attention to ball B1 (the only ball that brings a reward) while agents trained on v2 (in which both balls yield rewards) showed a more nuanced attention pattern with a slight preference for the ball B2. Across all game variations, the second highest attention was consistently directed towards the agent and opponent paddles. Interestingly, agents from v2 developed attention to the score displayed on the game screen as well.
The combinatorial-attention (figure 2 c) further breaks down the attention of the neurons in the layer into combination of objects. We found a consistent common pattern across game variations with attention to either the ball(s) alone or to a combination of ball(s) and the agent’s paddle or ball(s) and the opponent’s paddle. Figures 2 b,d show that successfully trained agent developed similar attention patterns as the similarity in both ATOMs metrics are higher within game variation. Interestingly, we observed greater variability in the combinatorial-attention metrics (figure 2 e) in variation v2 compared to v1 and v0 indicating that agents may develop more diverse attention patterns in game variations that are more complex.
Attention patterns are consistent with agents’ behaviour.
As shown in figure 2 a, ATOMs indicate that agents trained on v1 still paid attention to B2 suggesting that these agents had not learned to ignore the ball completely. To investigate this further, we examined whether the attention directed towards B1 and B2 reflected the agent’s behaviour, which we defined here as the relative interaction of the agent with each of the balls. Specifically, we assessed whether increased attention to one ball over the other reflected a preference for interacting with that particular ball. To study this experimentally, we exposed agents trained on game variation v1 or v2 to the Dual Ball Discrimination Test 3.5 to measure how often the agent interacted with each ball (figure 3 a). Figure 3 b shows he proportion of B1 interactions relative to B2 interactions against the importance given to B1 relative to B2. Distinct clusters emerge that correspond to variations v1 and v2. This shows that the relative attention given to each ball indeed reflects how an agent behaves towards them (in terms of preferred interaction). Furthermore, the cluster associated with v1 shows that these agents still interact with B2, confirming the hypothesis driven by the ATOMs metrics that agents in v1 had not learned to ignore B1 completely.
As mentioned, agents trained on v2 developed an attention to the score displayed on the screen (figure 2 a). This prompted us to analyse the impact of the displayed score on the agent’s behaviour. While this may be an artifact of an increased spatial attention in the more complex game variant, the results of the Dual Ball Discrimination Test reveal that the displayed scores indeed influenced the agent’s choice to hit B1 or B2. Distinct patterns of influence were observed among agents. For instance, some agents exhibited a preference for B1 until their displayed score approached 40 points, at which point they tended to choose B2 (the game terminates when the agent reaches 41 points). Other agents shifted their preference from B1 to B2 once the displayed score of the opponent exceeded 10 points. Further details of the experiments and results are provided in Appendix LABEL:impact_score_choice_v2.
4.2 Evolution of agents’ attention during learning
We then monitored the development of the agents’ attention during their training using ATOMs.
.
Application of ATOMs during training
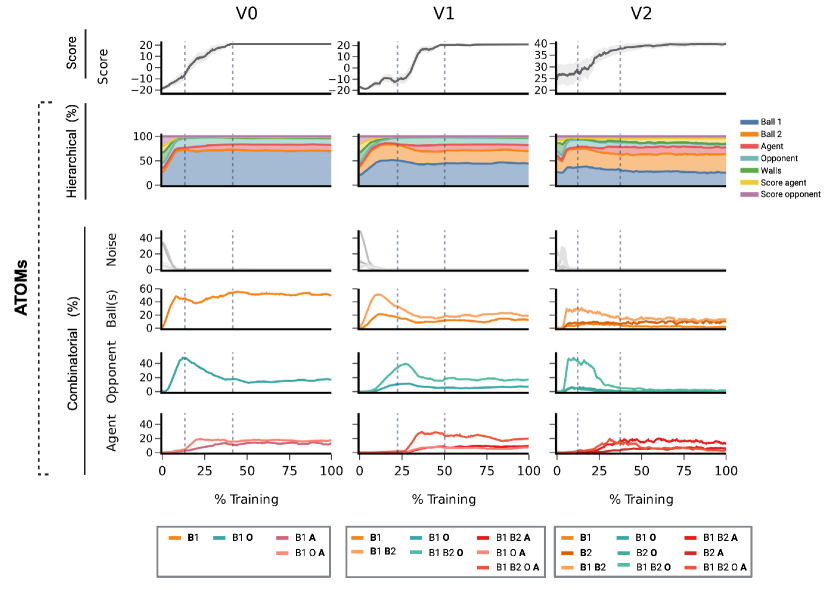
Figure 4 illustrates ATOMs for three agents trained on v0, v1 and v2 alongside their performance during training. The results reveals that most pronounced changes in the hierarchical metric occurred at the initial stage of the training preceding a marked enhancement in the agent’s performance. While the hierarchical metric indicates the overall importance of an object, the combinatorial metrics dissect this information further by revealing to which combination of objects an agent pays attention to. In this figure, we categorized the plots of the combinatorial metrics into four major groups:
-
•
combinations involving only B1 and B2 (Ball(s)),
-
•
combinations involving the balls and the opponent (Opponent),
-
•
combinations involving the agent (Agent),
-
•
combinations of objects only present during the initial learning phase (Noise).
The evolution of the combinatorial-attention during training shows how the attention of an agent gets progressively selective to specific subsets of objects. For example, by looking at the evolution of the attention to the ball(s) for the games v1 and v2, one can see that the agent’s attention started by including both ball objects (B1, B2). Then as the training progress its attention progressively isolated the individual balls (B1 in v1 and B1 and B2 in v2).
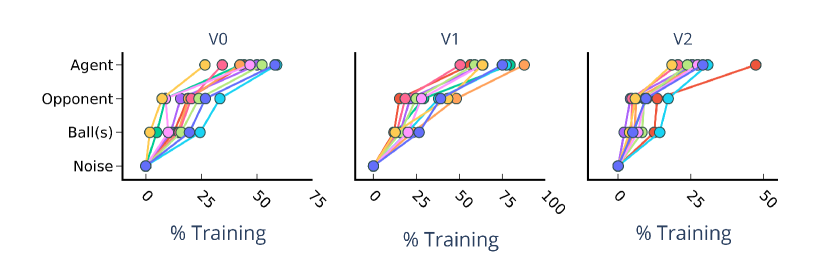
Attention patterns develop in phases during learning
The four categories defined above appeared to follow a timeline consistent amongst versions v0, v1 and v2 (Figure 4 ). We will therefore refer to these categories as phases. In the first phase the attention was non-selective and spread among objects (Noise phase). In the following phase the agents focused most attention upon the moving ball(s). Subsequently, the agents also paid attention to the opponent. Finally, in the "Agent phase", agents payed attention to themselves in relation to the other objects. Interestingly, this phase was consistently the last one to emerge and coincide with a marked increase in the agents’ performance scores (indicated by the two dotted lines in figure 5) 111Agents trained on game v2 developed an additional attention component that integrated the scores of the agent and/or of the opponent (results in appendix LABEL:fig:learning_v2). To test if theses phases were consistent among all agents, we repeated this analysis with ten agents per version and measured their phase onsets ( figure 5). We defined the onset of a phase as the point at which the first component composing this phase exceeds 25% of its maximum value. This onset was then expressed as a percentage of the total training period for a given agent, with the total training period being the time taken for an agent to reach its maximum score. We found that the timeline of these attention phases were consistent across models and game versions.
5 Discussion
The learning process of an RL agent is poorly understood beyond the mathematical equations of its learning algorithm. In this study we delve deeper into the learning phase of an agent by analyzing the development of its attention. To this end, we introduce Attention-Oriented Metrics (ATOMs) designed to quantitatively assess an agent’s attention. We evaluated ATOMs’ ability to give information about what an RL agent has learned, by implementing three versions of a Pong game, each requiring the agent to learn distinct behaviour.
Our results demonstrated that ATOMs successfully delineate the different attention patterns that each game version induces. More specifically, we observed that successfully trained agents exhibited consistent, game-specific attention patterns. Additionally, behavioural tests revealed that these divergent attention patterns corresponded to observable differences in agent behaviour. Through continuous monitoring of ATOMs during training, we identified distinct, sequentially ordered developmental phases in its attention. Notably, an agent’s attention to itself emerged relatively late in the learning process coinciding with an increase in its performance score. We suggest that an agent’s attention is guided by the association of objects’ movements - or more generally changes in the state of an object- with reward feedback. Indeed, in our three games, the most straightforward correlation between an object’s movement and a feedback reward involves the movement of the ball(s), either by passing the agent side or the opponent’s side, or by hitting the agent’s paddle (for B2 in version v2). Since the opponent is designed to score points, its movement is correlated with future rewards as well. Conversely, as the agent learns to play pong its actions are less likely to influence the feedback reward. This difference could explain the agent’s initial focus on the ball(s) and the opponent and the late focus to the paddle it controls.
While ATOMs offer valuable insights about RL agent development during learning, they have limitations that could be addressed in future work. Indeed, ATOMs are object-based, which, while reflecting our human understanding of the games, may limit their explanatory power. Alternative metrics based on an agent’s attention, not limited to the object level, could reveal more subtle abstractions or reasoning underlying an agents’ decision-making processes. Additionally, ATOMs requires image labeling and are best suited to environments with a limited set of objects, as its combinatorial-attention component grows polynomially with the number of objects potentially diminishing its explanatory power.
Despite these constraints, we believe that ATOMs can enhance our understanding of the learning process of RL agents, and offer several potential applications. For instance, monitoring an agent’s attention could ensure its focus on the pertinent objects (either during training or online) particularly in safety-critical applications. It could also facilitate the early detection of flawed policies or exploitation of bugs in an environment which might not be evident through performance scores alone. For example, in our experiments, agents trained on v1 had not learn to fully ignore the irrelevant ball despite achieving an optimal performance score. This suggest potential refinement in the environment design or in the reward function. Thus, accessing an agent’ attention during its training could accelerate the debugging of the environments and reward functions.
Acknowledgments
N.S., C.B. and S.H. are supported by BMBF (Federal Ministry of Education and Research) through ACONITE (01IS22065) and the Center for Scalable Data Analytics and Artificial Intelligence (ScaDS.AI.) Dresden/Leipzig. C.B. is also supported by the Max Planck IMPRS NeuroCom Doctoral Program. The figures were created using BioRender.com.
References
- Watkins and Dayan [1992] Christopher JCH Watkins and Peter Dayan. Q-learning. Machine learning, 8:279–292, 1992.
- Konda and Tsitsiklis [1999] Vijay Konda and John Tsitsiklis. Actor-critic algorithms. Advances in neural information processing systems, 12, 1999.
- Mnih et al. [2013] Volodymyr Mnih, Koray Kavukcuoglu, David Silver, Alex Graves, Ioannis Antonoglou, Daan Wierstra, and Martin Riedmiller. Playing atari with deep reinforcement learning. arXiv preprint arXiv:1312.5602, 2013.
- Clark and Amodei [2016] Jack Clark and Dario Amodei. Faulty reward functions in the wild. Internet: https://blog. openai. com/faulty-reward-functions, 2016.
- Cobbe et al. [2019] Karl Cobbe, Oleg Klimov, Chris Hesse, Taehoon Kim, and John Schulman. Quantifying generalization in reinforcement learning. In International Conference on Machine Learning, pages 1282–1289. PMLR, 2019.
- Verma et al. [2018] Abhinav Verma, Vijayaraghavan Murali, Rishabh Singh, Pushmeet Kohli, and Swarat Chaudhuri. Programmatically interpretable reinforcement learning. In International Conference on Machine Learning, pages 5045–5054. PMLR, 2018.
- Shu et al. [2017] Tianmin Shu, Caiming Xiong, and Richard Socher. Hierarchical and interpretable skill acquisition in multi-task reinforcement learning. arXiv preprint arXiv:1712.07294, 2017.
- Liu et al. [2019] Guiliang Liu, Oliver Schulte, Wang Zhu, and Qingcan Li. Toward interpretable deep reinforcement learning with linear model u-trees. In Machine Learning and Knowledge Discovery in Databases: European Conference, ECML PKDD 2018, Dublin, Ireland, September 10–14, 2018, Proceedings, Part II 18, pages 414–429. Springer, 2019.
- Madumal et al. [2020] Prashan Madumal, Tim Miller, Liz Sonenberg, and Frank Vetere. Explainable reinforcement learning through a causal lens. In Proceedings of the AAAI conference on artificial intelligence, volume 34, pages 2493–2500, 2020.
- Hein et al. [2017] Daniel Hein, Alexander Hentschel, Thomas Runkler, and Steffen Udluft. Particle swarm optimization for generating interpretable fuzzy reinforcement learning policies. Engineering Applications of Artificial Intelligence, 65:87–98, 2017.
- Zeiler and Fergus [2014] Matthew D Zeiler and Rob Fergus. Visualizing and understanding convolutional networks. In European conference on computer vision, pages 818–833. Springer, 2014.
- Zhou et al. [2016] Bolei Zhou, Aditya Khosla, Agata Lapedriza, Aude Oliva, and Antonio Torralba. Learning deep features for discriminative localization. In Proceedings of the IEEE conference on computer vision and pattern recognition, pages 2921–2929, 2016.
- Weitkamp et al. [2018] Laurens Weitkamp, Elise van der Pol, and Zeynep Akata. Visual rationalizations in deep reinforcement learning for atari games. In Benelux Conference on Artificial Intelligence, pages 151–165. Springer, 2018.
- Selvaraju et al. [2017] Ramprasaath R Selvaraju, Michael Cogswell, Abhishek Das, Ramakrishna Vedantam, Devi Parikh, and Dhruv Batra. Grad-cam: Visual explanations from deep networks via gradient-based localization. In Proceedings of the IEEE international conference on computer vision, pages 618–626, 2017.
- Atrey et al. [2019] Akanksha Atrey, Kaleigh Clary, and David Jensen. Exploratory not explanatory: Counterfactual analysis of saliency maps for deep reinforcement learning. arXiv preprint arXiv:1912.05743, 2019.
- Coppens et al. [2019] Youri Coppens, Kyriakos Efthymiadis, Tom Lenaerts, Ann Nowé, Tim Miller, Rosina Weber, and Daniele Magazzeni. Distilling deep reinforcement learning policies in soft decision trees. In Proceedings of the IJCAI 2019 workshop on explainable artificial intelligence, pages 1–6, 2019.
- Roth et al. [2019] Aaron M Roth, Nicholay Topin, Pooyan Jamshidi, and Manuela Veloso. Conservative q-improvement: Reinforcement learning for an interpretable decision-tree policy. arXiv preprint arXiv:1907.01180, 2019.
- Hayes and Shah [2017] Bradley Hayes and Julie A Shah. Improving robot controller transparency through autonomous policy explanation. In Proceedings of the 2017 ACM/IEEE international conference on human-robot interaction, pages 303–312, 2017.
- van der Waa et al. [2018] Jasper van der Waa, Jurriaan van Diggelen, Karel van den Bosch, and Mark Neerincx. Contrastive explanations for reinforcement learning in terms of expected consequences. arXiv preprint arXiv:1807.08706, 2018.
- Zahavy et al. [2016] Tom Zahavy, Nir Ben-Zrihem, and Shie Mannor. Graying the black box: Understanding dqns. In International conference on machine learning, pages 1899–1908. PMLR, 2016.
- Greydanus et al. [2018] Samuel Greydanus, Anurag Koul, Jonathan Dodge, and Alan Fern. Visualizing and understanding atari agents. In International conference on machine learning, pages 1792–1801. PMLR, 2018.
- Puri et al. [2019] Nikaash Puri, Sukriti Verma, Piyush Gupta, Dhruv Kayastha, Shripad Deshmukh, Balaji Krishnamurthy, and Sameer Singh. Explain your move: Understanding agent actions using specific and relevant feature attribution. arXiv preprint arXiv:1912.12191, 2019.
- Xing et al. [2023] Jinwei Xing, Takashi Nagata, Xinyun Zou, Emre Neftci, and Jeffrey L Krichmar. Achieving efficient interpretability of reinforcement learning via policy distillation and selective input gradient regularization. Neural Networks, 161:228–241, 2023.
- Bach et al. [2015] Sebastian Bach, Alexander Binder, Grégoire Montavon, Frederick Klauschen, Klaus-Robert Müller, and Wojciech Samek. On pixel-wise explanations for non-linear classifier decisions by layer-wise relevance propagation. PloS one, 10(7):e0130140, 2015.
- Lapuschkin et al. [2019] Sebastian Lapuschkin, Stephan Wäldchen, Alexander Binder, Grégoire Montavon, Wojciech Samek, and Klaus-Robert Müller. Unmasking clever hans predictors and assessing what machines really learn. Nature communications, 10(1):1096, 2019.
- Raffin et al. [2021] Antonin Raffin, Ashley Hill, Adam Gleave, Anssi Kanervisto, Maximilian Ernestus, and Noah Dormann. Stable-baselines3: Reliable reinforcement learning implementations. Journal of Machine Learning Research, 22(268):1–8, 2021. URL http://jmlr.org/papers/v22/20-1364.html.