22institutetext: Northwestern University, Chicago IL 60611, USA
22email: xiaozhang@nwu.edu.cn, fengjun@nwu.edu.cn
Gaze-directed Vision GNN for Mitigating Shortcut Learning in Medical Image
Abstract
Deep neural networks have demonstrated remarkable performance in medical image analysis. However, its susceptibility to spurious correlations due to shortcut learning raises concerns about network interpretability and reliability. Furthermore, shortcut learning is exacerbated in medical contexts where disease indicators are often subtle and sparse. In this paper, we propose a novel gaze-directed Vision GNN (called GD-ViG) to leverage the visual patterns of radiologists from gaze as expert knowledge, directing the network toward disease-relevant regions, and thereby mitigating shortcut learning. GD-ViG consists of a gaze map generator (GMG) and a gaze-directed classifier (GDC). Combining the global modelling ability of GNNs with the locality of CNNs, GMG generates the gaze map based on radiologists’ visual patterns. Notably, it eliminates the need for real gaze data during inference, enhancing the network’s practical applicability. Utilizing gaze as the expert knowledge, the GDC directs the construction of graph structures by incorporating both feature distances and gaze distances, enabling the network to focus on disease-relevant foregrounds. Thereby avoiding shortcut learning and improving the network’s interpretability. The experiments on two public medical image datasets demonstrate that GD-ViG outperforms the state-of-the-art methods, and effectively mitigates shortcut learning. Our code is available at https://github.com/SX-SS/GD-ViG.
Keywords:
Eye-tracking Medical image analysis Shortcut learning Vision GNN.1 Introduction
In recent years, deep learning methods have been applied to various fields, including computer vision [8], robotics [25], and medical image analysis [2]. However, its reliability and interpretability have consistently been questioned. Research investigations have illuminated a critical issue: networks often learn spurious correlations caused by shortcut learning [5]. The phenomenon is particularly problematic in the medical domain where disease regions tend to occupy a minimal proportion and low contrast, making their precise capture more challenging. For instance, in chest X-ray diagnosis, the pneumothorax disease region may account for only 1.36% of the image, while the majority of image regions exhibit structural similarity [21, 17]. Consequently, networks may resort to suboptimal shortcuts like hospital-specific tokens [5], thereby undermining the network’s interpretability and reliability, both of which are crucial in medical image analysis.
Several studies tackle the problem of shortcut learning by incorporating prior knowledge about the disease region into the network. Such knowledge can guide the network to locate the abnormality accurately and reduce the reliance on spurious features. A common way to achieve this is to employ extra fine-grained annotations of abnormality, such as target bounding boxes [18] or target masks [13]. However, it is essential to recognise that this strategy is resource-intensive and time-consuming.
Prior knowledge about the disease region can also be derived from radiologists’ gaze, which indicates their visual cognitive behavior during diagnosis [26, 7]. The eye gaze data obtained by eye trackers indicate the specific regions of interest for radiologists, which are also related to the disease and contain task-relevant knowledge [19, 1]. Moreover, they can be collected passively and cheaply during image reading, without incurring extra costs. Several methods have leveraged gaze to enhance the performance and interpretability of the network in medical image analysis [23, 16, 22, 1, 9]. For instance, GA-Net [23] employs the gaze map as supervision, encouraging the network to attend to the regions that humans focus on in medical images. EG-ViT [16] utilizes gaze to mask the harmful background shortcuts in medical images, rectifying shortcut learning. However, these methods only guide training, not testing, so the network may still be prone to shortcut learning when encountering unseen images. By incorporating gaze embedding as network input, GazeGNN [22] improves the robustness of the network in inference, which also demonstrates that the interpretability of medical image analysis tasks can be improved by building graph nodes from image patches. However, a limitation of GazeGNN is it requires real gaze data during testing, which constrains the network’s applicability and usability.
In this paper, we propose a novel gaze-directed Vision GNN (GD-ViG), an end-to-end method that integrates radiologists’ gaze into the neural network. GD-ViG comprises two subnets: gaze map generator (GMG) and gaze-directed classifier (GDC). GMG learns the visual pattern of radiologists’ reading by combining the global modeling ability of GNN and the locality of CNN to generate gaze maps. The need for real gaze in the inference stage is eliminated by GMG, enhancing the network’s applicability. GDC constructs the graph by fusing gaze distance and feature distance, eliminating connections to disease-irrelevant nodes from the graph structure. The proposed method is focused on task-relevant foreground by GDC, reducing shortcut learning, and improving its interpretability and robustness. Evaluations conducted on two public datasets demonstrate that GD-ViG outperforms the state-of-the-art methods.
2 Method
2.1 Framework for end-to-end GD-ViG
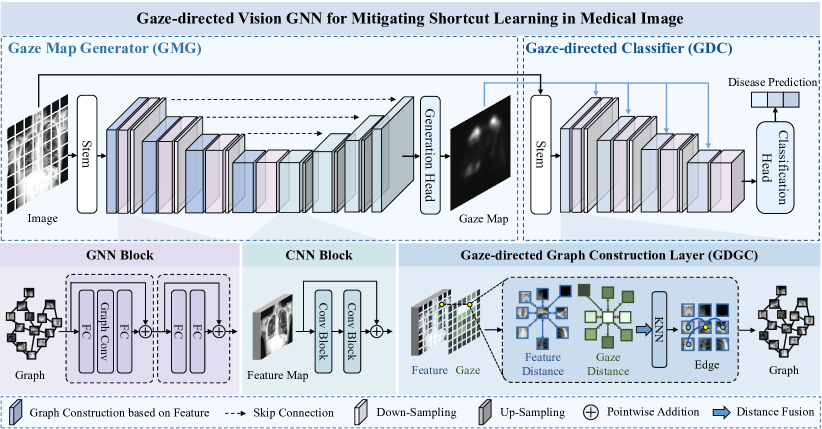
As illustrated in Fig. 1, the proposed GD-ViG is capable of assimilating the visual patterns of radiologists into the ViG, which consists of GMG and GDC. The GMG models the visual patterns of radiologists to generate the gaze map from the image. Subsequently, the GDC leverages the generated gaze map to construct a graph structure, concentrating on disease-relevant regions for diagnosis. A notable feature of GD-ViG is its ability to generate the gaze map from the image during inference, thereby obviating the need for extra gaze data.
2.2 Gaze map generator
The real gaze map can be generated from raw gaze data by extracting fixation points and applying Gaussian blurring [16]. Through supervised learning with real gaze maps, the GMG learns the visual pattern of radiologists and generates gaze maps from images. The GMG comprises an encoder and a decoder. The encoder consists of graph construction layers based on feature distance and GNN blocks, which extract the global features of the image. An image is downsampled to a size of by the stem layer, where is the feature dimension. The graph construction layer then converts the feature at each position into a node, forming a node set , where is the number of nodes. For each node, the KNN algorithm searches its neighbors based on the feature distance and connects them with an edge . The edge set is denoted as . Thus, a graph structure is constructed.
The GNN blocks perform two operations: neighbor node feature fusion and feature transformation. The graph can be represented as a feature vector , and the neighbor node feature fusion operation can be formulated as:
| (1) |
where and are fully connected layers and is max-relative graph convolution [12]. The feature transformation can be formulated as:
| (2) |
where and are the fully connected layers. The decoder consists of four CNN blocks, which extract the local feature. The CNN block is as follows:
| (3) |
where and includes convolution layer, batch normalization and ReLU. Skip connections are introduced in different blocks to fuse the global and local information.
After the encoder and decoder, the image passes through the generation head, which outputs the gaze map of size . The mean squared error loss is used as the GMG loss, which can be formulated as:
| (4) |
where is the ground truth gaze maps. The visual pattern of radiologists’ reading is learned by GMG under the supervision of . During inference, GMG is responsible for generating the gaze map to avoid the need for the real gaze.
2.3 Gaze-Directed Classifier based on Gaze Distance
As illustrated in Fig. 1, GDC comprises gaze-directed graph construction layers (GDGC) and GNN blocks. GDGC fuses feature distance and gaze distance to construct a graph structure and eliminate connections to disease-irrelevant nodes. It splits a feature map of into nodes, denoted as , where and is the feature dimension. The gaze map is also downsampled to the size of . The distance between central node and other nodes is defined as:
| (5) |
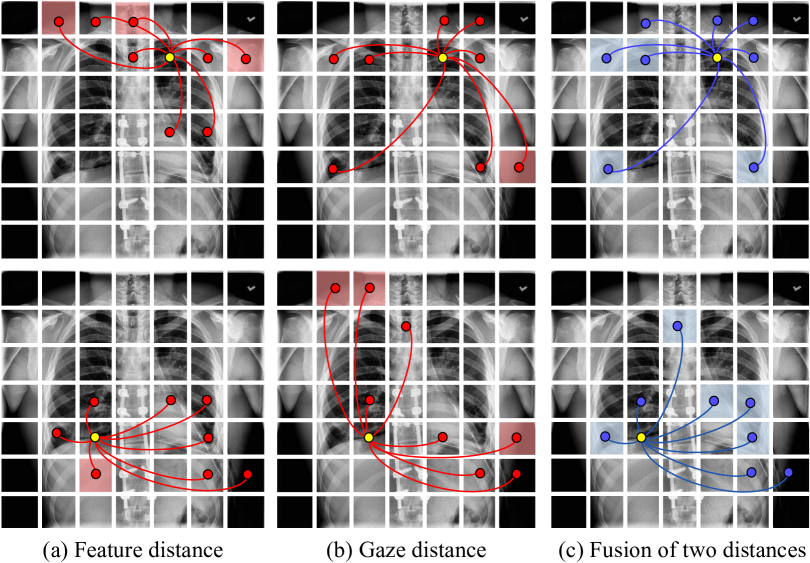
where is a hyperparameter. The neighbors of , , can be obtained using KNN. An edge is formed for each node and its neighbor, forming the edge set . The graph structure is then represented as . Fig. S1 of the supplementary material provides more details. The gaze distance plays a larger role where is large, making the nodes in the gaze highlighted area more connected, and then the GNN block can aggregate the information of these areas better. Feature distance and gaze distance serve as complementary information to construct a robust graph structure. Fig. 3 shows that following distance fusion, the connections with disease-irrelevant regions are eliminated, enhancing the network’s interpretability and robustness. The loss of GDC is the cross-entropy loss. It can be formulated as:
| (6) |
where and are the ground truth and prediction of GDC and represents the number of categories. The loss function of GD-ViG is composed of the loss of GMG and the loss of GDC, as follows:
| (7) |
where is the balance coefficient.
3 Experiments and Results
3.1 Dataset and Evaluation Metrics
The proposed GD-ViG was evaluated on two datasets: SIIM-ACR [27] and EGD-CXR [11]. SIIM-ACR contains 1170 chest X-ray images, of which 268 have pneumothorax and the corresponding gaze data. EGD-CXR consists of 1083 chest X-ray images, sourced from the MIMIC-CXR [10] dataset. EGD-CXR annotates the chest images into three categories: Normal, Congestive Heart Failure, and Pneumonia, and the gaze data are provided for each image. Each image was resized to 224×224 and a two-dimensional Gaussian smoothing was applied to transform the gaze into the gaze map, following [16].
Accuracy (ACC), area under the receiver operating characteristic curve (AUC), and F1 score (F1) were used as metrics to evaluate the network’s performance in disease diagnosis. All experiments were implemented using Pytorch on a single NVIDIA 3080Ti GPU (12GB). The network was trained using Adam optimizer with an initial learning rate of for epochs. We set in Eq. 5 and in Eq. 7.
3.2 Comparison with State-of-the-art Methods
We performed quantitative and qualitative evaluations of GD-ViG and compared it with various state-of-the-art methods. The methods were categorized into three groups: 1) Methods without gaze: ResNet [8], Vision Transformer [4], Swin Transformer [15], and Vision GNN [6]; 2) Methods with gaze during training: ResNet+Gaze [23] and EG-ViT [16]; 3) Methods with gaze during inference: GazeGNN [22].
| Method | SIIM-ACR | EGD-CXR | ||||
| Acc | AUC | F1 | Acc | AUC | F1 | |
| ResNet-18 [8] | 83.20 | 82.35 | 85.25 | 71.96 | 85.02 | 72.17 |
| ResNet-50 [8] | 84.00 | 85.81 | 83.63 | 72.90 | 86.43 | 72.45 |
| ResNet-101 [8] | 84.40 | 86.13 | 81.08 | 74.77 | 85.63 | 74.90 |
| ViT [4] | 83.60 | 84.16 | 83.77 | 70.09 | 85.43 | 69.19 |
| SwinT [15] | 84.40 | 83.31 | 83.69 | 71.96 | 86.44 | 74.89 |
| ViG [6] | 83.20 | 84.89 | 82.81 | 75.70 | 85.71 | 75.62 |
| ResNet-18+Gaze [23] | 84.80 | 71.26 | 83.71 | 77.57 | 86.13 | 77.47 |
| ResNet-50+Gaze [23] | 83.20 | 70.25 | 82.35 | 78.50 | 86.43 | 77.91 |
| ResNet-101+Gaze [23] | 84.80 | 72.68 | 84.03 | 79.44 | 86.42 | 79.20 |
| EG-ViT [16] | 85.60 | 75.30 | 85.14 | 77.57 | 85.53 | 77.42 |
| Ours | 87.20 | 86.99 | 86.68 | 85.05 | 88.56 | 84.53 |
| GazeGNN [22] | 85.60 | 85.16 | 85.60 | 83.18 | 92.30 | 82.30 |
Quantitative Results. The quantitative results are presented in Table.1 demonstrate that our method achieves SOTA performance on the SIIM-ACR dataset, achieving an accuracy of 87.2%. This represents a 1.6% improvement over the previously best-performing GazeGNN method. Furthermore, the highest accuracy on the EGD-CXR dataset is also achieved by the proposed method, recorded at 85.05%. In contrast to GazeGNN, which necessitates real gaze data during inference, our method is capable of generating a gaze map via GMG. The ability of GMG to produce gaze maps comparable to real gaze, coupled with GDC’s effective utilization of gaze as prior information, is thereby indicated.
| Method | SIIM-ACR | EGD-CXR | ||||
|---|---|---|---|---|---|---|
| Acc | AUC | F1 | Acc | AUC | F1 | |
| ViG | 83.20 | 84.89 | 82.81 | 75.70 | 85.71 | 75.62 |
| ViG+AMG(CNN) | 85.60 | 86.99 | 85.14 | 80.37 | 86.07 | 80.39 |
| ViG+AMG(GNN) | 86.00 | 86.35 | 85.62 | 83.18 | 86.52 | 83.15 |
| ViG+AMG(GNN+CNN) | 87.20 | 86.99 | 86.68 | 85.05 | 88.56 | 84.53 |
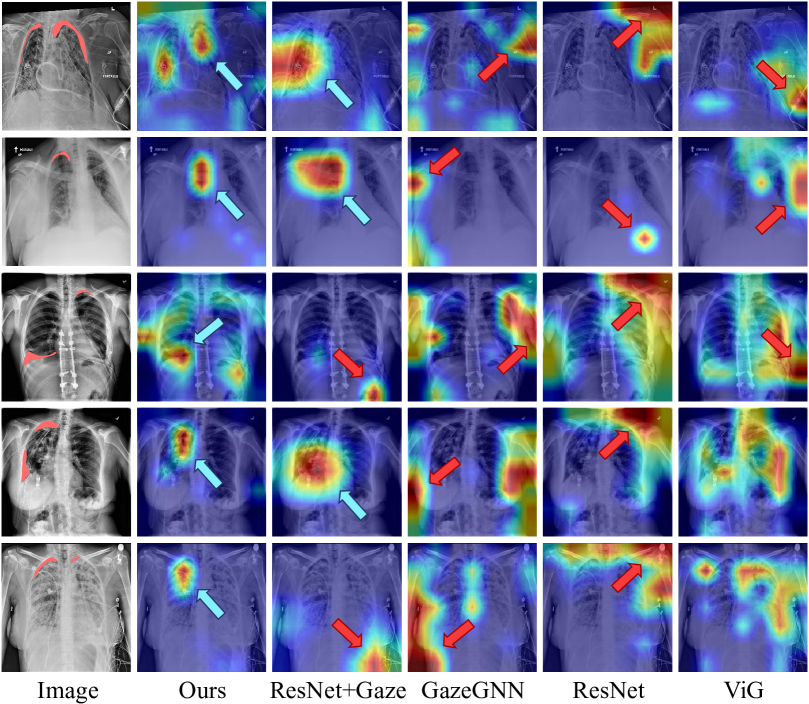
Qualitative Visualization. Grad-CAM [20] is utilized to visualize the attention maps of various methods on the SIIM-ACR dataset, as shown in Fig. 2. Attention maps on the EGD-CXR data are similarly visualized in Fig. S3 of the supplementary material. The regions of focus for the networks are indicated by red areas, with the first column displaying the original image and the pneumothorax disease area highlighted in red mask. A comparison of the results from different methods on the SIIM-ACR data reveals that networks lacking gaze direction concentrate on regions not pertinent to the disease, as indicated by red arrows. Conversely, even with gaze direction, GazeGNN and ResNet+Gaze exhibit tendencies of shortcut learning. Our method mitigates this issue and accurately targets the disease area, marked by a blue arrow. Additionally, Fig. S2 of the supplementary material presents a comparison of the gaze generated by the proposed method against other methods, demonstrating the ability of the proposed method to produce a high-quality and realistic gaze map.
3.3 Ablation Study
Ablation experiments were conducted on the SIIM-ACR and EGD-CXR datasets, with results reported in Table.2. The impact of gaze data utilization and GMG structure was investigated. Without any strategy, the ViG accuracy stood at 83.20%. The incorporation of gaze, generated by CNN, elevated accuracy to 85.60%, signifying GDC’s capacity to effectively harness gaze information for performance enhancement. Accuracy further climbed to 86.00% when gaze maps were produced by GNN. Utilizing both GNN and CNN for gaze map generation culminated in the highest accuracy of 87.20%, surpassing all other methods. Paired -tests were executed to evaluate the performance enhancement attributable to the proposed modules, including Acc, AUC, and F1, with all the -values lower than 0.05. These results affirm the GMG’s proficiency in amalgamating global and local information to refine gaze map generation.
3.4 Graph Structure Visualization
Fig. 3 illustrates the synergistic effect of gaze and feature distances in graph construction. Displayed across three columns, each based on distinct distances, the yellow circles denote central nodes with their neighboring nodes connected. Central nodes reliant on feature and gaze distances are observed to connect to disease-irrelevant areas, highlighted in red. After the fusion of distances, these connections are severed. Concurrently, disease-relevant nodes, accentuated in blue within the initial graphs, are preserved, underscoring the complementary nature of the two distances. The distance fusion strategy introduced herein facilitates the formation of a graph structure enriched with interconnected foreground nodes, diminishing the impact of extraneous regions, curtailing shortcut learning, and enhancing interpretability.
4 Conclusion
In this paper, we propose GD-ViG, an end-to-end neural network that integrates the radiologists’ gaze as prior information into Vision GNN to mitigate shortcut learning. GD-ViG consists of two subnets: gaze map generator and gaze-directed classifier. The gaze map generator models radiologists’ visual patterns through the global modeling capabilities of GNN and CNN’s local feature extraction, thereby generating the gaze map. It obviates the necessity for the real gaze data during inference, broadening the applicability of the network. The gaze-directed classifier employs the gaze map as expert prior knowledge for graph construction, severing connections with nodes unrelated to the disease and concentrating on pertinent regions. Such a method not only augments the network’s interpretability but also precludes shortcut learning. Evaluations conducted on the SIIM-ACR and EGD-CXR datasets demonstrate that our method outperforms the state-of-the-art methods and significantly enhances the network’s interpretability and reliability.
Acknowledgment
This work is supported by the National Natural Science Foundation of China (NSFC Grant No. 62073260).
References
- [1] Bhattacharya, M., Jain, S., Prasanna, P.: Radiotransformer: A cascaded global-focal transformer for visual attention-guided disease classification. In: European Conference on Computer Vision. pp. 679–698. Springer (2022)
- [2] Chen, X., Wang, X., Zhang, K., Fung, K.M., Thai, T.C., Moore, K., Mannel, R.S., Liu, H., Zheng, B., Qiu, Y.: Recent advances and clinical applications of deep learning in medical image analysis. Medical Image Analysis 79, 102444 (2022)
- [3] DeGrave, A.J., Janizek, J.D., Lee, S.I.: AI for radiographic COVID-19 detection selects shortcuts over signal. Nature Machine Intelligence 3(7), 610–619 (2021)
- [4] Dosovitskiy, A., Beyer, L., Kolesnikov, A., Weissenborn, D., Zhai, X., Unterthiner, T., Dehghani, M., Minderer, M., Heigold, G., Gelly, S., et al.: An image is worth 16x16 words: Transformers for image recognition at scale. arXiv preprint arXiv:2010.11929 (2020)
- [5] Geirhos, R., Jacobsen, J.H., Michaelis, C., Zemel, R., Brendel, W., Bethge, M., Wichmann, F.A.: Shortcut learning in deep neural networks. Nature Machine Intelligence 2(11), 665–673 (2020)
- [6] Han, K., Wang, Y., Guo, J., Tang, Y., Wu, E.: Vision gnn: An image is worth graph of nodes. Advances in Neural Information Processing Systems 35, 8291–8303 (2022)
- [7] Hayhoe, M., Ballard, D.: Eye movements in natural behavior. Trends in Cognitive Sciences 9(4), 188–194 (2005)
- [8] He, K., Zhang, X., Ren, S., Sun, J.: Deep residual learning for image recognition. In: Proceedings of the IEEE Conference on Computer Vision and Pattern Recognition (CVPR) (2016)
- [9] Ji, C., Du, C., Zhang, Q., Wang, S., Ma, C., Xie, J., Zhou, Y., He, H., Shen, D.: Mammo-Net: Integrating gaze supervision and interactive information in multi-view mammogram classification. In: International Conference on Medical Image Computing and Computer-Assisted Intervention. pp. 68–78. Springer (2023)
- [10] Johnson, A.E., Pollard, T.J., Berkowitz, S.J., Greenbaum, N.R., Lungren, M.P., Deng, C.y., Mark, R.G., Horng, S.: MIMIC-CXR, A de-identified publicly available database of chest radiographs with free-text reports. Scientific Data 6(1), 317 (2019)
- [11] Karargyris, A., Kashyap, S., Lourentzou, I., Wu, J.T., Sharma, A., Tong, M., Abedin, S., Beymer, D., Mukherjee, V., Krupinski, E.A., et al.: Creation and validation of a chest X-ray dataset with eye-tracking and report dictation for AI development. Scientific Data 8(1), 92 (2021)
- [12] Li, G., Muller, M., Thabet, A., Ghanem, B.: Deepgcns: Can gcns go as deep as cnns? In: Proceedings of the IEEE/CVF International Conference on Computer Vision. pp. 9267–9276 (2019)
- [13] Li, K., Wu, Z., Peng, K.C., Ernst, J., Fu, Y.: Tell me where to look: Guided attention inference network. In: Proceedings of the IEEE Conference on Computer Vision and Pattern Recognition. pp. 9215–9223 (2018)
- [14] Li, L., Xu, M., Wang, X., Jiang, L., Liu, H.: Attention based glaucoma detection: A large-scale database and cnn model. In: Proceedings of the IEEE/CVF conference on computer vision and pattern recognition. pp. 10571–10580 (2019)
- [15] Liu, Z., Lin, Y., Cao, Y., Hu, H., Wei, Y., Zhang, Z., Lin, S., Guo, B.: Swin transformer: Hierarchical vision transformer using shifted windows. In: Proceedings of the IEEE/CVF International Conference on Computer Vision. pp. 10012–10022 (2021)
- [16] Ma, C., Zhao, L., Chen, Y., Wang, S., Guo, L., Zhang, T., Shen, D., Jiang, X., Liu, T.: Eye-gaze-guided vision transformer for rectifying shortcut learning. IEEE Transactions on Medical Imaging (2023)
- [17] Oakden-Rayner, L., Dunnmon, J., Carneiro, G., Ré, C.: Hidden stratification causes clinically meaningful failures in machine learning for medical imaging. In: Proceedings of the ACM Conference on Health, Inference, and Learning. pp. 151–159 (2020)
- [18] Ouyang, X., Karanam, S., Wu, Z., Chen, T., Huo, J., Zhou, X.S., Wang, Q., Cheng, J.Z.: Learning hierarchical attention for weakly-supervised chest X-ray abnormality localization and diagnosis. IEEE Transactions on Medical Imaging 40(10), 2698–2710 (2020)
- [19] Saab, K., Hooper, S.M., Sohoni, N.S., Parmar, J., Pogatchnik, B., Wu, S., Dunnmon, J.A., Zhang, H.R., Rubin, D., Ré, C.: Observational supervision for medical image classification using gaze data. In: Medical Image Computing and Computer Assisted Intervention. pp. 603–614. Springer (2021)
- [20] Selvaraju, R.R., Cogswell, M., Das, A., Vedantam, R., Parikh, D., Batra, D.: Grad-cam: Visual explanations from deep networks via gradient-based localization. In: Proceedings of the IEEE International Conference on Computer Vision. pp. 618–626 (2017)
- [21] Taylor, A.G., Mielke, C., Mongan, J.: Automated detection of moderate and large pneumothorax on frontal chest x-rays using deep convolutional neural networks: A retrospective study. PLoS Medicine 15(11), e1002697 (2018)
- [22] Wang, B., Pan, H., Aboah, A., Zhang, Z., Keles, E., Torigian, D., Turkbey, B., Krupinski, E., Udupa, J., Bagci, U.: GazeGNN: A gaze-guided graph neural network for chest X-ray classification. In: Proceedings of the IEEE/CVF Winter Conference on Applications of Computer Vision. pp. 2194–2203 (2024)
- [23] Wang, S., Ouyang, X., Liu, T., Wang, Q., Shen, D.: Follow my eye: Using gaze to supervise computer-aided diagnosis. IEEE Transactions on Medical Imaging 41(7), 1688–1698 (2022)
- [24] Winkler, J.K., Fink, C., Toberer, F., Enk, A., Deinlein, T., Hofmann-Wellenhof, R., Thomas, L., Lallas, A., Blum, A., Stolz, W., et al.: Association between surgical skin markings in dermoscopic images and diagnostic performance of a deep learning convolutional neural network for melanoma recognition. JAMA Dermatology 155(10), 1135–1141 (2019)
- [25] You, K., Zhou, C., Ding, L.: Deep learning technology for construction machinery and robotics. Automation in Construction 150, 104852 (2023)
- [26] Yun, K., Peng, Y., Samaras, D., Zelinsky, G.J., Berg, T.L.: Exploring the role of gaze behavior and object detection in scene understanding. Frontiers in Psychology 4, 917 (2013)
- [27] Zawacki, A., Wu, C., Shih, G., Elliott, J., Fomitchev, Mikhail, Hussain, M., ParasLakhani, Culliton, P., Bao, S.: SIIM-ACR pneumothorax segmentation (2019), https://kaggle.com/competitions/siim-acr-pneumothorax-segmentation