Suppression without Thawing:
Constraining Structure Formation and Dark Energy with Galaxy Clustering
Abstract
We present a new perturbative full-shape analysis of BOSS galaxy clustering data, including the full combination of the galaxy power spectrum and bispectrum multipoles, baryon acoustic oscillations, and cross-correlations with the gravitational lensing of cosmic microwave background measured from Planck. Assuming the CDM model, we constrain the matter density fraction , the Hubble constant , and the mass fluctuation amplitude (equivalent to ). Cosmic structure at low redshifts appears suppressed with respect to the Planck CDM concordance model at . We explore whether this tension can be explained by the recent DESI preference for dynamical dark energy (DDE): the BOSS data combine with DESI BAO and PantheonPlus supernovae competitively compared to the CMB, yielding no preference for DDE, but the same suppression of structure, with dark energy being consistent with a cosmological constant at 68% CL. Our results suggest that either the data contains residual systematics, or more model-building efforts may be required to restore cosmological concordance.
Introduction. — Observational and theoretical efforts over the last three decades have led to the establishment of the standard model of cosmology: CDM. This model can successfully fit a wide range of cosmological data, in particular the various correlators of cosmological fluctuations traced by the cosmic microwave background (CMB) anisotropies and large-scale structure of the Universe (e.g., Aghanim et al., 2020; Alam et al., 2021).
Despite its phenomenological successes, the CDM model suffers from significant theoretical questions. Many of its core ingredients, such as cosmic inflation, dark matter, and dark energy are, at best, highly exotic. The latter is particularly puzzling from the theoretical viewpoint. The simplest explanation for dark energy is the famous cosmological constant, which gives rise to the naturalness paradox that shatters the fundamental pillars of physics: symmetry-based selection rules and dimensional analysis Weinberg (1989); Burgess (2015). Whilst anthropic Weinberg (1987) and landscape Polchinski (2006) explanations are possible, the cosmological constant problem still poses a formidable conceptual challenge in fundamental physics. This challenge is particularly relevant given the possible () evidence for dynamical dark energy (DDE, also known as CDM) recently reported by the Dark Energy Survey Instrument (DESI) collaboration DESI Collaboration et al. (2024a, b); Adame et al. (2024).
In addition to DDE, the data contain other anomalies whose presence could signal the breakdown of cosmological concordance. The most prominent is the Hubble tension, i.e. the apparent disagreement between the direct and indirect measurements of the Hubble constant , a proxy for the age of the Universe Riess et al. (2022). Another important anomaly is the disagreement of the direct and indirect probes of the growth of structure encoded by the mass fluctuation amplitude , or the related structure growth parameters and (where is the redshift-dependent logarithmic growth factor) Di Valentino et al. (2021); Nguyen et al. (2023). This discrepancy is observed in multiple independent low-redshift datasets Abdalla et al. (2022) (a selection of which are shown in Fig. 1): cluster counts (e.g., Ade et al., 2016; Bolliet et al., 2020), weak lensing measurements (e.g., Asgari et al., 2021; Abbott et al., 2022), CMB lensing cross-correlations (e.g., Marques et al., 2024; White et al., 2022), and galaxy clustering in redshift space (e.g., Nguyen et al., 2023; Ivanov et al., 2023; Philcox and Ivanov, 2022; Chen et al., 2022a, b; Ivanov, 2021), though there exist some outliers (Beutler et al., 2017; Horowitz and Seljak, 2017; Kobayashi et al., 2022; Dalal et al., 2023; Miyatake et al., 2023; Yu et al., 2023; D’Amico et al., 2024; Farren et al., 2024; Shaikh et al., 2024). In general relativity the expansion history and growth of structure are intricately related through the equations of motion, and the accumulation of cosmological tensions raise a natural question: do they all point to a particular new physics model in a correlated fashion? This Letter addresses this question focusing on the case of DDE and the tension.
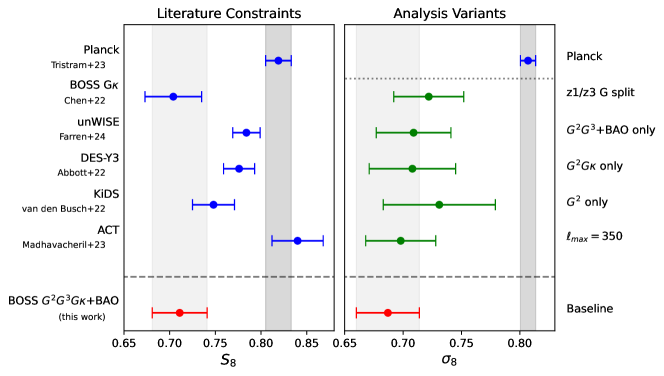
We present an independent reanalysis of the galaxy clustering data from the Baryon acoustic Oscillation Spectroscopic Survey (BOSS) in combination with Planck CMB lensing, in an attempt to link the possible tension found in these data with the hints of DDE reported by DESI. Using methodologies developed in previous works (Philcox and Ivanov, 2022; Ivanov et al., 2023, 2020a, 2020b, 2022a; Philcox et al., 2020), we measure the BOSS three-dimensional redshift-space power spectrum and bispectrum multipoles, and post-reconstructed BAO data. We also include the angular cross correlation between the BOSS galaxies and Planck CMB lensing following Wenzl et al. (2024a) (see also Pullen et al. (2016); Singh et al. (2017); Doux et al. (2018); Singh et al. (2019); Darwish et al. (2021); Chen et al. (2022); Wenzl et al. (2024a, b)). For the first time, we consistently analyze all of these observables within the effective field theory (EFT)-based full-shape (FS) framework Ivanov et al. (2020a); D’Amico et al. (2020); Chen et al. (2022b). Our first important result is that, when combined with a BBN prior on the baryon density, this dataset yields a measurement of matter clustering amplitude discrepant with the Planck concordance value at the level (cf. Fig. 1). This represents the strongest evidence for the tension from the BOSS dataset to date.
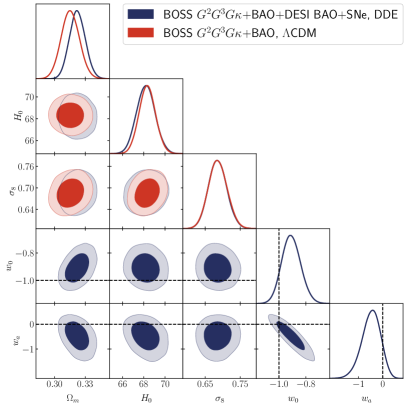
In the second part of this Letter, we study whether the tension can be explained by the DDE model suggested by the combination DESISupernovae (SNe) and CMB. Specifically, we analyze a combination of the BOSS data described above (both FS and BAO), including the galaxy-CMB lensing correlations, the DESI BAO data at redshift , and PantheonPlus SNe data assuming the DDE model. We find that DDE does not restore concordance between galaxy clustering data and the primary CMB. The optimal values of in our DDE analysis is still in a tension with Planck, though the is consistent with Planck, but not with the value implied by the Cepheid-calibrated distance ladder Riess et al. (2022) (though in better agreement with (Freedman and Madore, 2022)). In addition, our dataset constrains DDE competitively compared to DESI BAO but does not display any evidence for DDE. The combination of the above results suggests that internal tensions between the datasets seem to pull cosmological parameters in directions uncorrelated with each other; this could motivate more efforts from the model building perspective, as well as searches for systematic effects in the full combination of the large-scale structure data.
Data. — Our primary dataset is the clustering of galaxies from the twelfth data release of the BOSS survey Reid et al. (2016); Dawson et al. (2013). These galaxies are observed in both the northern (NGC) and southern (SGC) galactic caps and are composed of the LOWZ and CMASS samples, each of which are restricted to the redshift ranges and in order to avoid overlap.111Unlike our previous works (e.g., Philcox and Ivanov, 2022), we split the sample by their physical type rather than imposing a redshift-cut (e.g., Beutler et al., 2017). Combining both galactic caps, the LOWZ and CMASS catalogs cover and deg2 with and galaxies, respectively. The complete DR12 catalogs also contain galaxies in two chunks LOWZE2 and LOWZE3 selected using different criteria than the main LOWZ sample. These are often combined with the main samples in order to maximize the survey volume, but, since the different selections imply different galaxy properties, we will instead omit them in this work (this choice was made also in pre-DR16 BOSS analyses (e.g., Gil-Marín et al., 2016), leading to a smaller area in the LOWZ sample compared to CMASS).
To characterize the clustering of the above galaxy samples, we utilize the power spectrum and bispectrum statistics, measured using the window-free estimators derived in (Philcox, 2021a, b; Ivanov et al., 2023) (now implemented in the PolyBin3D code (Philcox and Flöss, 2024)). We include the standard systematic and FKP weights constructed by BOSS Reid et al. (2016), which imply that the power spectrum probes clustering at an effective redshift , equal to () for the LOWZ (CMASS) sample, where is the weighted galaxy number density. The same weights applied to the bispectrum would result in a different effective redshift (instead weighted by ); to ameliorate this, we an additional redshift weight when computing the bispectrum. We additionally include the real-space power spectrum proxy (equal to the power spectrum perpendicular to the line of sight) is estimated from the redshift space multipoles Ivanov et al. (2022a).
In addition to the power spectrum and bispectrum, we also include post-reconstruction BAO measurements from the BOSS galaxies. Since this signal does not depend strongly on galaxy properties, we will use measurements of the BAO scale from the combined BOSS sample covering the full survey area and redshift range, including the LOWZE2 and LOWZE3 samples omitted in the above full-shape analysis (specifically, those from (Philcox et al., 2020)). This combined sample is split into non-overlapping redshift bins (z1) and (z3) chunks following Alam et al. (2017); Beutler et al. (2017) with effective redshifts of and , respectively. We compute the total covariance of the above measurements using measurements from the 2048 public MultiDark Patchy mocks Kitaura et al. (2016); Rodríguez-Torres et al. (2016).
In order to measure the lensing cross correlation with galaxies we use publicly-available CMB lensing maps reconstructed from Planck data. Specifically, we use the PR4 map introduced in Carron et al. (2022), which uses the updated NPIPE pipeline and slightly more data than previous releases, leading to a improvement in signal-to-noise compared to PR3. We compute the cross-correlations of the lensing convergence with the LOWZ and CMASS galaxies using the NaMaster algorithm Alonso et al. (2019) adopting the same numerical choices (including filters and apodization) as described in Wenzl et al. (2024a)—to which we direct the interested reader for further details including extensive systemaics tests—except that we split the cross correlations according to galactic cap. In particular we use NaMaster to compute the bandpower window relating the observed bandpowers in bin to the unbinned theory , as well as an analytic (Gaussian) covariance matrix using the theory predictions for the measured ’s. We treat this covariance independently from that derived from the three-dimensional clustering of galaxies since the mode overlap is negligible Taylor and Markovič (2022). Similarly to the bispectrum, we re-weight the galaxies when computing the cross correlation by the ratio of the galaxy and CMB lensing kernels in order to homogenize the effective redshifts probed with the galaxy power spectrum Chen et al. (2022).
Finally, in addition to BOSS-volume data, we will supplement our analysis with constraints on cosmological expansion at lower and higher redshfts obtained from Supernovae Type Ia (SNIa) and external BAO data. For the former we adopt the PantheonPlus dataset Scolnic et al. (2022); Riess et al. (2022) (which constrains the redshift-dependence of luminosity distances) and BAO likelihoods for the 6-degree Field Galaxy Redshift Survey (6dFGS) Beutler et al. (2011) and the Main Galaxy Sample (MGS) in SDSS DR7 Ross et al. (2015), as implemented in MontePython Audren et al. (2013); Brinckmann and Lesgourgues (2019). For the latter, we use all galaxy BAO measurements from DESI with DESI Collaboration et al. (2024a) as well as the DESI Ly measurement DESI Collaboration et al. (2024b). We also adopt the BBN baryon density constraint from the primordial deuterium abundance Cooke et al. (2018); Ivanov et al. (2020a), and fix222Alternatively, one can free in the fit or use the Harrison-Zeldovich theoretical value . These choices have a marginal impact on our results. the spectral tilt to the Planck best-fit value .
Theoretical model. — We begin with a short overview of the theory model used for galaxy clustering. At the background level, we adopt either a baseline CDM model, or the popular dynamical dark energy (DDE) extension, which is parametrized according to the equation of state Fang et al. (2008). We compute predictions for the redshift-space power spectrum and bispectrum, as well as the real-space matter-galaxy cross power spectrum, using the effective field theory of large scale structure (EFT) Baumann et al. (2012); Carrasco et al. (2012); Ivanov (2023) as implemented in the CLASS-PT code Chudaykin et al. (2020) in a modification to the public likelihoods.333https://github.com/oliverphilcox/full_shape_likelihoods Our modeling follows the the conventions of Chudaykin et al. (2020, 2021a); Philcox and Ivanov (2022), to which we refer the reader for further details. Briefly, the galaxy power spectrum is computed to one-loop in perturbation theory while the bispectra are computed using the same bias parameters up to quadratic order. The lensing cross correlation probes the real-space cross power spectrum of galaxies with matter perpendicular to the line of sight; we evaluate to one-loop order including an additional counterterm for the matter field. In all cases the effects of long-wavelength displacements on the BAO wiggles in the linear power spectrum are resummed following Blas et al. (2016a, b); Vlah et al. (2016); Ivanov and Sibiryakov (2018); Chen et al. (2024) (see also Senatore and Zaldarriaga (2015); Baldauf et al. (2015)).
To make contact with observations, we rescale the wavenumbers in the redshift-space power spectrum and bispectrum to correct for the mismatch of the true cosmology and the fiducial cosmology (with ) used to convert the angles and redshifts in the galaxy catalogs to rectilinear coordinates. Following this conversion, the power spectrum and bispectrum are then converted into the measured multipoles by integrating over the requisite angles Scoccimarro (2015); Scoccimarro et al. (1999) and combined into the measured -bins, including weights to correct for discreteness effects as described in Ivanov et al. (2023). No such conversions are needed for the angular power spectrum multipoles which are given in the Limber approximation by Limber (1953); LoVerde and Afshordi (2008)
where is comoving distance and the CMB lensing and galaxy density kernels are given by
We evaluate at the effective redshift rather than parameterizing its redshift evolution since the galaxy redshift distribution is very narrow. Furthermore, is the galaxy lensing kernel and is the magnification bias—the latter contribution was studied extensively in Wenzl et al. (2024c) and we use the values of measured for LOWZ and CMASS therein. Unlike the term, the magnification bias contribution probes the matter power spectrum to non-linear scales, though its support at the smallest scale is curtailed since fall to zero at short distances. As this term gives only a small contribution, but one dependent on non-perturbative physics, we model it via the one-loop EFT prediction supplemented with a phenomenological “resummed” version of the counterterm whose parameters were fitted from HMcode Mead et al. (2015). We stress that the choice of non-linear corrections for the magnification bias has a negligible impact on final results.
Our baseline analysis of BOSS (which we dub +BAO) uses redshift-space scale cuts and , and real-space scale cuts for and at (corresponding to angular cuts ) validated in Ivanov et al. (2020a); Nishimichi et al. (2020); Chudaykin et al. (2021a); Schmittfull et al. (2021); Ivanov et al. (2022b, a); Philcox and Ivanov (2022); Chen et al. (2022); Ivanov et al. (2023); Krause et al. (2024).
Parametrization and priors. — In this Letter, we follow the EFT parametrization in Ivanov et al. (2020a); Philcox and Ivanov (2022); Ivanov et al. (2023); Krause et al. (2024). Briefly, galaxy clustering is described by one linear, two quadratic, and one cubic bias parameters, along with three counterterms and three stochastic terms up to in scale dependence. In addition to these contributions we include a next-order finger-of-god (FoG Jackson (1972)) term to account for the effect leading to larger dynamical non-linearities than other effects Chudaykin et al. (2020). The tree-level bispectrum is described by these bias parameters up to quadratic order and two additional stochastic terms associated with the non-Gaussianity and density-dependence of short modes and, like the power spectrum, a phenomenological FoG term. The real-space clustering of matter requires an additional real space counterterm , for which we use the Gaussian prior in units , resulting in 14 free parameters per sample.444Part of this counterterm also enters the galaxy power spectrum, but the counterterm combinations that appear in are linearly independent from that of , leading to four parameters for four independent spectra.
Results. — We start by analyzing the BOSS FS and BAO data within the baseline CDM model. Our results are displayed in Fig. 2 and Tab. 1. We find that the optimal values of cosmological parameters are consistent with the Planck baseline CMB values Aghanim et al. (2020), except for , which shows a disagreement. The tension with the ACT CMB lensing results Madhavacheril et al. (2024) has a similar strength: 4.3. For the parameter, the discrepancy is somewhat weaker, , though our results appear in agreement with weak lensing measurements by DES Abbott et al. (2022), KiDS Asgari et al. (2021), and HSC Dalal et al. (2023); Miyatake et al. (2023), see Fig. 1.
| Parameter | CDM | DDE | ||
|---|---|---|---|---|
Notably, the tension remains for different subsets of the underlying data (see Fig. 1). Our tests include: (a) adopting a more conservative choice of for the lensing data (which yields ); (b) fitting only the galaxy power spectrum multipoles using the Lagrangian EFT with the velocileptors code555https://github.com/sfschen/velocileptors/ Chen et al. (2020, 2021, 2022b); Maus et al. (2024a) (); (c) fitting only the multipoles plus CMB-lensing cross correlation () as in ref. Chen et al. (2022a)666https://github.com/sfschen/BOSSxPlanck; (d) removing the galaxy-CMB lensing cross correlation (); (e) analyzing the z1/z3 split of the BOSS data including LOWZE2/LOWZE3 samples omitted in our main FS analysis (). We find consistent results in all cases (Fig. 1).
Another important observation is that the preference for low is not a prior effect (see e.g. Ivanov et al. (2020a); Chudaykin et al. (2021b); Philcox and Ivanov (2022) for related studies), as previous studies have shown that the preference for a low value in the BOSS data is present at the level of the raw statistic Chen et al. (2022b); Philcox and Ivanov (2022). The tension also remains when more informative reasonably narrow priors are applied. It will be interesting to see if informative simulation-based priors Ivanov et al. (2024a) can sharpen our constraints further.
Secondly, we analyze the full combination of BOSS clustering, DESI BAO, and SNe data assuming the DDE model. Our results are shown in Fig. 2 and Tab. 1. The inferred value is consistent with previous CMB and LSS measurements based on the CDM model, confirming the standard lore that DDE cannot resolve the Hubble tension (Di Valentino et al., 2021). Turning to the tension, we find nearly identical constraints in the DDE model as in CDM, implying that DDE cannot resolve the discrepancy in the BOSS galaxy clustering data. Finally, we observe that the posterior is consistent with the CDM values within 68% CL.
Notably, the FS data provides an independent channel to extract (and ), relevant for the DDE constraints Ivanov et al. (2020a); Chudaykin et al. (2021b). Our analysis suggests that the inclusion of this information leads to a non-detection of DDE, compared to the weak preference found in Appendix A of (Adame et al., 2024), which used only the BAO data from BOSS/eBOSS. The BOSS FS data delivers constraints on the matter density whose precision rivals that of the Planck CMB, which when combined with DESI and PantheonPlus, cf. Adame et al. (2024), i.e. BOSS FS can competitively replace the CMB in breaking degeneracies inherent in BAO data. This remains true if we vary the spectral tilt in the fit; as such, our results do not require any input from the CMB.777In this case, we find , , .
Conclusions. — In this Letter, we have presented a novel analysis of public galaxy clustering and CMB lensing data from Planck and BOSS, representing the most complete combination of galaxy correlators yet performed. Our results suggest a value of the mass fluctuation amplitude in tension with the best-fit CDM value predicted by Planck CMB anisotropies, which cannot be accounted for by dynamical dark energy (DDE); furthermore, the combination of BOSS with BAO data from DESI and expansion data from supernovae does not yield any evidence for DDE. Our results have several important implications.
From the phenomenological perspective, it would be interesting to build a model that can resolve this tension. There exist many proposals that can readily produce some suppression on small scales, such as massive neutrinos Lesgourgues and Pastor (2006); Ivanov et al. (2020b), ultralight axions Laguë et al. (2022); Rogers et al. (2023), light but massive relics Xu et al. (2022), baryon-dark matter scattering He et al. (2023), dark sector interactions Rubira et al. (2023); Nunes et al. (2022); Joseph et al. (2023), and beyond; however, it is unclear whether these can account for the part of the suppression in BOSS that is present on large scales Chen et al. (2022b); Philcox and Ivanov (2022). In addition, such a model should keep cosmic structure at unsuppressed, as suggested by eBOSS quasar Neveux et al. (2020); Chudaykin and Ivanov (2023) and Lyman- data Chabanier et al. (2019); Ivanov et al. (2024b).
The tension is generated by data that effectively measure the cross-correlation between the galaxy field and a probe of matter, through either CMB lensing or redshift-space distortions (which probe the velocity field): is extracted from the ratio between the relevant cross- (i.e. the quadrupole and ) and auto- galaxy power spectrum (i.e. the monopole). An additive foreground, arising for example due to contaminants in the photometric selection of target galaxies, would enhance the auto-spectrum but cancel in both cross-correlations, leading to smaller ratios between them and consequently lower . If such a systematic correction is present, it will affect these two seemingly independent measurements of in a correlated fashion. That said, the addition of the bispectrum, which instead probes structure growth through cancelling quadratic and linear terms in the redshift-space galaxy density, is also found to reduce the measured , though we caution that the impact of foreground systematics on the 3-point function is less well-explored. In any case, we expect the coming generation of galaxy surveys, which feature more robust data and updated treatments of foreground systematics, to shed light on this issue.
Finally, it will be important to understand if the tensions in the expansion history, particularly due to deviations away from a cosmological constant, that appear from different combinations of the LSS data from BOSS and DESI are physical, and if there is a new physics model that can account for them in a consistent manner. Such effects, as well as further examination of the low- discrepancy, will certainly be illuminated with future full-shape analyses of galaxy clustering data from DESI Maus et al. (2024b) and beyond.
Acknowledgements. — We are grateful to Emanuele Castorina, Guido D’Amico, Julien Lesgourgues, John Peacock, Douglas Scott, Martin White, Matias Zaldarriaga, and Pierre Zhang for insightful discussions. SC acknowledges the support of the National Science Foundation at the Institute for Advanced Study. OHEP is a Junior Fellow of the Simons Society of Fellows. We thank the City of Edinburgh for their kaleidoscopic selection of mashed grains.
References
- Aghanim et al. (2020) N. Aghanim et al. (Planck), Astron. Astrophys. 641, A6 (2020), [Erratum: Astron.Astrophys. 652, C4 (2021)], arXiv:1807.06209 [astro-ph.CO] .
- Alam et al. (2021) S. Alam et al. (eBOSS), Phys. Rev. D 103, 083533 (2021), arXiv:2007.08991 [astro-ph.CO] .
- Weinberg (1989) S. Weinberg, Rev. Mod. Phys. 61, 1 (1989).
- Burgess (2015) C. P. Burgess, in 100e Ecole d’Ete de Physique: Post-Planck Cosmology (2015) pp. 149–197, arXiv:1309.4133 [hep-th] .
- Weinberg (1987) S. Weinberg, Phys. Rev. Lett. 59, 2607 (1987).
- Polchinski (2006) J. Polchinski, in 23rd Solvay Conference in Physics: The Quantum Structure of Space and Time (2006) pp. 216–236, arXiv:hep-th/0603249 .
- DESI Collaboration et al. (2024a) DESI Collaboration, A. G. Adame, J. Aguilar, S. Ahlen, S. Alam, D. M. Alexander, M. Alvarez, O. Alves, A. Anand, U. Andrade, et al., arXiv e-prints , arXiv:2404.03000 (2024a), arXiv:2404.03000 [astro-ph.CO] .
- DESI Collaboration et al. (2024b) DESI Collaboration, A. G. Adame, J. Aguilar, S. Ahlen, S. Alam, D. M. Alexander, M. Alvarez, O. Alves, A. Anand, U. Andrade, et al., arXiv e-prints , arXiv:2404.03001 (2024b), arXiv:2404.03001 [astro-ph.CO] .
- Adame et al. (2024) A. G. Adame et al. (DESI), (2024), arXiv:2404.03002 [astro-ph.CO] .
- Riess et al. (2022) A. G. Riess et al., Astrophys. J. Lett. 934, L7 (2022), arXiv:2112.04510 [astro-ph.CO] .
- Di Valentino et al. (2021) E. Di Valentino et al., Astropart. Phys. 131, 102604 (2021), arXiv:2008.11285 [astro-ph.CO] .
- Nguyen et al. (2023) N.-M. Nguyen, D. Huterer, and Y. Wen, Phys. Rev. Lett. 131, 111001 (2023), arXiv:2302.01331 [astro-ph.CO] .
- Abdalla et al. (2022) E. Abdalla et al., JHEAp 34, 49 (2022), arXiv:2203.06142 [astro-ph.CO] .
- Ade et al. (2016) P. A. R. Ade et al. (Planck), Astron. Astrophys. 594, A24 (2016), arXiv:1502.01597 [astro-ph.CO] .
- Bolliet et al. (2020) B. Bolliet, T. Brinckmann, J. Chluba, and J. Lesgourgues, Mon. Not. Roy. Astron. Soc. 497, 1332 (2020), arXiv:1906.10359 [astro-ph.CO] .
- Asgari et al. (2021) M. Asgari et al. (KiDS), Astron. Astrophys. 645, A104 (2021), arXiv:2007.15633 [astro-ph.CO] .
- Abbott et al. (2022) T. M. C. Abbott et al. (DES), Phys. Rev. D 105, 023520 (2022), arXiv:2105.13549 [astro-ph.CO] .
- Marques et al. (2024) G. A. Marques et al. (ACT, DES), JCAP 01, 033 (2024), arXiv:2306.17268 [astro-ph.CO] .
- White et al. (2022) M. White et al., JCAP 02, 007 (2022), arXiv:2111.09898 [astro-ph.CO] .
- Ivanov et al. (2023) M. M. Ivanov, O. H. E. Philcox, G. Cabass, T. Nishimichi, M. Simonović, and M. Zaldarriaga, Phys. Rev. D 107, 083515 (2023), arXiv:2302.04414 [astro-ph.CO] .
- Philcox and Ivanov (2022) O. H. E. Philcox and M. M. Ivanov, Phys. Rev. D 105, 043517 (2022), arXiv:2112.04515 [astro-ph.CO] .
- Chen et al. (2022a) S.-F. Chen, M. White, J. DeRose, and N. Kokron, JCAP 07, 041 (2022a), arXiv:2204.10392 [astro-ph.CO] .
- Chen et al. (2022b) S.-F. Chen, Z. Vlah, and M. White, JCAP 02, 008 (2022b), arXiv:2110.05530 [astro-ph.CO] .
- Ivanov (2021) M. M. Ivanov, Phys. Rev. D 104, 103514 (2021), arXiv:2106.12580 [astro-ph.CO] .
- Beutler et al. (2017) F. Beutler et al. (BOSS), Mon. Not. Roy. Astron. Soc. 466, 2242 (2017), arXiv:1607.03150 [astro-ph.CO] .
- Horowitz and Seljak (2017) B. Horowitz and U. Seljak, Mon. Not. Roy. Astron. Soc. 469, 394 (2017), arXiv:1609.01850 [astro-ph.CO] .
- Kobayashi et al. (2022) Y. Kobayashi, T. Nishimichi, M. Takada, and H. Miyatake, Phys. Rev. D 105, 083517 (2022), arXiv:2110.06969 [astro-ph.CO] .
- Dalal et al. (2023) R. Dalal, X. Li, A. Nicola, J. Zuntz, M. A. Strauss, S. Sugiyama, T. Zhang, M. M. Rau, R. Mandelbaum, M. Takada, et al., Phys. Rev. D 108, 123519 (2023), arXiv:2304.00701 [astro-ph.CO] .
- Miyatake et al. (2023) H. Miyatake, S. Sugiyama, M. Takada, T. Nishimichi, X. Li, M. Shirasaki, S. More, Y. Kobayashi, A. J. Nishizawa, M. M. Rau, et al., Phys. Rev. D 108, 123517 (2023), arXiv:2304.00704 [astro-ph.CO] .
- Yu et al. (2023) B. Yu, U. Seljak, Y. Li, and S. Singh, JCAP 04, 057 (2023), arXiv:2211.16794 [astro-ph.CO] .
- D’Amico et al. (2024) G. D’Amico, Y. Donath, M. Lewandowski, L. Senatore, and P. Zhang, JCAP 05, 059 (2024), arXiv:2206.08327 [astro-ph.CO] .
- Farren et al. (2024) G. S. Farren et al. (ACT), Astrophys. J. 966, 157 (2024), arXiv:2309.05659 [astro-ph.CO] .
- Shaikh et al. (2024) S. Shaikh et al. (ACT, DES), Mon. Not. Roy. Astron. Soc. 528, 2112 (2024), arXiv:2309.04412 [astro-ph.CO] .
- Chen et al. (2022) S.-F. Chen, M. White, J. DeRose, and N. Kokron, JCAP 2022, 041 (2022), arXiv:2204.10392 [astro-ph.CO] .
- Busch et al. (2022) J. L. v. d. Busch et al., Astron. Astrophys. 664, A170 (2022), arXiv:2204.02396 [astro-ph.CO] .
- Madhavacheril et al. (2024) M. S. Madhavacheril et al. (ACT), Astrophys. J. 962, 113 (2024), arXiv:2304.05203 [astro-ph.CO] .
- Tristram et al. (2024) M. Tristram et al., Astron. Astrophys. 682, A37 (2024), arXiv:2309.10034 [astro-ph.CO] .
- Ivanov et al. (2020a) M. M. Ivanov, M. Simonović, and M. Zaldarriaga, JCAP 05, 042 (2020a), arXiv:1909.05277 [astro-ph.CO] .
- Ivanov et al. (2020b) M. M. Ivanov, M. Simonović, and M. Zaldarriaga, Phys. Rev. D 101, 083504 (2020b), arXiv:1912.08208 [astro-ph.CO] .
- Ivanov et al. (2022a) M. M. Ivanov, O. H. E. Philcox, M. Simonović, M. Zaldarriaga, T. Nischimichi, and M. Takada, Phys. Rev. D 105, 043531 (2022a), arXiv:2110.00006 [astro-ph.CO] .
- Philcox et al. (2020) O. H. E. Philcox, M. M. Ivanov, M. Simonović, and M. Zaldarriaga, JCAP 2020, 032 (2020), arXiv:2002.04035 [astro-ph.CO] .
- Wenzl et al. (2024a) L. Wenzl, R. Bean, S.-F. Chen, G. S. Farren, M. S. Madhavacheril, G. A. Marques, F. J. Qu, N. Sehgal, B. D. Sherwin, et al., Phys. Rev. D 109, 083540 (2024a), arXiv:2401.12971 [astro-ph.CO] .
- Pullen et al. (2016) A. R. Pullen, S. Alam, S. He, and S. Ho, MNRAS 460, 4098 (2016), arXiv:1511.04457 .
- Singh et al. (2017) S. Singh, R. Mandelbaum, and J. R. Brownstein, MNRAS 464, 2120 (2017), arXiv:1606.08841 .
- Doux et al. (2018) C. Doux, M. Penna-Lima, S. D. P. Vitenti, J. Tréguer, E. Aubourg, and K. Ganga, MNRAS 480, 5386 (2018), arXiv:1706.04583 [astro-ph.CO] .
- Singh et al. (2019) S. Singh, S. Alam, R. Mandelbaum, U. Seljak, S. Rodriguez-Torres, and S. Ho, MNRAS 482, 785 (2019), arXiv:1803.08915 [astro-ph.CO] .
- Darwish et al. (2021) O. Darwish, M. S. Madhavacheril, B. D. Sherwin, S. Aiola, N. Battaglia, J. A. Beall, D. T. Becker, J. R. Bond, E. Calabrese, S. K. Choi, et al., MNRAS 500, 2250 (2021), arXiv:2004.01139 [astro-ph.CO] .
- Wenzl et al. (2024b) L. Wenzl, R. An, N. Battaglia, R. Bean, E. Calabrese, S.-F. Chen, S. K. Choi, O. Darwish, J. Dunkley, G. S. Farren, et al., arXiv e-prints , arXiv:2405.12795 (2024b), arXiv:2405.12795 [astro-ph.CO] .
- D’Amico et al. (2020) G. D’Amico, J. Gleyzes, N. Kokron, K. Markovic, L. Senatore, P. Zhang, F. Beutler, and H. Gil-Marín, JCAP 05, 005 (2020), arXiv:1909.05271 [astro-ph.CO] .
- Freedman and Madore (2022) W. L. Freedman and B. F. Madore, IAU Symp. 376, 1 (2022), arXiv:2308.02474 [astro-ph.CO] .
- Reid et al. (2016) B. Reid, S. Ho, N. Padmanabhan, W. J. Percival, J. Tinker, R. Tojeiro, M. White, D. J. Eisenstein, C. Maraston, A. J. Ross, et al., MNRAS 455, 1553 (2016), arXiv:1509.06529 [astro-ph.CO] .
- Dawson et al. (2013) K. S. Dawson et al. (BOSS), Astron. J. 145, 10 (2013), arXiv:1208.0022 [astro-ph.CO] .
- Gil-Marín et al. (2016) H. Gil-Marín, W. J. Percival, J. R. Brownstein, C.-H. Chuang, J. N. Grieb, S. Ho, F.-S. Kitaura, C. Maraston, F. Prada, S. Rodríguez-Torres, et al., MNRAS 460, 4188 (2016), arXiv:1509.06386 [astro-ph.CO] .
- Philcox (2021a) O. H. E. Philcox, Phys. Rev. D 103, 103504 (2021a), arXiv:2012.09389 [astro-ph.CO] .
- Philcox (2021b) O. H. E. Philcox, Phys. Rev. D 104, 123529 (2021b), arXiv:2107.06287 [astro-ph.CO] .
- Philcox and Flöss (2024) O. H. E. Philcox and T. Flöss, (2024), arXiv:2404.07249 [astro-ph.CO] .
- Alam et al. (2017) S. Alam et al. (BOSS), Mon. Not. Roy. Astron. Soc. 470, 2617 (2017), arXiv:1607.03155 [astro-ph.CO] .
- Kitaura et al. (2016) F.-S. Kitaura et al., Mon. Not. Roy. Astron. Soc. 456, 4156 (2016), arXiv:1509.06400 [astro-ph.CO] .
- Rodríguez-Torres et al. (2016) S. A. Rodríguez-Torres et al., Mon. Not. Roy. Astron. Soc. 460, 1173 (2016), arXiv:1509.06404 [astro-ph.CO] .
- Carron et al. (2022) J. Carron, M. Mirmelstein, and A. Lewis, JCAP 2022, 039 (2022), arXiv:2206.07773 [astro-ph.CO] .
- Alonso et al. (2019) D. Alonso, J. Sanchez, A. Slosar, and LSST Dark Energy Science Collaboration, MNRAS 484, 4127 (2019), arXiv:1809.09603 [astro-ph.CO] .
- Taylor and Markovič (2022) P. L. Taylor and K. Markovič, Phys. Rev. D 106, 063536 (2022), arXiv:2205.14167 [astro-ph.CO] .
- Scolnic et al. (2022) D. Scolnic, D. Brout, A. Carr, A. G. Riess, T. M. Davis, A. Dwomoh, D. O. Jones, N. Ali, P. Charvu, R. Chen, et al., ApJ 938, 113 (2022), arXiv:2112.03863 [astro-ph.CO] .
- Riess et al. (2022) A. G. Riess, W. Yuan, L. M. Macri, D. Scolnic, D. Brout, S. Casertano, D. O. Jones, Y. Murakami, G. S. Anand, L. Breuval, et al., ApJ 934, L7 (2022), arXiv:2112.04510 [astro-ph.CO] .
- Beutler et al. (2011) F. Beutler, C. Blake, M. Colless, D. H. Jones, L. Staveley-Smith, L. Campbell, Q. Parker, W. Saunders, and F. Watson, MNRAS 416, 3017 (2011), arXiv:1106.3366 [astro-ph.CO] .
- Ross et al. (2015) A. J. Ross, L. Samushia, C. Howlett, W. J. Percival, A. Burden, and M. Manera, MNRAS 449, 835 (2015), arXiv:1409.3242 [astro-ph.CO] .
- Audren et al. (2013) B. Audren, J. Lesgourgues, K. Benabed, and S. Prunet, JCAP 02, 001 (2013), arXiv:1210.7183 [astro-ph.CO] .
- Brinckmann and Lesgourgues (2019) T. Brinckmann and J. Lesgourgues, Phys. Dark Univ. 24, 100260 (2019), arXiv:1804.07261 [astro-ph.CO] .
- Cooke et al. (2018) R. J. Cooke, M. Pettini, and C. C. Steidel, Astrophys. J. 855, 102 (2018), arXiv:1710.11129 [astro-ph.CO] .
- Fang et al. (2008) W. Fang, W. Hu, and A. Lewis, Phys. Rev. D 78, 087303 (2008), arXiv:0808.3125 [astro-ph] .
- Baumann et al. (2012) D. Baumann, A. Nicolis, L. Senatore, and M. Zaldarriaga, JCAP 07, 051 (2012), arXiv:1004.2488 [astro-ph.CO] .
- Carrasco et al. (2012) J. J. M. Carrasco, M. P. Hertzberg, and L. Senatore, JHEP 09, 082 (2012), arXiv:1206.2926 [astro-ph.CO] .
- Ivanov (2023) M. M. Ivanov, “Effective Field Theory for Large-Scale Structure,” (2023) arXiv:2212.08488 [astro-ph.CO] .
- Chudaykin et al. (2020) A. Chudaykin, M. M. Ivanov, O. H. E. Philcox, and M. Simonović, Phys. Rev. D 102, 063533 (2020), arXiv:2004.10607 [astro-ph.CO] .
- Chudaykin et al. (2021a) A. Chudaykin, M. M. Ivanov, and M. Simonović, Phys. Rev. D 103, 043525 (2021a), arXiv:2009.10724 [astro-ph.CO] .
- Philcox and Ivanov (2022) O. H. E. Philcox and M. M. Ivanov, Phys. Rev. D 105, 043517 (2022), arXiv:2112.04515 [astro-ph.CO] .
- Blas et al. (2016a) D. Blas, M. Garny, M. M. Ivanov, and S. Sibiryakov, JCAP 07, 052 (2016a), arXiv:1512.05807 [astro-ph.CO] .
- Blas et al. (2016b) D. Blas, M. Garny, M. M. Ivanov, and S. Sibiryakov, JCAP 07, 028 (2016b), arXiv:1605.02149 [astro-ph.CO] .
- Vlah et al. (2016) Z. Vlah, U. Seljak, M. Yat Chu, and Y. Feng, JCAP 2016, 057 (2016), arXiv:1509.02120 [astro-ph.CO] .
- Ivanov and Sibiryakov (2018) M. M. Ivanov and S. Sibiryakov, JCAP 07, 053 (2018), arXiv:1804.05080 [astro-ph.CO] .
- Chen et al. (2024) S.-F. Chen, Z. Vlah, and M. White, arXiv e-prints , arXiv:2406.00103 (2024), arXiv:2406.00103 [astro-ph.CO] .
- Senatore and Zaldarriaga (2015) L. Senatore and M. Zaldarriaga, JCAP 02, 013 (2015), arXiv:1404.5954 [astro-ph.CO] .
- Baldauf et al. (2015) T. Baldauf, M. Mirbabayi, M. Simonović, and M. Zaldarriaga, Phys. Rev. D 92, 043514 (2015), arXiv:1504.04366 [astro-ph.CO] .
- Scoccimarro (2015) R. Scoccimarro, Phys. Rev. D 92, 083532 (2015), arXiv:1506.02729 [astro-ph.CO] .
- Scoccimarro et al. (1999) R. Scoccimarro, H. M. P. Couchman, and J. A. Frieman, Astrophys. J. 517, 531 (1999), arXiv:astro-ph/9808305 .
- Limber (1953) D. N. Limber, ApJ 117, 134 (1953).
- LoVerde and Afshordi (2008) M. LoVerde and N. Afshordi, Phys. Rev. D 78, 123506 (2008), arXiv:0809.5112 [astro-ph] .
- Wenzl et al. (2024c) L. Wenzl, S.-F. Chen, and R. Bean, MNRAS 527, 1760 (2024c), arXiv:2308.05892 [astro-ph.CO] .
- Mead et al. (2015) A. Mead, J. Peacock, C. Heymans, S. Joudaki, and A. Heavens, Mon. Not. Roy. Astron. Soc. 454, 1958 (2015), arXiv:1505.07833 [astro-ph.CO] .
- Nishimichi et al. (2020) T. Nishimichi, G. D’Amico, M. M. Ivanov, L. Senatore, M. Simonović, M. Takada, M. Zaldarriaga, and P. Zhang, Phys. Rev. D 102, 123541 (2020), arXiv:2003.08277 [astro-ph.CO] .
- Schmittfull et al. (2021) M. Schmittfull, M. Simonović, M. M. Ivanov, O. H. E. Philcox, and M. Zaldarriaga, JCAP 05, 059 (2021), arXiv:2012.03334 [astro-ph.CO] .
- Ivanov et al. (2022b) M. M. Ivanov, O. H. E. Philcox, T. Nishimichi, M. Simonović, M. Takada, and M. Zaldarriaga, Phys. Rev. D 105, 063512 (2022b), arXiv:2110.10161 [astro-ph.CO] .
- Krause et al. (2024) E. Krause et al. (Beyond-2pt), (2024), arXiv:2405.02252 [astro-ph.CO] .
- Jackson (1972) J. C. Jackson, Mon. Not. Roy. Astron. Soc. 156, 1P (1972), arXiv:0810.3908 [astro-ph] .
- Chen et al. (2020) S.-F. Chen, Z. Vlah, and M. White, JCAP 2020, 062 (2020), arXiv:2005.00523 [astro-ph.CO] .
- Chen et al. (2021) S.-F. Chen, Z. Vlah, E. Castorina, and M. White, JCAP 2021, 100 (2021), arXiv:2012.04636 [astro-ph.CO] .
- Maus et al. (2024a) M. Maus, S. Chen, M. White, J. Aguilar, S. Ahlen, A. Aviles, S. Brieden, D. Brooks, T. Claybaugh, S. Cole, et al., arXiv e-prints , arXiv:2404.07312 (2024a), arXiv:2404.07312 [astro-ph.CO] .
- Chudaykin et al. (2021b) A. Chudaykin, K. Dolgikh, and M. M. Ivanov, Phys. Rev. D 103, 023507 (2021b), arXiv:2009.10106 [astro-ph.CO] .
- Ivanov et al. (2024a) M. M. Ivanov, C. Cuesta-Lazaro, S. Mishra-Sharma, A. Obuljen, and M. W. Toomey, (2024a), arXiv:2402.13310 [astro-ph.CO] .
- Lesgourgues and Pastor (2006) J. Lesgourgues and S. Pastor, Phys. Rept. 429, 307 (2006), arXiv:astro-ph/0603494 .
- Laguë et al. (2022) A. Laguë, J. R. Bond, R. Hložek, K. K. Rogers, D. J. E. Marsh, and D. Grin, JCAP 01, 049 (2022), arXiv:2104.07802 [astro-ph.CO] .
- Rogers et al. (2023) K. K. Rogers, R. Hložek, A. Laguë, M. M. Ivanov, O. H. E. Philcox, G. Cabass, K. Akitsu, and D. J. E. Marsh, JCAP 06, 023 (2023), arXiv:2301.08361 [astro-ph.CO] .
- Xu et al. (2022) W. L. Xu, J. B. Muñoz, and C. Dvorkin, Phys. Rev. D 105, 095029 (2022), arXiv:2107.09664 [astro-ph.CO] .
- He et al. (2023) A. He, M. M. Ivanov, R. An, and V. Gluscevic, Astrophys. J. Lett. 954, L8 (2023), arXiv:2301.08260 [astro-ph.CO] .
- Rubira et al. (2023) H. Rubira, A. Mazoun, and M. Garny, JCAP 01, 034 (2023), arXiv:2209.03974 [astro-ph.CO] .
- Nunes et al. (2022) R. C. Nunes, S. Vagnozzi, S. Kumar, E. Di Valentino, and O. Mena, Phys. Rev. D 105, 123506 (2022), arXiv:2203.08093 [astro-ph.CO] .
- Joseph et al. (2023) M. Joseph, D. Aloni, M. Schmaltz, E. N. Sivarajan, and N. Weiner, Phys. Rev. D 108, 023520 (2023), arXiv:2207.03500 [astro-ph.CO] .
- Neveux et al. (2020) R. Neveux et al. (eBOSS), Mon. Not. Roy. Astron. Soc. 499, 210 (2020), arXiv:2007.08999 [astro-ph.CO] .
- Chudaykin and Ivanov (2023) A. Chudaykin and M. M. Ivanov, Phys. Rev. D 107, 043518 (2023), arXiv:2210.17044 [astro-ph.CO] .
- Chabanier et al. (2019) S. Chabanier et al. (eBOSS), JCAP 07, 017 (2019), arXiv:1812.03554 [astro-ph.CO] .
- Ivanov et al. (2024b) M. M. Ivanov, M. W. Toomey, and N. G. Karaçaylı, (2024b), arXiv:2405.13208 [astro-ph.CO] .
- Maus et al. (2024b) M. Maus, Y. Lai, H. E. Noriega, S. Ramirez-Solano, A. Aviles, S. Chen, S. Fromenteau, H. Gil-Marín, C. Howlett, M. Vargas-Magaña, et al., arXiv e-prints , arXiv:2404.07272 (2024b), arXiv:2404.07272 [astro-ph.CO] .