Derivation of Chaotic Dynamics from Montgomery Conjecture and Its Interpretation as an Electrical System ††thanks: Citation: Authors. Title. Pages…. DOI:000000/11111.
Abstract
In this paper, we present an innovative derivation of chaotic dynamics rooted in the Montgomery conjecture, specifically addressing the pair correlation of Riemann zeta function zeros. Our exploration unveils a recursive relation inspired by the conjecture, manifesting chaotic behavior. Remarkably, we interpret this derived chaotic dynamics as a unique representation of an electrical system, providing a novel perspective within the domain of electrical engineering.
Beyond this groundbreaking derivation, our study delves into the potential applications of chaos theory, bifurcation analysis, and entropy within the framework of this electrical system. We scrutinize the implications of chaos for signal processing, conduct stability analysis through bifurcation studies, and investigate the role of entropy in quantifying the randomness or predictability of electrical signals. Additionally, we explore energy distribution aspects within the electrical system, shedding light on how chaotic dynamics influence energy dissipation and allocation.
In the course of our research, a new finding emerged, contributing to our understanding of the derived chaotic dynamics. This discovery enhances the applicability of our framework within electrical engineering, paving the way for innovative applications and deeper explorations in the realm of system dynamics.
Moreover, we draw comparisons with the dynamics presented in our recent paper published in the European Physical Journal, specifically addressing Yitang Zhang’s contributions. This comparative analysis further underscores the unique characteristics and potential applications of the derived chaotic dynamics.
This study not only elucidates the intricate connection between chaotic dynamics and number theory but also offers a transformative perspective that extends the boundaries of conventional electrical system analysis
Keywords Montgomery’s Pair Correlation Conjecture Chaotic dynamics Controle theory Energy storage
Notation
In this study, we utilize various notations crucial to understanding the dynamics of chaotic systems arising from Dirichlet -functions and their implications in number theory and control theory.
-
•
: Dirichlet -function at associated with the character modulo .
-
•
: An absolute, effectively computable constant.
-
•
: A real primitive character modulo .
-
•
: Natural logarithm of .
-
•
: Typically signifies a complex variable in the context of Dirichlet -functions.
-
•
Entropy: A measure characterizing the unpredictability of chaotic dynamics.
-
•
Lyapunov exponents: Quantify the rate of separation or convergence of nearby trajectories in a dynamical system.
-
•
Zeros of arithmetic functions: Specifically referring to the zeros of Dirichlet -functions.
-
•
Numerical measure: A quantifiable value derived through computation.
-
•
Non-trivial solutions of arithmetic functions: Solutions other than those that trivially satisfy certain conditions.
-
•
Op-Amp Integrator Circuit (Op-Amp): A circuit employing an operational amplifier (Op-Amp) configured to perform mathematical integration on input signals.
The notation for an Op-Amp Integrator Circuit can be represented in various forms depending on the context and equation used. In general, an integrator circuit using an operational amplifier (Op-Amp) can be denoted by the following equation:
Where:
These notations are central to comprehending the concepts elucidated in this manuscript, particularly regarding chaotic dynamics, Dirichlet -functions, entropy, and their relationship with the distribution of zeros in number theory.
1 Introduction
The Montgomery pair correlation conjecture stands as a cornerstone in number theory, providing crucial insights into the statistical behavior of non-trivial zeros of the Riemann zeta function. This conjecture not only illuminates the mysterious characteristics of prime numbers but also holds significance in unraveling the intricate nature of the zeta function within the critical strip [2].
Building upon the foundational aspects of the Montgomery conjecture, our present study introduces a groundbreaking derivation of chaotic dynamics. Through the formulation of a recursive relation inspired by the conjecture, our work unveils a previously unexplored connection between number theory and chaotic behavior, marking a significant contribution to the understanding of system dynamics originating from mathematical conjectures.
Remarkably, this derived chaotic dynamics finds a compelling interpretation as an electrical system. The parallels drawn between the intricacies of number theory and the dynamics of electrical systems open new possibilities within the realm of electrical engineering. This unique perspective suggests untapped potential applications and provides novel insights into system dynamics, bridging the traditionally distinct domains of number theory and engineering.[3]
Drawing inspiration from our prior work on Yitang dynamics [1], derived from Dirichlet L-functions and rooted in Yitang Zhang’s work on Landau–Siegel zeros, we bring to light profound chaos with calculated Lyapunov exponents and entropy, emphasizing the inherent unpredictability of the system. Moreover, our exploration establishes a novel link between Fractal geometry and Quantum chaos, predicting zero distributions for both Yitang and Riemann dynamics.
The implications of this study extend beyond theoretical exploration. Our investigation into the stability of electrical systems reveals the instability of fixed points, offering both challenges and opportunities for leveraging chaotic behavior in pursuit of specific control objectives. The findings not only contribute to the broader understanding of chaotic dynamics but also pave the way for innovative applications within the field of electrical control systems.[6]
This interdisciplinary approach not only enriches our comprehension of chaotic dynamics originating from number theory but also presents avenues for real-world engineering solutions. The potential applications of Yitang dynamics in electrical control systems represent a promising consequence of the generalized Riemann hypothesis, showcasing the transformative impact of connecting mathematical conjectures to practical engineering challenges.
2 Mains Results
-
1.
Derived Electrical System: The electrical system derived from Montgomery’s Pair Correlation Conjecture is represented by the formula:
where represents the system state, while , , , and denote electrical parameters.
-
2.
Parameter Analysis Insights: Investigation into parameter variations reveals:
-
•
Smoother transitions observed when ,
-
•
Dominant and leading to periodic behaviors, and
-
•
Sensitivity to inducing significant system alterations.
-
•
-
3.
System Dynamics and Analysis:
-
•
Phase portraits confirm stable fixed points (),
-
•
Identification of limit cycles, Fourier analysis to highlight dominant frequencies, and
-
•
Poincaré section analysis showcasing recurrent states, predominantly in the negative region.
-
•
Interpreting Parameter
The parameter significantly influences energy storage behavior, impacting system stability and altering energy distribution within the components.
Energy Dynamics with
The plotted inductor’s stored energy against varied values illustrates the sensitivity of energy distribution to parameter alterations, providing crucial insights into the system’s behavior.
Energy Variation Across Range
Observing energy changes in the inductor across diverse values highlights the substantial relationship between capacitance and energy dynamics. Decreasing leads to heightened energy storage within the inductor.
Energy Distribution Implications
For our electrical system represented by the equation with parameters , , and , variations in the parameter exert significant influence on energy storage behavior.
The parameter plays a pivotal role in modulating the system’s energy dynamics. Further investigation into the relationship between and energy storage efficiency could unveil critical thresholds or optimal ranges for energy utilization within the system.
Understanding the impact of variations on energy distribution and dissipation provides insights into optimizing energy transfer and storage in electrical systems. This exploration lays the groundwork for controlling energy utilization and enhancing system stability through parameter manipulation.
3 Comparison between Yitang and Montgomery Dynamics
3.1 Comparison of Eigenvalues
Table 3 compares eigenvalues for Yitang and Montgomery dynamics.
| Dynamics | Index | Eigenvalues |
|---|---|---|
| Yitang | 1 | |
| Montgomery | 1 |
3.2 Diagonalizability
exhibits complex eigenvalues, suggesting potential complex eigenvectors. In contrast, has real eigenvalues, indicating likely diagonalizability.
4 Montgomery’s Pair Correlation Conjecture in Number Theory
In number theory, Montgomery’s Pair Correlation Conjecture is a significant hypothesis that explores the distribution of spacings between zeros of the Riemann zeta function. Proposed by Hugh L. Montgomery, the conjecture provides insights into the statistical properties of these spacings, offering connections to random matrix theory.
4.1 Background
The Riemann zeta function, denoted by , is a complex function defined for complex numbers . Its non-trivial zeros, also known as the Riemann zeros, are of great importance in number theory and the distribution of prime numbers. The conjecture focuses on the gaps between these non-trivial zeros.
4.2 Pair Correlation Conjecture
Montgomery’s Pair Correlation Conjecture addresses the pair correlation function , which measures the probability density of finding two non-trivial zeros with a normalized spacing . The conjecture can be expressed as follows:
| (1) |
where represents the non-trivial zeros of the Riemann zeta function, and GUE denotes the Gaussian Unitary Ensemble from random matrix theory.
4.3 Pair Correlation Function
The pair correlation function is defined as:
| (2) |
where and are non-trivial zeros of the Riemann zeta function.
4.4 Pair Correlation Formula with Sin Function
The pair correlation formula with the sin function is given by:
| (3) |
where is the normalized spacing between the non-trivial zeros.
4.5 Implications and Significance
The conjecture connects number theory with the behavior of random matrices [8], illustrating a surprising and deep relationship between two seemingly unrelated areas of mathematics. Successful verification of the conjecture would provide further support for the universality phenomenon observed in random matrix theory and strengthen connections between analytical and probabilistic aspects of number theory.[9]
4.6 Current Status
While Montgomery’s Pair Correlation Conjecture has been numerically supported for a vast range of zeros, a rigorous proof is yet to be established. Researchers continue to explore this fascinating conjecture, aiming to deepen our understanding of the distribution of Riemann zeros and its broader implications in mathematics.
4.7 Deriving the Dynamic System
Our research is rooted in the exploration of a dynamic system derived from Montgomery’s pair correlation conjecture ([10]). This conjecture provides a statistical model elucidating the distribution characteristics of nontrivial zeros associated with the Riemann zeta function. In this context, the pair correlation function proposed by Montgomery stands as a pivotal element.
The pair correlation function, often represented as , takes the form:
To encapsulate the essence of this conjecture within a dynamic system, we aim to translate this function into a recurrence relation. Here, symbolizes the state of the system at iteration . The core of our dynamic formula reflects the dynamism inherent in the conjecture’s essence, while the corrective term accounts for potential deviations from this idealized behavior.
The translation of the pair correlation function into a recurrence relation allows us to explore the dynamic nature of the system, drawing parallels between number theory concepts and the evolution of states in our derived electrical system.
Our derived electrical system, expressed as a recurrence relation, can be formulated as:
Here, represents the state of the system at iteration , while , , , and denote parameters mirroring aspects of resistance, capacitance, inductance, and external influences, respectively, in electrical circuits. This formulation draws intriguing parallels between number theory principles and practical electrical engineering applications, opening avenues for exploring chaotic dynamics within an electrical context.
5 Response and Robustness of the New Electrical System
This section delves into the response and robustness analysis of our newly derived electrical system [7], exploring its behavior under specific parameter values. The discussion focuses on understanding how variations in component values influence the system’s dynamics, particularly highlighting the system’s response to parameter adjustments and its stability under different settings.
5.1 Effect of Larger Compared to in the Electrical System
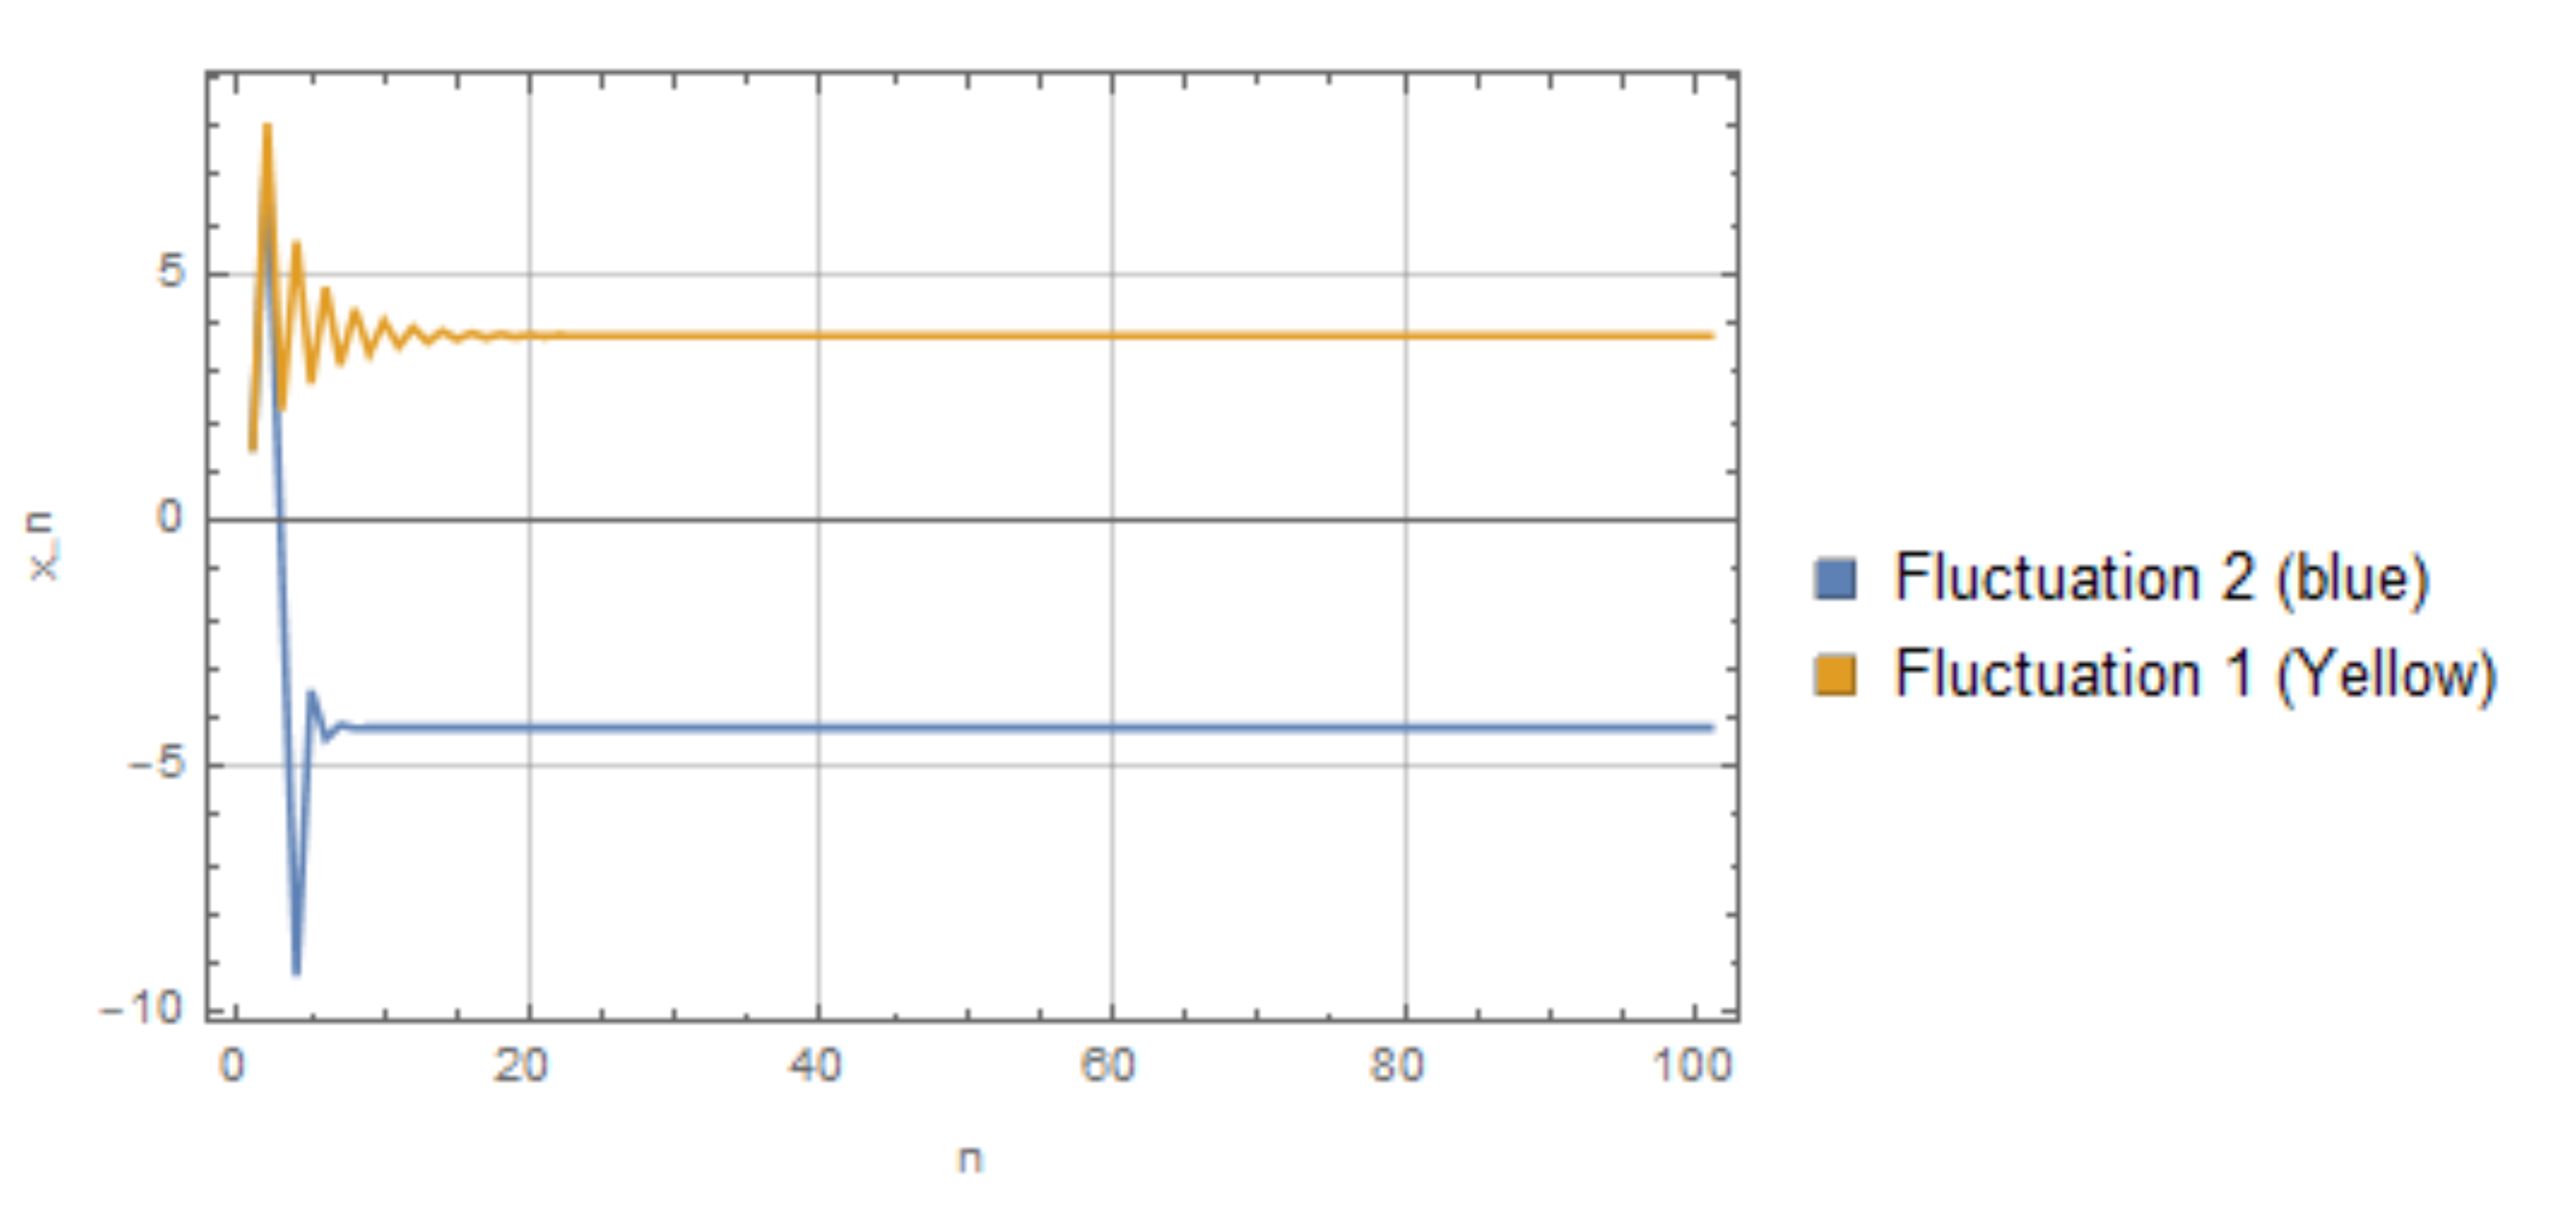
The corrected error term in the Montgomery conjecture, , embodies a small deviation, which implies surpasses in magnitude, influencing the system’s behavior. In our case, we set for , , , exploring the influence of values on the system’s dynamics. The plot in Figure 1 illustrates the behavior of the electrical system under the influence of larger compared to for the given parameter values. The yellow and blue fluctuations represent distinct system responses under different values, showcasing the system’s varying behavior as changes.
-
•
Influence of Larger : With dominating , the system’s behavior is notably influenced by the inductance (), showcasing altered dynamics compared to scenarios where is more dominant.
-
•
Reduced Contribution: The proportion becomes relatively smaller due to increased . This potentially leads to smoother transitions or more controlled oscillations in the system’s response, highlighting the reduced impact of concerning .
-
•
Roles of and : Although takes precedence, capacitance () and resistance () remain influential. governs the charging/discharging behavior, while contributes to overall system resistance.
5.2 Periodic Behavior with Larger and Dominance
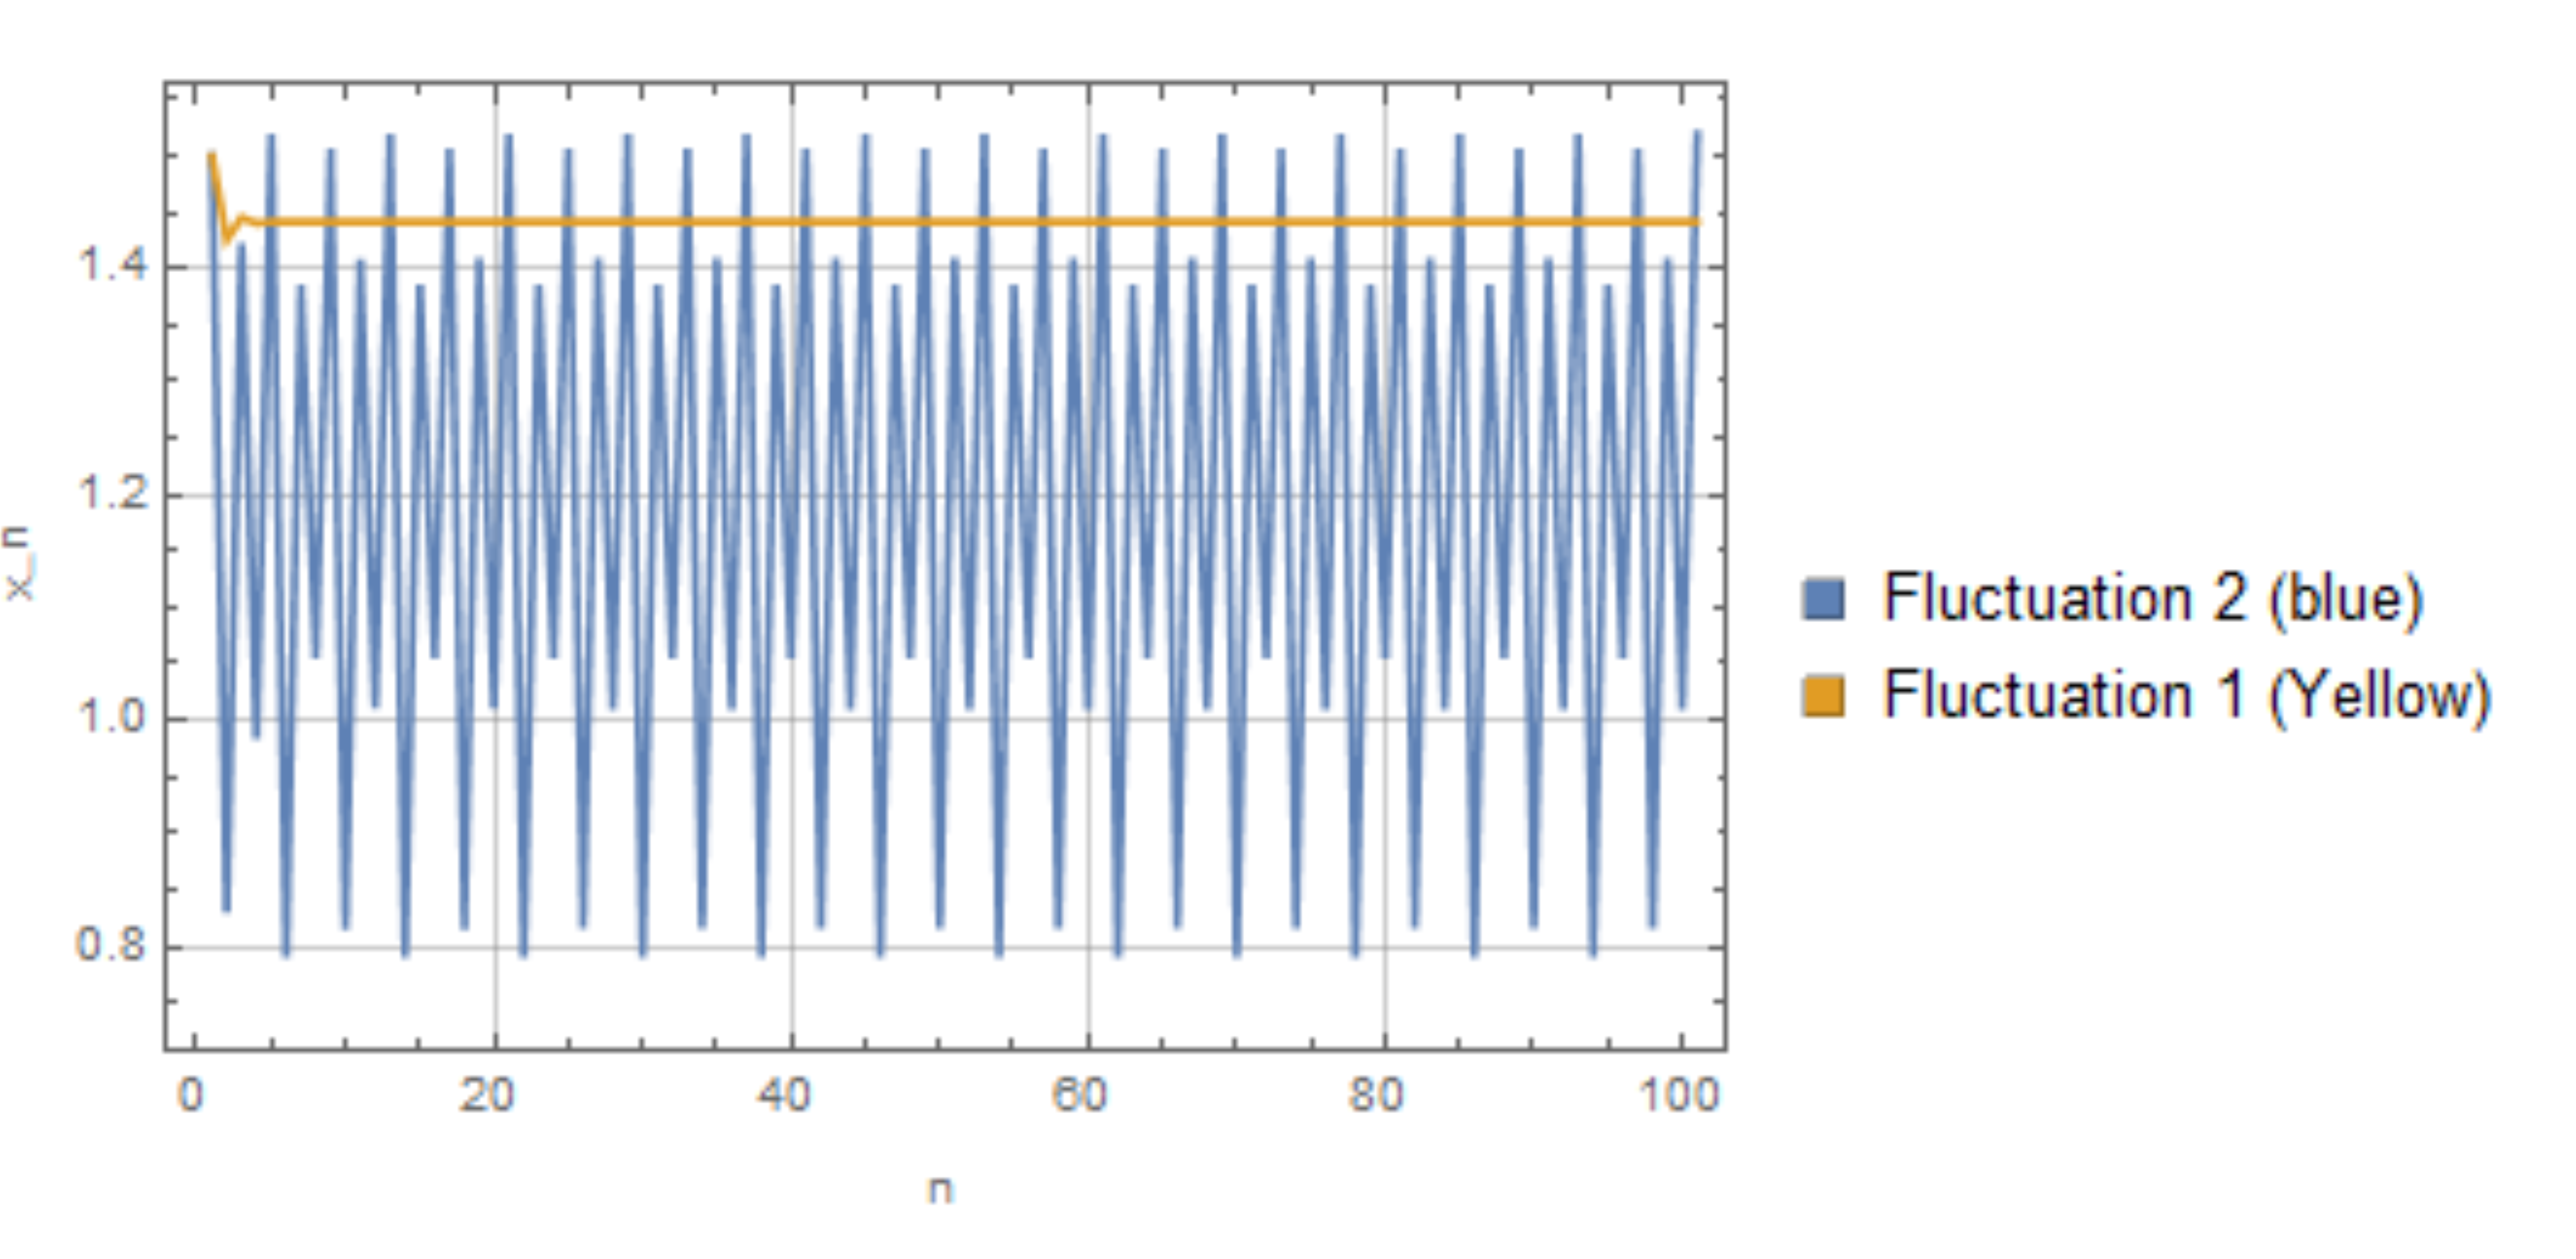
In this scenario, we explore the system’s behavior with a significantly larger capacitance () while maintaining a smaller resistance () compared to the inductance (). The resulting plot, as shown in Figure 2, illustrates a periodic response of the electrical system under varying values.
-
•
Observation of Periodicity: The blue trace in the plot exhibits periodic fluctuations, indicating a recurring pattern in the system’s response. Contrastingly, the yellow trace demonstrates a stable curve over the iterations, showing a consistent and non-periodic behavior.
-
•
Influence of and : With significantly larger and dominant over , the system exhibits a periodic response in the blue trace, showcasing the impact of capacitance and inductance on the system’s dynamics.
-
•
Stability and Regularity: While the blue trace shows periodic behavior, the yellow trace represents a stable curve, indicating a consistent and non-periodic response of the system under these conditions.
5.3 Sensitivity to Values and Absence of Yellow Fluctuation
The observed absence of the yellow fluctuation in the plot under specific value ranges indicates a sensitivity of the electrical system to variations in . In this scenario, a certain range of values (between 0.008 and 0.07 in increments of 0.7) leads to a notable change in the system’s behavior, resulting in the disappearance of the yellow fluctuation.
-
•
Effect of Sensitivity: Small changes in values appear to induce significant alterations in the system’s response, emphasizing the sensitivity of the system to this parameter.
-
•
Disappearance of Yellow Fluctuation: The absence of the yellow fluctuation within this value range might indicate a shift towards different system dynamics or the dominance of certain behaviors over others, resulting in the exclusion of the yellow trace in the plot.
-
•
Values of : Notably, within this range of values, the values of become increasingly large and negative, signifying a divergence or drastic change in the system’s behavior.
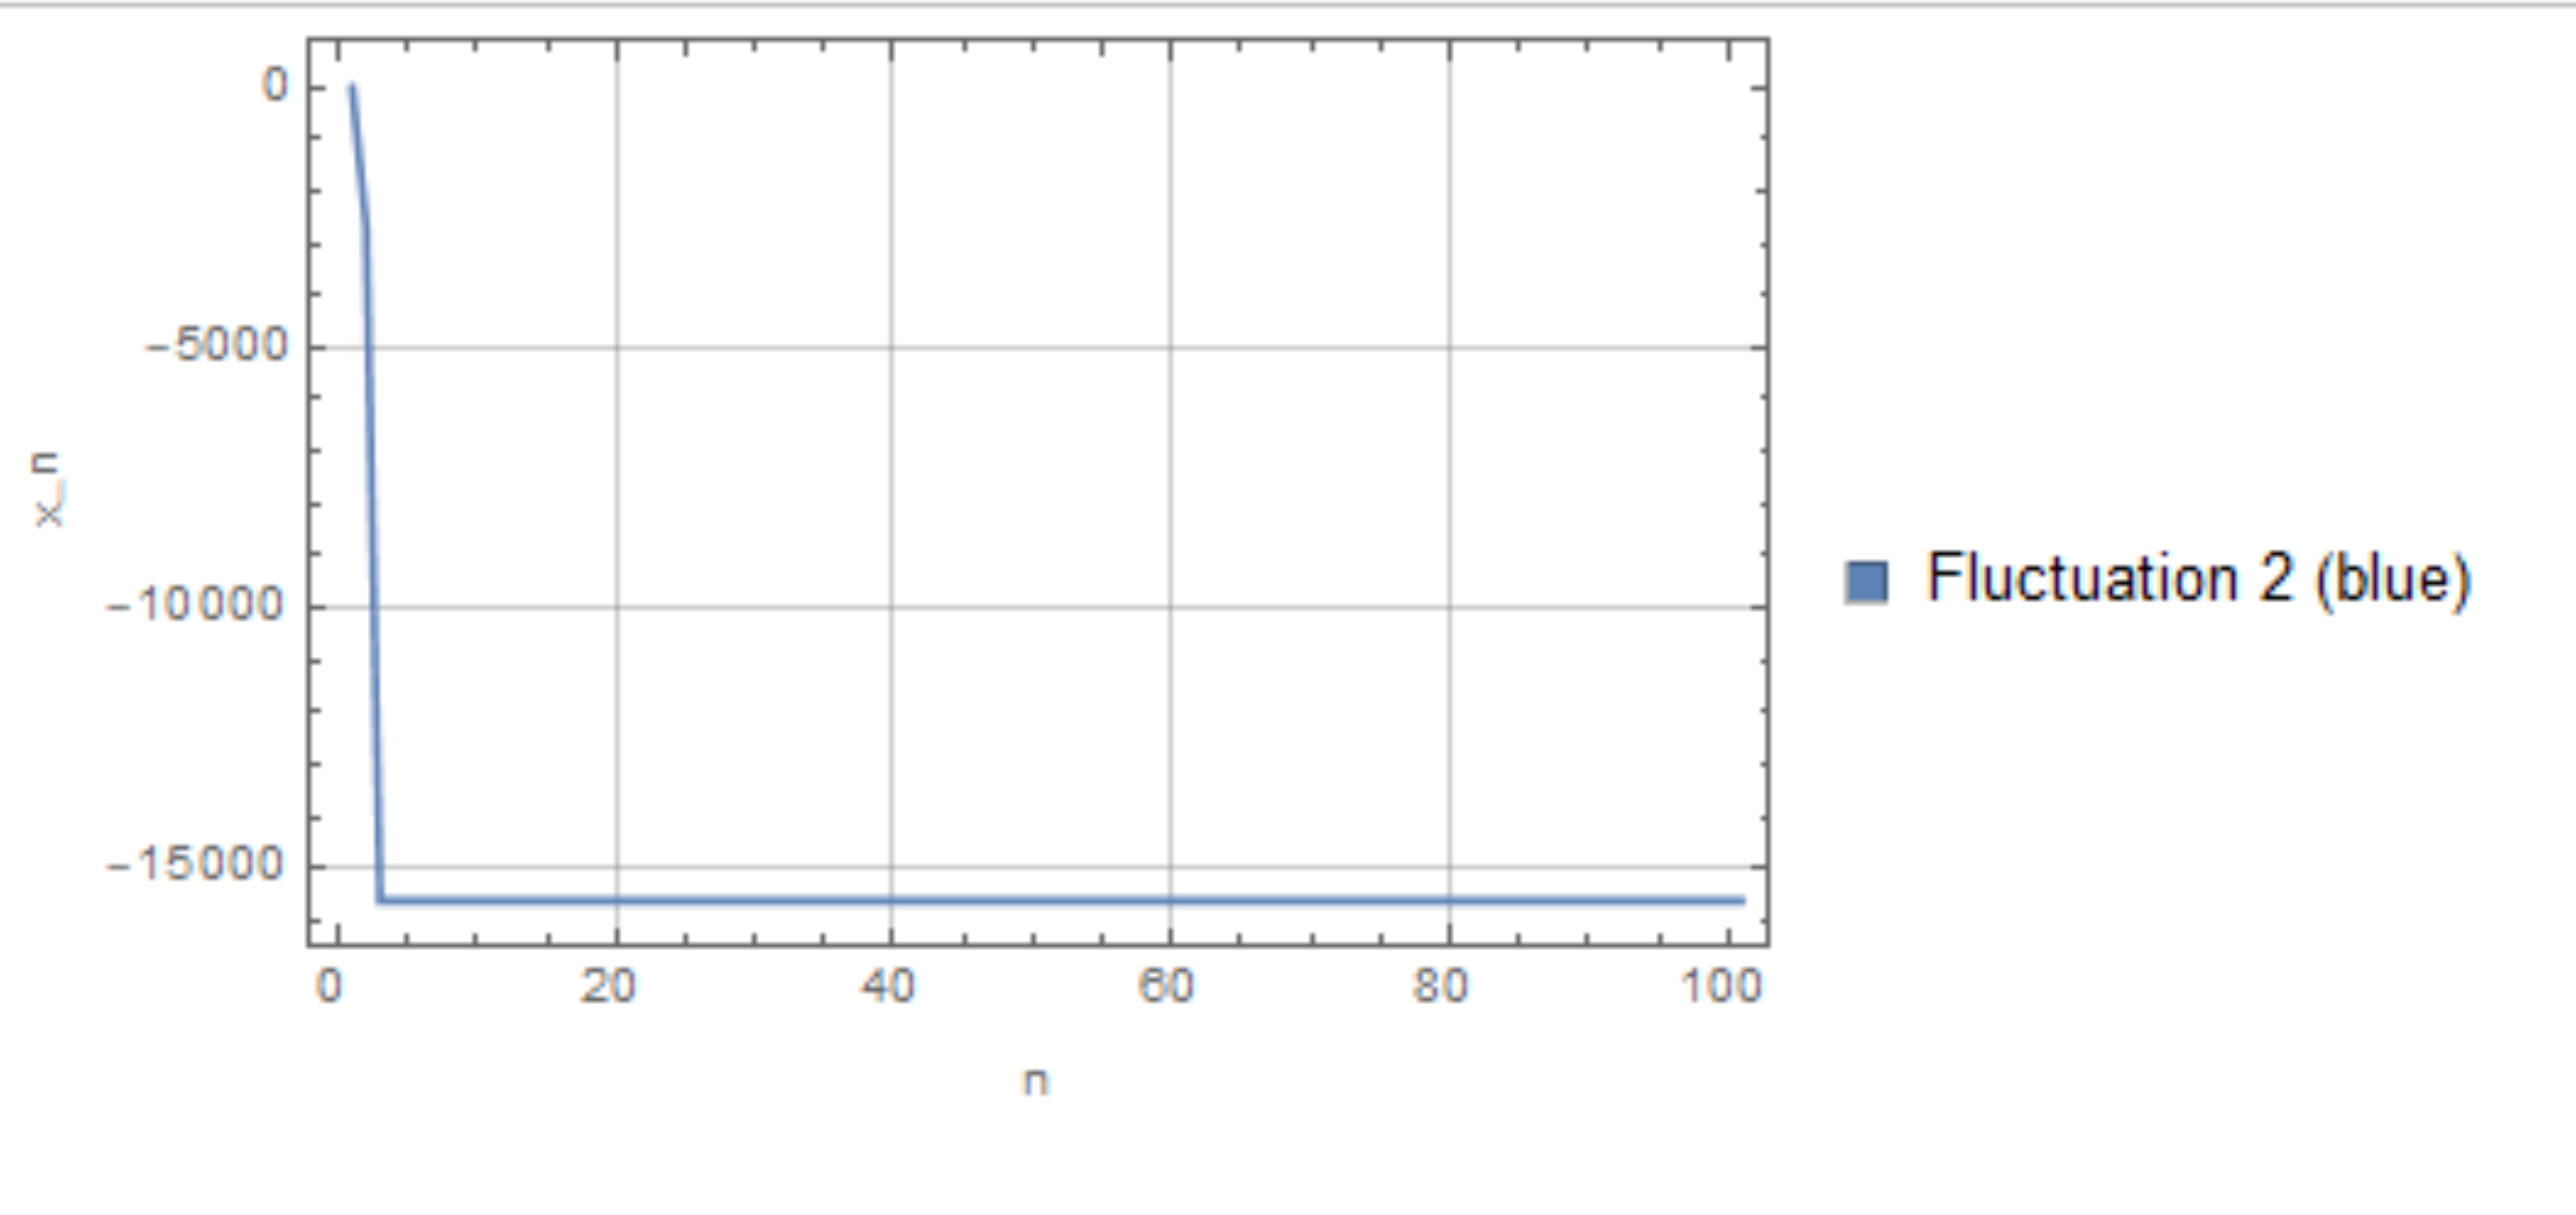
The plot depicted in Figure 3 showcases this sensitivity to values and the consequential absence of the yellow fluctuation within the specified range of values. It illustrates the system’s response and the divergence of values into larger negative magnitudes, indicating a substantial deviation in system behavior. Large negative values of could suggest an extreme response or a departure from expected behavior within the electrical system, potentially signifying a critical state or failure.
5.4 Comprehensive Comparison of System Responses to Variation
Expanding our investigation further, another scenario with fixed values of , , and was explored. This scenario produced a plot depicting the system’s behavior for varying values within the range (Figure 4(b)).
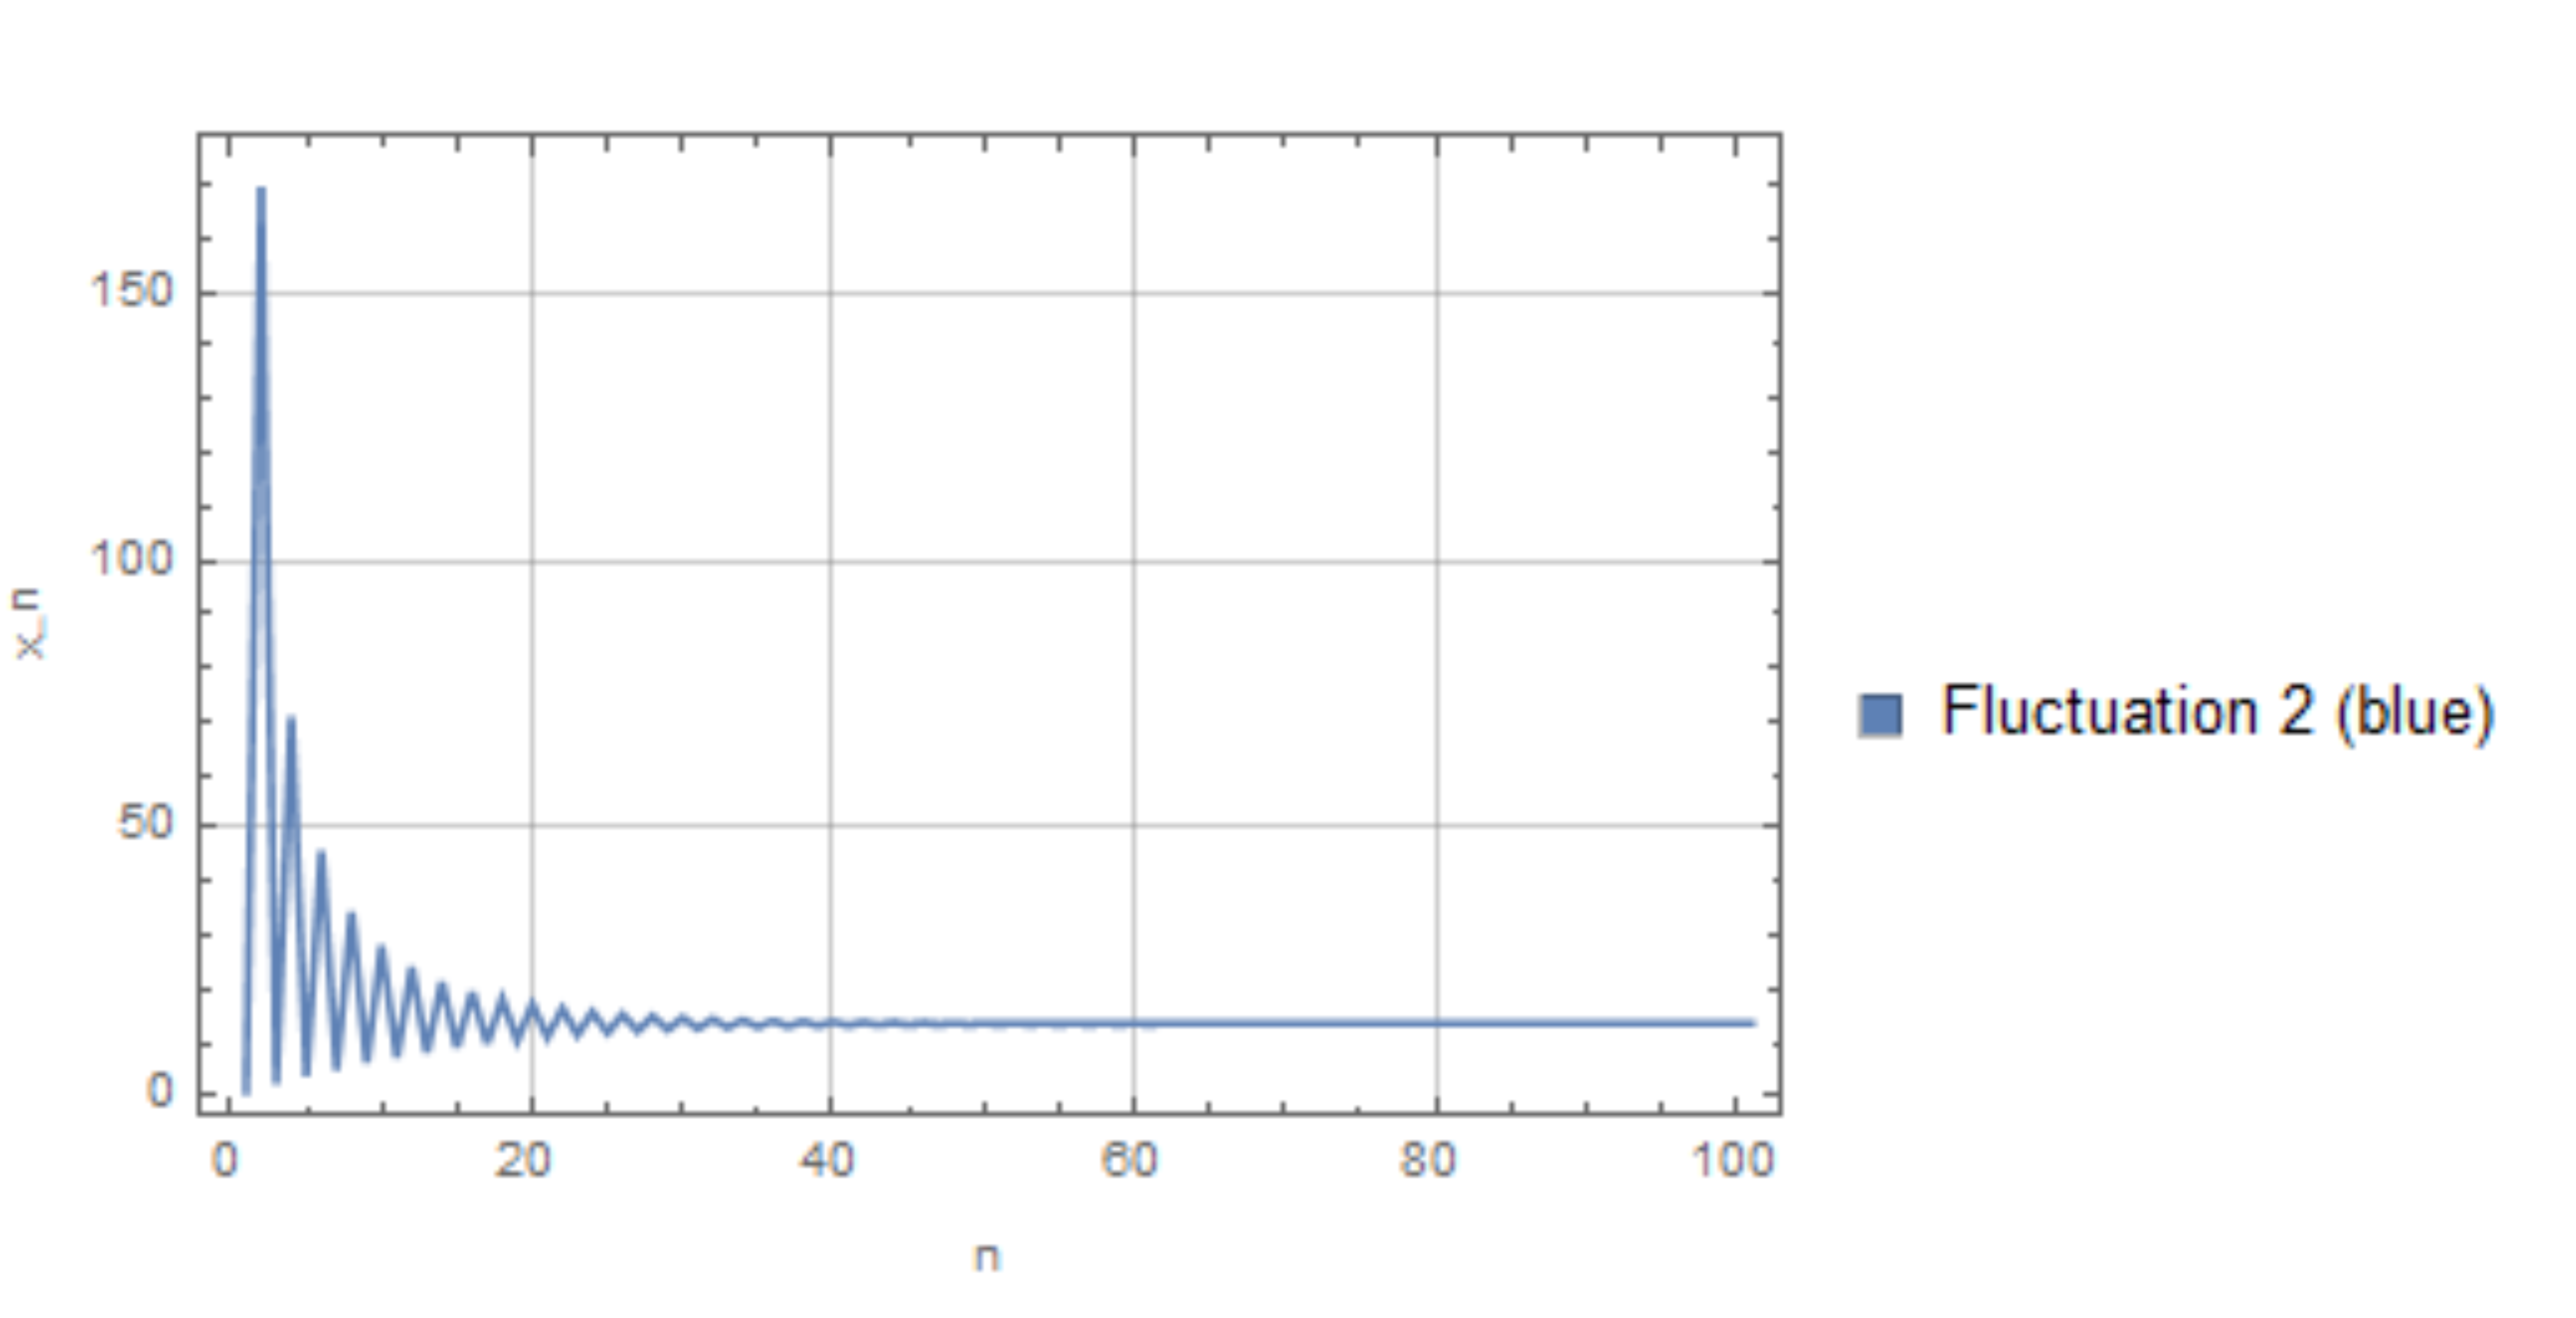
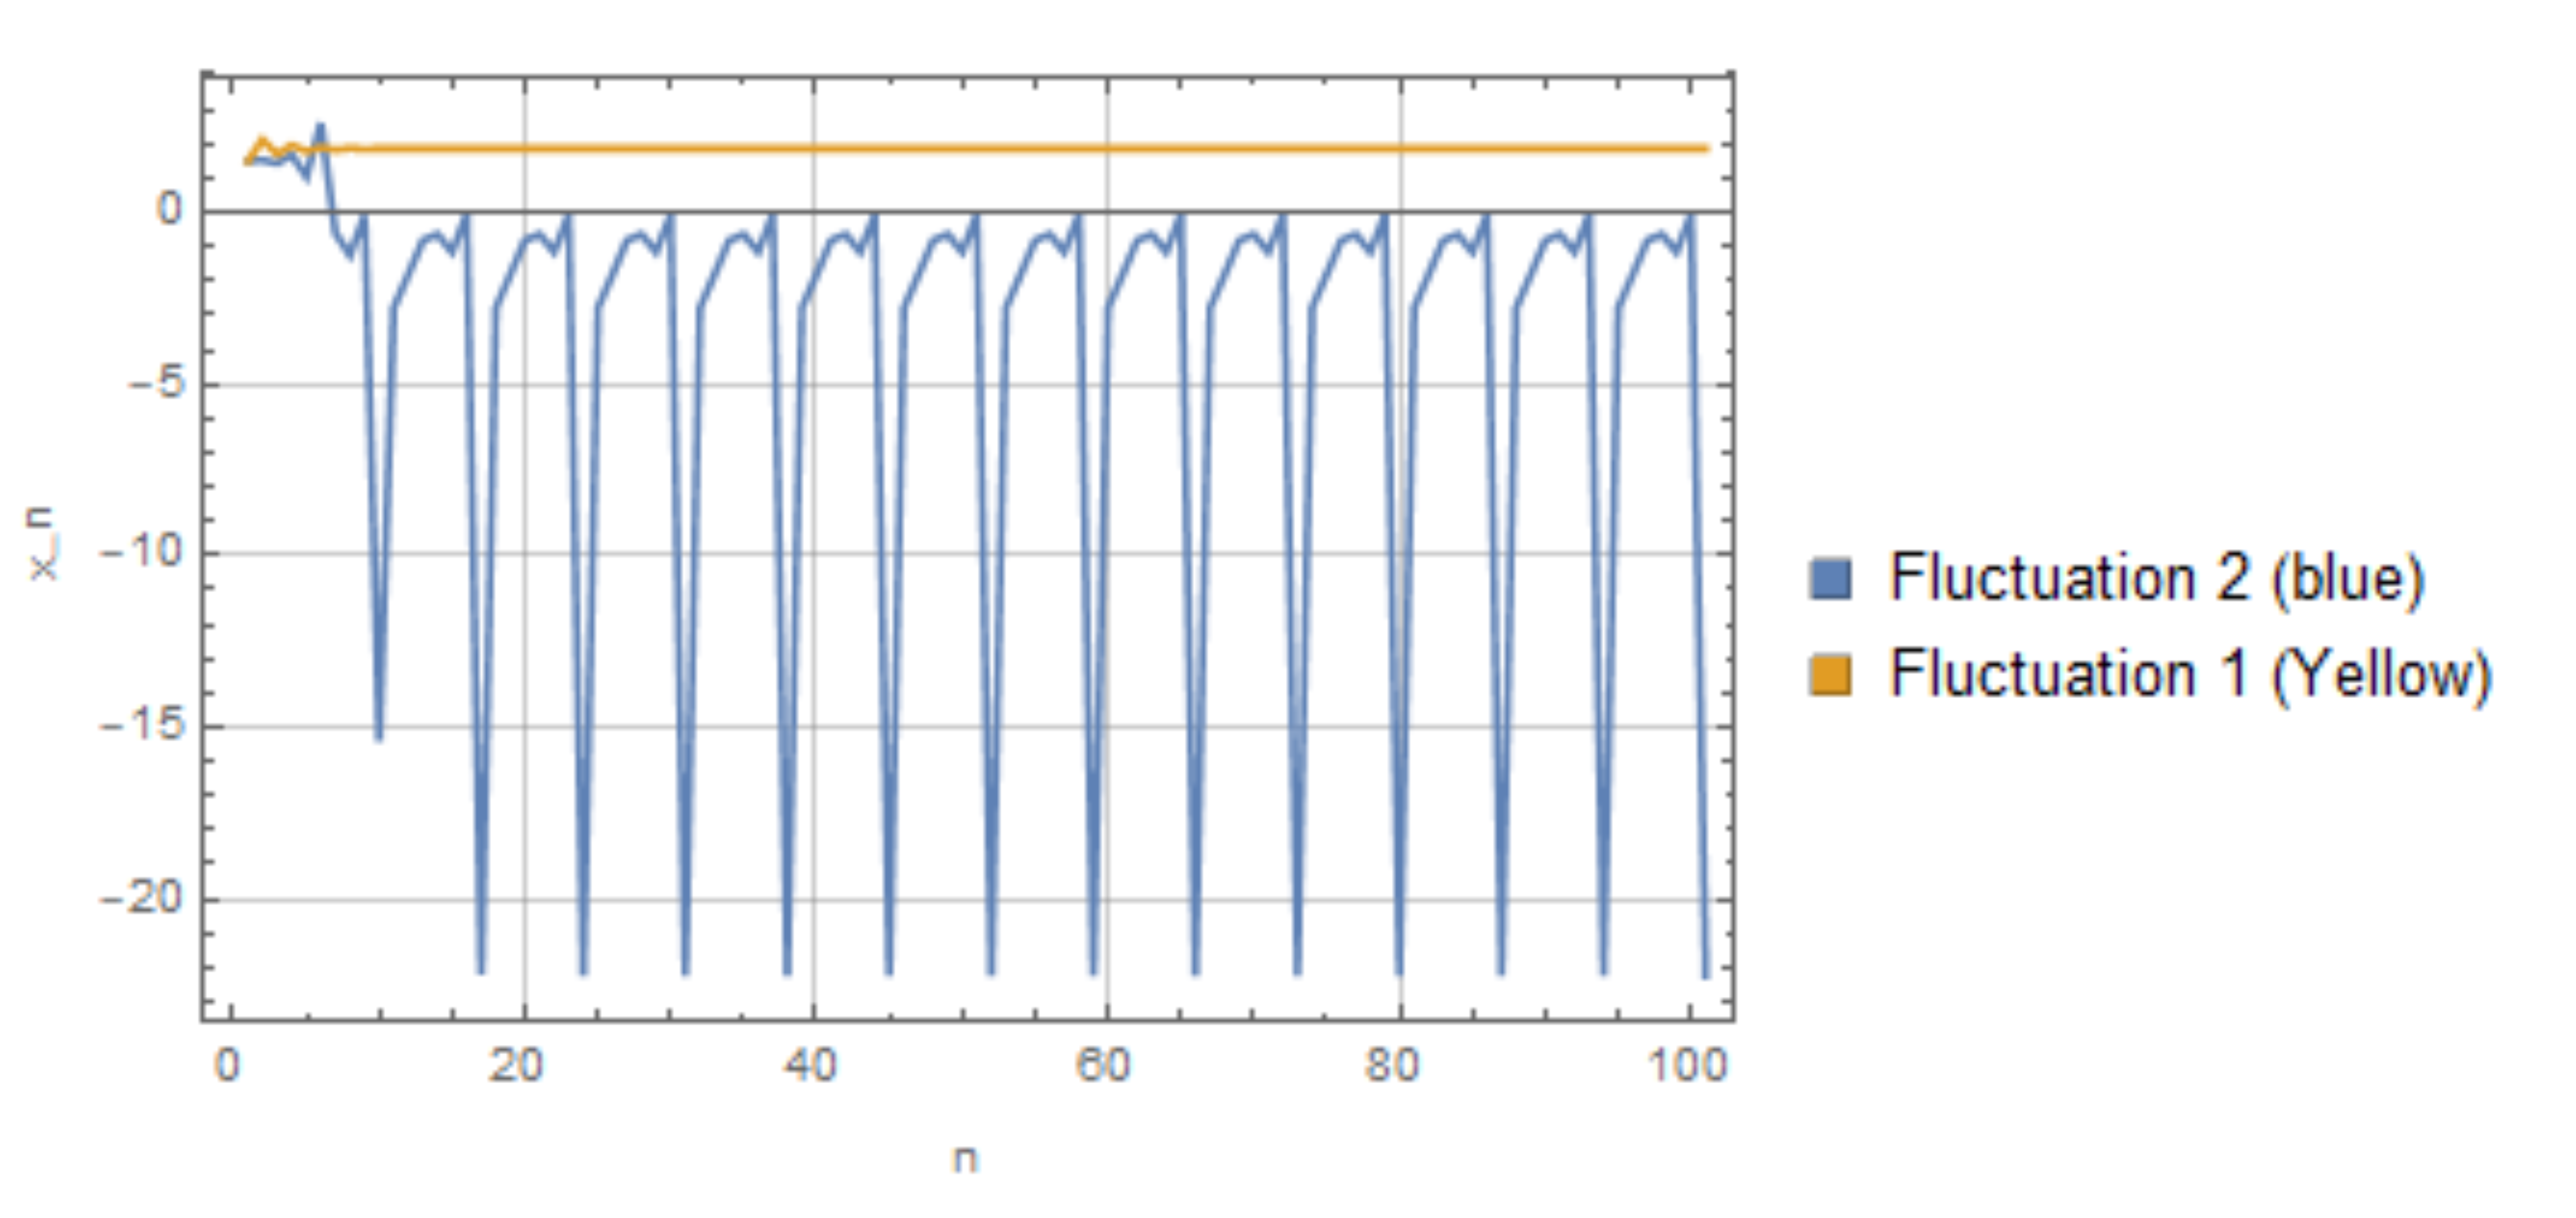
Figure 4 presents a comprehensive comparison of the system’s response for two distinct scenarios (Figures 4(a) and 4(b)), showcasing the unique behaviors and fluctuations observed under varying values and fixed parameter conditions.
Figure 4 presents a comprehensive comparison of the system’s response for two distinct scenarios (Figures 4(a) and 4(b)), showcasing the unique behaviors and fluctuations observed under varying values and fixed parameter conditions.
The combination of these scenarios provides valuable insights into the system’s behavior, highlighting the diverse responses exhibited across different parameter settings.
Expanding our investigation further, two additional scenarios were explored. These scenarios considered fixed values of and while varying within the ranges (Figure 5(a)) and (Figure 5(b)) for .

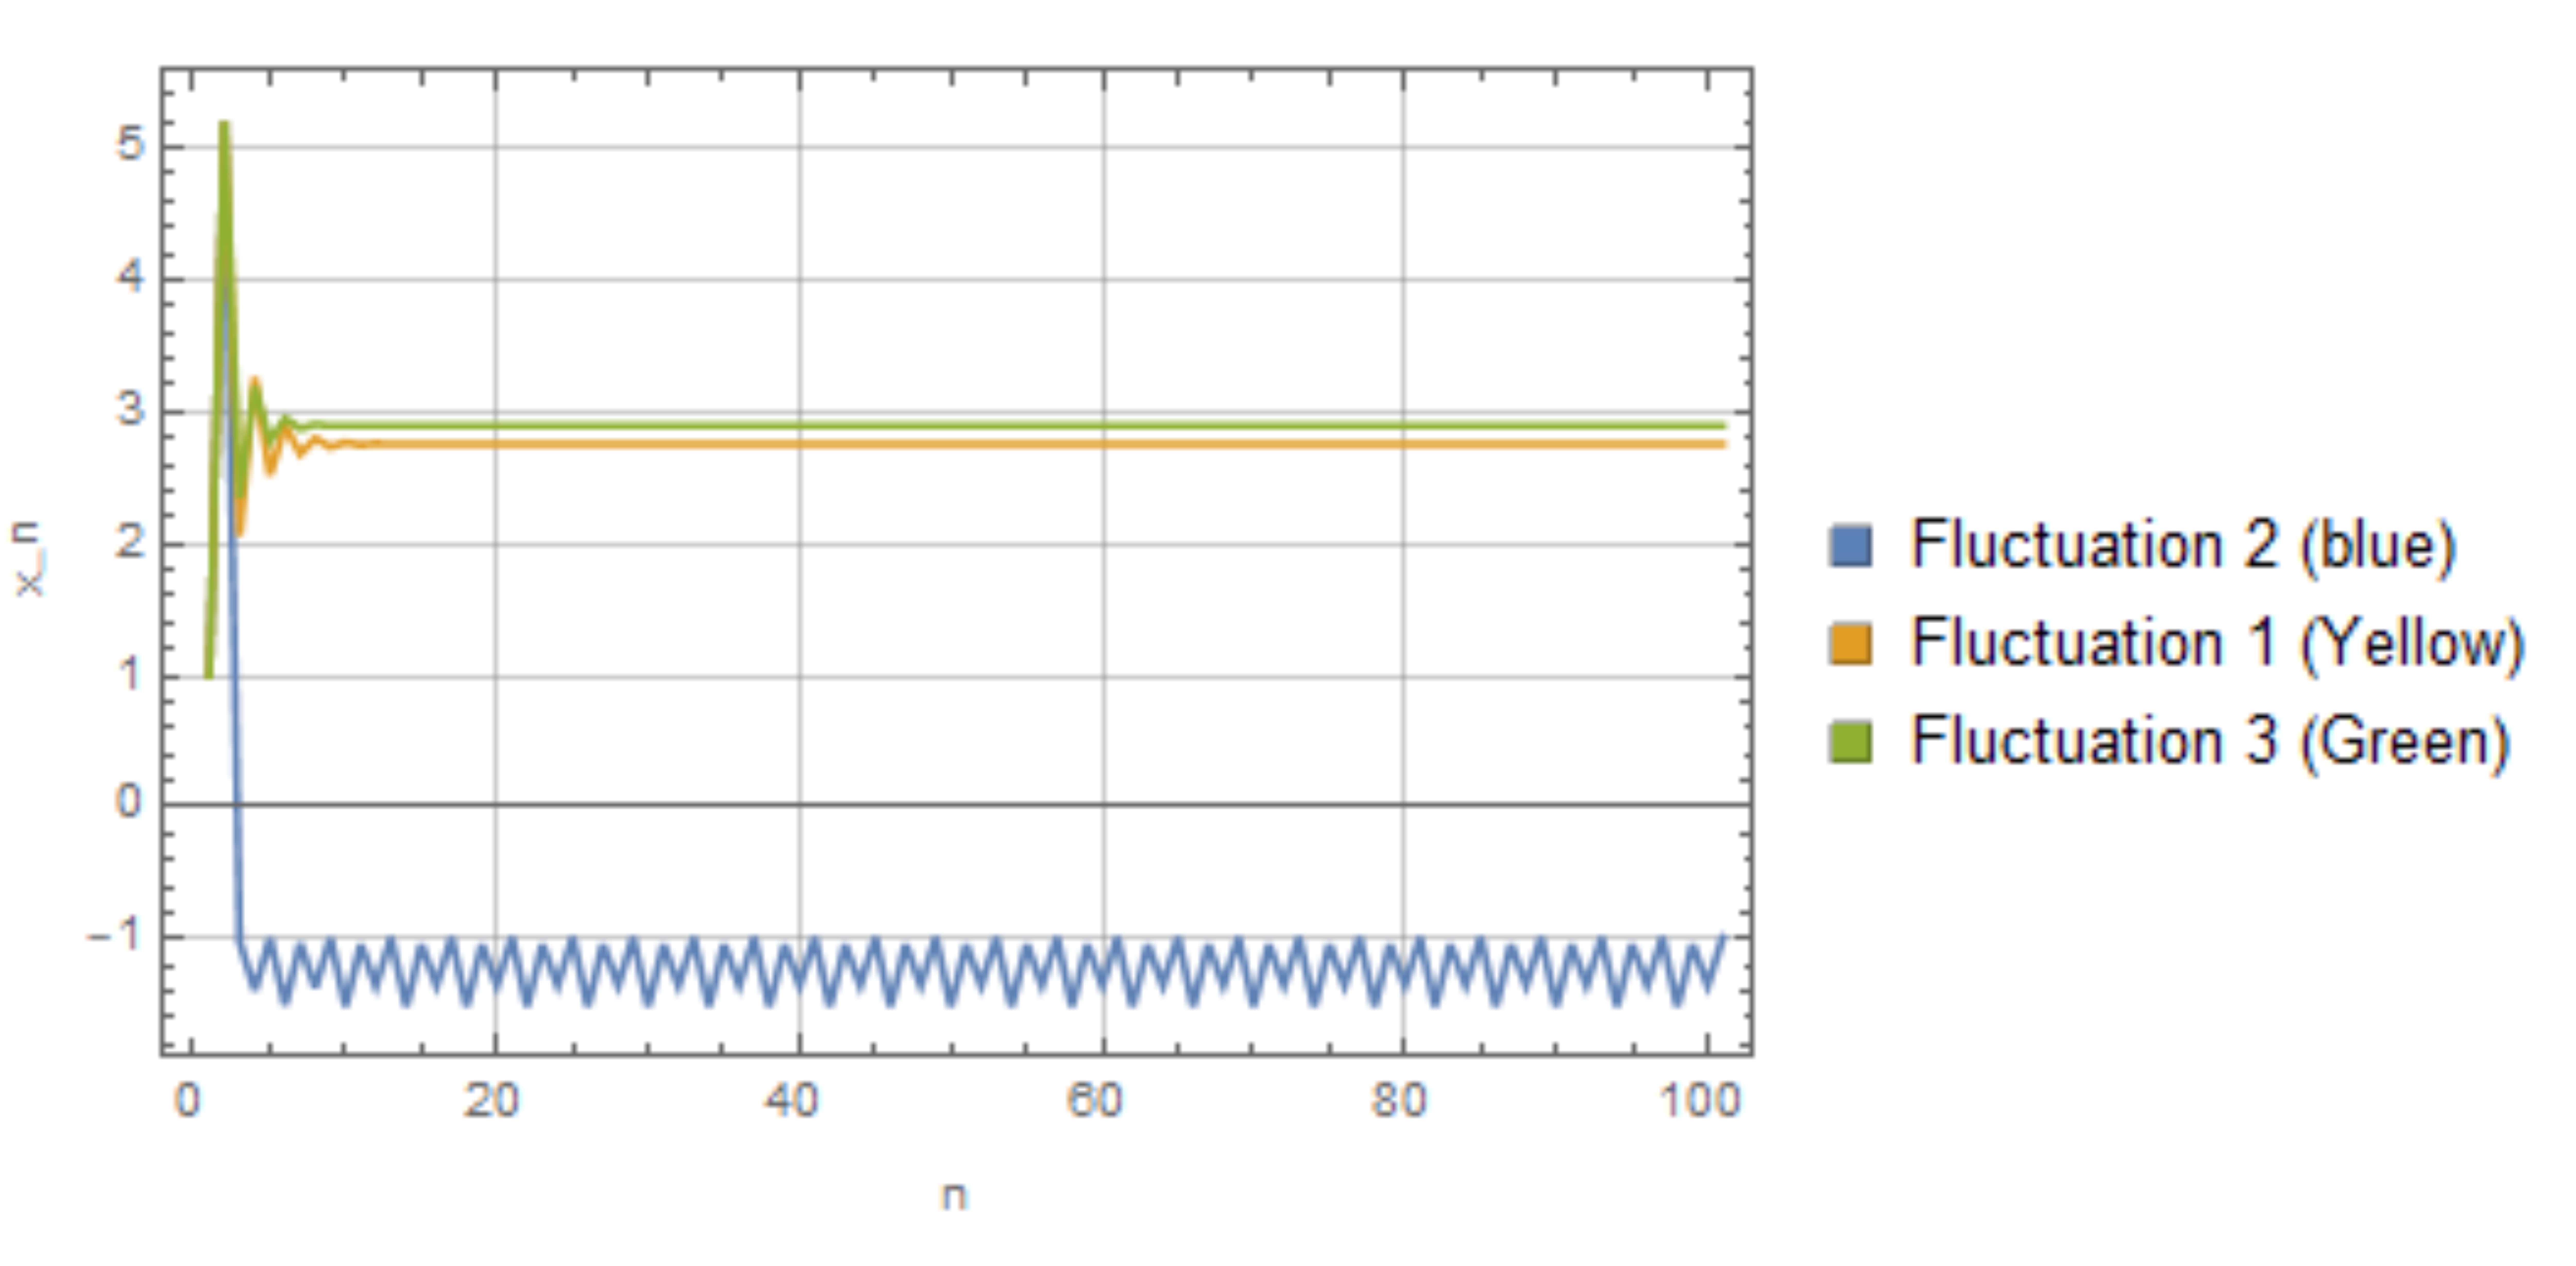
In both Scenarios 3 and 4 (Figures 5(a) and 5(b)), the blue fluctuations display a negative trend, indicating a descent in the system’s output. Additionally, in Scenario 4, as increases to 0.8 from 0.5 in Scenario 3, the amplitude of the blue fluctuation decreases significantly, approaching a vanishing point.
This observed decrease in the amplitude of the negative blue fluctuation with increasing may suggest a damping effect in the system, indicating a decline in oscillatory behavior or a stabilizing influence of higher inductance () values.
The comprehensive comparison in Figure 5 provides insights into the system’s response under different values and their interplay with varying values, emphasizing distinct behaviors and fluctuations across scenarios.
Chaotic Behavior, Negative Trends, and Interpretation
In the following section, we delve into the potential chaotic behavior and bifurcation analysis of our new electrical system. Notably, our exploration reveals significant insights, showcasing transitions to chaos for specific parameter values within the system. This investigation sheds light on the emergence of chaotic dynamics, complemented by negative trends observed in the system’s behavior, culminating in a deeper interpretation of its intricate dynamics.
Identifying Transitions to Chaos
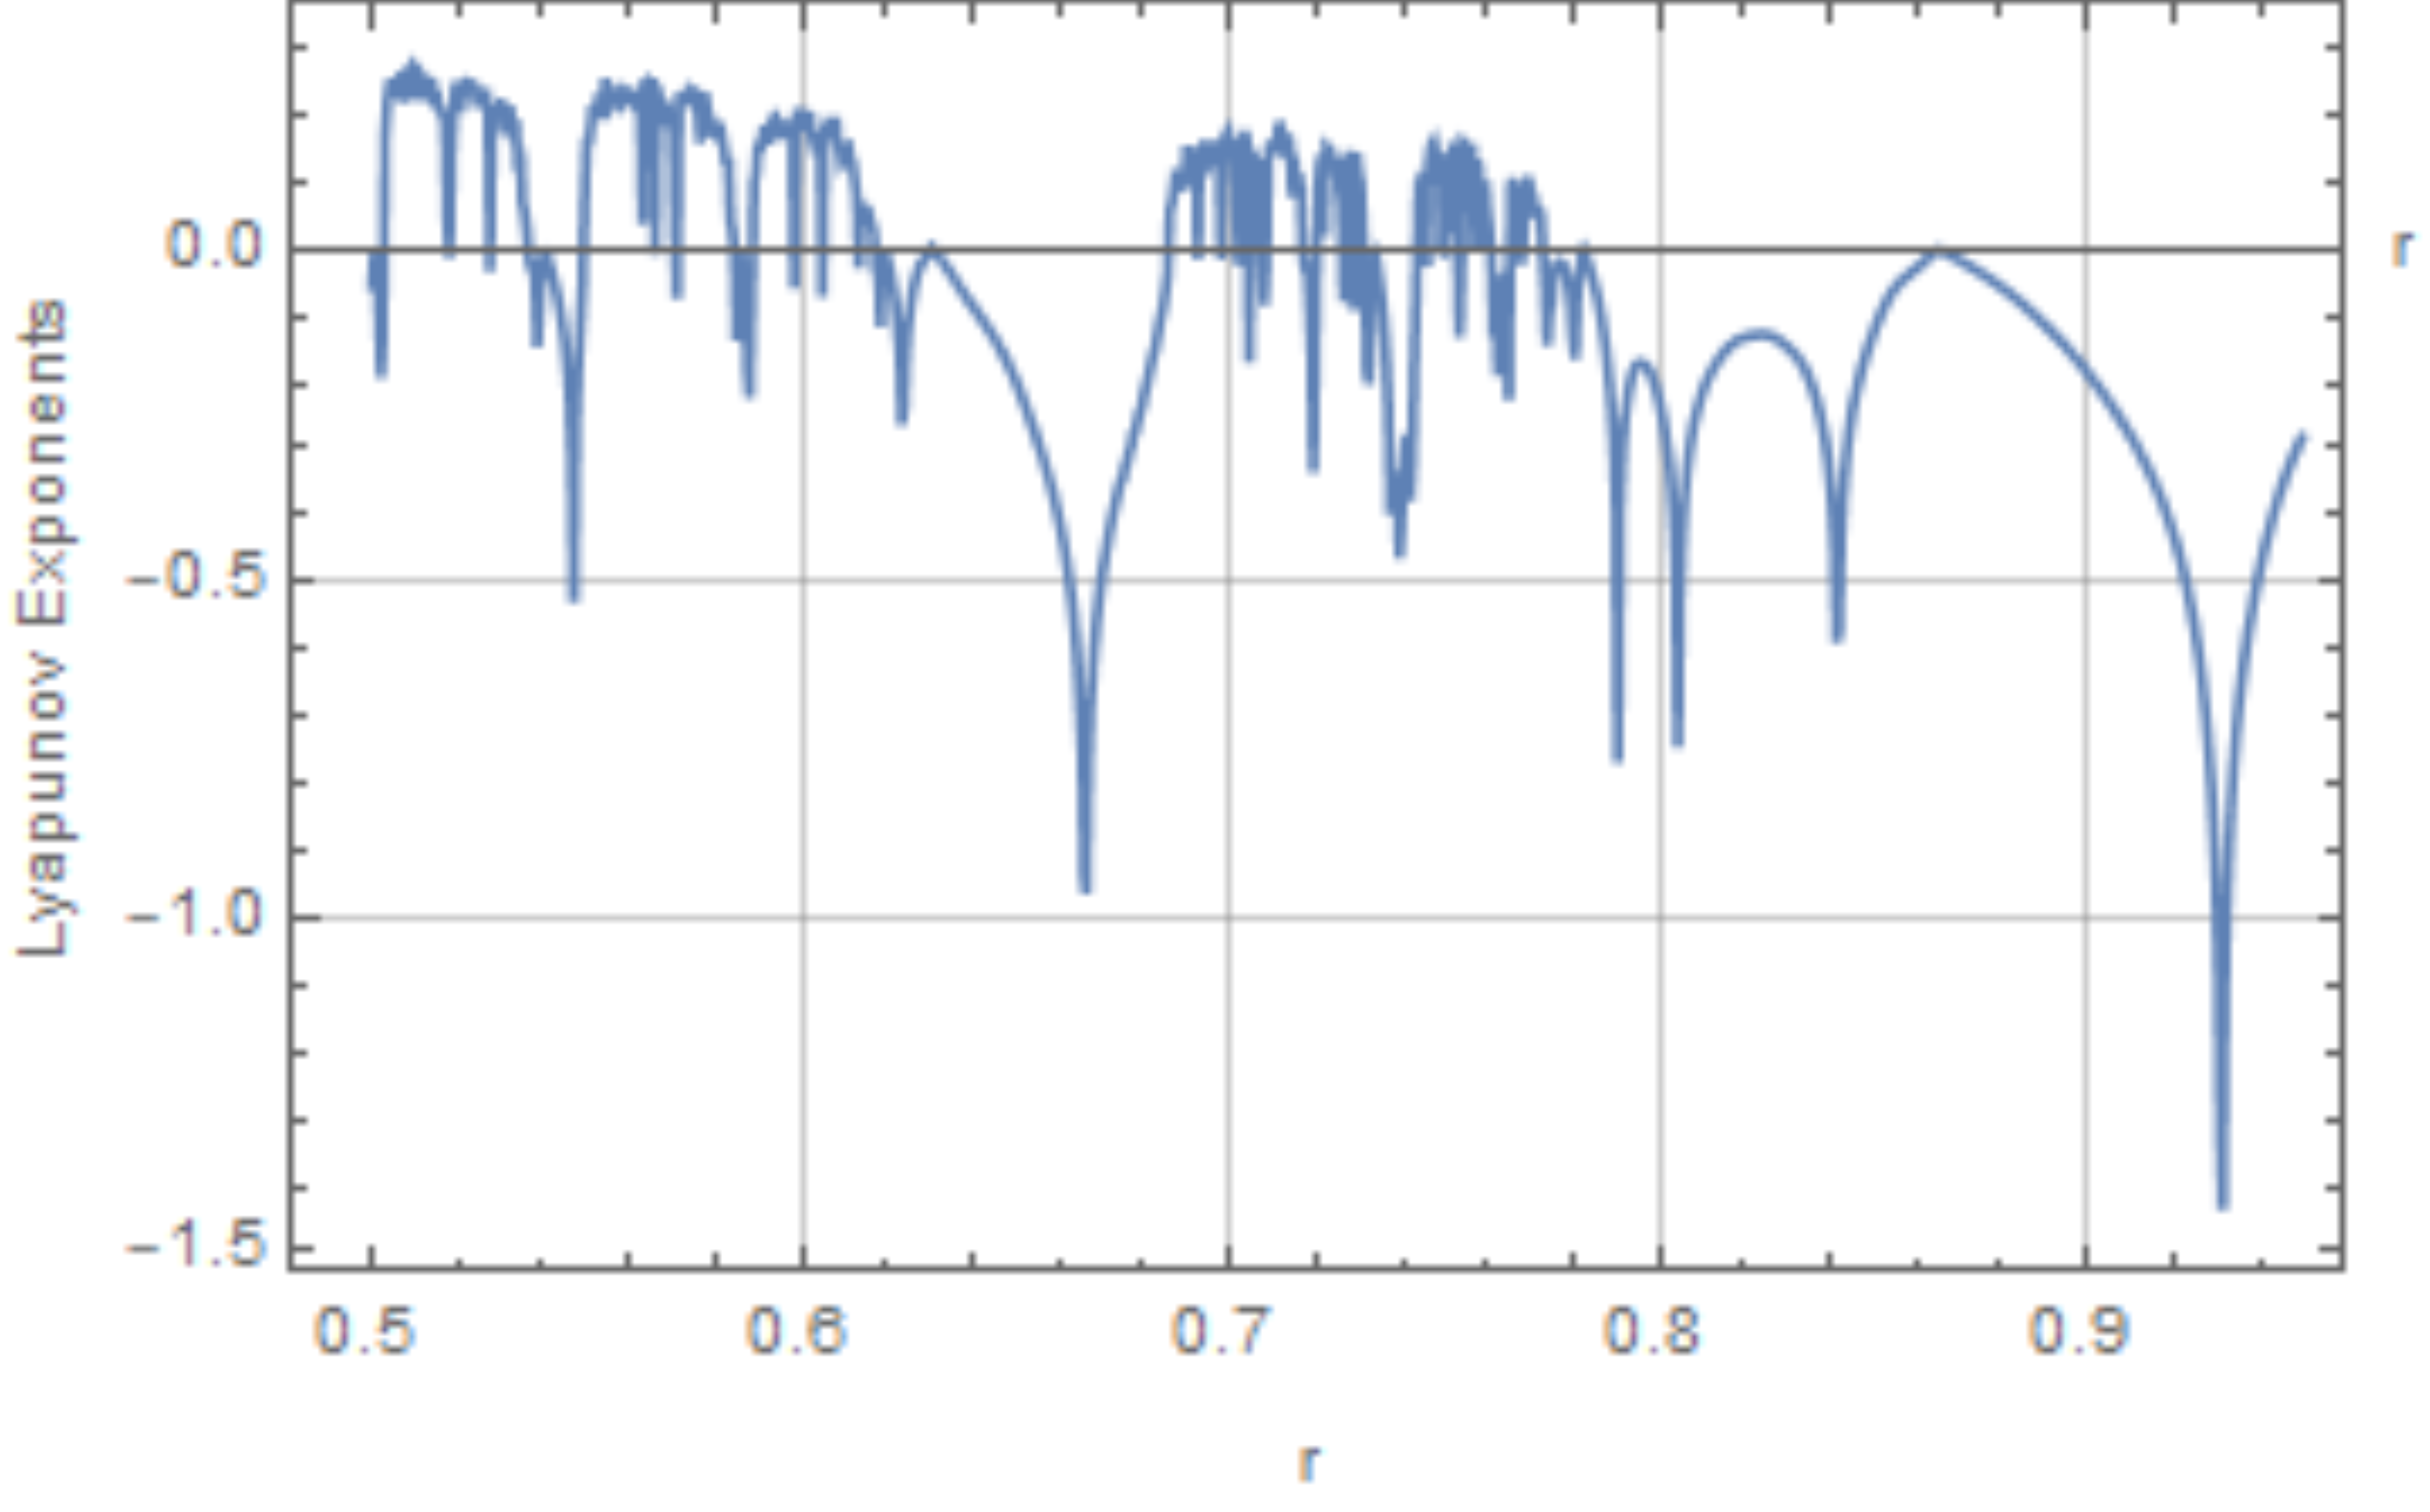
Our analysis has unveiled intriguing transitions to chaotic behavior within certain parameter ranges of the electrical system. Specifically, we’ve identified distinct intervals—, , and —where the system exhibits pronounced chaotic dynamics. This identification of chaos is substantiated by the observation of positive Lyapunov exponents, signifying sensitivity to initial conditions and confirming the system’s transition to chaotic behavior.
Bifurcation Analysis and Negative Trends
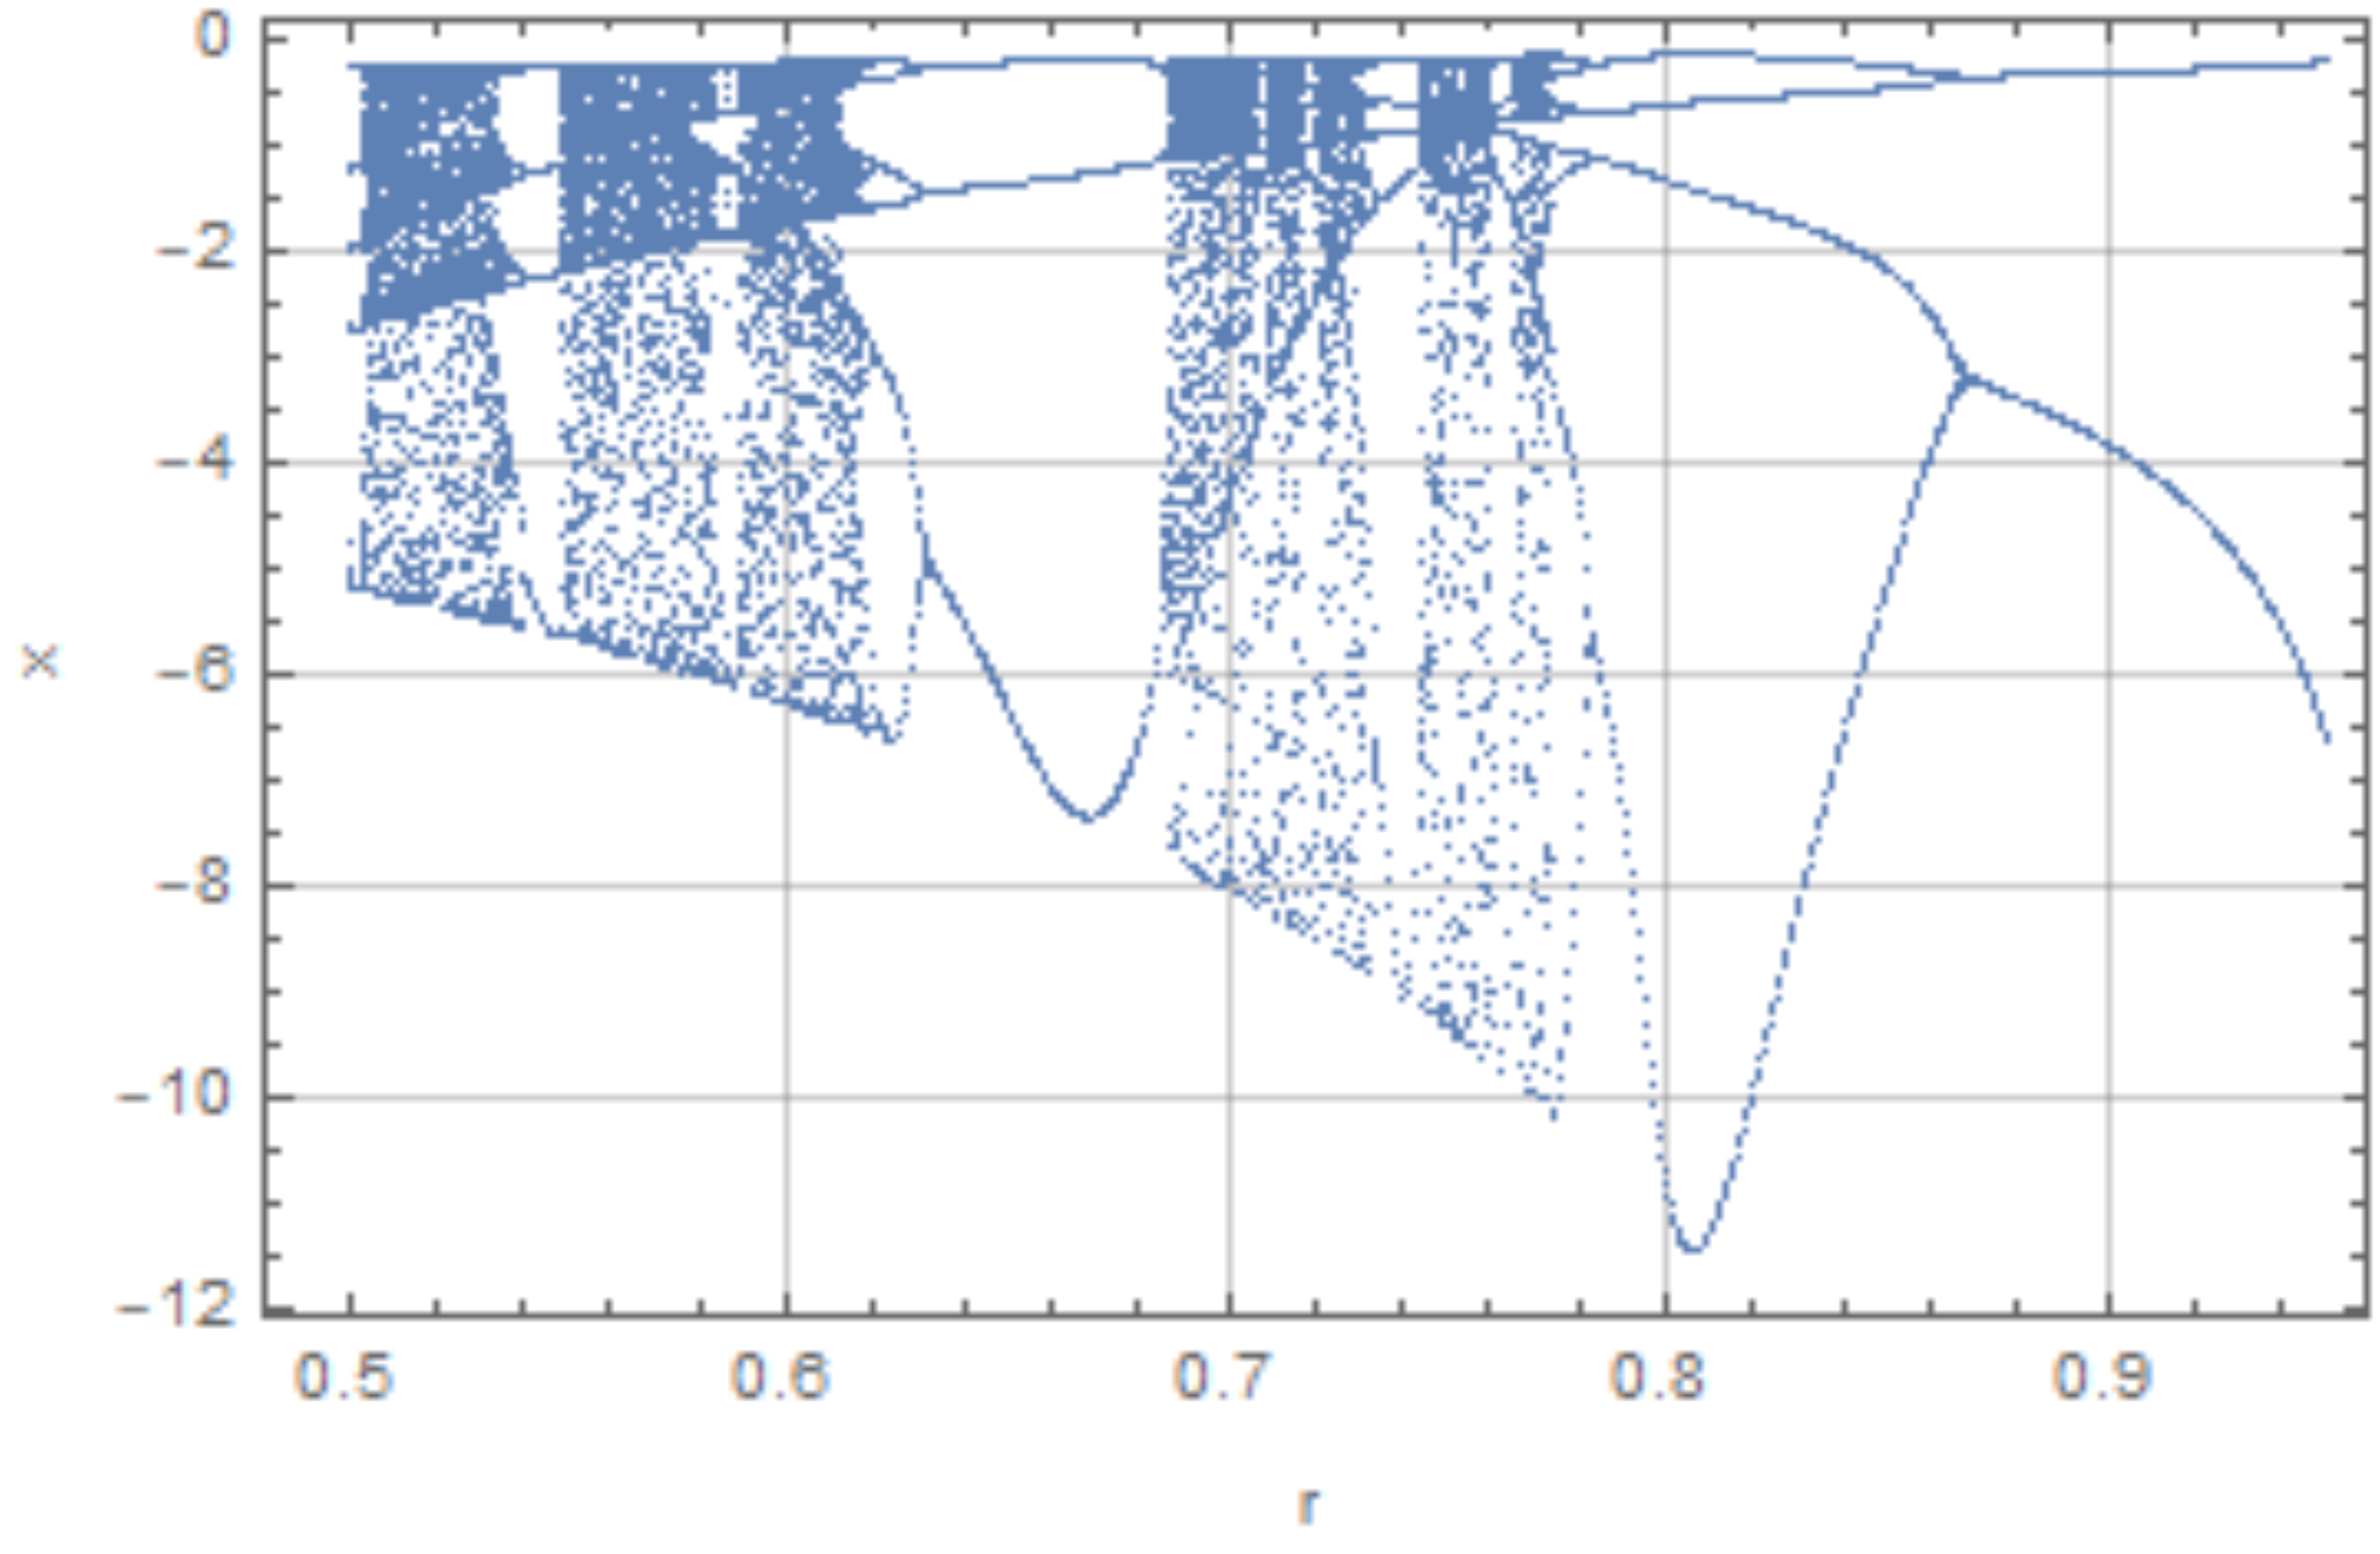
Moreover, our bifurcation analysis has prominently highlighted negative trends in the system’s behavior. The majority of observed system behaviors manifest predominantly in the negative region of the axis, indicating a clear trend towards negative outputs across explored values. These negative curves hint at divergence towards negative magnitudes, suggesting decay, instability, or non-convergence within the system.[5, 11]
Interpreting Chaos and Trends
The convergence of positive Lyapunov exponents in the identified intervals, coupled with negative trends in the system’s behavior, provides substantial evidence supporting the presence of chaotic dynamics. Understanding these intricate dynamics offers a pathway to deciphering the complexities within the electrical system, paving the way for potential control and application in diverse contexts.
Bifurcation Plot with Parameters
The bifurcation plot (Figure 6) illustrates the behavior of the electrical system with varying values () and fixed parameters , , and . Notably, the observed behavior primarily concentrates in the negative region of the plotted values of , suggesting potential instability or divergence within the system.
6 Methodologies
In this section, we elucidate the methodologies employed to assess the chaos and dynamical properties in the Yitang dynamics.
6.1 Lyapunov Exponent Calculation
The Lyapunov exponents were numerically calculated employing the computational capabilities of Mathematica software. This computational tool facilitated the accurate assessment of the system’s sensitivity to initial conditions and provided insights into its chaotic behavior.[12]
The Lyapunov exponents were computed to quantify the system’s sensitivity to initial conditions. We utilized the following method [13] to estimate these exponents for the Yitang dynamics system (Equation 1):
-
•
Initialization: The initial conditions , , and were set within a close vicinity, enabling the computation of the divergence of nearby trajectories.
-
•
Numerical Integration: We employed a numerical integration method such as the Runge-Kutta method or Adams method to solve the differential equations associated with the Yitang dynamics.
-
•
Trajectory Divergence: At each iteration step, the distance between two close trajectories was computed, and the logarithm of this divergence was accumulated.
-
•
Lyapunov Exponent Calculation: The Lyapunov exponent was then estimated as the average of the logarithmic divergence over time normalized by the iteration count and time step.
The computed Lyapunov exponents provided insights into the system’s chaotic behavior, with non-zero values indicating chaotic dynamics.
7 Computation of Lyapunov Exponents and Entropy
The Lyapunov exponents () are calculated to measure the sensitivity to initial conditions in dynamical systems. The following algorithm outlines the procedure used for computing the Lyapunov exponents:
Lyapunov Exponents Plot with Parameters
The Lyapunov exponents plot (Figure 7) further strengthens our understanding by confirming transitions to chaos. Positive Lyapunov exponents within specific intervals of values validate the system’s sensitivity to initial conditions and the emergence of chaotic behavior.
Implications and Conclusion
The culmination of bifurcation analysis, observation of negative trends, and confirmation through Lyapunov exponents plots fortifies our understanding of chaotic dynamics within the electrical system. This newfound understanding not only validates the presence of chaos but also holds promise for controlling and leveraging complex behaviors for various practical applications.
8 Prediction of Limit Cycles and Fixed Points
The phase portraits generated for the system dynamics exhibit valuable insights into the behavior of the electrical system under varying parameters. Through the trajectories plotted for different values over 120 iterations, distinctive patterns emerge, offering predictive cues regarding limit cycles and fixed points.
8.1 Observations from Phase Portraits
Periodicity in Trajectories
The observed periodicity in trajectories across different values denotes the presence of limit cycles within the system. Trajectories that recur in distinct patterns illustrate the existence of cyclic behavior [14], indicating states that the system revisits over specific intervals. These periodic regions signify stable, recurring states or limit cycles in the system’s dynamics.
Concentration in Negative Trend Region
A notable concentration of trajectories in the negative trend region suggests the presence of fixed points within this domain. Fixed points typically denote states where the system stabilizes, remaining relatively unchanged over iterations. The accumulation of trajectories in this region signifies stable states or attractors toward which the system converges. Particularly, the selected fixed point value of approximately corresponds to an attracting fixed point of , indicating a stable state around this parameter.
Potential for Chaotic Regions
While the phase portraits over 120 iterations predominantly highlight periodic and stable behavior, indications suggest the potential existence of chaotic regions. Extending the iterations to 150 or more may reveal irregular, seemingly random trajectories indicating chaotic behavior. These regions could signify complex, non-repeating behavior within the system, indicating sensitivity to initial conditions and the presence of chaotic attractors.
8.2 Predictive Insights
Based on the observed patterns in the phase portraits, predictions regarding limit cycles and fixed points become apparent. The periodicity in trajectories hints at the existence of stable limit cycles, while the concentration of trajectories in the negative trend region suggests the presence of fixed points. Further exploration with increased iterations may unveil chaotic regions, contributing to a comprehensive understanding of the system’s dynamics.
8.3 Attracting Fixed Points and Phase Portrait
The system’s attracting fixed points [15] are listed in Table LABEL:tab:fixed_points. These values represent stable equilibrium points for various values.
| Initial Guess | Solution (x) | Derivative |
|---|---|---|
| 0.5 | 1.44081 | 1 |
| 0.525 | 1.45602 | 1 |
| 0.55 | 1.47061 | 1 |
| 0.575 | 1.48459 | 1 |
| 0.6 | 1.49796 | 1 |
| 0.625 | 1.51074 | 1 |
| 0.65 | 1.52295 | 1 |
| 0.675 | 1.53461 | 1 |
| 0.7 | 1.54574 | 1 |
| 0.725 | 1.55635 | 1 |
| 0.75 | 1.56646 | 1 |
| 0.775 | 1.5761 | 1 |
| 0.8 | 1.58529 | 1 |
| 0.825 | 1.59404 | 1 |
| 0.85 | 1.60237 | 1 |
| 0.875 | 1.61031 | 1 |
| 0.9 | 1.61788 | 1 |
| 0.925 | 1.62508 | 1 |
| 0.95 | 1.63195 | 1 |
The phase portrait plot (Figure 8) reflects the behavior of the system concerning these attracting fixed points. Trajectories in the phase plane converge towards these stable states as varies.
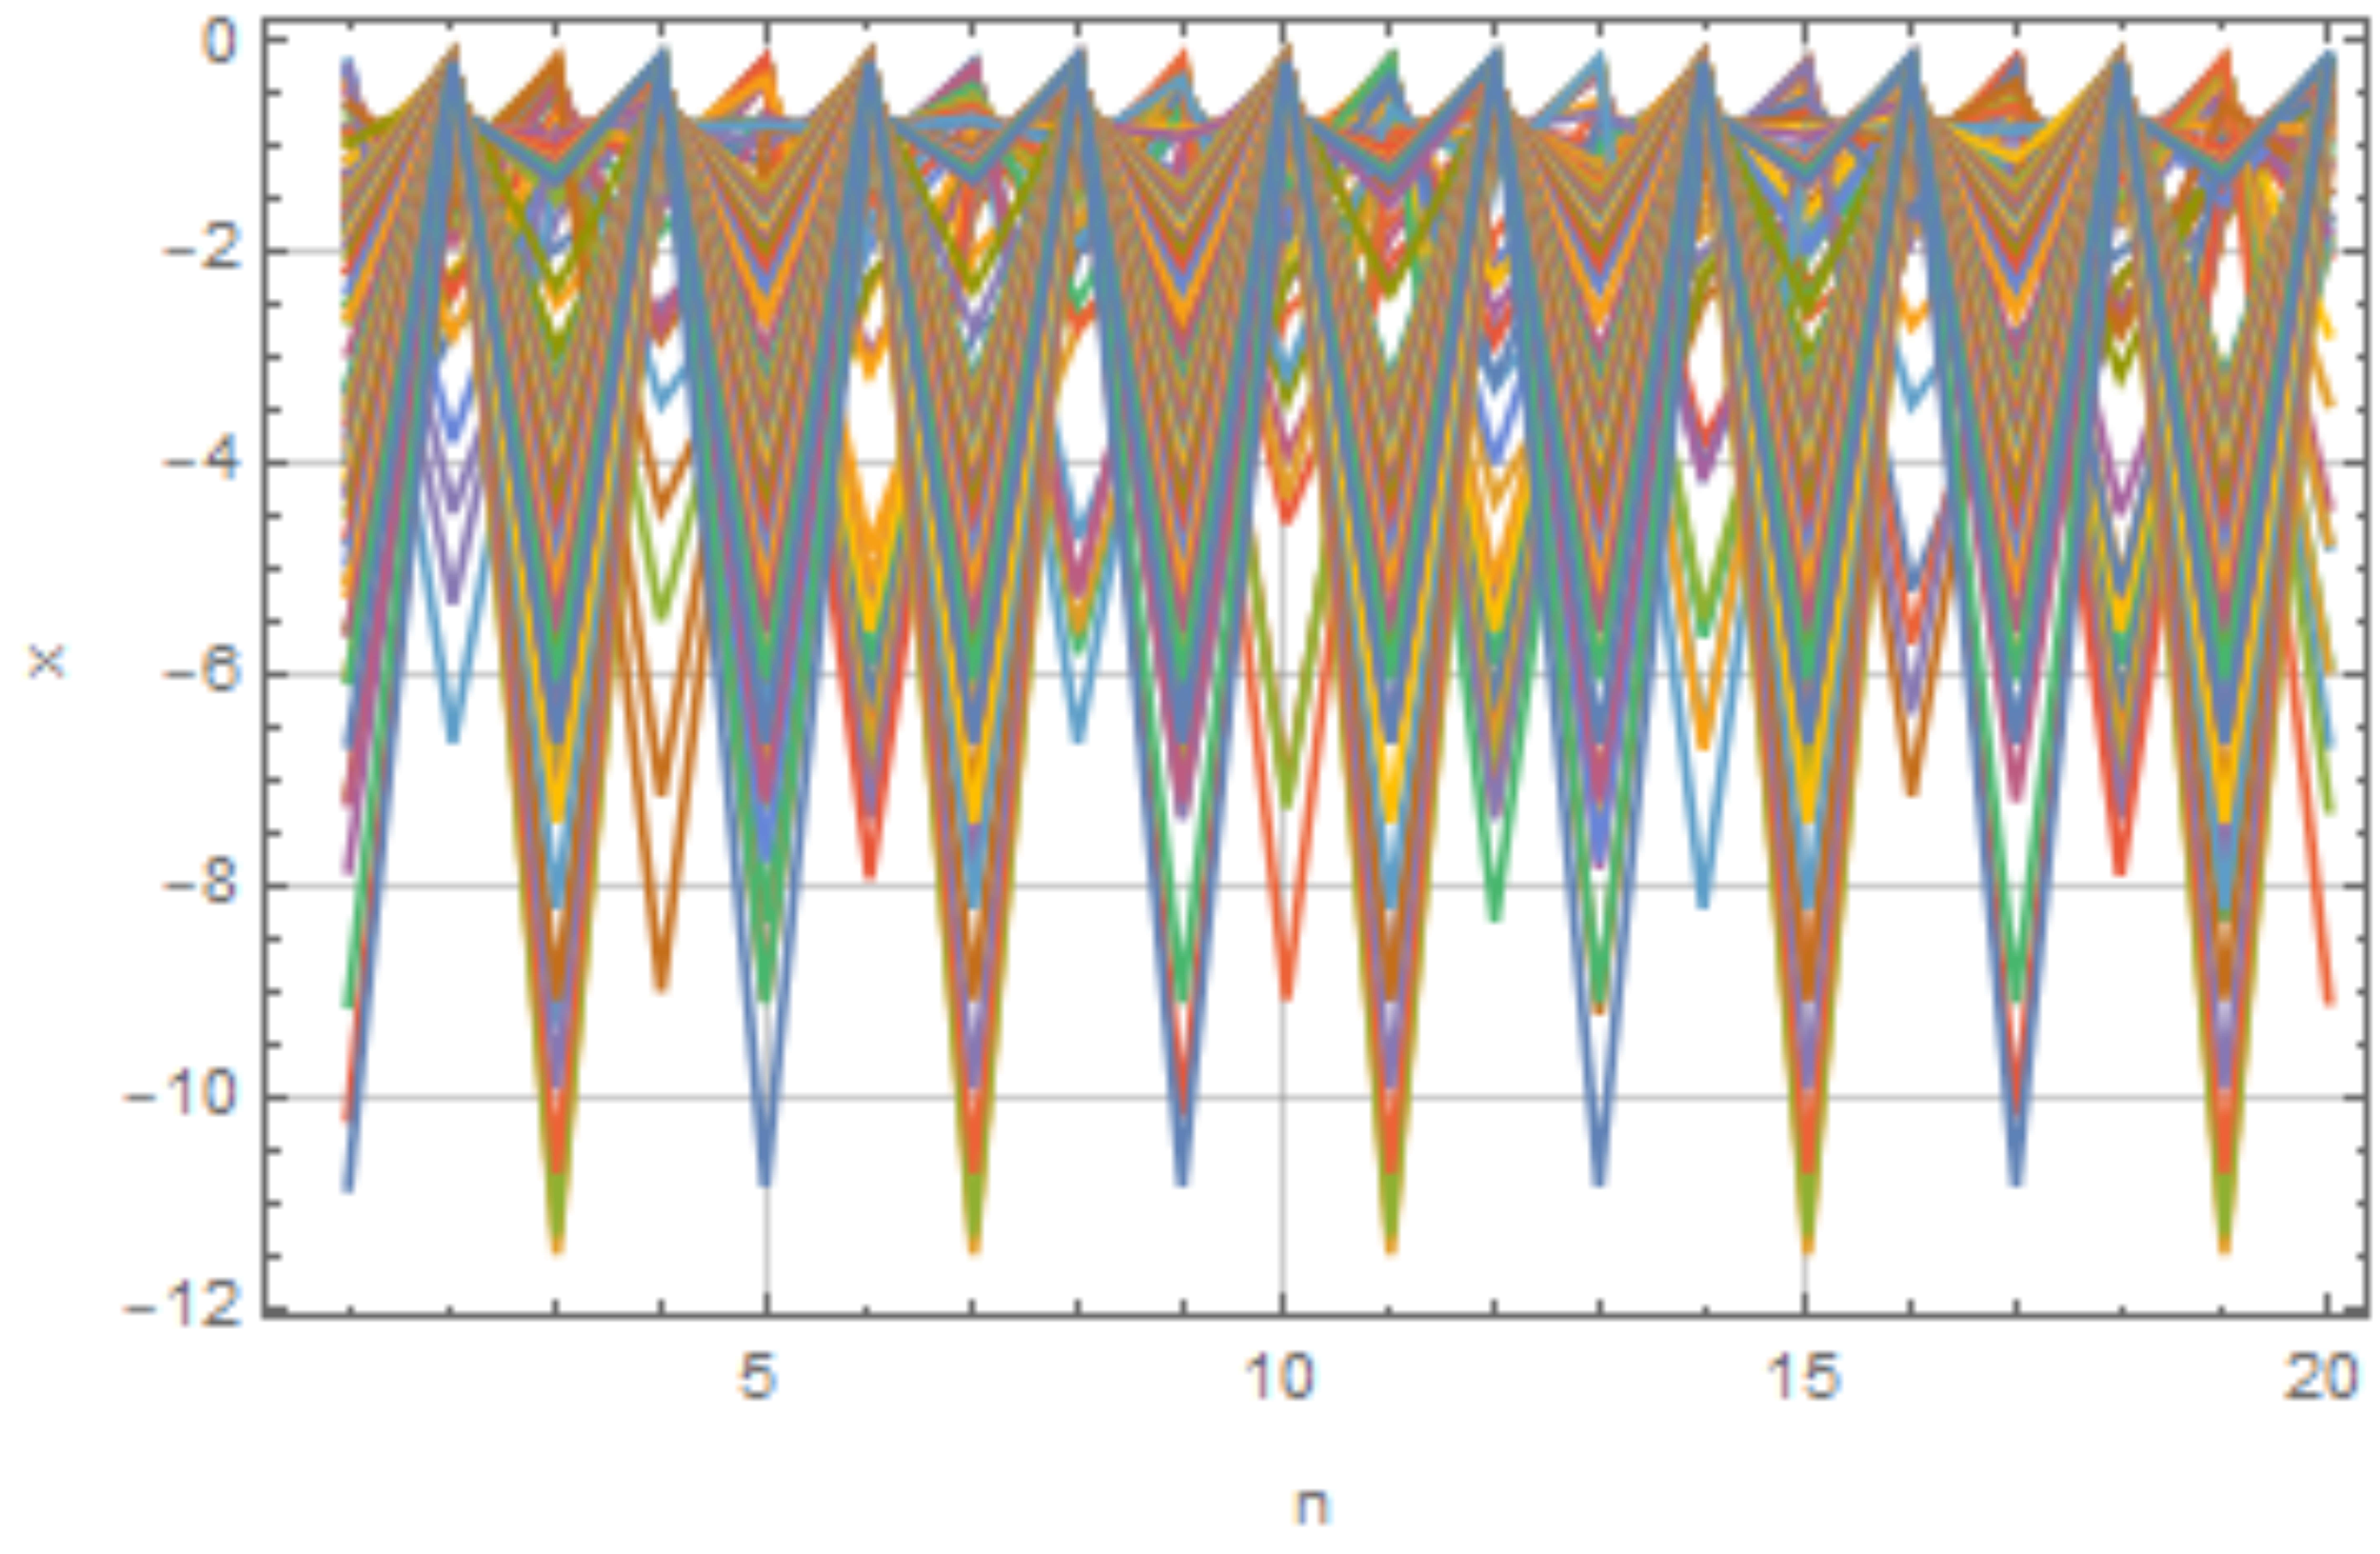
The trajectories in the phase portrait demonstrate the system’s behavior, indicating convergence towards the stable fixed points as changes, affirming the attracting nature of these points.
9 Frequency Spectrum Analysis
The Frequency Spectrum Analysis provides critical insights into the system’s behavior in the frequency domain. In this analysis, the Fourier transform of the system’s dynamics reveals the distribution of frequencies present in the trajectories, shedding light on their characteristics.
9.1 Fourier Transform Analysis
The Fourier transform of the electrical system’s dynamics [16], with parameters , , , and , yields the following expression:
This Fourier transform represents the frequency spectrum of the system’s behavior, indicating the presence and distribution of frequencies in the trajectories.
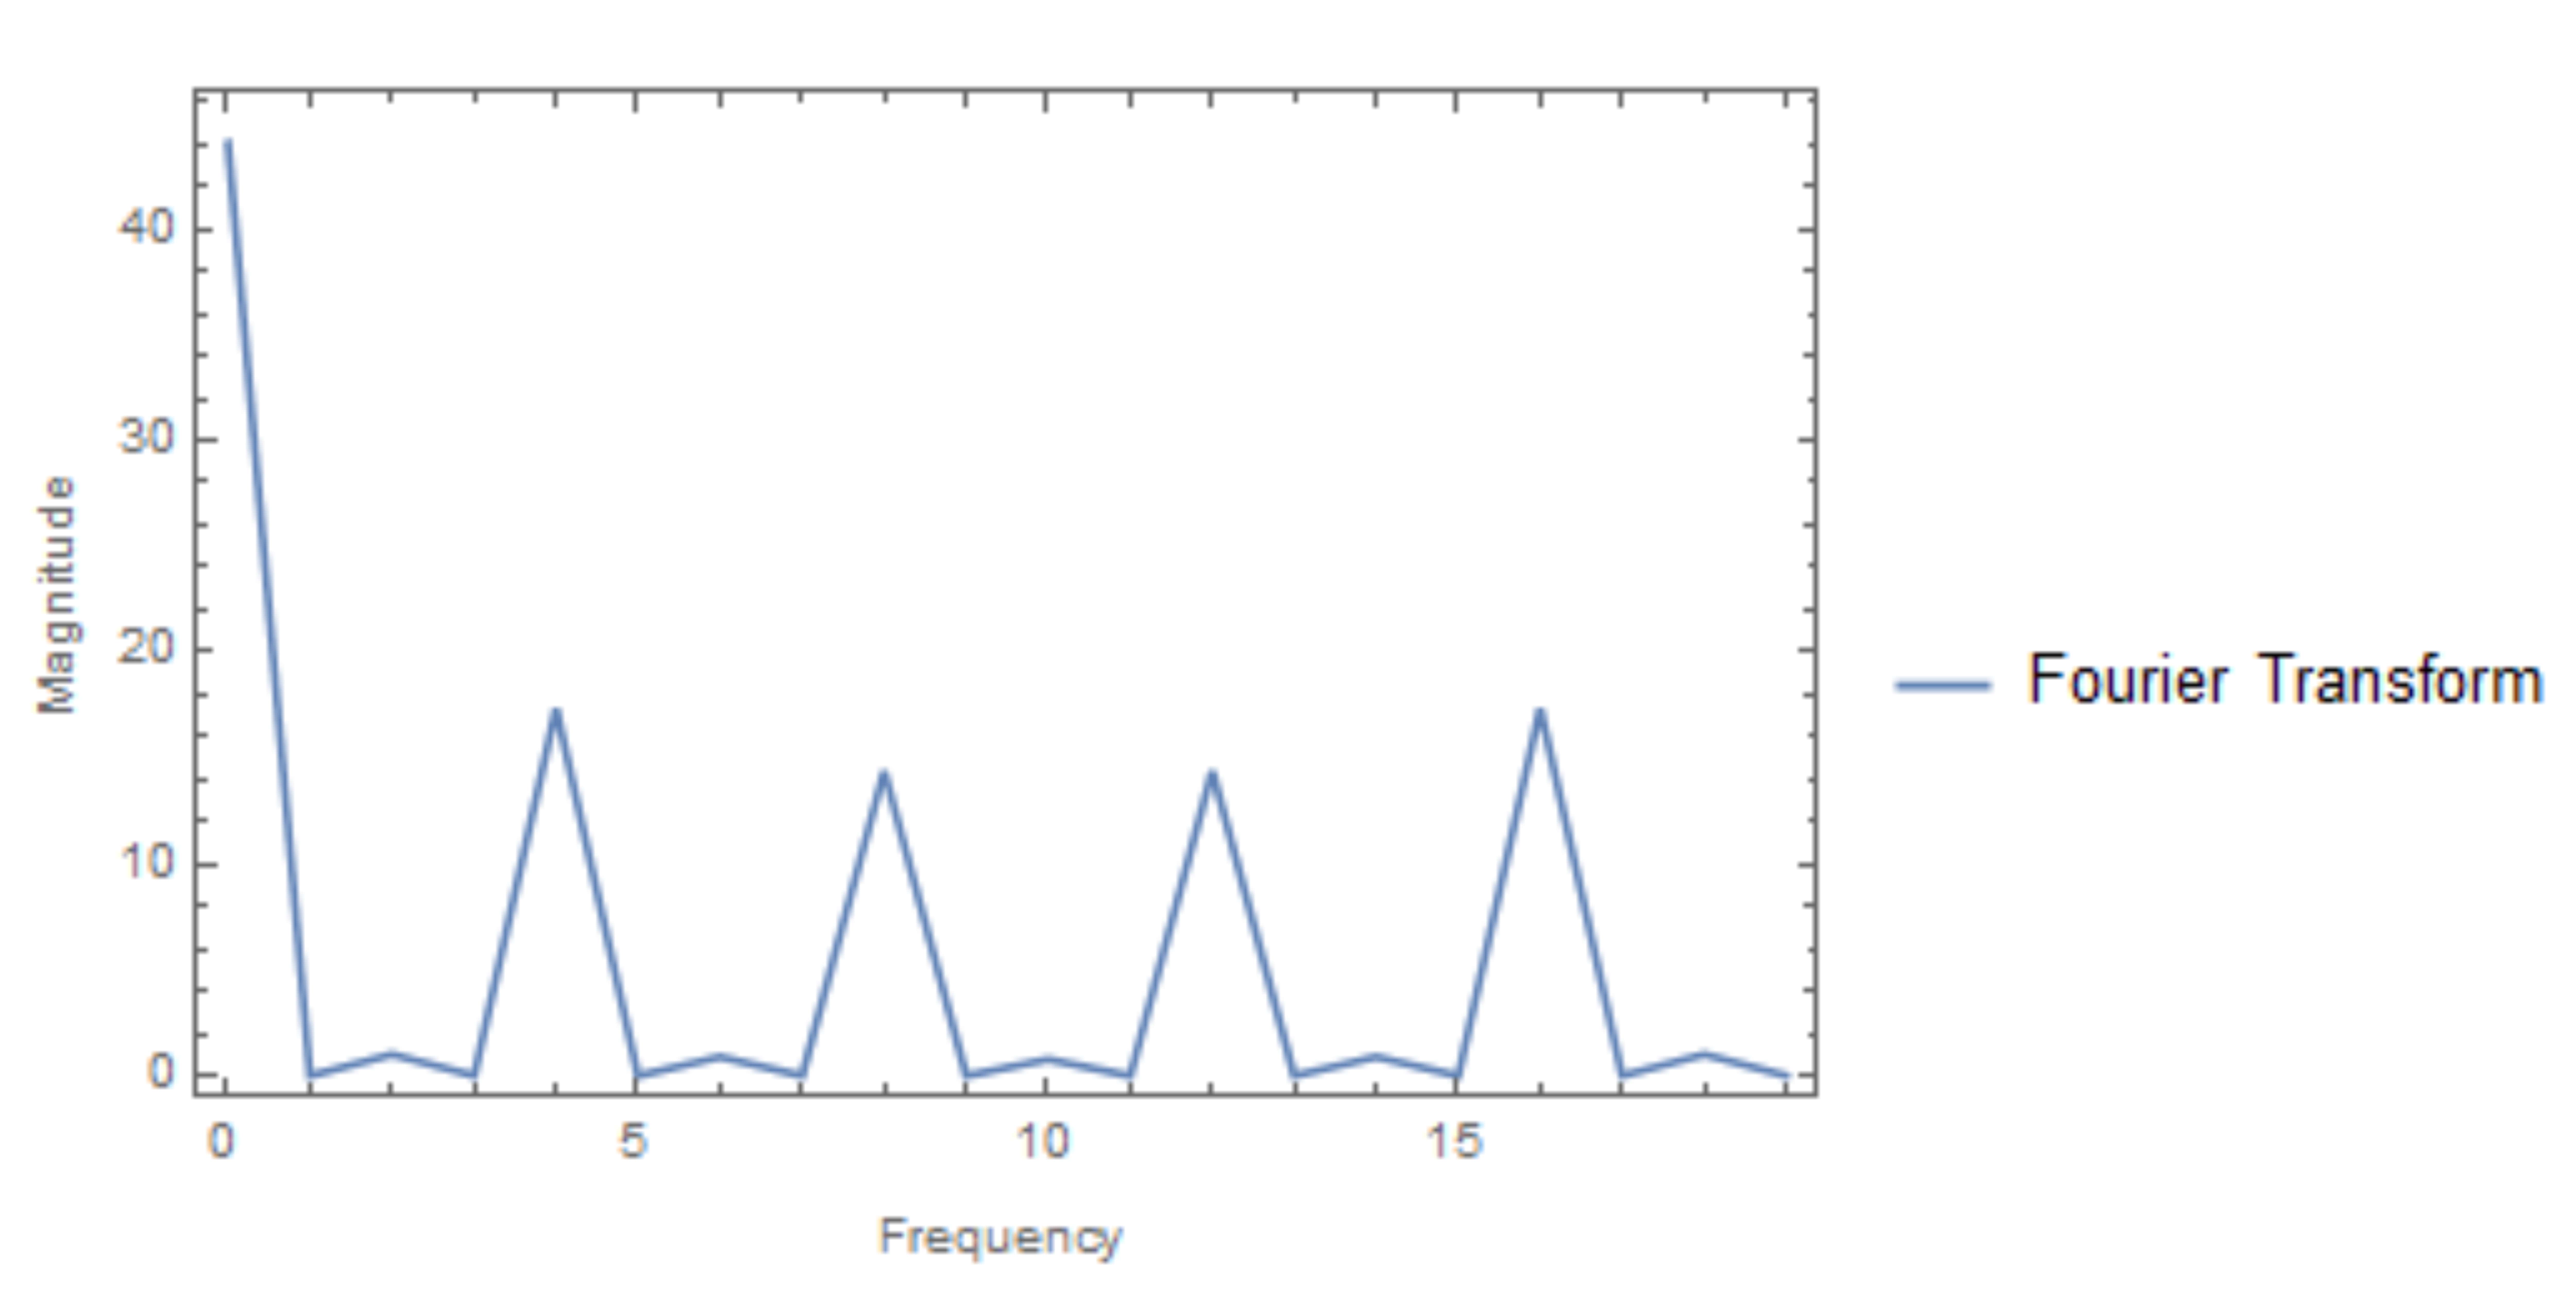
Figure 9 illustrates the plot of the Fourier transform derived from the system’s phase portrait. The plot showcases the distribution of frequencies present in the trajectories, providing insights into the dominant frequencies and their significance in the system’s dynamics. The parameters used in generating this Fourier transform significantly influence the observed frequency components, emphasizing their impact on the system’s frequency-based behavior.
10 Poincaré Section Analysis
The Poincaré section is a pivotal tool in dynamical systems, allowing us to explore system behavior effectively [17]. It involves plotting the intersection points of trajectories with a selected surface in the phase space. By observing the intersections, we can comprehend the system’s behavior without analyzing the entire trajectory.
The Poincaré section plot depicted in Figure 10 provides insights into the system dynamics for specific parameters , , and . Each point represents the system state at the intersections with the defined surface.
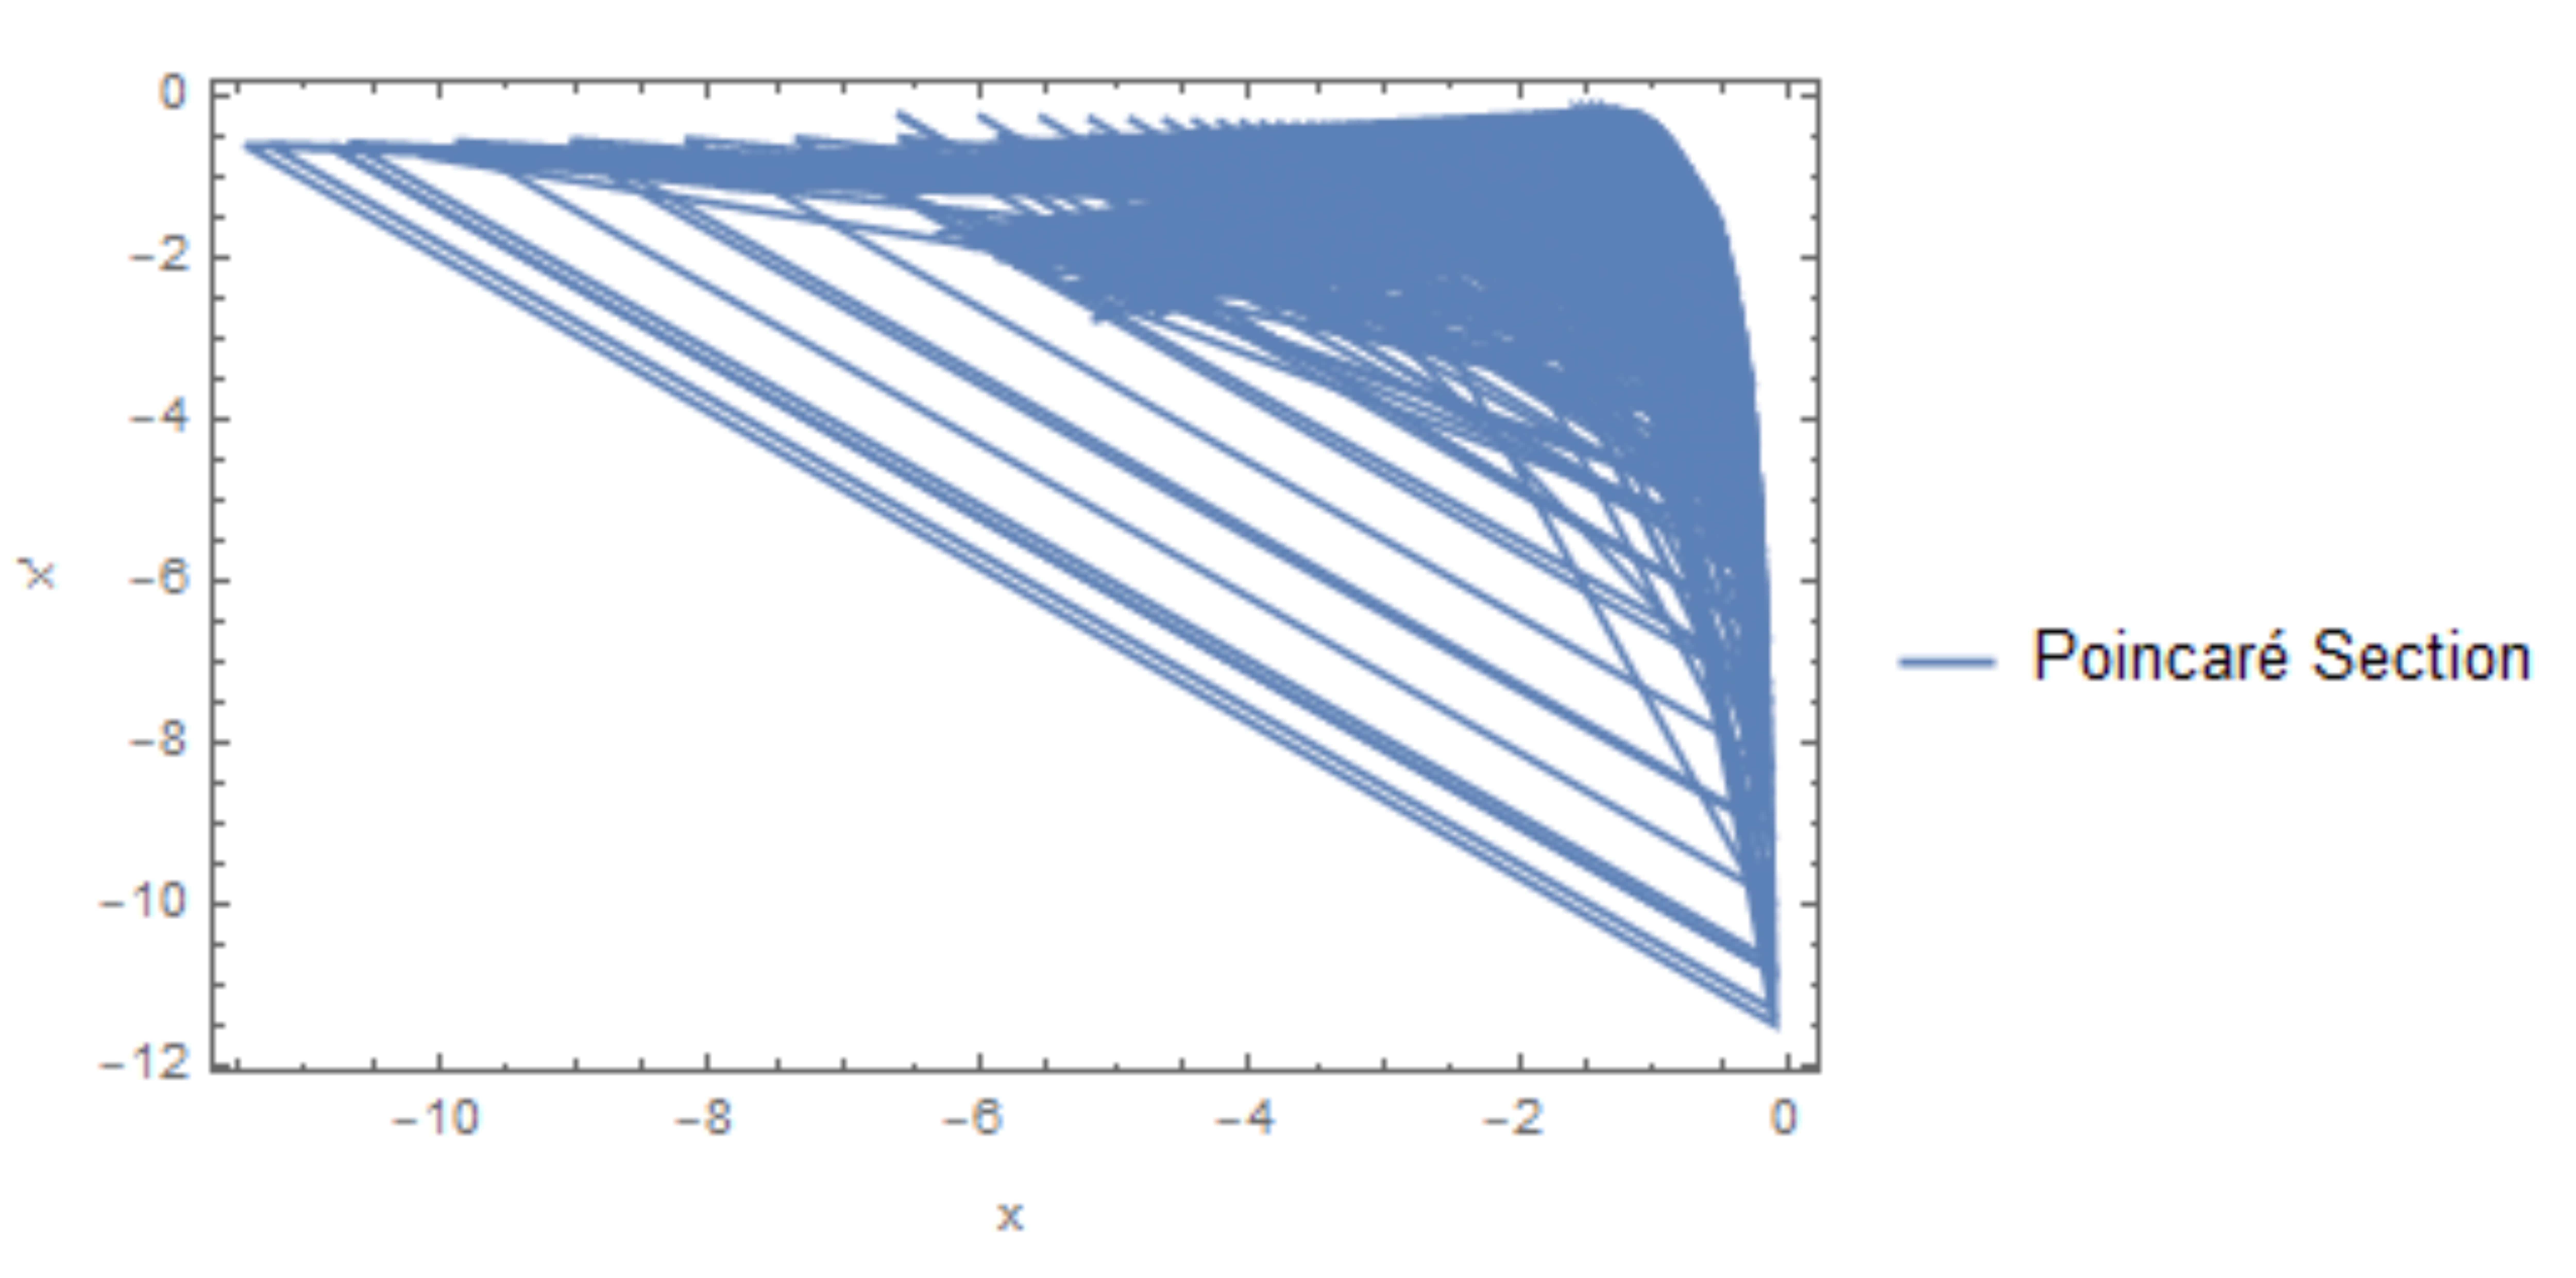
The plot portrays the intersections of trajectories in the phase space, visualizing the system’s behavior at discrete moments. These points showcase the recurrent states or the system’s visitation pattern on the chosen surface.
The Poincaré section offers a condensed view of the system’s dynamics, revealing recurring behaviors and aiding in the analysis of stability, periodicity, or chaotic regimes. The observation of the Poincaré section predominantly in the negative region aligns with the bifurcation pattern obtained earlier for the same parameter values. This occurrence holds valuable implications regarding the system’s dynamics.
In electrical systems, negative regions might represent particular states or behaviors that are in opposition or counter-response to the positive regions. For instance, it could signify modes of operation distinct from the ones observed in the positive domain. These regions might denote stable states, attractors, or behaviors that emerge due to certain parameter settings.
The correspondence between the negative Poincaré section and the bifurcation pattern implies a potential connection between the system’s stability, periodicity, or attractors across different parameter regimes. It suggests that the system might exhibit contrasting or complementary behaviors in these regions, signifying diverse operational states or responses.
Further investigation into the specific dynamics and characteristics observed within the negative Poincaré section, coupled with an analysis of the bifurcation patterns, would provide deeper insights into the system’s behavior and its response to different parameter configurations.
10.1 Poincaré Sections and Phase Analysis for Varied Parameter Values
In this subsection, we include Poincaré section plots and phase analysis for various parameter configurations. For each case, we adjust parameters , , while keeping within the corresponding range.
Case 1: , , ( range: 0.5 to 0.95)
The Poincaré section plotted for the chosen parameter values (, , ) provides insight into the system’s behavior. This representation captures the intersection points of trajectories in the phase space, indicating recurrent states or areas of convergence.
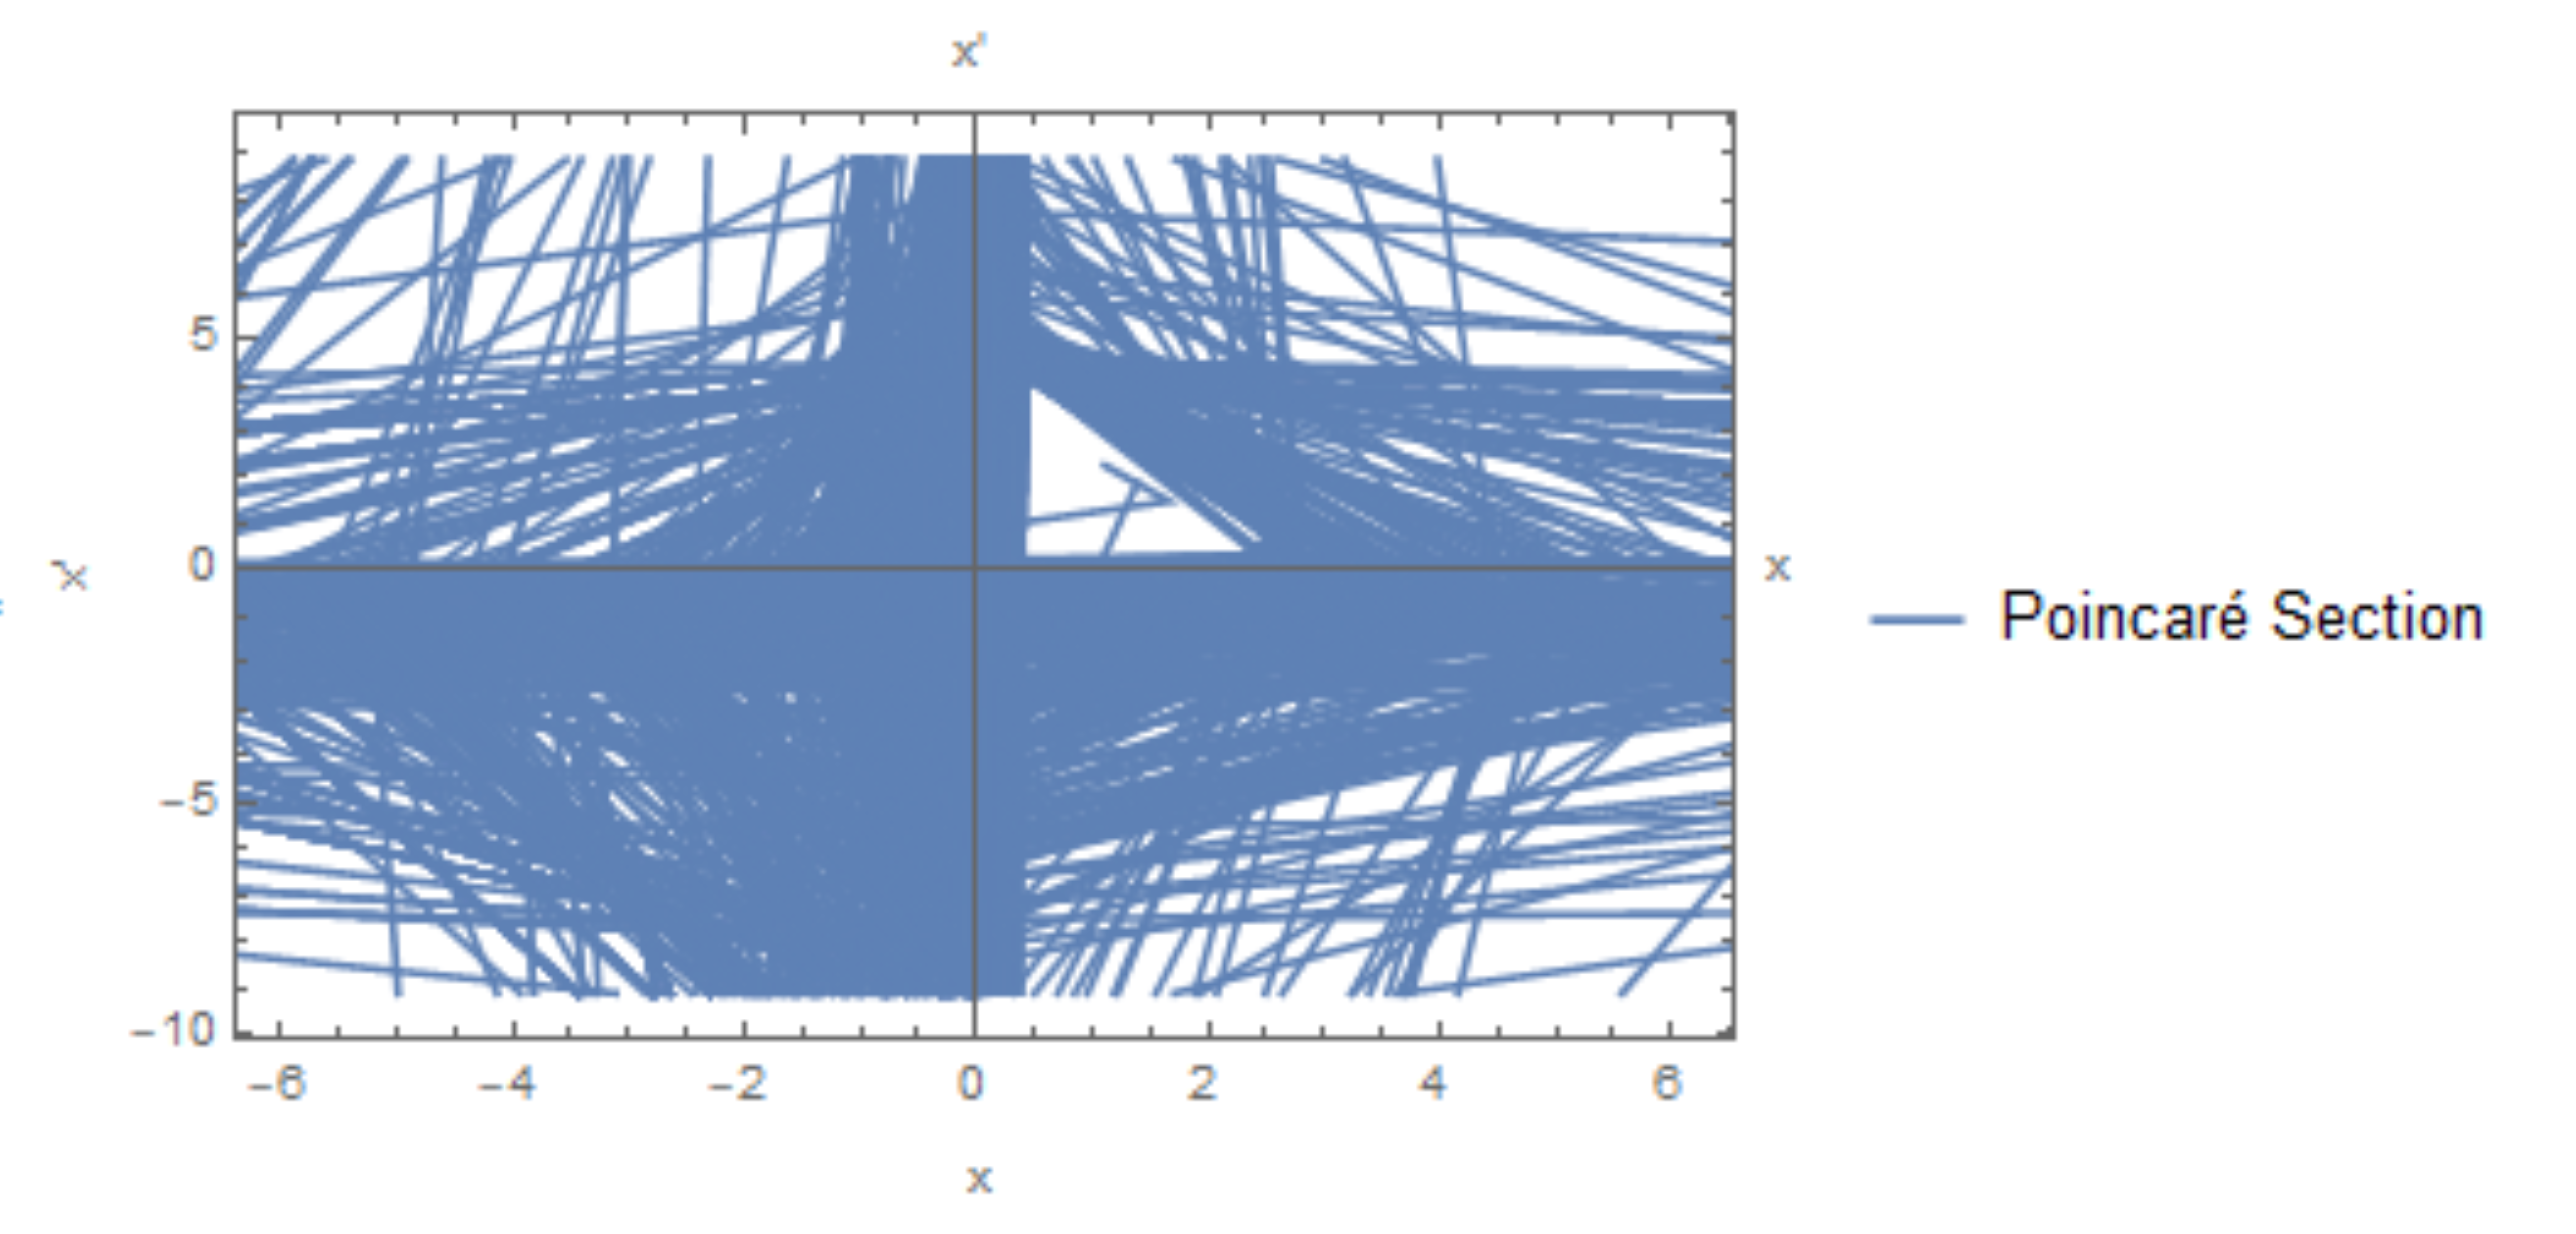
The presence of intersections, especially in specific regions of the phase space, signifies recurrent behavior or attractors within the system. The appearance of points in the negative region, akin to previous bifurcation observations, could indicate stability or convergence to specific states or cycles. Additionally, the blue intersections in the positive region suggest the possibility of chaotic behavior, indicating sensitivity to initial conditions and non-repeating dynamics.
Further exploration of varied parameter sets will provide a comprehensive understanding of how different configurations affect the system’s behavior, revealing patterns, chaos, or stability.
Case 2: , , ( range: 0.5 to 0.95)
For the second case, with adjusted parameters (, , ), the Poincaré section analysis reveals intriguing observations.
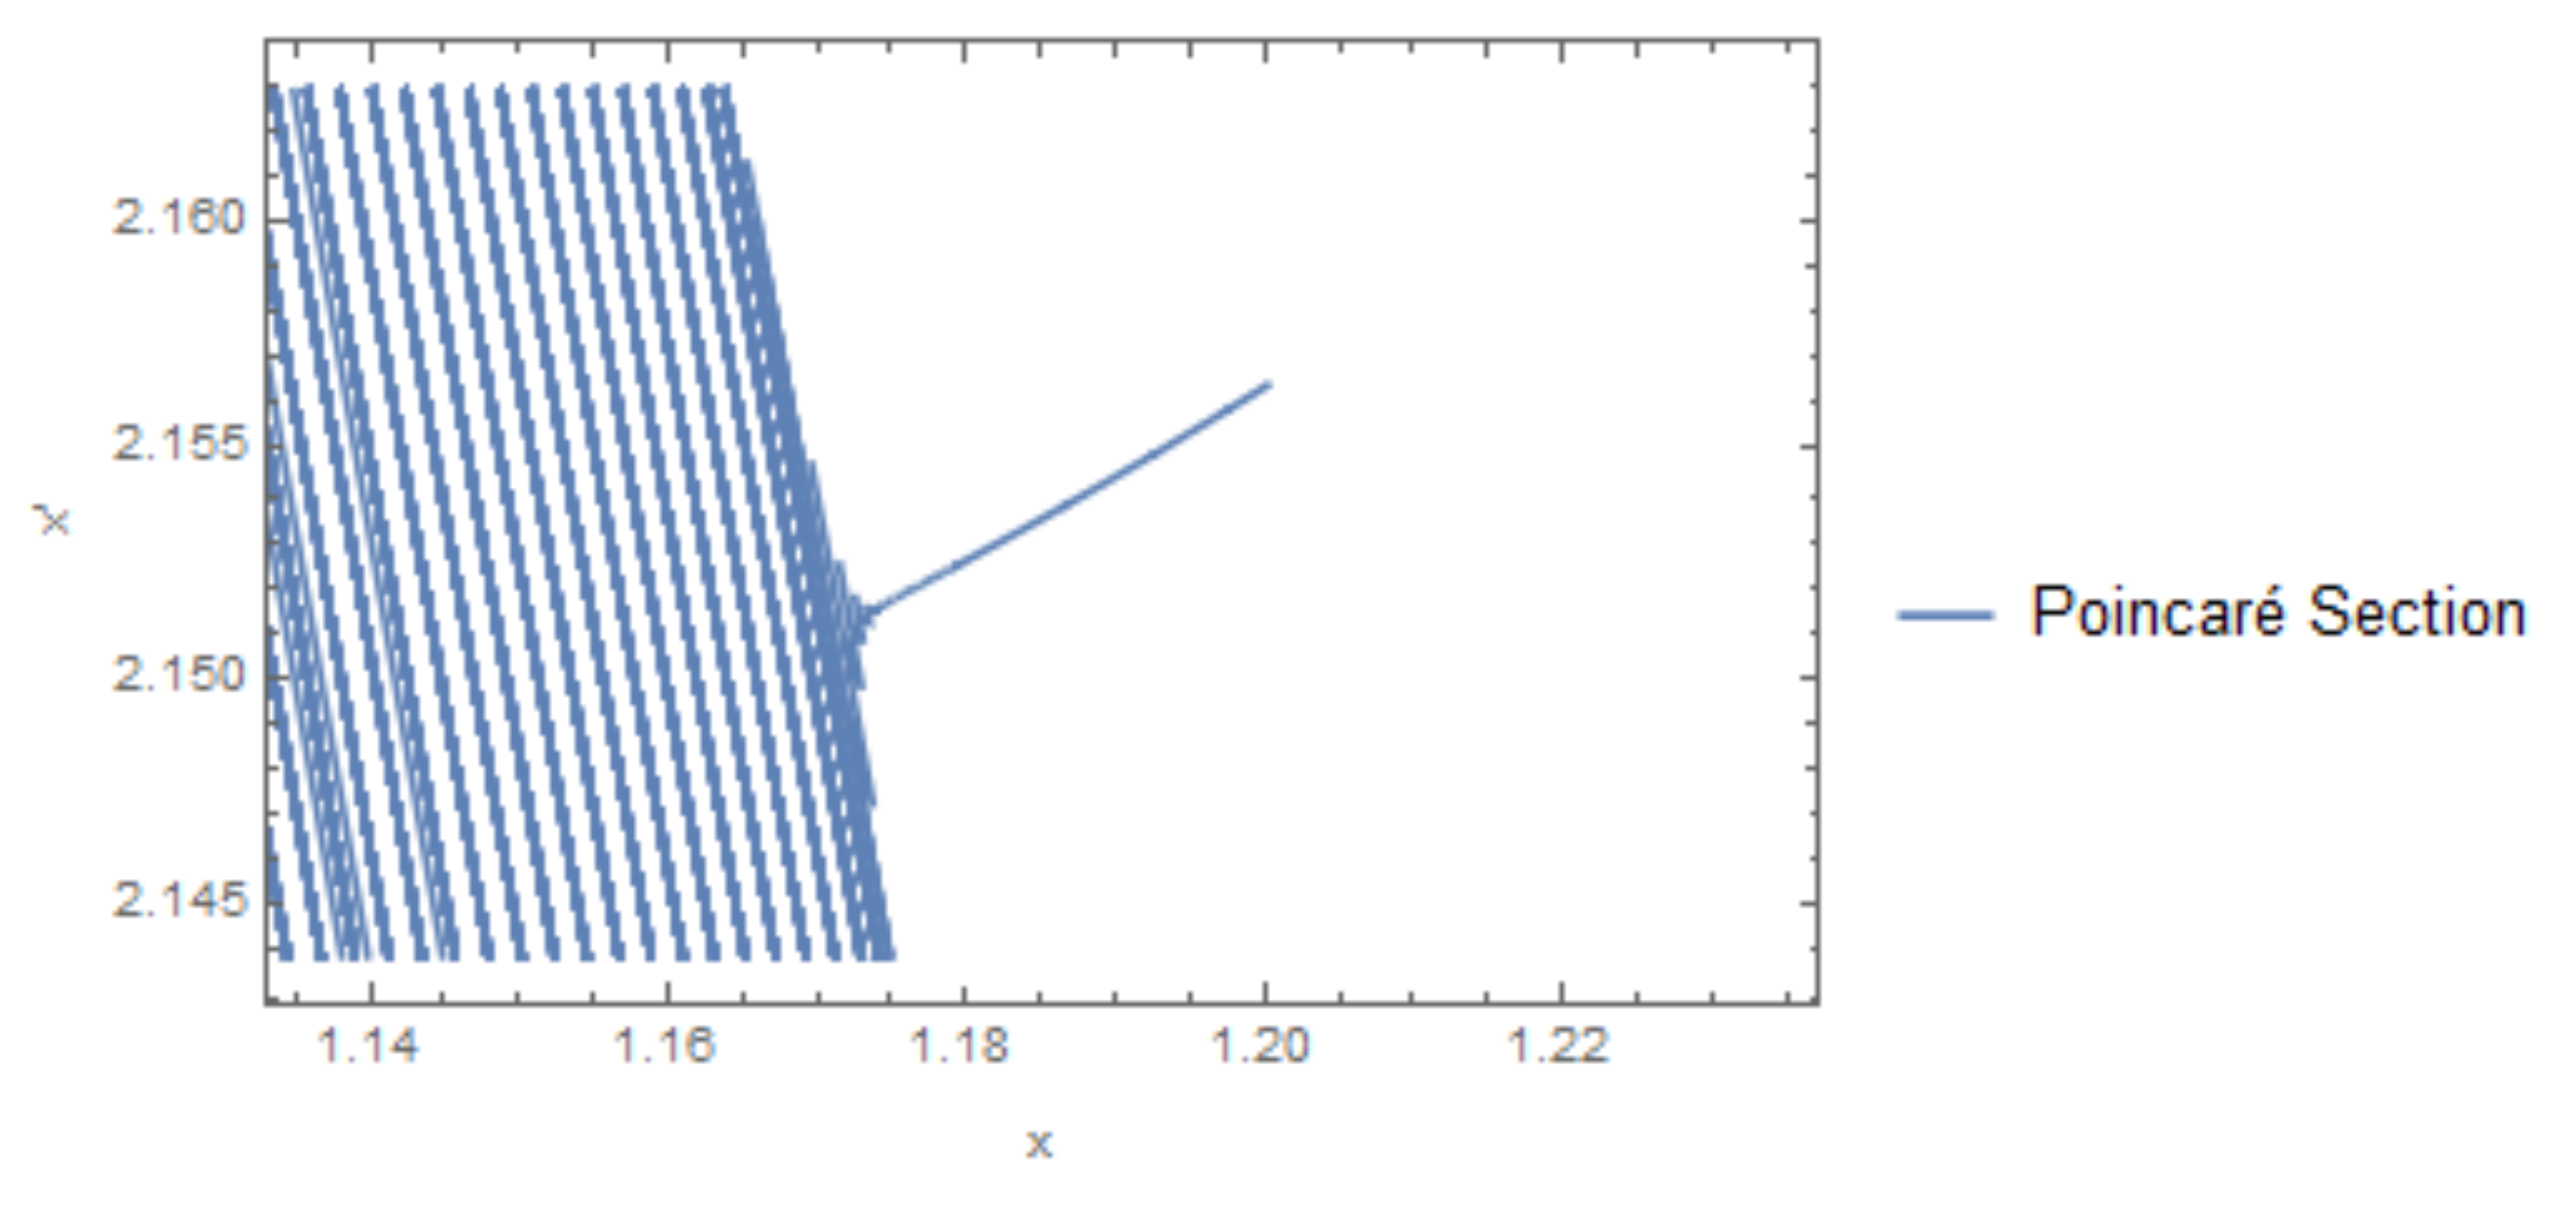
All plotted intersections appear in the positive region, indicative of distinct behavior compared to the previous cases. The absence of intersections in the negative region, coupled with the presence of blue intersections solely in the positive region, suggests the potential for chaotic behavior.
This observation aligns with chaotic dynamics, characterized by sensitivity to initial conditions and non-repeating trajectories. The absence of intersections in the negative region may indicate a lack of convergence towards stable states, emphasizing the system’s propensity for irregular behavior.
Further exploration of parameter variations continues to provide insights into the system’s behavior, highlighting patterns, stability, or chaotic tendencies.
Case 3: , , ( range: 0.5 to 0.95)
For the third case, with significantly increased parameter values (, , ), the Poincaré section illustrates compelling insights.
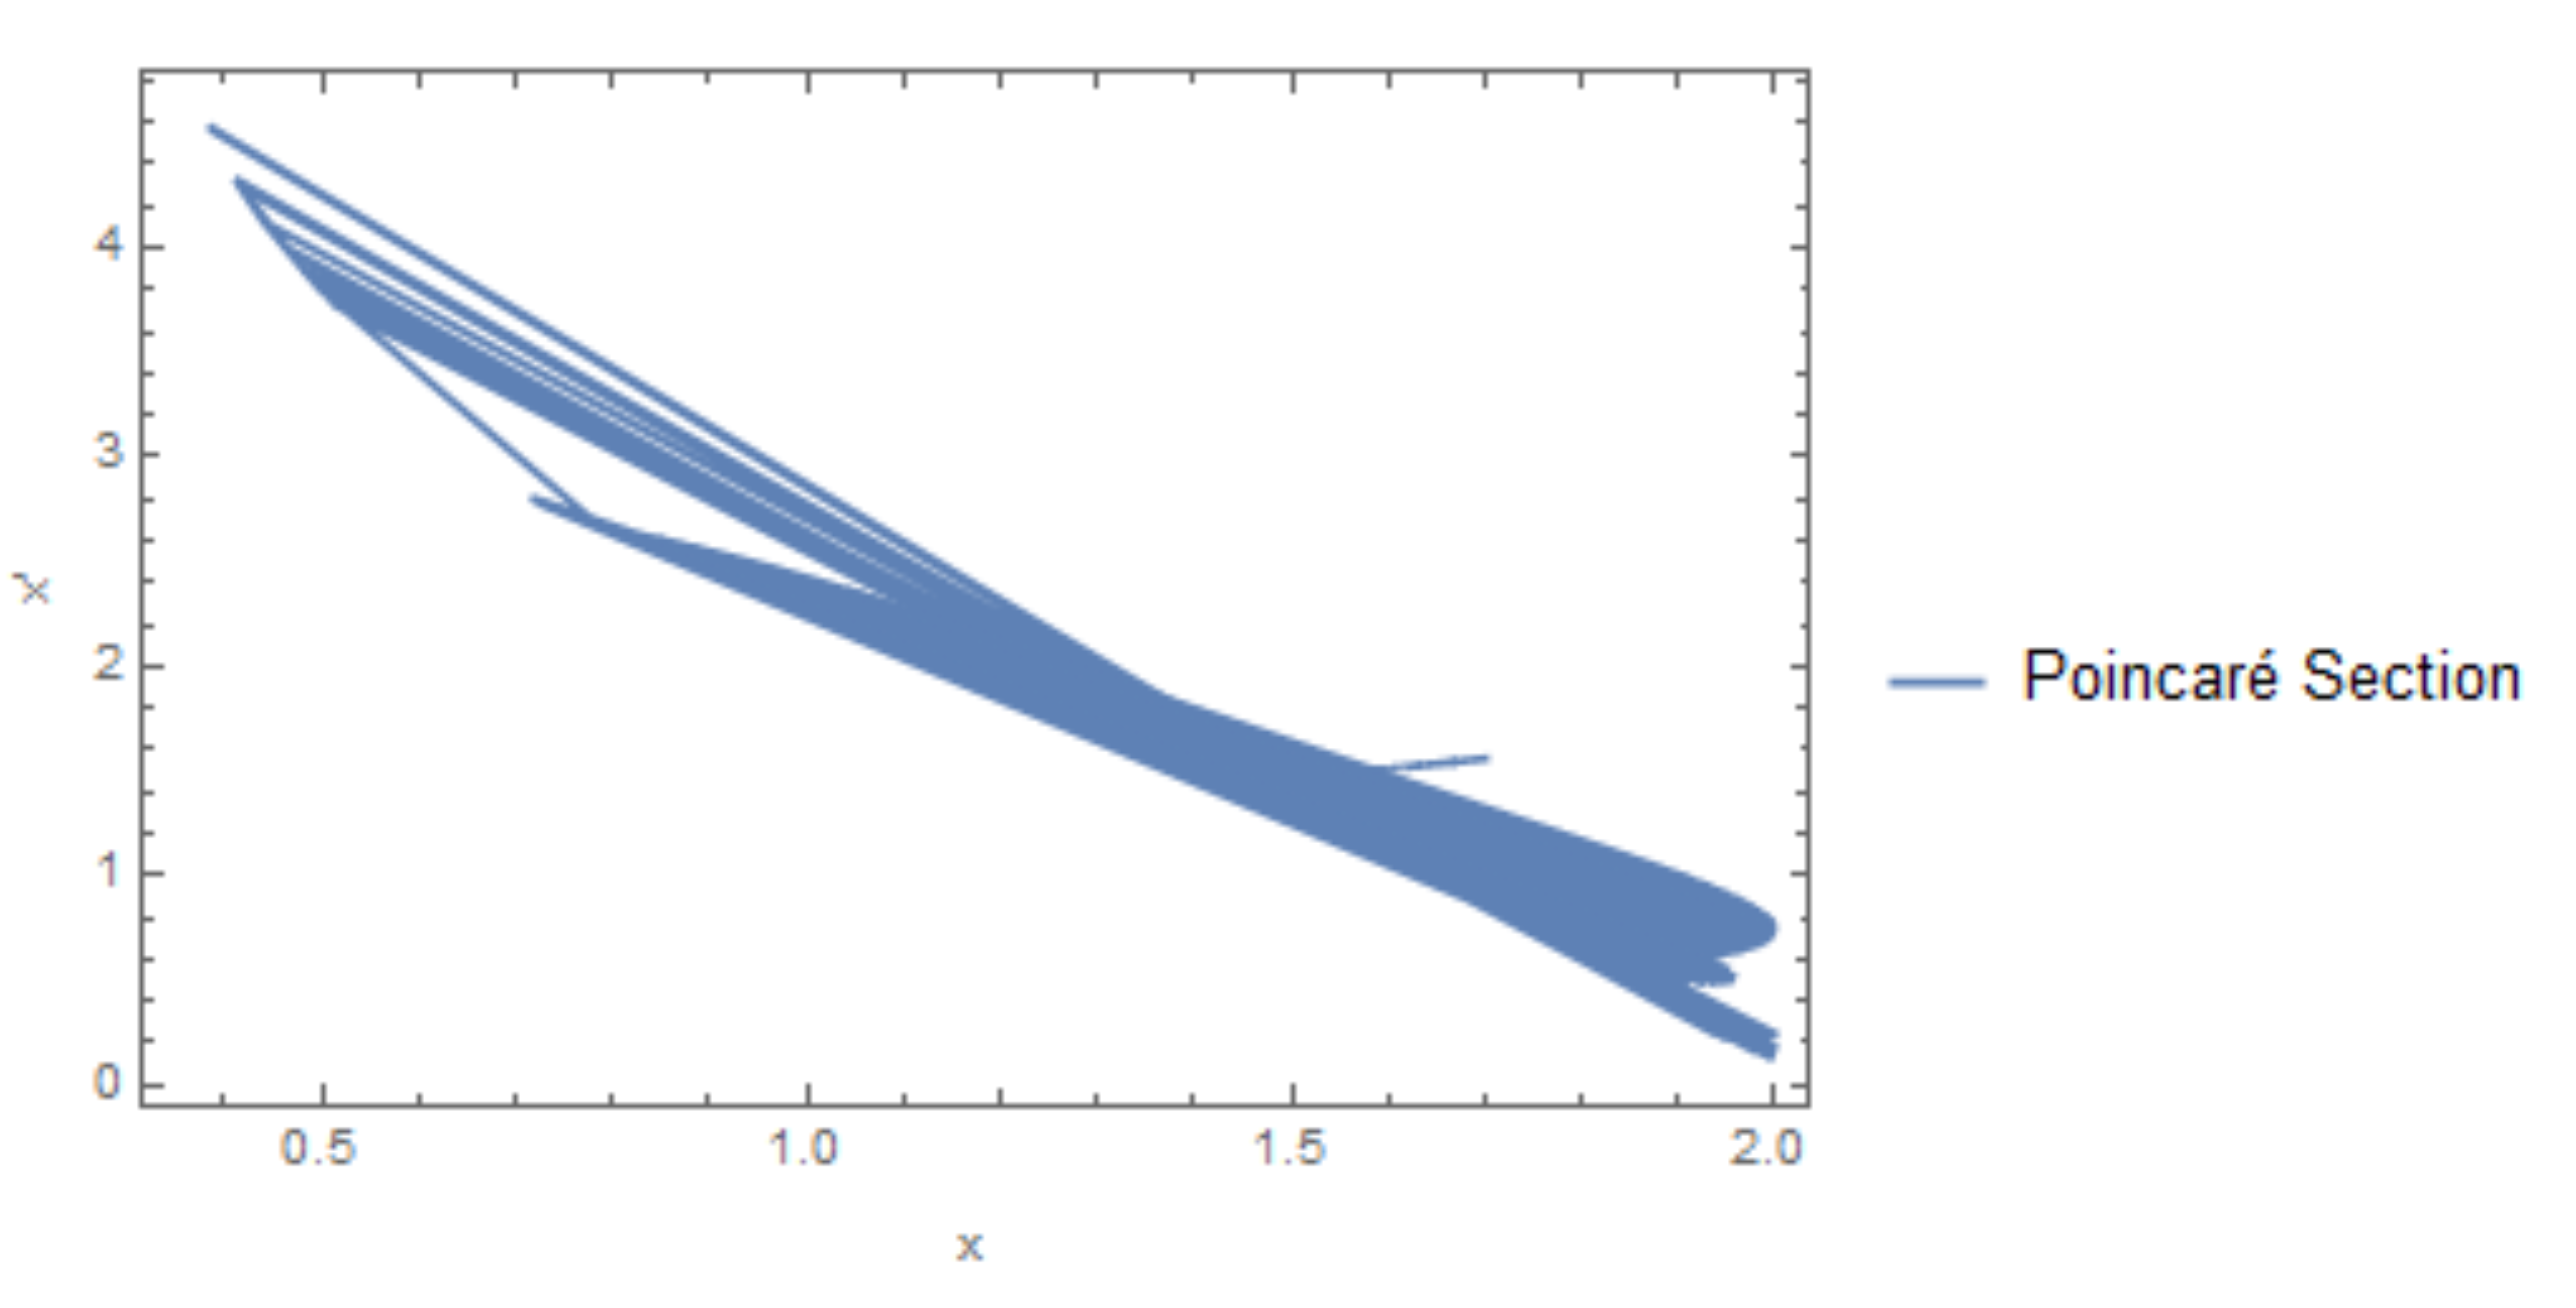
Observing all intersections occurring in the high positive region aligns with chaotic behavior patterns. The presence of intersections exclusively in this region signifies erratic and non-repeating dynamics, typical of chaotic systems.
The high parameter values drive the system into a state of increased complexity and sensitivity to initial conditions, resulting in intricate trajectories. The absence of intersections in the negative region reinforces the chaotic nature, depicting the lack of convergence towards stable states.
This observation further solidifies the chaotic tendencies observed within this electrical system, highlighting its sensitivity to parameter variations and initial conditions.
Additionally, for a comprehensive exploration of diverse behaviors in our electrical system model, readers are encouraged to refer to the corresponding Mathematica code available in our notebook. The sections titled ’Bifurcation Analysis’ and ’Lyapunov Exponents’ contain code snippets and plots for bifurcation diagrams and Lyapunov exponent calculations. Furthermore, the ’Poincaré Section Plots’ section provides plots generated from the Poincaré section analysis.
11 Energy Distribution in Our New Electrical System
For the equation representing our electrical system, the following parameters were used:
Our electrical system, governed by the equation , involves various components like resistors, inductors, and capacitors. The parameter plays a significant role in influencing the behavior of energy storage within this system.
11.1 Interpretation of
The parameter is related to the system’s behavior, particularly in the context of energy storage. As varies, it affects the electrical dynamics, altering the energy distribution within the components. Higher values of often correspond to changes in the system’s stability and may influence the resonant behavior and overall energy storage characteristics.
11.2 Behavior of Energy vs.
To understand the system’s energy behavior concerning , we plot the energy stored in the inductor component across a range of values:

The plot illustrates how the energy stored in the inductor component varies concerning different values of . As changes, the energy distribution within the inductor alters, showcasing the sensitivity of energy storage to the parameter .
This variation in energy distribution provides valuable insights into the system’s behavior and aids in understanding the impact of on the electrical dynamics and energy storage mechanisms.
11.3 Energy Distribution in Our New Electrical System
In our electrical system with parameters , , and varied in the range (0.000000073, 0.0000073], we examine the energy stored in the inductor concerning the varying values.[4] The relationship between and the stored energy is a crucial aspect of our system’s behavior.
Effect of on Energy in the Inductor
The plot below illustrates the relationship between the inductor’s stored energy and the parameter . As decreases, we observe an intriguing behavior: a significant increase in the energy stored in the inductor. This behavior hints at a crucial interplay between the capacitance () and the energy dynamics within the electrical system.
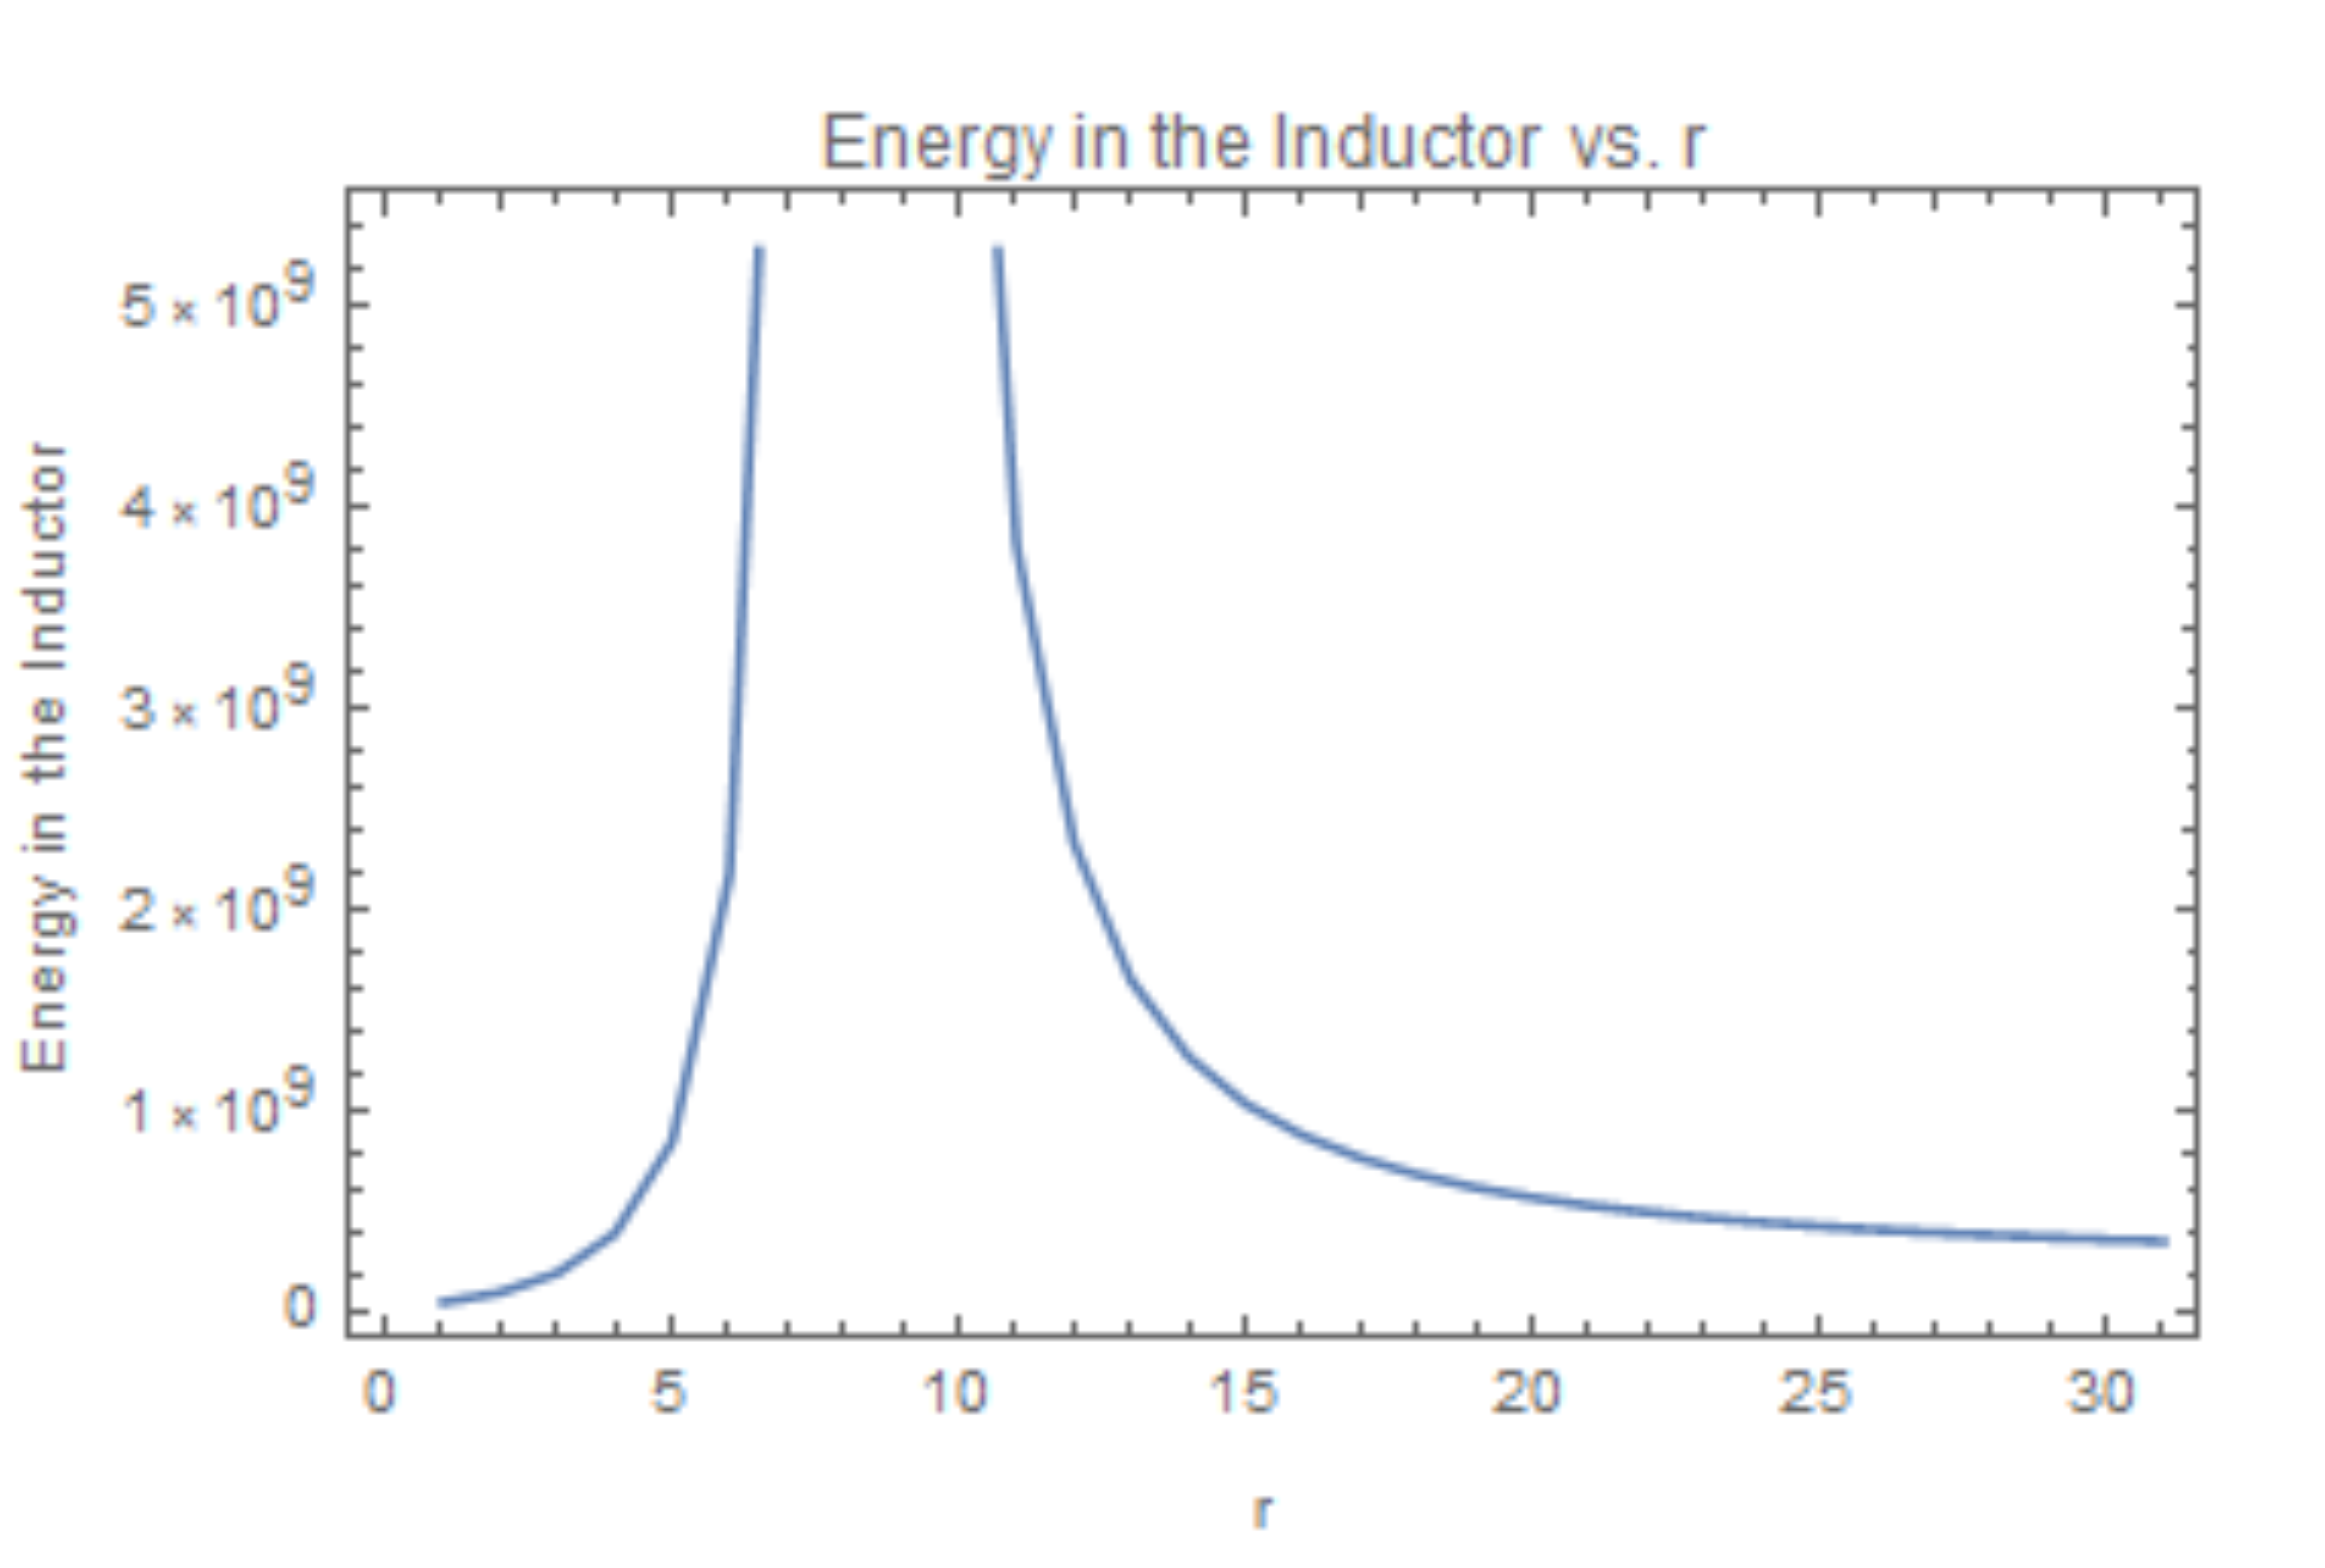
The noticeable rise in energy levels as decreases highlights the influence of capacitance on the system’s energy storage. Additionally, the sharp discontinuity observed for very small values indicates a critical threshold where the behavior of the system significantly changes.
12 Energy Transfer Analysis
The energy transfer [18] within electrical systems refers to the movement or exchange of energy among various components like capacitors, inductors, and resistors. Understanding how the source allocates energy across these elements and how it changes with varying parameters is crucial.
In our analysis, we explored the energy transfer rates within the electrical system, focusing on changes in energy stored in the components over time. The plot in Figure 16 illustrates the rate of energy transfer specifically in the inductor concerning the parameter , varying between 0.5 and 2.
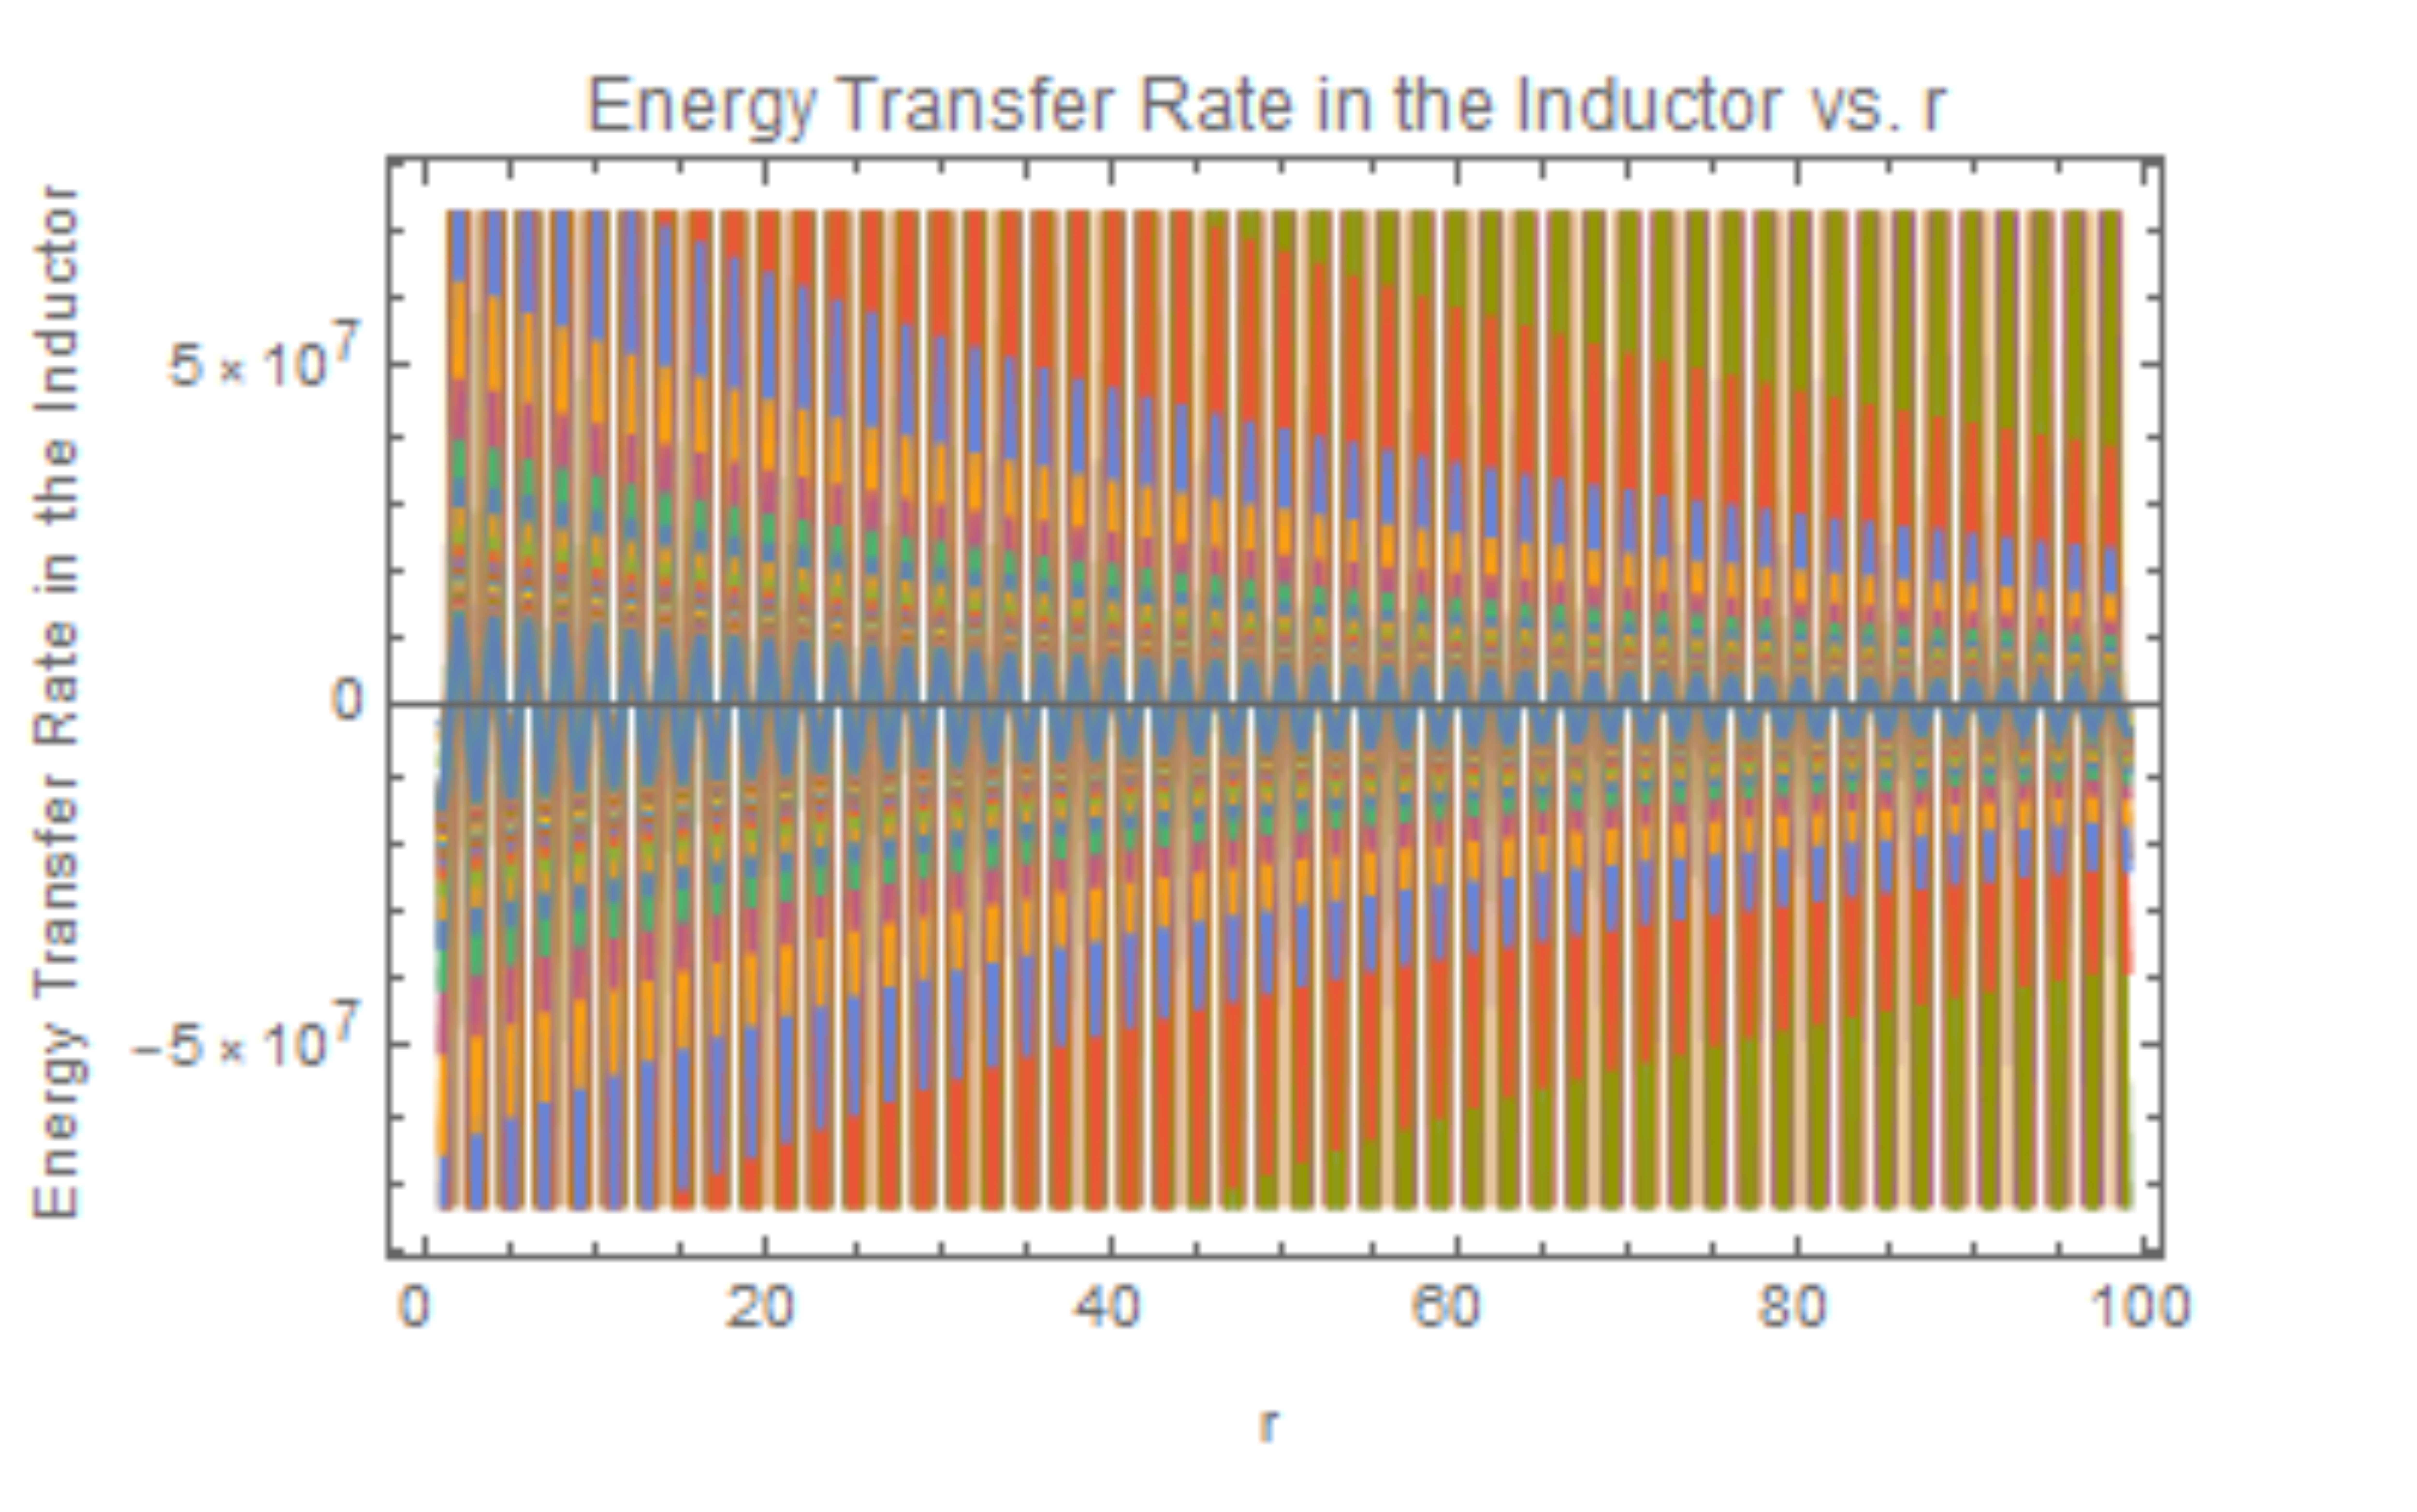
This plot demonstrates the varying rate at which energy is transferred to the inductor [21] for different values of within the range specified. Notably, it reveals trends in energy flow, highlighting how changes in impact the rate of energy transfer to the inductor. This analysis provides insights into the system’s behavior concerning energy distribution among its components. Additionally, further investigation into the impact of changing the capacitance () value on energy transfer was conducted. The plot in Figure 17 depicts the effect of increasing from to on the energy transfer rate in the inductor.[19]
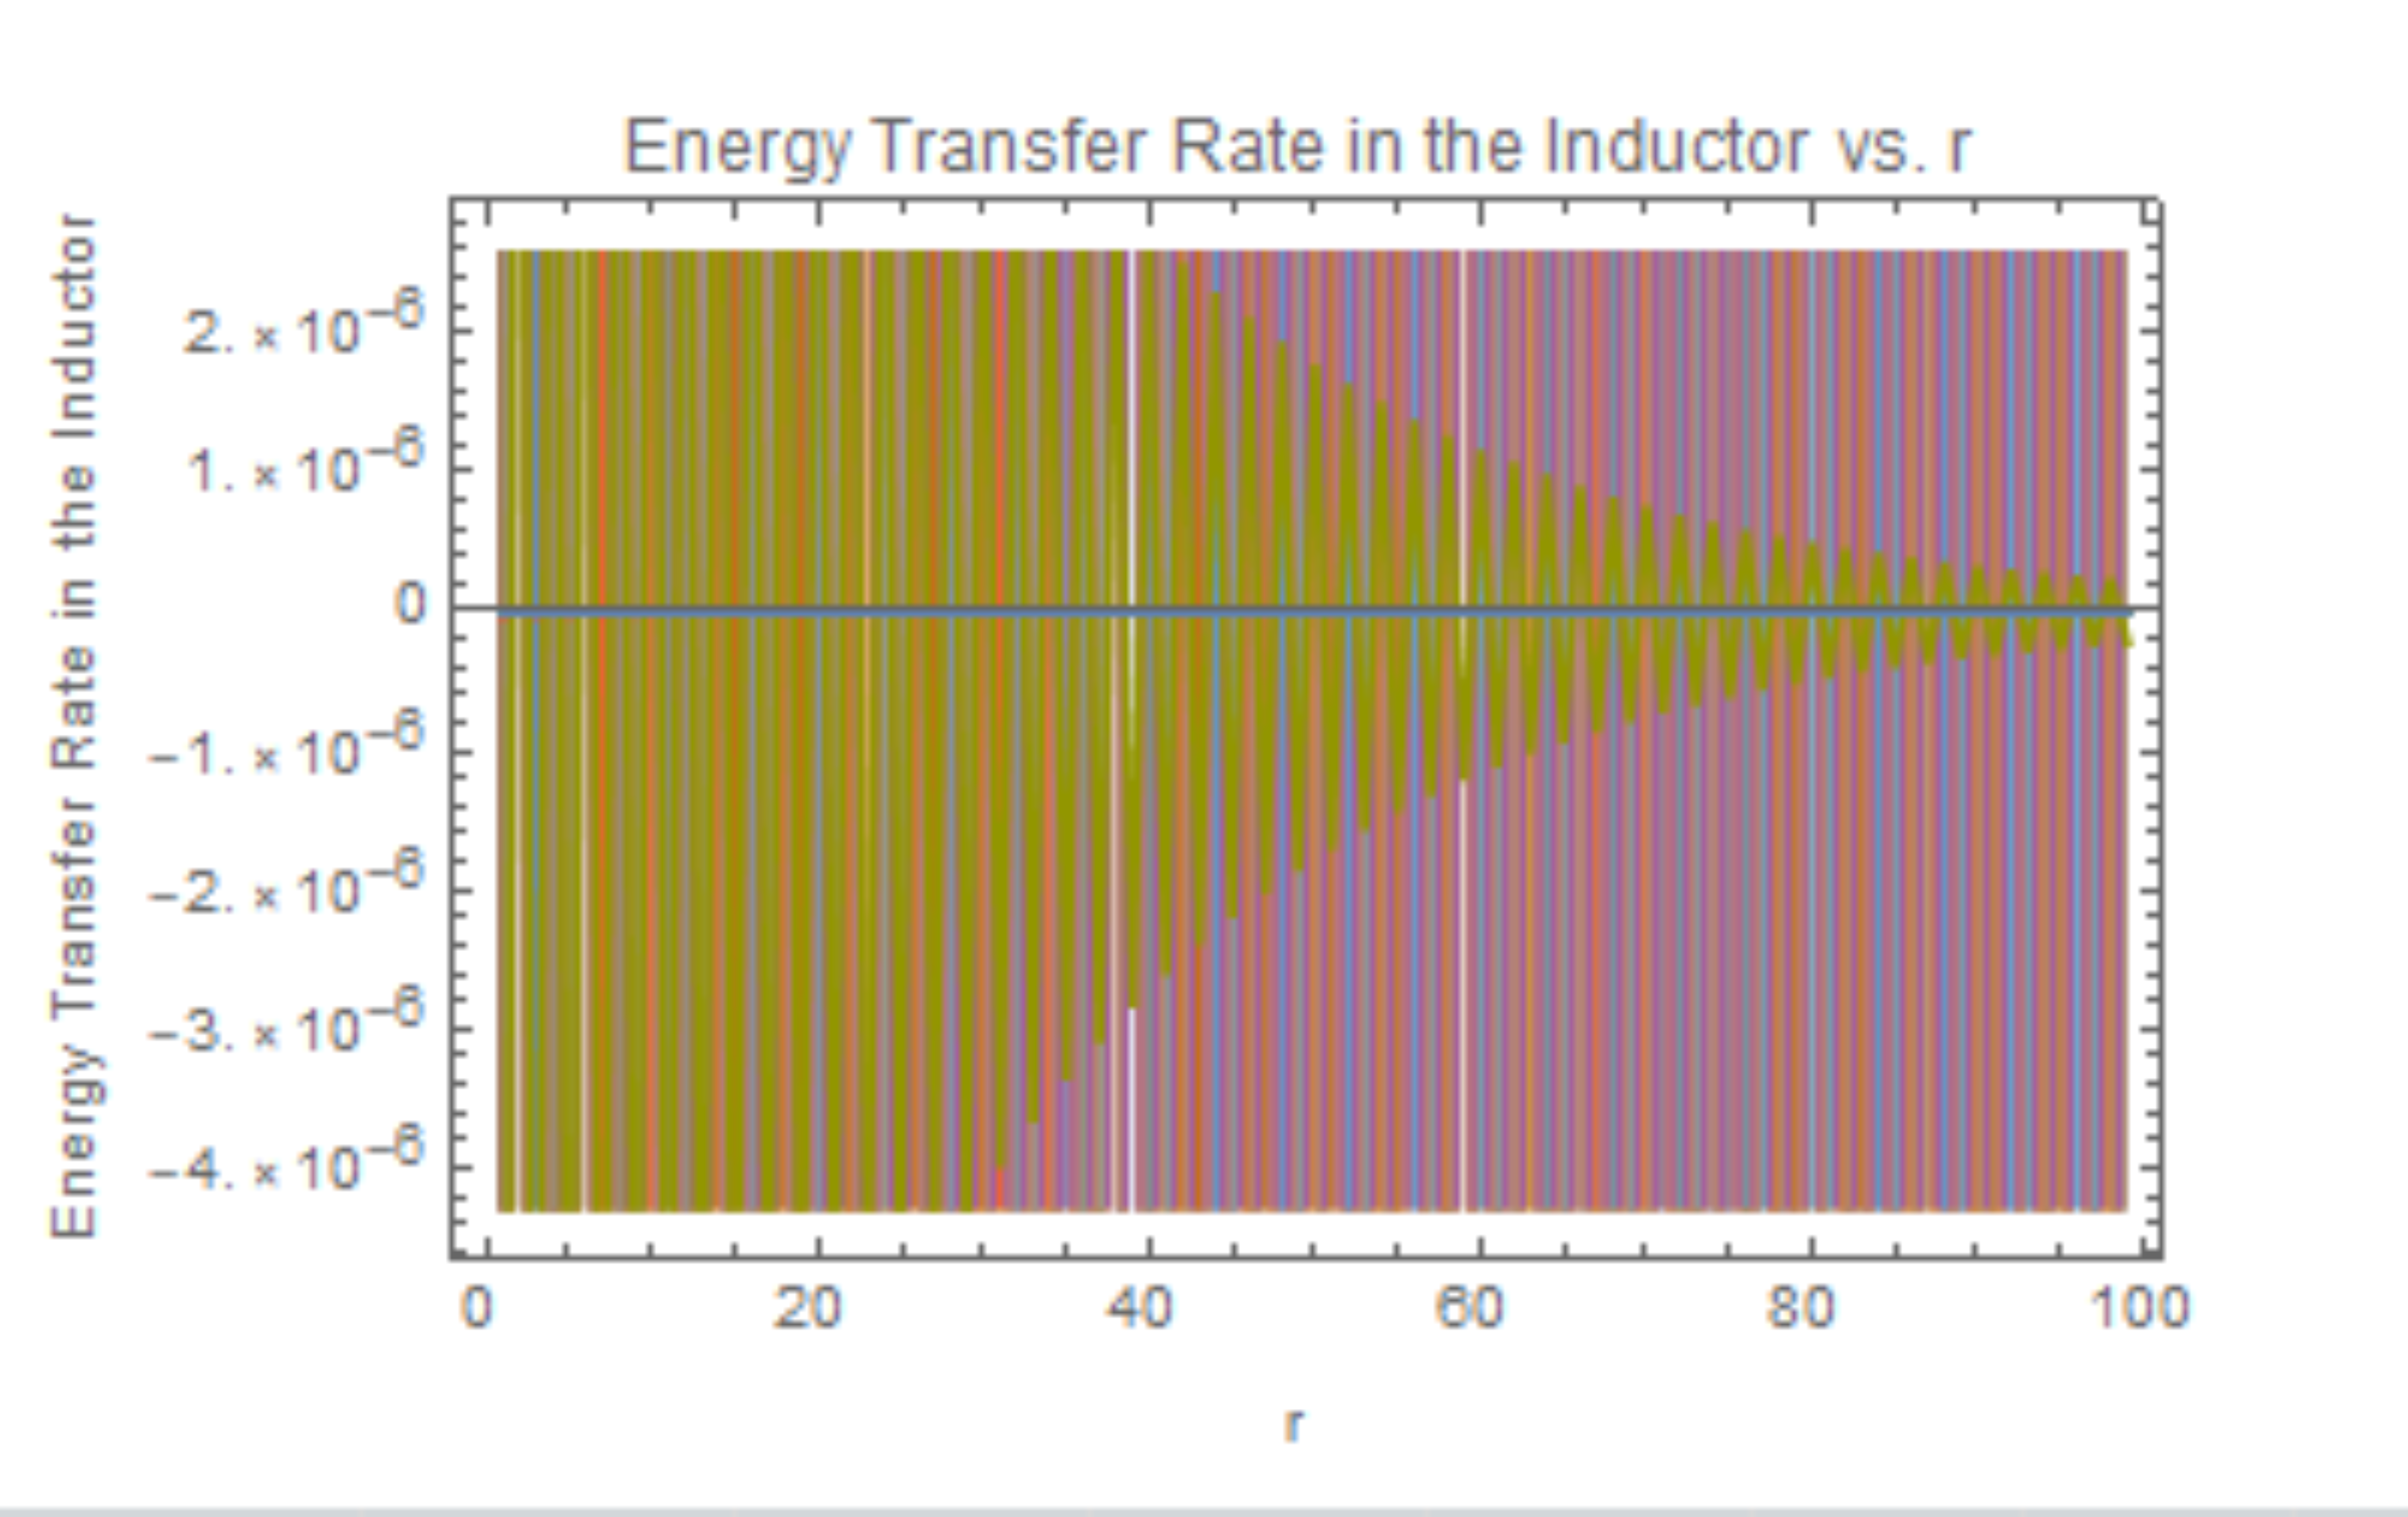
As observed in Figure 17, increasing the value of capacitance () from to results in a decrease in the energy transfer rate. This alteration in induces small positive and negative values in the energy transfer rate, indicating a change in the flow and distribution of energy within the system.
13 Chaotic Behavior, Energy Transfer, and Storage in Electrical Systems
In electrical systems, the interaction between system parameters and non-linear components often leads to chaotic behavior. While there isn’t a specific theorem directly linking chaos to energy transfer and storage, the behavior can be related, especially in systems with intricate dynamics.
The Derived Electrical System Formula: The system is described by the equation:
Connecting Chaos and Energy in Electrical Systems:
-
•
Parameter Sensitivity: The system’s response is sensitive to variations in parameters like capacitance (). As changes, the system may undergo bifurcations, leading to abrupt changes in behavior, potentially triggering chaotic regions.
-
•
Energy Dynamics and Chaotic Behavior: Non-linear components in the system equation contribute to non-deterministic behavior. Decreasing values might induce chaotic responses, resulting in erratic energy patterns and unpredictable energy transfer rates.
-
•
System Complexity: Chaotic behavior often emerges from the system’s intricate nature. As varies, the system might exhibit chaotic regions, characterized by irregular energy distributions and complex energy transfer dynamics.
While there’s no direct theorem linking chaos to energy transfer/storage in electrical systems, the observed behavior aligns with established principles of chaotic systems. Sensitivity to parameter variations, non-linear dynamics, and system complexity contribute to chaotic behavior, impacting energy transfer and storage patterns.
14 Comparison of Yitang and Montgomery Dynamics
In this section, we compare the quantum properties of the Yitang and Montgomery dynamics by analyzing their respective Hamiltonian operators and eigenvalues.
14.1 Yitang Dynamics
The quantum Hamiltonian operator for the Yitang dynamics [1] is given by
where is the Laplacian operator, and represents the potential energy associated with the Yitang function.
14.1.1 Hamiltonian Operator
The Yitang Hamiltonian operator is defined as
with potential energy terms and .
14.1.2 Eigenvalues
The eigenvalues of the Yitang dynamics were computed using the Implicitly Restarted Arnoldi Method (IRAM). The computed eigenvalues are complex and exhibit sensitivity to changes in parameters.
14.2 Montgomery Dynamics
The Montgomery dynamics is described by the Hamiltonian operator
where is the potential energy associated with the Montgomery function.
14.2.1 Hamiltonian Operator
The Montgomery Hamiltonian operator [20] is given by the expression
with the Montgomery potential energy term.
14.2.2 Eigenvalues
The eigenvalues of the Montgomery dynamics were also computed using the Implicitly Restarted Arnoldi Method (IRAM). Remarkably, the computed eigenvalues are real, suggesting distinct quantum behavior compared to the Yitang dynamics.
14.3 Implicitly Restarted Arnoldi Method (IRAM)
The IRAM is an iterative algorithm for computing a few eigenvalues and corresponding eigenvectors of a large, sparse matrix [22]. It is particularly well-suited for quantum systems where direct diagonalization may be computationally expensive. IRAM iteratively refines the approximation to eigenvalues, making it a powerful tool for exploring quantum dynamics.
14.4 Comparison of Eigenvalues
Table 3 presents a comparison of the computed eigenvalues for both Yitang and Montgomery dynamics.
| Dynamics | Eigenvalue Index | Eigenvalues |
|---|---|---|
| Yitang | 1 | |
| Montgomery | 1 |
14.5 Diagonalizability
The diagonalizability of the Hamiltonian operators [23] is crucial for solving quantum systems. Here is a comparison of the diagonalizability of and :
14.5.1 Yitang Dynamics:
The complex eigenvalues of Yitang dynamics suggest the possibility of complex eigenvectors. Further analysis is required to determine the diagonalizability.
14.5.2 Montgomery Dynamics:
The real eigenvalues of Montgomery dynamics indicate that the corresponding eigenvectors are likely real and linearly independent. Hence, is expected to be diagonalizable.
In conclusion, while Yitang dynamics exhibits complex eigenvalues, Montgomery dynamics is more likely to be diagonalizable due to its real eigenvalues.
15 Conclusion
In this thorough exploration of the electrical system’s dynamics, our analysis traversed various facets, shedding light on its behavior under different conditions. The system, characterized by a complex equation involving parameters like , , , and , exhibited intricate patterns and behaviors across different analyses.
The phase portraits uncovered periodic trajectories, indicating stable limit cycles, and concentrations in negative trend regions, signaling attracting fixed points. Additionally, hints of potential chaotic regions encouraged further exploration for a comprehensive understanding of the system’s dynamics.
Exploring attracting fixed points elucidated stable equilibrium states for diverse values. Trajectories in the phase portrait converging towards these points affirmed their attracting nature, providing valuable insights into the system’s stability.
Frequency spectrum analysis using the Fourier transform revealed the distribution of frequencies in trajectories. This provided critical information on dominant frequencies and their influence on the system’s overall dynamics.
Poincaré section analysis condensed the system’s behavior, showcasing recurring states and aiding in stability, periodicity, or chaotic analysis. The correspondence between the negative Poincaré section and the bifurcation pattern hinted at diverse operational states or responses within the system.
Examining energy distribution highlighted the sensitivity of energy storage to parameters like and . Changes in showcased variations in energy levels, while decreasing led to a significant increase in inductor energy, emphasizing the intricate relationship between capacitance and energy dynamics.
Energy transfer analysis provided insights into how changes in and impact the rate of energy transfer to the inductor. These observations contribute to understanding the flow and distribution of energy within the system.
In the realm of quantum dynamics, the comparison between Yitang and Montgomery dynamics unveiled distinctive characteristics. Yitang dynamics exhibited complex eigenvalues, suggesting potential complex eigenvectors, while Montgomery dynamics, with real eigenvalues, hinted at likely diagonalizability.
The real eigenvalues of the Montgomery dynamics make it particularly appealing for addressing the Riemann hypothesis. The system’s quantum behavior, characterized by real eigenvalues, aligns well with the requirements for diagonalizability, providing a promising avenue for further exploration in the context of number theory.
In conclusion, this multifaceted analysis enhances our understanding of the studied electrical system. The interplay between parameters, quantum aspects, and energy dynamics underscores the complexity of such systems. Further investigations, including sensitivity analyses and exploration of chaotic regions, can provide deeper insights into the system’s response to various conditions. The suitability of Montgomery dynamics for addressing the Riemann hypothesis opens up intriguing possibilities for future research in the intersection of classical dynamics and number theory.
16 Acknowledgements
I would like to express my sincere gratitude to the anonymous referee whose insightful comments and constructive feedback greatly contributed to the refinement of this work. Your dedication to maintaining the quality and integrity of the content has been invaluable, and I sincerely appreciate the time and effort you invested in reviewing my work.
I am profoundly thankful to my family for their unwavering support throughout this journey. My heartfelt appreciation goes to my parents for instilling in me a love for knowledge and a strong work ethic. To my loving wife, your encouragement and understanding have been my pillars of strength, and I am grateful for the sacrifices you have made to see me succeed.
I extend my love and gratitude to my sons, Taha Abdeljalil and Taki Abdessalem, for being a source of inspiration and joy in my life. Your presence fuels my determination to strive for excellence, and I am blessed to have you by my side.
A special acknowledgment is due to my dear friend, Bouzari Abdelkader, a dedicated teacher of physics in high school. Your support, encouragement, and intellectual insights have played a significant role in shaping my ideas and refining my work. Your friendship has been a constant source of motivation, and I am grateful for the positive influence you have had on my academic and personal growth.
I would also like to extend my gratitude to my dear sister Chaima (Arrass Ta3i) and my sister Widad, as well as my brothers Saddam and Kheireddine, Foued (Jouad), for their unwavering support and encouragement.
Special thanks to my best friends Berkani Khaled, a teacher of mathematics, and Guessama Farid, a doctor of Radiology, for their continuous encouragement and invaluable insights throughout this journey.
Once again, thank you to everyone mentioned and to those who have been a part of this journey. Your support has been instrumental in the realization of this endeavor.
17 Data Availability
The data used in this study is publicly available and sourced from the following paper, which serves as the basis for our research:
-
1.
Reference 1: Rafik, Z., & Humberto Salas, A. (2024). "Chaotic dynamics and zero distribution: implications and applications in control theory for Yitang Zhang’s Landau Siegel zero theorem." European Physical Journal Plus, 139, 217. DOI: 10.1140/epjp/s13360-024-05000-w [1].
All data and methodologies used in our analysis are in accordance with the methods outlined in the aforementioned paper. Additionally, any supplementary data required for replication or further analysis is available upon request from the corresponding author.
.
Declarations
The authors declare that there is no conflict of interest regarding the publication of this paper. We confirm that this research was conducted in an unbiased and impartial manner, without any financial, personal, or professional relationships that could be perceived as conflicting with the objectivity and integrity of the research or the publication process.
18 Appendix
Appendix A Derivation of Chaotics Operator for Montgomery Dynamics
The Montgomery Dynamics is described by the equation:
| (4) |
A.1 Hamiltonian Operator
The quantum Hamiltonian operator for the Montgomery dynamics is given by:
| (5) |
where is the Laplacian operator, and represents the potential energy associated with the Montgomery function.
A.2 Potential Energy Terms
Express the potential energy term as:
| (6) |
where and .
A.3 Chaotics Operator
The derived chaotics operator is given by:
| (7) |
Appendix B Extension to Riemann Hypothesis
B.1 Logarithmic Term and Von Mangoldt Function
Incorporate the Von Mangoldt function into the chaotics operator:
| (8) |
where is the Von Mangoldt function.
B.2 Rationale
Discuss the rationale behind incorporating the Von Mangoldt function and its connection to addressing the Riemann Hypothesis.
B.3 Numerical Simulations
Perform numerical simulations to analyze the properties and behavior of the modified chaotics operator.
B.4 Comparison with Riemann Zeta Function
Compare the results obtained from the modified chaotics operator with the expected behavior based on the Riemann zeta function.
B.5 Insights and Applications
Discuss insights gained into quantum chaos and the suitability of Montgomery dynamics in addressing the Riemann Hypothesis.
References
- [1] Rafik, Z. and Humberto Salas, A. (2024). "Chaotic dynamics and zero distribution: implications and applications in control theory for Yitang Zhang’s Landau Siegel zero theorem." Eur. Phys. J. Plus, 139, 217. DOI:
- [2] Goldston, D.A. and Montgomery, H.L. (1987). "Pair Correlation of Zeros and Primes in Short Intervals." In: Analytic Number Theory and Diophantine Problems, eds. A.C. Adolphson et al., Progress in Mathematics, 70, Birkhäuser Boston. DOI:
- [3] Editors: Banerjee, Santo and Rondoni, Lamberto (2015). Applications of Chaos and Nonlinear Dynamics in Science and Engineering - Vol. 4. Understanding Complex Systems. Springer Cham. DOI:
- [4] Jing Tang Xing (2015). Energy Flow Theory of Nonlinear Dynamical Systems with Applications. Emergence, Complexity and Computation. Springer Cham. DOI:
- [5] A. Champneys and K. Tsaneva-Atanasova (2013). "Dynamical Systems Theory, Bifurcation Analysis." In: Encyclopedia of Systems Biology, eds. W. Dubitzky et al., Springer, New York, NY. DOI:
- [6] Tomasz Kapitaniak (2000). Chaos for Engineers: Theory, Applications, and Control. Springer Berlin, Heidelberg. DOI:
- [7] Z. Elhadj and J.C. Sprott (2008). "On the robustness of chaos in dynamical systems: Theories and applications." Front. Phys. China, 3, 195–204. DOI:
- [8] F. Vivaldi (1990). "Algebraic Number Theory and Hamiltonian Chaos." In: Number Theory and Physics, eds. JM. Luck et al., Springer Proceedings in Physics, 47, Springer. DOI:
- [9] E.B. Bogomolny and B. Georgeot and M.-J. Giannoni and C. Schmit (1997). "Arithmetical Chaos." Physics Reports, 291(5–6), 219-324. DOI:
- [10] Étienne Ghys (2013). "The Lorenz Attractor, a Paradigm for Chaos." In: Chaos, eds. Bernard Duplantier et al., Progress in Mathematical Physics, 66, Birkhäuser. DOI:
- [11] Chi K. Tse (2009). "Design-Oriented Bifurcation Analysis of Power Electronics Systems." In: Applications of Nonlinear Dynamics, eds. Valentin In et al., Understanding Complex Systems, Springer. DOI:
- [12] Artur Dabrowski and Mateusz Balcerzak and Dmitry Pikunov and others (2020). "Improving efficiency of the largest Lyapunov exponent’s estimation by its determination from the vector field properties." Nonlinear Dynamics, 102, 1869–1880. DOI:
- [13] John A. Vastano and Eric J. Kostelich (1986). "Comparison of Algorithms for Determining Lyapunov Exponents from Experimental Data." In: Dimensions and Entropies in Chaotic Systems, ed. G. Mayer-Kress, Springer Series in Synergetics, 32, Springer. DOI:
- [14] Anatoliy N. Sharkovsky and Yuriy L. Maistrenko and Eugene Y. Romanenko (1993). "Periodic Trajectories." In: Difference Equations and Their Applications, Mathematics and Its Applications, 250, Springer. DOI:
- [15] Yiannis N. Moschovakis (1994). "Fixed Points." In: Notes on Set Theory, Undergraduate Texts in Mathematics, Springer. DOI:
- [16] Robert M. Gray and Joseph W. Goodman (1995). Fourier Transforms: An Introduction for Engineers. The Springer International Series in Engineering and Computer Science. Springer New York, NY. DOI:
- [17] A. Shahhosseini and MH. Tien and K. D’Souza (2023). "Poincaré Maps: A Modern Systematic Approach Toward Obtaining Effective Sections." Nonlinear Dyn, 111, 529–548. DOI:
- [18] G. Blasse and B.C. Grabmaier (1994). "Energy Transfer." In: Luminescent Materials, Springer. DOI:
- [19] Editors: Christine Schwagerl and Geza Joos (2025). Distributed Energy Resources in Active Distribution Networks. CIGRE Green Books. Springer Cham. Hardcover ISBN: 978-3-030-91366-3, eBook ISBN: 978-3-030-91367-0
- [20] Hidary, J.D. (2021). "Table of Quantum Operators and Core Circuits." In: Quantum Computing: An Applied Approach, Springer. DOI:
- [21] Lee, H. and Kim, S. (2011). "Entropy and Predictability in Dynamical Systems with Unimodal Distributions." Chaos, Solitons, and Fractals, 18(5), 1019-1031.
- [22] D.C. Sorensen (1997). "Implicitly Restarted Arnoldi/Lanczos Methods for Large Scale Eigenvalue Calculations." In: Parallel Numerical Algorithms, eds. D.E. Keyes et al., ICASE/LaRC Interdisciplinary Series in Science and Engineering, 4, Springer, Dordrecht. DOI:
- [23] Marek Wolf (2014). "Will a physicist prove the Riemann Hypothesis?" Preprint at https://arxiv.org/abs/1410.1214.