Site-percolation transition of run-and-tumble particles
Abstract
We study percolation transition of run and tumble particles (RTPs) on a two dimensional square lattice. RTPs in these models run to the nearest neighbour along their internal orientation with unit rate, and to other nearest neighbours with rates . In addition, they tumble to change their internal orientation with rate . We show that for small tumble rates, RTP-clusters created by joining occupied nearest neighbours irrespective of their orientation form a phase separated state when the rate of positional diffusion crosses a threshold; with further increase of the clusters disintegrate and another transition to a mixed phase occurs. The critical exponents of this re-entrant site-percolation transition of RTPs vary continuously along the critical line in the - plane, but a scaling function remains invariant. This function is identical to the corresponding universal scaling function of percolation transition observed in the Ising model. We also show that the critical exponents of the underlying motility induced phase separation transition are related to corresponding percolation-critical-exponents by constant multiplicative factors known from the correspondence of magnetic and percolation critical exponents of Ising model.
Active systems consume energy from the environment to produce self-propelled motion Rev1 ; C7 ; C9 ; C10 ; Bechinger2016 ; B10 and lead to nonequilibrium steady states that exhibit collective behavior at many different length scales B7 ; B6 ; B8 ; B10 ; B12 ; C59 . A specific kind of self-propelled motion performed by certain bacteria and algae A5 ; A6 are described by a run and tumble dynamics, where particles are assumed to have a sense of direction; they run persistently along their internal orientation and tumble to change their orientation C46 ; A ; cates_motility-induced_2015 . A common phenomenon unique to active matter systems is motility-induced phase separation (MIPS) where the system transit from a mixed to a phase separated state (PSS) with increased motility. It is widely believed that motile particles having only excluded volume repulsion C46 ; C47 ; C48 ; C49 ; C50 ; C51 ; C52 ; C53 ; C54 ; Kourbane-Houssene can undergo MIPS transition. A stable PSS in the absence of any attractive interaction is surprising and understanding this phenomena has been a center of attention for many researchers in recent years. Active matter systems are modeled theoretically using hydrodynamic descriptions fily_athermal_2012 ; C9 ; bialke_microscopic_2013 agent based models agent1 ; agent2 and lattice models thompson_lattice_2011 ; slowman_jamming_2016 ; mallmin_exact_2019 ; dandekar_hard_2020 ; NoMIPS_1D . In experiments too, synthetically prepared self-propelled particles Bechinger2016 ; C56 ; C58 ; Chikkadi2023 ; Chikkadi2024 are found to exhibit collective motion.
In this article, we focus on lattice models of RTPs. In one dimension (1D), RTPs with a constant tumble rate can not phase separate NoMIPS_1D . Models in 2D Golestanian ; Whitelam ; Solon_Tailleur_2015 ; Soto-2016 ; 6l do exhibit phase separation transitions. Characterization of critical behaviour and universality class of MIPS transition is limited, although recent studiesMIPS-Ising2D1 ; MIPS-Ising2D2 ; MIPS-Ising2D3 ; Ray have claimed the transition to be in Ising universality class. Here, we take a different approach. We study site-percolation properties of RTP-clusters on a square lattice, and deduce the critical behaviour of the underlying MIPS phase transition.
During a percolation transition at least one cluster starts becoming macroscopic in size at the critical point. In a particle conserved system, formation of such a macro-cluster is bound to create a low density region elsewhere. Thus a phase separation is expected along with the percolation transition. However, the critical exponents of percolation could be different from that of the MIPS transition. In fact, in context of equilibrium phase transitions, the site-percolation transition of Ising model occurs exactly at the same critical temperature where magnetic transition occurs, but their critical exponents differ Z2Perco ; Fortunato . In 2D,
| (1) |
where are exponents related to correlation length, order parameter and susceptibility respectively and subscripts stand for Ising, Percolation. Indeed percolation in Ising model form a different universality class called interacting percolation or -percolation (P) Z2Perco ; Fortunato which is different from the well known Ising universality class (IUC) in 2D.
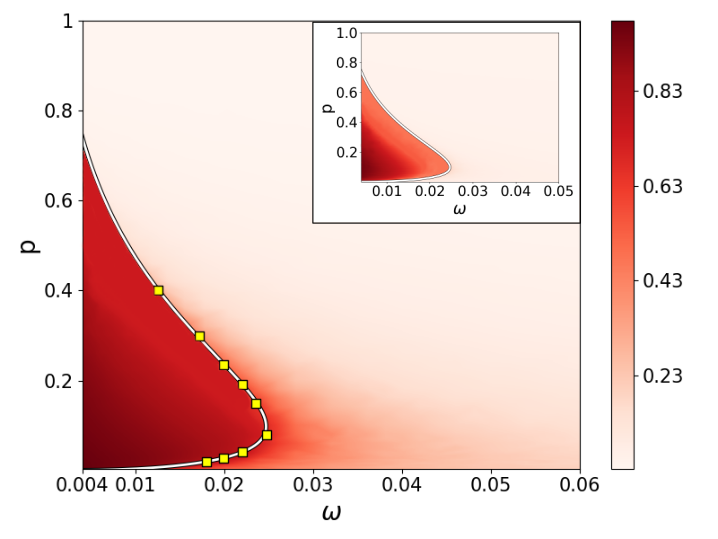
In the RTP model we study in this article, the largest-cluster exhibits a re-entrant percolation transition for small as we vary the rate of positional diffusion. A macro-cluster appears when is increased beyond a threshold, which disappears upon further increase of The density plot of the fraction of particles in largest cluster is shown in Fig. 1. A representative critical line passing through the critical points obtained from numerical simulations separates the two phases. The density plot of usual order-parameter of MIPS transition is shown in the inset of Fig. 1 along with the line which appears to differentiate naturally the PSS from the mixed one. We find that the critical exponents of the percolation transition vary continuously along the critical line (see Table 1) while a scaling function remain invariant (see Fig. 3) and matched with the universal scaling function of P. Such a scenario is formally termed as super-universality Vicari ; suh . Thus, the site-percolation critical behaviour of RTPs form a super-universality class of -percolation. We also find that the critical exponents of the underlying MIPS-phase transition are related to respective exponents of percolation through Eq. 1 and form a superuniversality class of Ising model.
The model: We consider run and tumble particles on a square lattice with periodic boundary conditions in both directions, where sites labeled by with carry an occupation index representing vacant and occupied sites respectively. Each site can be occupied by at most one particle respecting hard-core or excluded volume repulsion, and thus The particles are labeled by and each one carry an internal orientation which represents a unit vector pointing to one of the four neighbouring sites. The RTPs are allowed to move (run) to the neighbour along their internal orientation with unit rate, and to other three directions with rates Runs along directions other than the particle’s own internal orientation adds positional diffusion to the problem, which is essential for having a stable MIPS phase Whitelam ; Ray . They can also tumble with rate by rotating by and choose a new orientation.
The dynamics of this RTP model is controlled by two parameters: the rate of positional diffusion () and tumble rate (). Earlier numerical simulations Golestanian ; Whitelam ; Ray have suggested that MIPS transition is not possible in absence of positional diffusion, i.e., when , because RTPs cannot escape form micro-clusters. Again, for the model reduces to a system of non-interacting hardcore particles which move in all four directions with the same rate and thus the system remains homogeneously mixed for any . Absence of an ordered state at and necessarily indicate that a phase separation transition expected for small must be re-entrant in the sense that a PSS must appear as is increased and it disappears with further increase of which is evident from Fig. 1.
Now we describe, how the critical points and the critical exponents are calculated from numerical simulations. Any configuration of RTPs can be viewed as collection of -clusters, indexed as each containing number of particles, so that The clusters are formed similar to those in site-percolation problem Stauffer ; book:Stauffer where two occupied nearest neighbours belong to the same cluster irrespective of their internal orientations. In a mixed state, RTPs are expected to form small clusters whereas in the PSS, there must be at least one macro-size cluster containing a finite-fraction of the total particles. Let be the number of particles in the largest cluster. Depending on the density it may or may not span the lattice but its presence in the PSS helps us defining the percolation order parameter and susceptibility
| (2) |
where denotes the steady state average. Note that the same definitions of and are used in ordinary percolationStauffer and site-percolation in Ising and Potts models Fortunato .
From the Monte Carlo simulations of the system at density we measure and the Binder-cumulant
| (3) |
for different and These calculations are repeated for different system sizes and the critical exponents are determined from the finite size scaling analysis FSS1 ; FSS2 ; FSS3 described below.
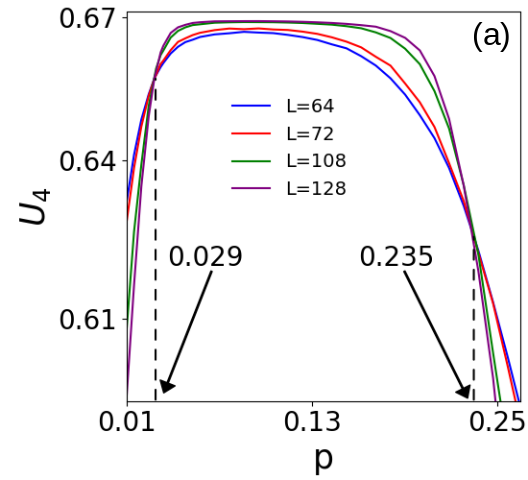
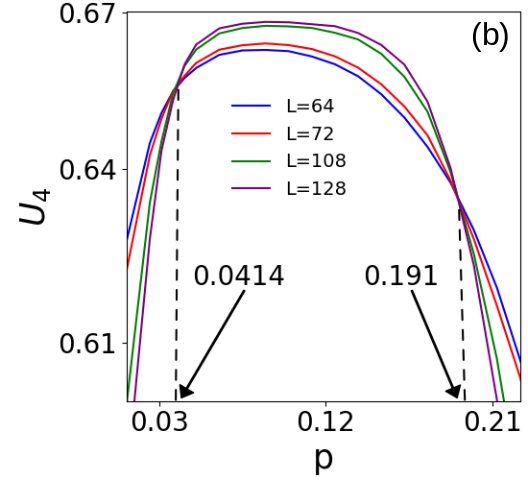
Binder cumulant is independent of the system size Binder1 ; Binder2 and thus, the intersection point of versus (or ) curves for different provide an estimates of (or Figure 2 describes this for . In both cases, versus curves show two intersection points indicating a re-entrant transition. In Fig. 2(a) transition from a mixed phase to PSS occurs at and PPS to a mixed phase occurs again at at For the transitions occur at and respectively. Other estimated values of are listed in Table 1.
| Sl. No. | |||||
|---|---|---|---|---|---|
| I | 0.235 | 0.020(0) | 1.43 | 0.14(2) | 1.72(5) |
| II | 0.150 | 0.023(5) | 1.26 | 0.10(1) | 1.75(3) |
| III | 0.080 | 0.024(7) | 1.22 | 0.09(2) | 1.82(4) |
| IV | 0.0290 | 0.020(0) | 1.13 | 0.06(6) | 1.86(8) |
| V | 0.0275 | 0.019(8) | 1.11 | 0.06(5) | 1.87(2) |
| VI | 0.020 | 0.018(0) | 1.10 | 0.05(5) | 1.89(5) |
| P Z2Perco | - | - | 1 | 0.052 | 1.896 |
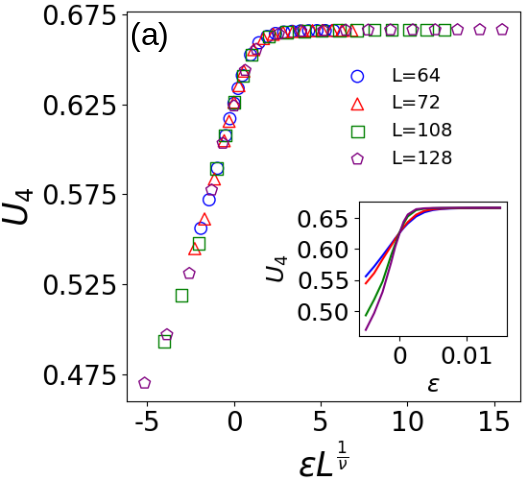
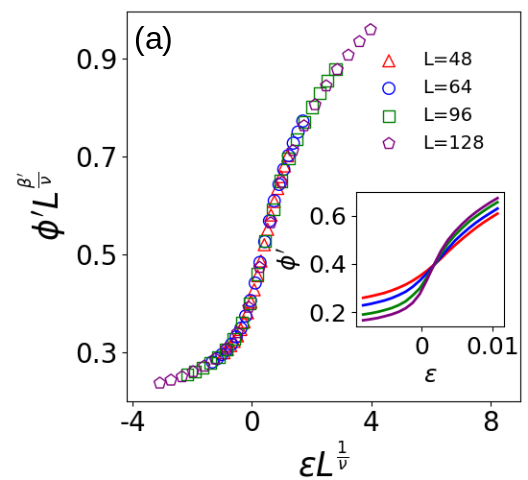
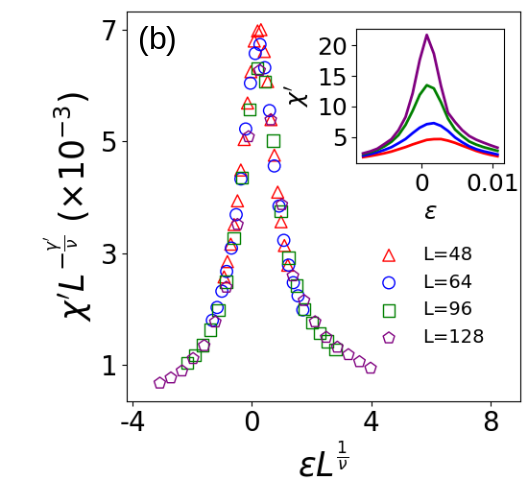
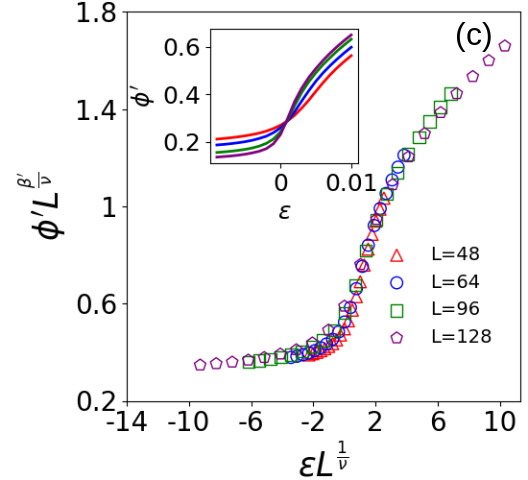
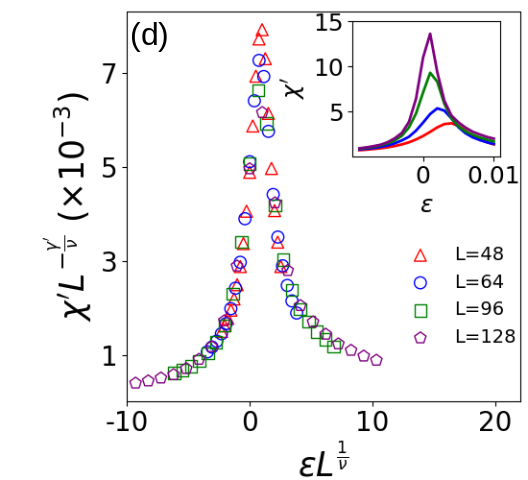
Now we vary one of the parameters about the critical value and calculate for different using Monte Carlo simulations. Using their finite size scaling properties FSS1 ; FSS2 ; FSS3 ,
| (4) |
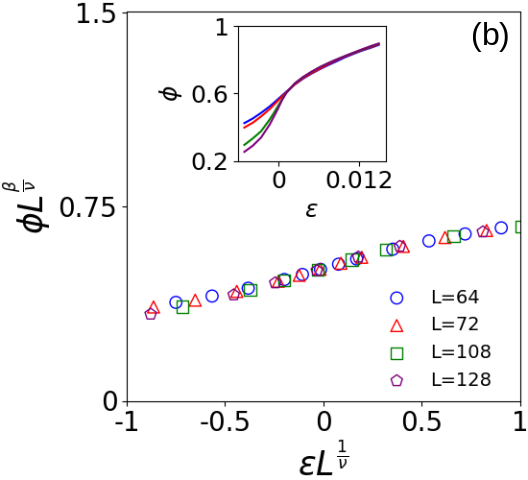
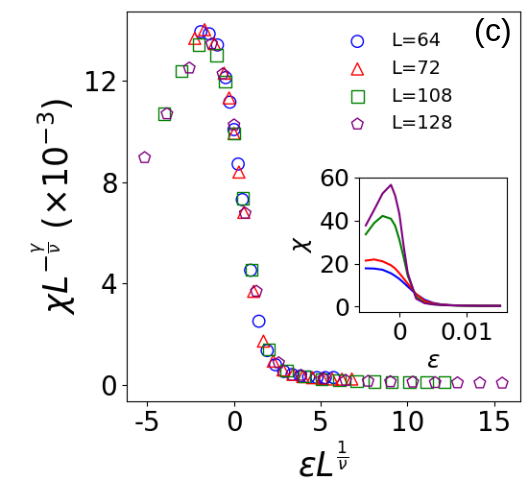
where is a measure of distance from the critical point and are universal scaling functions, we obtain the exponent ratios and as the fitting parameters that result in the best scaling collapse. The estimated critical exponents are listed in Table 1. For demonstration, we choose and vary to calculate for different A plot of and as a function of the dimensionless parameter are shown in Fig. 3(a),(b),(c) respectively. The value of that resulted in best collapse of in Fig. 3(a) is used in Figs. 3(b) and (c) to obtain the best collapse for by tuning and respectively. The estimated values are and
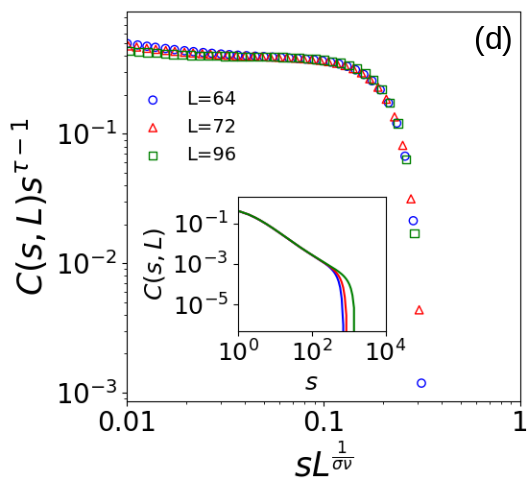
To study the cluster properties of RTPs we notice that in the near-critical regime, the distribution of finite clusters follow a scaling relation where exponents and obey scaling relations Stauffer ,
| (5) |
In finite systems, the correlation length is limited by , resulting in Thus, the probability of finding clusters of size or more is
| (6) |
From the Monte Carlo simulations we obtain at the critical point I for different and plot as a function of in Fig. 3(d). We use and calculated from Eq. (5) and Table 1. A good collapse observed here assures that the critical exponents obey the known scaling relations of percolation phenomena Stauffer . The critical exponents for the other critical points II to VI in Table 1 are calculated in a similar way, and described in Ref. sup .
Continuous variation: The critical exponents listed in Table 1 vary continuously along the critical line. In each case, however, the scaling relation with is satisfied. We have also checked (data not given) that, within the error limits, independent estimate of exponents satisfy the scaling relations (5). It turns out that the numerical value of the exponents for small (say, critical point VI) is very close to the exact values known for - percolation transition (P in Table 1) observed in Ising model Z2Perco ; Fortunato . It raises a question if the continuous variation observed here is anyway related to the universality class of P.
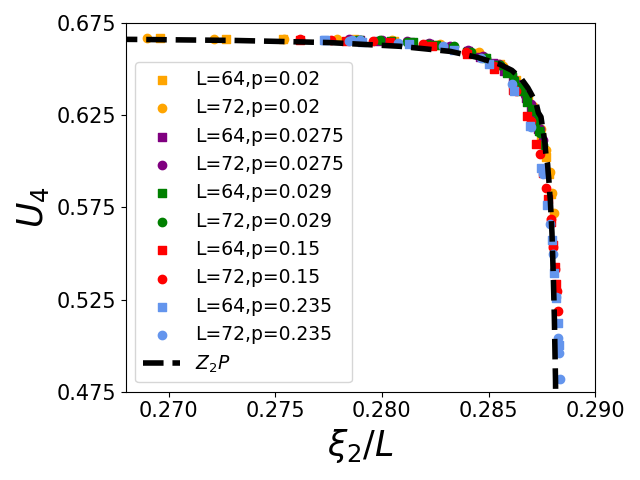
In fact, recently it was observed Vicari ; suh that critical phenomena with continuously varying exponents form a super-universality class in the sense that certain scaling function remain invariant along the critical line and they match with that of the ordinary universality class. One such RG-invariant scaling function is which relates the Binder cumulant with second-moment correlation length ,
| (7) |
For RTPs we obtain and as functions of using Monte Carlo simulations, for different The plots of vs. for many different values plotted in Fig. 4 fall on a universal function which is no different from the same obtained for P universality class (dashed line). We conclude that the percolation transition of RTPs belong to the super-universality class of -percolation. Then it is suggestive, following Eq. (1), that the MIPS transition may have critical exponents
To verify, we consider a rectangular system with and study phase separation transition about the critical points I and III in Table 1 using an order parameter similar to one discussed in Refs. Ray ; Mx2-My2 ; Albano ,
| (8) |
where is the total number of particles at lattice sites with the same -coordinate. From Monte Carlo simulation of the model we calculate and as a function of keeping fixed. The plots in Fig. 5 shows that the data for different values collapse following the finite size scaling,
| (9) |
when we use with taken from Table 1. Note that critical points of the MIPS transition are taken to be same as the corresponding percolation transition because it is evident from the density plot of in the inset of Fig. 8 that the percolation critical line naturally separates the mixed state from the PSS. Thus, the MIPS transition of RTPs in - plane lead to continuous variation of the critical exponents obeying the scaling relation Thus, we believe that the MIPS transition of RTPs in 2D belong to Ising superuniversality class. Note that as the critical exponents of MIPS transition approach the Ising exponents following Eq. (1). This result is consistent with the Ising critical behavior reported in RTP models studied earlier for small MIPS-Ising2D1 ; MIPS-Ising2D2 ; MIPS-Ising2D3 .
In conclusion, we study percolation transition of run and tumble particles on a square lattice, where clusters are formed by joining occupied nearest neighbours irrespective of their internal orientation. We find that the system with a small tumbling rate undergoes a re-entrant percolation transition when rate of positional diffusion is increased. The transition belongs to the super-universality class of percolation: all critical exponents of the transition vary continuously along the critical line in - plane but a scaling function remains invariant. Thus the percolation transition belongs to the superuniversality class of P. Since any phase separated state must contain at least one macro cluster, motility induced phase separation transition of RTPs must occur at the critical point of percolation-transition, and it does. The critical exponents, however, differ and they are related to percolation exponents by a constant multiplicative factor, known from the relation of Ising model and percolation.
References
- (1) S. Ramaswamy, Annu. Rev. Cond. Mat. Phys., 1, 323 (2010), \doi10.1146/annurev-conmatphys-070909-104101.
- (2) M. E. Cates, Rep. Prog. Phys. 75, 042601 (2012), \doi10.1088/0034-4885/75/4/042601.
- (3) M. C. Marchetti, J.F. Joanny, S. Ramaswamy, T. B. Liverpool, J. Prost, M. Rao, R. A. Simha, Rev. Mod. Phys. 85 1143 (2013), \doi10.1103/RevModPhys.85.1143.
- (4) G. de Magistris, D. Marenduzzo, Physica A 418, 65 (2015), \doi10.1016/j.physa.2014.06.061.
- (5) C. Bechinger, R. D. Leonardo, H. Löwen, C. Reichhardt, G. Volpe, G. Volpe, Rev. Mod. Phys. 88, 045006 (2016) \doi10.1103/RevModPhys.88.045006.
- (6) R. Alert and X. Trepat, Annu. Rev. Condens. Matter Phys. 11, 77 (2020), \doi10.1146/annurev-conmatphys-031218-013516.
- (7) M. Ballerini, N. Cabibbo, R. Candelier, A. Cavagna, E. Cisbani, I. Giardina, V. Lecomte, A. Orlandi, G. Parisi, A. Procaccini et al., Proc. Natl. Acad. Sci. U.S.A. 105, 1232 (2008)., \doi10.1073/pnas.0711437105.
- (8) A. J. Ward, D. J. Sumpter, I. D. Couzin, P. J. Hart, and J. Krause, Proc. Natl. Acad. Sci. 105, 6948 (2008), \doi10.1073/pnas.071034410.
- (9) A. Cavagna, D. Conti, C. Creato, L. Del Castello, I. Giardina, T. S. Grigera, S. Melillo, L. Parisi, and M. Viale, Nat. Phys. 13, 914 (2017), \doi10.1038/nphys4153.
- (10) A. Be’er, B. Ilkanaiv, R. Gross, D. B. Kearns, S. Heidenreich, M. Bär, and G. Ariel, Commun. Phys. 3, 66 (2020), \doi10.1038/s42005-020-0327-1.
- (11) F. Peruani, J. Starruss, V. Jakovljevic, L. Sogaard-Andersen, A. Deutsch, M. Bär, Phys. Rev. Lett. 108, 098102 (2012), \doi10.1103/PhysRevLett.108.098102.
- (12) H. C. Berg, E. coli in Motion, Springer, NY (2004), \doi10.1007/b97370.
- (13) M. Polin, I. Tuval, K. Drescher, J. P. Gollub, and R. E. Goldstein, Science, 325, 487, (2009), \doi10.1126/science.1172667.
- (14) J. Tailleur, M.E. Cates, Phys. Rev. Lett. 100, 218103 (2008), \doi10.1103/PhysRevLett.100.218103.
- (15) M. E. Cates and J. Tailleur, Europhys. Lett. 101 20010 (2013), \doi10.1209/0295-5075/101/20010
- (16) M. E. Cates and J. Tailleur, Annu. Rev. Cond. Mat. Phys., 6, 219 (2015), \doi10.1146/annurev-conmatphys-031214-014710.
- (17) Y. Fily, M.C. Marchetti, Phys. Rev. Lett. 108, 235702 (2012), \doi10.1103/PhysRevLett.108.235702.
- (18) Y. Fily, S. Henkes, M.C. Marchetti, Soft Matter 10, 2132 (2014) \doi10.1039/C3SM52469H.
- (19) G. S. Redner, M. F. Hagan and A. Baskaran, Phys. Rev. Lett. 110, 055701 (2013), \doi10.1103/PhysRevLett.110.055701.
- (20) J. Stenhammar, A. Tiribocchi, R.J. Allen, D. Marenduzzo, M.E. Cates, Phys. Rev. Lett. 111, 145702 (2013), \doi10.1103/PhysRevLett.111.145702.
- (21) G. Gonnella, A. Lamura, A. Suma, Int. J. Mod. Phys. C 25, 1441004 (2014), \doi10.1142/S0129183114410046.
- (22) A. Suma, D. Marenduzzo, G. Gonnella, E. Orlandini, Europhys. Lett. 108, 56004 (2014), \doi10.1209/0295-5075/108/56004.
- (23) D. Levis, L. Berthier, Phys. Rev. E 89, 062301 (2014), \doi10.1103/PhysRevE.89.062301.
- (24) R. Wittkowski, A. Tiribocchi, J. Stenhammar, R. Allen, D. Marenduzzo, M. Cates, Nat. Commun. 5, 4351 (2014), \doi10.1038/ncomms5351.
- (25) M. Kourbane-Houssene, C. Erignoux, T. Bodineau, and J. Tailleur, Phys. Rev. Lett. 120, 268003 (2018), \doi10.1103/PhysRevLett.120.268003.
- (26) Y. Fily and M. C. Marchetti, Phys. Rev. Lett. 108, 235702 (2012), \doi10.1103/PhysRevLett.108.235702.
- (27) J. Bialkè1, H. Löwen1 and T. Speck, Eurohys. Lett. 103, 30008 (2013), \doi10.1209/0295-5075/103/30008.
- (28) F. SchweitzerEur. J. Phys. 40, 014003 (2019).
- (29) A. Ziepke, I. Maryshev, I. S. Aranson, and E. Frey, Nat. Commun. 13, 6727 (2022), \doi10.1038/s41467-022-34484-2
- (30) A. G. Thompson, J. Tailleur, M. E. Cates, and R. A. Blythe, J. Stat. Mech., P02029 (2011), \doi10.1088/1742-5468/2011/02/P02029.
- (31) A. B. Slowman, M. R. Evans, and R. A. Blythe, Phys. Rev. Lett. 116, 218101 (2016), \doi10.1103/PhysRevLett.116.218101.
- (32) E. Mallmin, R. A. Blythe, and M. R. Evans, J. Stat. Mech., 013204 (2019), \doi10.1088/1742-5468/aaf631.
- (33) R. Dandekar, S. Chakraborti, and R. Rajesh, Phys. Rev. E 102, 062111 (2020), \doi10.1103/PhysRevE.102.062111.
- (34) I. Mukherjee, A. Raghu, P. K. Mohanty, SciPost Phys. 14, 165 (2023), \doi10.21468/SciPostPhys.14.6.165.
- (35) J. Palacci, B. Abecassis, C. Cottin-Bizonne, C. Ybert, and L. Bocque, Phys. Rev. Lett. 104, 138302 (2010), \doi10.1103/PhysRevLett.104.138302.
- (36) J. Palacci, S. Sacanna, S.-H. Kim, G.-R. Yi, D. J. Pine and P. M. Chaikin, Phil. Trans. R. Soc. A 372, 20130372 (2014), \doi10.1098/rsta.2013.0372.
- (37) P. Kushwaha, V. Semwal, S. Maity, S. Mishra, and V. Chikkadi Phys. Rev. E 108, 034603 (2023) \doi10.1103/PhysRevE.108.034603.
- (38) P. Kushwaha, S. Maitya, A. Menon, R. Chelakkot and V. Chikkadi, Soft Matter (2024), \doi10.1039/D4SM00305E.
- (39) R. Soto and R. Golestanian, Phys. Rev. E 89, 012706 (2014), \doi10.1103/PhysRevE.89.012706.
- (40) S. Whitelam, K. Klymko, D. Mandal, J. Chem. Phys. 148, 154902 (2018), \doi10.1063/1.5023403.
- (41) A. P. Solon and J. Tailleur Phys. Rev. E 92, 042119 (2015).
- (42) N. Sepúlveda and R. Soto, Phys. Rev. E 94, 022603 (2016), \doi10.1103/PhysRevE.94.022603.
- (43) J. T. Siebert, F. Dittrich, F. Schmid, K. Binder, T. Speck, and P. Virnau, Phys. Rev. E 98, 030601(R) (2018), \doi10.1103/PhysRevE.98.030601.
- (44) B. Partridge and C. F. Lee, Phys. Rev. Lett. 123, 068002 (2019), \doi10.1103/PhysRevLett.123.068002.
- (45) C. Maggi, M. Paoluzzi, A. Crisanti, E. Zaccarelli, and N. Gnan, Soft Matter 17, 38072021 (2021), \doi10.1039/D0SM02162H.
- (46) F. Dittrich, T. Speck and P. Virnau, Eur. Phys. J. E 44, 53 (2021), \doi10.1140/epje/s10189-021-00058-1.
- (47) C. G. Ray, I. Mukherjee, P. K. Mohanty, arXiv:2307.03216 \doi10.48550/arXiv.2307.03216
- (48) S. Fortunato, Phys. Rev. B 66, 054107(2002).
- (49) A. L. Stella and C. Vanderzande, Phys. Rev. Lett. 62, 1067 (1989) \doi10.1103/PhysRevLett.62.1067
- (50) C. Bonati, A. Pelissetto, and E. Vicari, Phys. Rev. Lett. 123, 232002 (2019), \doi10.1103/PhysRevLett.123.232002.
- (51) I. Mukherjee, P. K. Mohanty Phys. Rev. B 108, 174417 (2023)\doi10.1103/PhysRevB.108.174417
- (52) D. Stauffer, Phys. Rep. 54, 1 (1979).
- (53) D. Stauffer and A.Aharony, Introduction To Percolation Theory, 2nd ed., Taylor & Francis Ltd., India (1994).
- (54) K. Binder, D. W. Heermann, Monte Carlo Simulation in Statistical Physics (5th Ed.) Springer Berlin, 2010.
- (55) K. Binder, Phys. Rev. Lett. 47, 693 (1981), \doi10.1103/PhysRevLett.47.693.
- (56) V. Privman (ed.), Finite-Size Scaling and Numerical Simulations of Statistical Systems, World Scientific, Singapore, 1990.
- (57) D. P. Landau and K. Binder, A Guide to Monte Carlo Simulations in Statistical Physics (Cambridge University Press, Cambridge, UK, 2014).
- (58) E. Luijten, M. E. Fisher, and A. Z. Panagiotopoulos, Phys. Rev. Lett. 88, 185701 (2002), \doi10.1103/PhysRevLett.88.185701.
- (59) See the Supplemental Materials for details of the simulation and additional results in support of our claims.
- (60) J. Marro, J. L. Vallés, and J. M. González-Miranda, Phys. Rev. B 35, 3372 (1987), \doi10.1103/PhysRevB.35.3372.
- (61) E. V. Albano and G. Saracco, Phys. Rev. Lett. 88, 145701 (2002), \doi10.1103/PhysRevLett.88.145701
- (62) J. Ashkin and E. Teller, Phys. Rev. 64, 178 (1943).