1–1–1 Tennodai, Tsukuba-shi, 305–8573, Ibaraki, Japan 11email: yanagi.tomoya.ta@alumni.tsukuba.ac.jp
22institutetext: Graduate School of Science and Technology, University of Tsukuba,
1–1–1 Tennodai, Tsukuba-shi, 305–8573, Ibaraki, Japan
22email: ikeda.shunnosuke@gmail.com
33institutetext: Institute of Systems and Information Engineering, University of Tsukuba,
1–1–1 Tennodai, Tsukuba-shi, 305–8573, Ibaraki, Japan
33email: ytakano@sk.tsukuba.ac.jp
Robust portfolio optimization for recommender systems considering uncertainty of estimated statistics
Abstract
This paper is concerned with portfolio optimization models for creating high-quality lists of recommended items to balance the accuracy and diversity of recommendations. However, the statistics (i.e., expectation and covariance of ratings) required for mean–variance portfolio optimization are subject to inevitable estimation errors. To remedy this situation, we focus on robust optimization techniques that derive reliable solutions to uncertain optimization problems. Specifically, we propose a robust portfolio optimization model that copes with the uncertainty of estimated statistics based on the cardinality-based uncertainty sets. This robust portfolio optimization model can be reduced to a mixed-integer linear optimization problem, which can be solved exactly using mathematical optimization solvers. Experimental results using two publicly available rating datasets demonstrate that our method can improve not only the recommendation accuracy but also the diversity of recommendations compared with conventional mean–variance portfolio optimization models. Notably, our method has the potential to improve the recommendation quality of various rating prediction algorithms.
Keywords:
Recommender system Portfolio optimization Robust optimization Diversity.1 Introduction
1.1 Background
Recent advances in information and communication technologies have enabled consumers to browse and purchase a wide variety of items through online services. Meanwhile, consumers often struggle to find items that match their preferences among a plethora of options. To overcome this information overload problem, recommender systems [1, 2] have been widely implemented in online services. These systems generate personalized lists of unknown but potentially preferred items. In fact, integrating these systems into online platforms simplifies the search process and improves user experience [24].
Much of the research to date has focused on improving the prediction accuracy of recommender systems [5, 17]. To this end, a variety of rating prediction algorithms have been proposed, ranging from traditional methods such as collaborative filtering [29] and matrix factorization [21] to recent deep learning techniques [12, 38].
In contrast, it has been pointed out that the most accurate recommendations do not always satisfy users [25]. Specifically, favorable recommendations must take into account the diversity and novelty of items provided for users [8, 18]. However, most recommender systems tend to offer popular items, leading to reduced diversity. Increasing the diversity and novelty of recommendations remains a major challenge in the advancement of recommender systems.
1.2 Related work
Prior studies have developed various algorithms to improve recommendation diversity [8, 22, 26]. In particular, we explore applying financial portfolio theory [11] to recommender systems, aiming to balance the accuracy and diversity of recommendations.
Mean–variance portfolio analysis has been applied to ranking systems in information retrieval and collaborative filtering [31, 32]. Shi et al. [28] improved this ranking strategy by using the latent factor model for user ratings. Kwon [23] focused on the variance of ratings to increase the precision of top- recommendations. Zhang and Hurley [37] and Hurley and Zhang [15] formulated several optimization models for selecting a list of diverse items. Xiao et al. [34] used a portfolio optimization model to recommend relevant services based on service risk facets. Yasumoto and Takano [36] developed shrinkage estimation methods to improve the accuracy of estimating the rating covariance matrix.
These studies have shown that the quality of recommendation lists can be improved by applying portfolio optimization. However, the statistics (i.e., expectation and covariance of ratings) required for mean–variance portfolio optimization are subject to inevitable estimation errors. In fact, it has been pointed out that the mean–variance portfolio optimization model often performs badly because of such estimation errors [7].
To remedy this situation, we focus on robust optimization techniques [3, 19] that derive reliable solutions to uncertain optimization problems. To the best of our knowledge, none of the prior studies have considered recommender systems that incorporate uncertainty of estimated statistics to select high-quality lists of recommendations.
1.3 Our contribution
The goal of this paper is to improve the recommendation quality of portfolio optimization models by using robust optimization techniques. Specifically, we propose a robust portfolio optimization model that copes with the uncertainty of estimated statistics based on the cardinality-based uncertainty sets [4]. Our robust portfolio optimization model can be reduced to a mixed-integer linear optimization problem, which can be solved exactly using mathematical optimization solvers.
To verify the effectiveness of our method for recommendation, we conducted numerical experiments using two publicly available rating datasets. Experimental results demonstrate that our method can improve not only the recommendation accuracy but also the diversity of recommendations compared with conventional mean–variance portfolio optimization models. This emphasizes that by properly handling the uncertainty in the expectation and covariance of user ratings, we can generate high-quality lists of recommendations that fulfill users’ diverse requirements. Moreover, our method has the potential to improve the recommendation quality of various rating prediction algorithms.
2 Mean–variance portfolio optimization model
In this section, we outline the mean–variance portfolio optimization model [36], which is a combination of mean–variance portfolio analysis [31, 32] and the cardinality-constrained optimization model [15, 37] for recommendation.
Let and denote the sets of users and items, respectively. The rating matrix is then defined as
where denotes the rating indicated by user to item . Note that this matrix contains many missing entries because each user rates only a small subset of items. We denote by the subset of user–item pairs for which ratings have been observed. Recommender systems involve predicting unknown ratings for user–item pairs and then suggesting items that are likely to be favored by each user.
Let be a vector composed of binary design variables for selecting items to be recommended, where indicates that item is recommended for a target user. We define as the expected rating of user for item ; this value can be estimated using rating prediction algorithms (e.g., collaborative filtering [29], matrix factorization [21], and deep learning techniques [12, 38]). We also define as the rating covariance for a pair of items; this value can be calculated from users’ ratings observed for both items . Shrinkage estimation methods were also developed to improve the accuracy of estimating the rating covariance matrix [36].
For each user , we denote by a total rating function, which is the sum of ratings for recommended items. The expectation and variance of the total rating can be estimated as follows:
| (1) |
Let be a set of candidate items to be recommended for user . For each target user , the mean–variance portfolio optimization model for selecting recommended items is formulated as the following binary optimization problem:
| (2) | ||||
| subject to | (3) | |||
| (4) |
where is a hyperparameter for adjusting the mean–variance trade-off. The objective function (Eq. (2)) is the weighted sum of two objectives (Eq. (1)). Eq. (3) specifies the number of recommended items, and Eq. (4) imposes the binary constraint on each entry of for selecting recommendations.
3 Robust portfolio optimization model
In this section, we propose a robust portfolio optimization model for recommendation by incorporating the cardinality-based uncertainty sets [4] into the mean–variance model (Eqs. (2)–(4)).
Specifically, for each we consider the following ranges of variation in the expectation and covariance of ratings:
where and are the magnitudes of variation in the expectation and covariance, respectively.
Let and denote subsets of items and item pairs that are accompanied by variation in the expectation and covariance, respectively. For each target user , we consider minimizing the objective function (Eq. (2)) in the worst case as follows:
| (5) | ||||
| subject to | (6) |
where are integer-valued parameters for limiting the cardinality of and .
We are now in a position to derive our formulation of the robust portfolio optimization model for recommendation.
Theorem 3.1
Proof
The latter inner maximization problem in Eq. (5) can be rewritten as
| (12) | ||||
| subject to | (13) | |||
| (14) |
where is an auxiliary design variable serving as the subset . Similarly, the former inner maximization problem in Eq. (5) can be rewritten as
| (15) | ||||
| subject to | (16) | |||
| (17) |
where is an auxiliary design variable serving as the subset .
Although there are bilinear terms (i.e., ) of binary design variables in Eqs. (7) and (10), they can be linearized using well-known reformulation techniques [33]. As a result, problem (Eqs. (7)–(11)) can be reduced to a mixed-integer linear optimization problem. Note also that Gurobi, which is the commercial optimization solver used in our experiments, is capable of directly solving problem (Eqs. (7)–(11)).
4 Experiments
In this section, we evaluate the effectiveness of our robust portfolio optimization method for recommendation through numerical experiments.
4.1 Datasets
We used two publicly available datasets of user ratings, the MovieLens 100K111https://grouplens.org/datasets/movielens/100k/ and Yahoo! R3222https://webscope.sandbox.yahoo.com/ (Yahoo! music ratings for user selected and randomly selected songs, v. 1.0) datasets, commonly employed to evaluate recommender systems.
The MovieLens 100K dataset contains 100,000 ratings by 943 users on 1,682 movies on a scale of 1 to 5. Since some users provided only a few ratings, we selected 568 users who rated at least 50 movies. Each user’s ratings were randomly split into training (60%) and testing (40%) sets, and the results were averaged over five random splits.
The Yahoo! R3 dataset is pre-divided into training and testing sets, which contain 15,400 and 5,400 users, respectively. Each user rated 1,000 different songs on a scale of 1 to 5, and the testing set contained 10 ratings per user. We extracted ratings from the 5,400 users included in both the training and testing sets.
4.2 Experimental setup
For rating prediction, we implemented the singular value decomposition method using the Python Surprise library333http://surpriselib.com/ [14]. Here, we set the number of factors to 100, the learning rate to 0.01, and the regularization weight to 0.1. The root mean square error (RMSE) for rating prediction was 0.92 and 1.42 on the MovieLens 100K and Yahoo! R3 testing datasets, respectively. This indicates the prediction accuracy was lower for the Yahoo! R3 dataset than for the MovieLens 100K dataset.
For each user , the candidate item set was composed of the items rated by the user in the corresponding testing set. The number of recommended items was set to for the MovieLens 100K dataset and for the Yahoo! R3 dataset. We set as the hyperparameter for adjusting the mean–variance tradeoff. We performed shrinkage estimation of rating covariance matrices as
where is the sample covariance matrix, and is the matrix-completion-based target matrix; see Yasumoto and Takano [36] for details.
We solved the portfolio optimization problem (Eqs. (7)–(11)) using the Gurobi Optimizer444https://www.gurobi.com/, with a maximum computation time of 3 seconds. We set the ranges of variation in the expectation and covariance of ratings as
where is the number of users who rated item , and is the number of users who rated both items .
4.3 Evaluation Metrics
To evaluate both the accuracy and diversity of recommendations, we used the following evaluation metrics [27]:
-
•
F1 score: average F1 score of recommendations across all users;
-
•
Gini coefficient: Gini coefficient of the number of times each item was recommended.
The F1 score was employed to measure the recommendation accuracy based on the intersection of recommended and highly rated items. Here, highly rated items were defined as items with a rating of 4 or higher in the MovieLens 100K dataset and a rating of 3 or higher in the Yahoo! R3 dataset. The higher the F1 score, the more accurate the recommendations.
The Gini coefficient was employed to measure the inequality in the number of recommendations among items. The lower the Gini coefficient, the more diverse the recommendations.
4.4 Results for the MovieLens 100K dataset
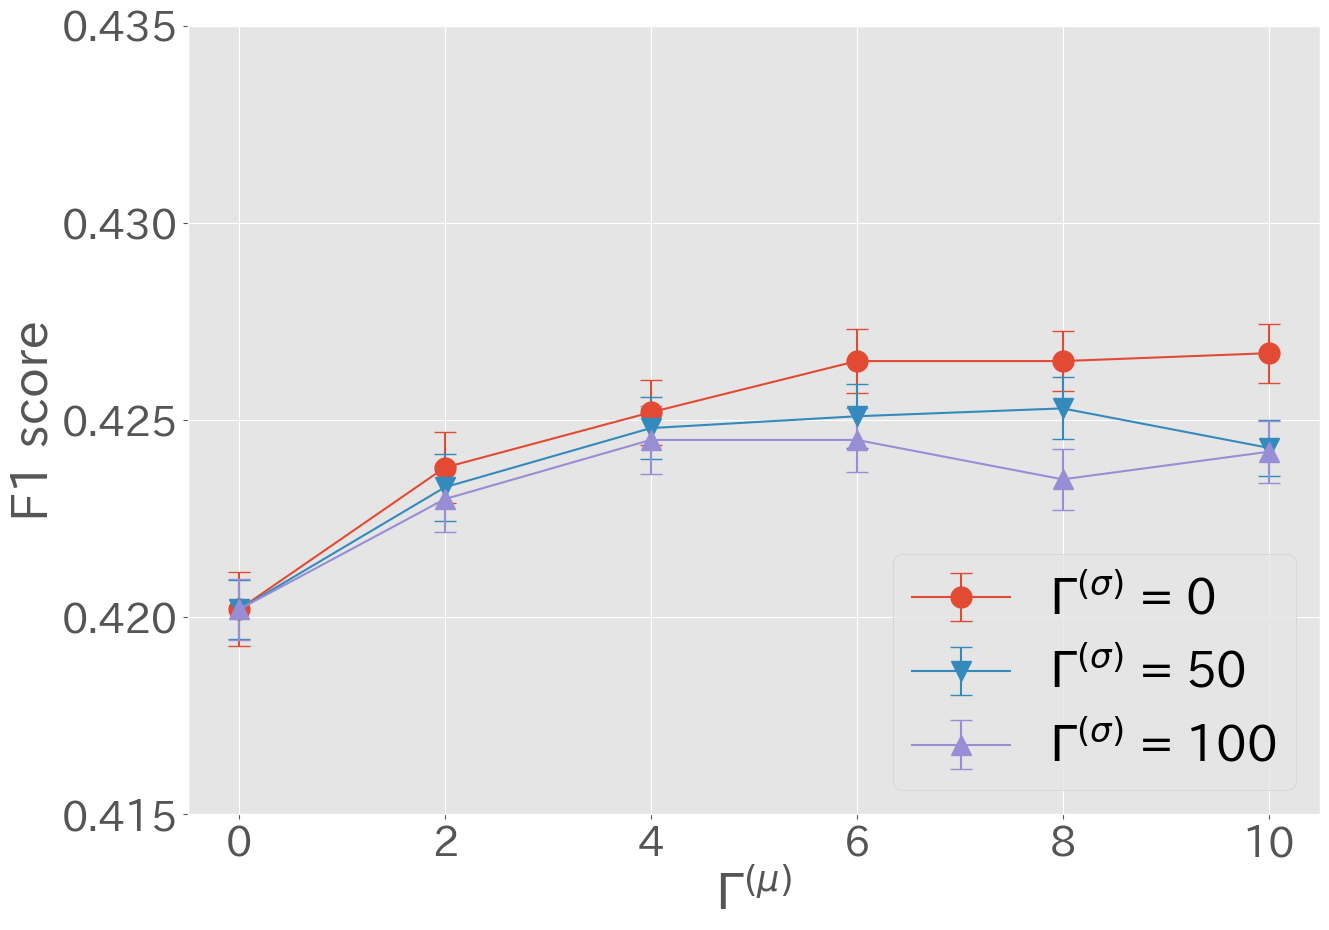
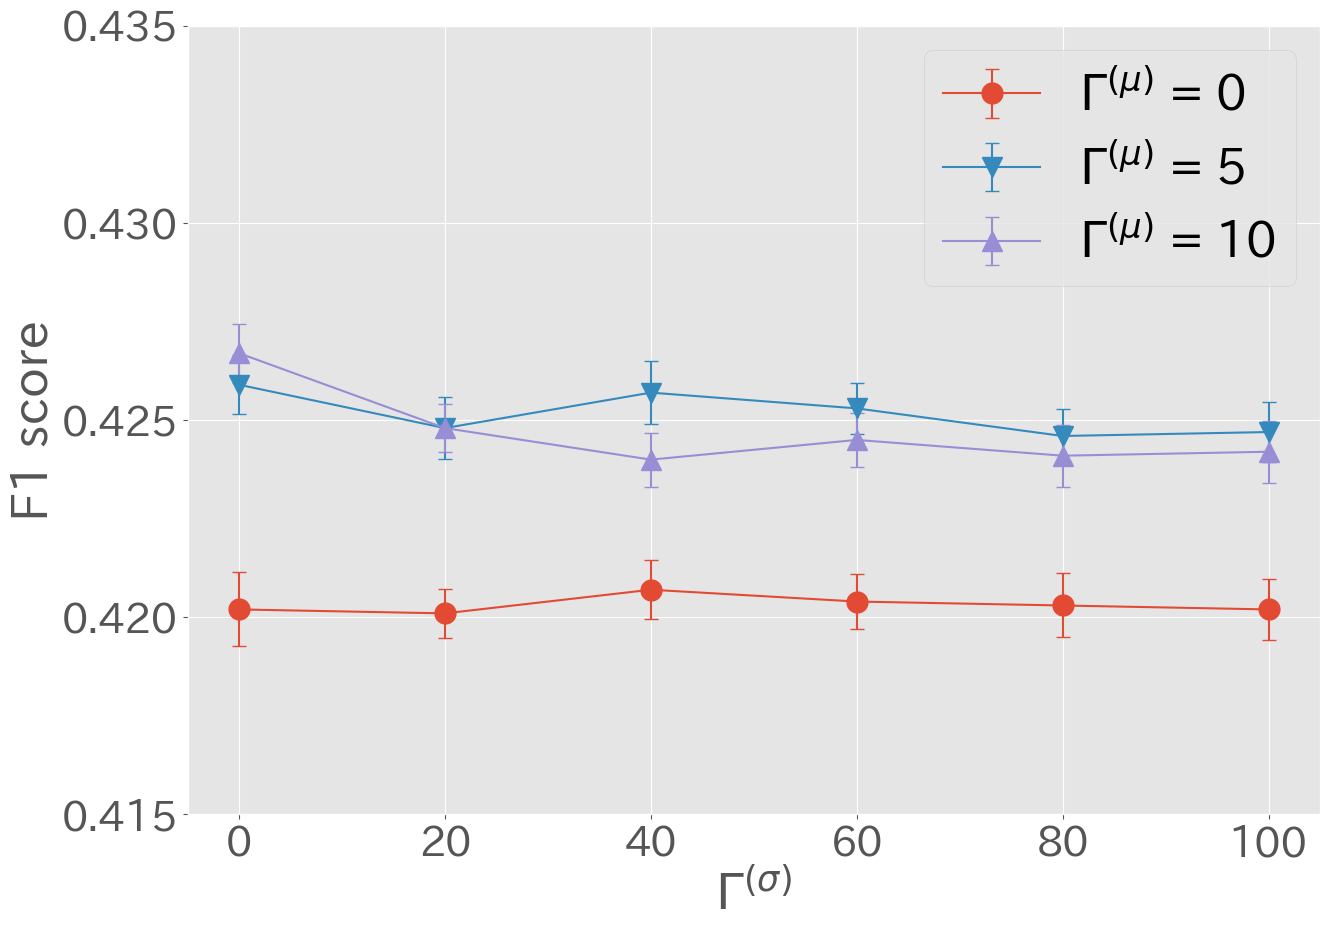
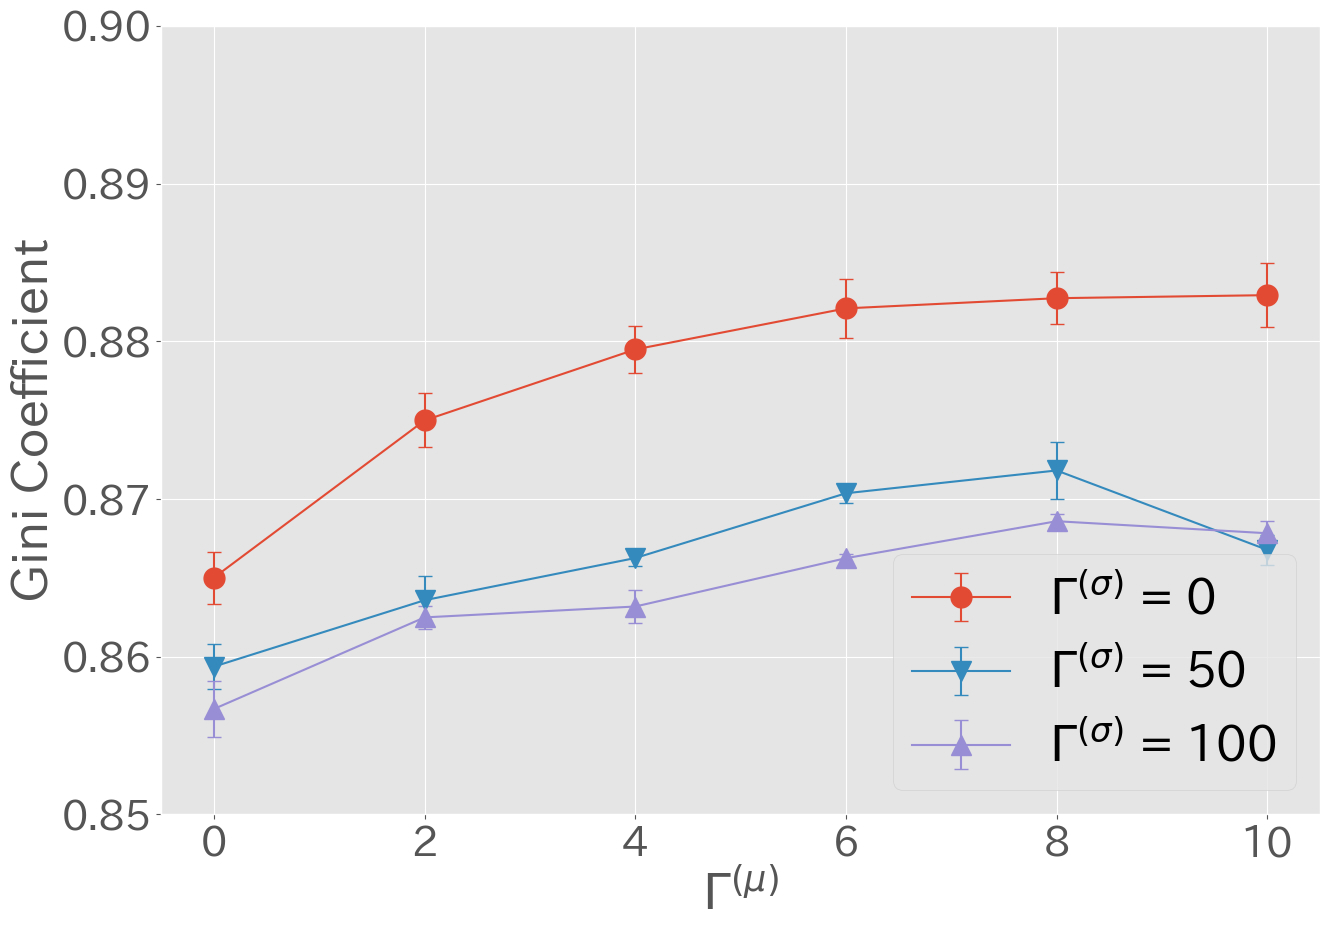
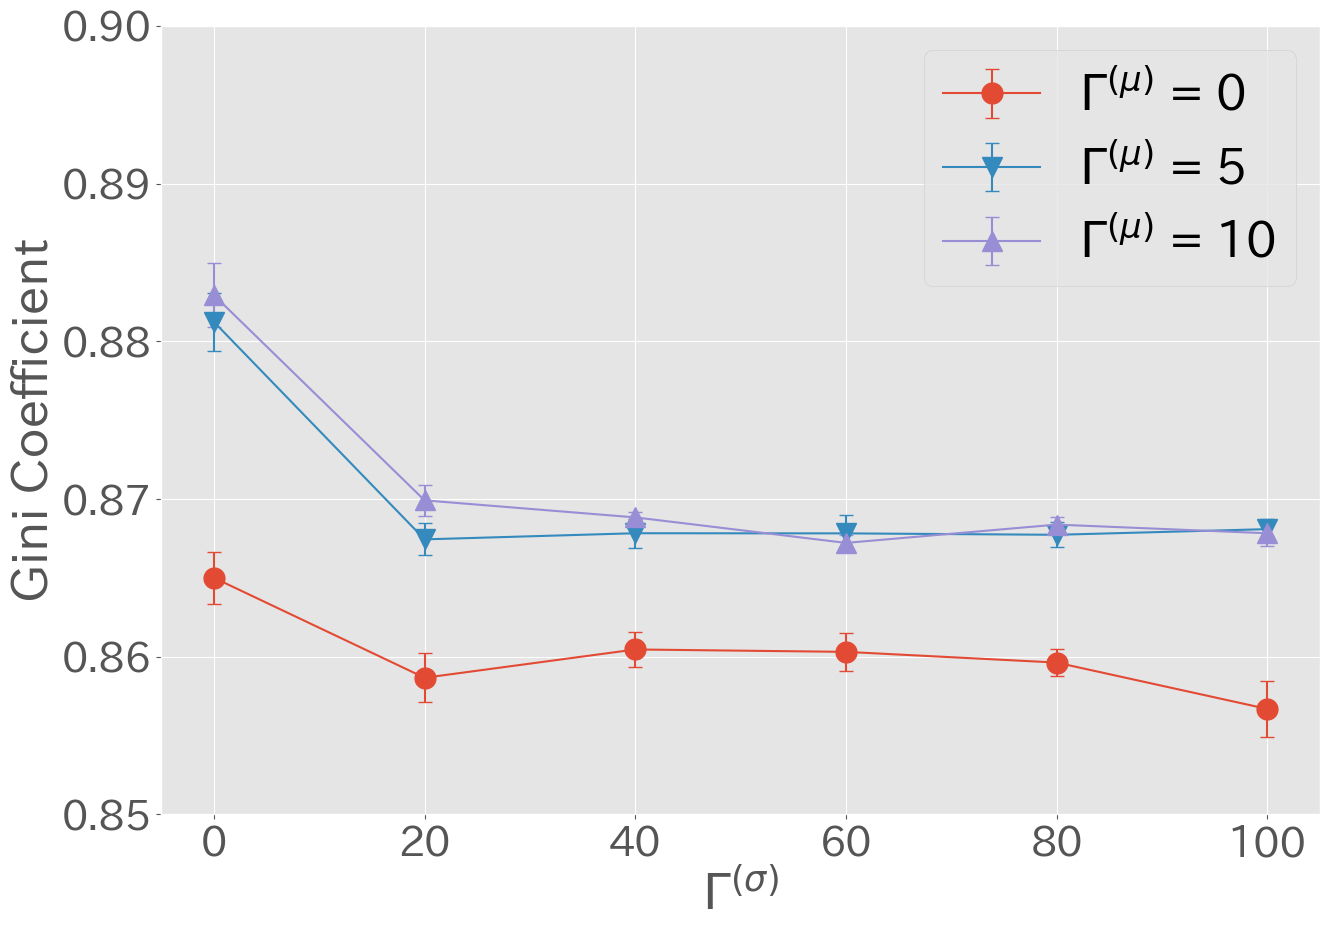
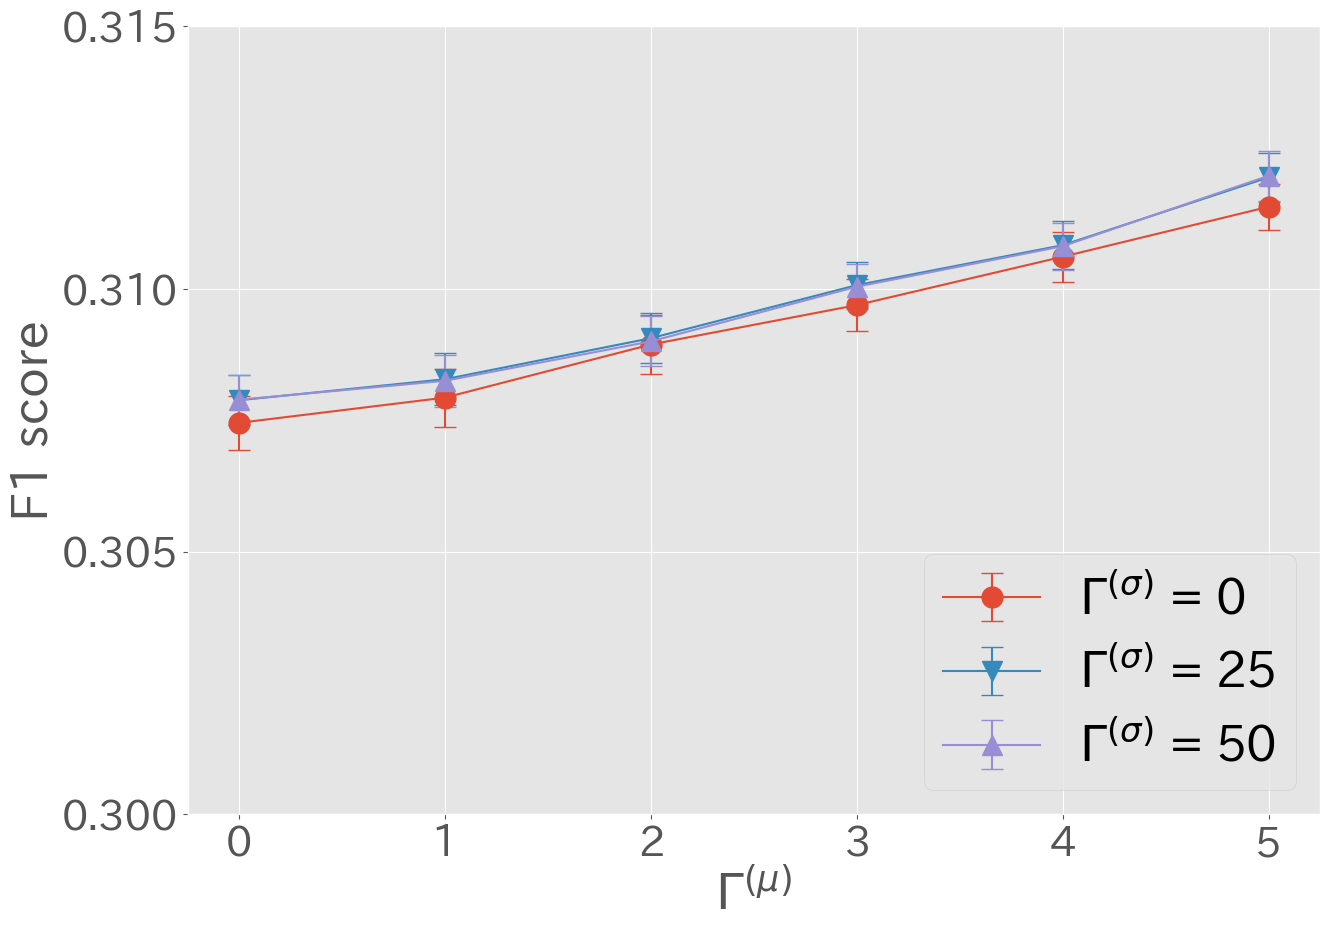
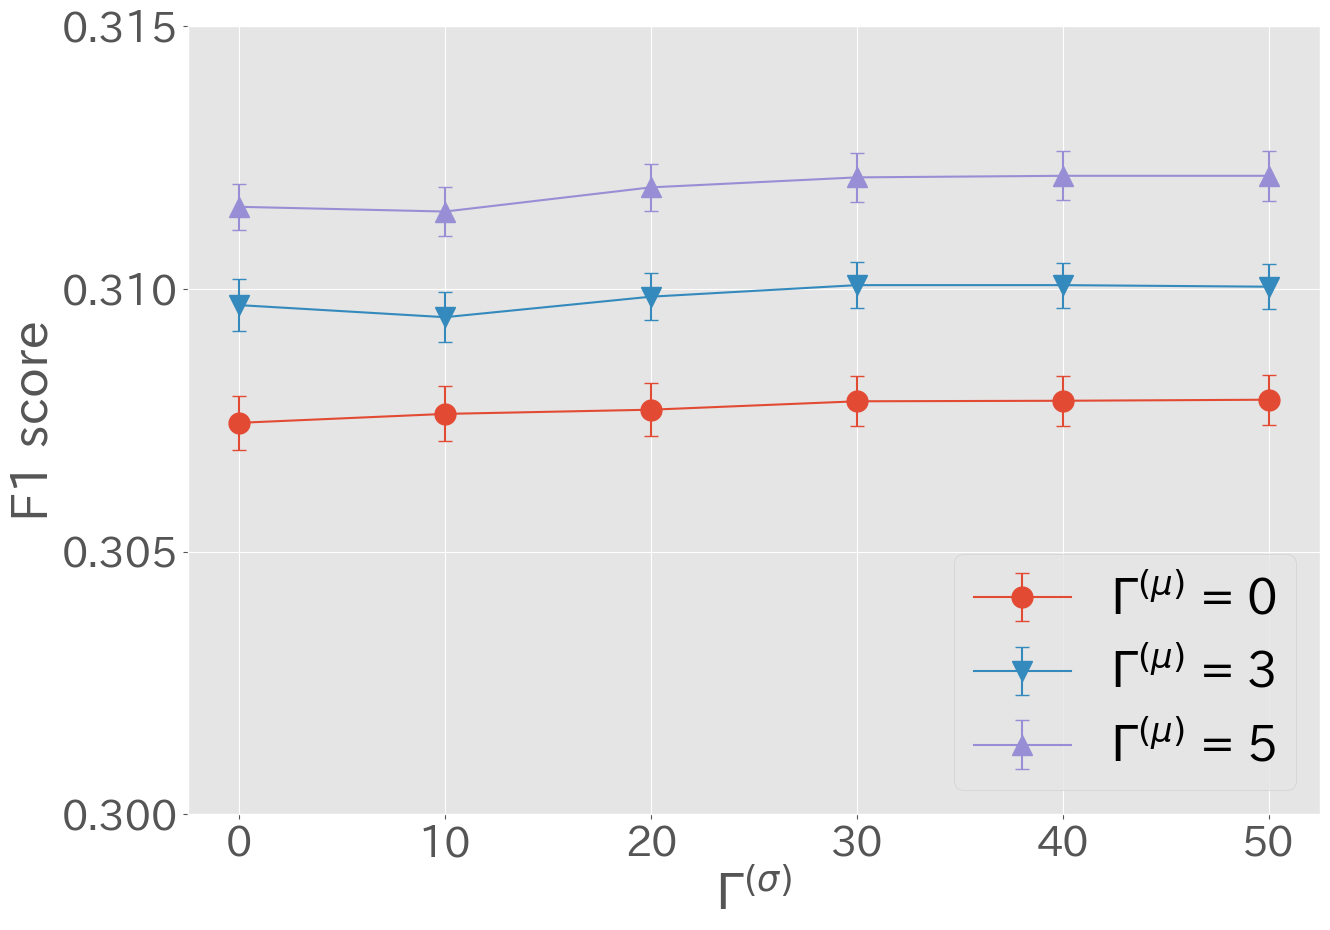
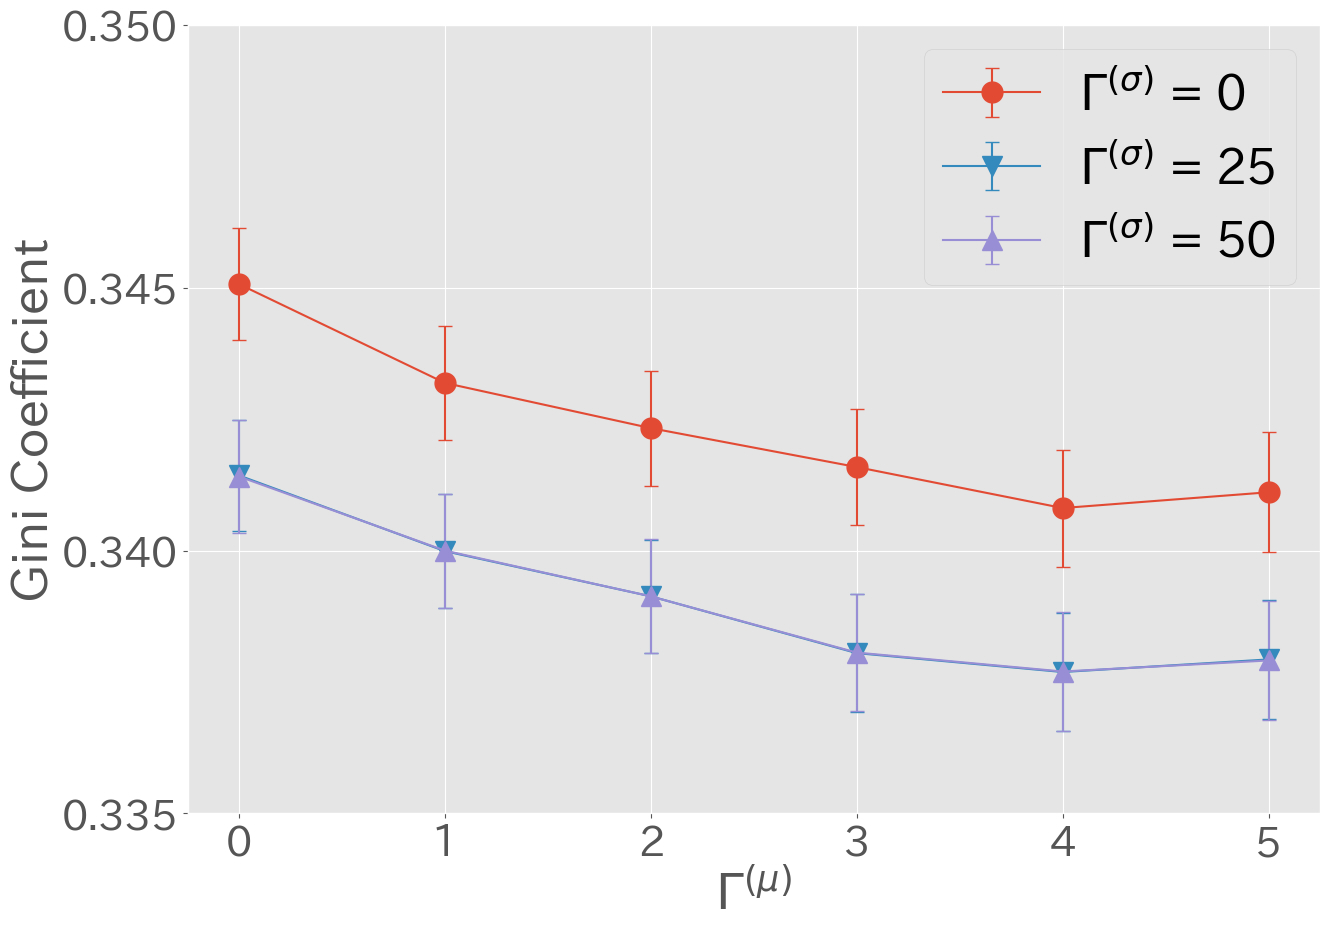
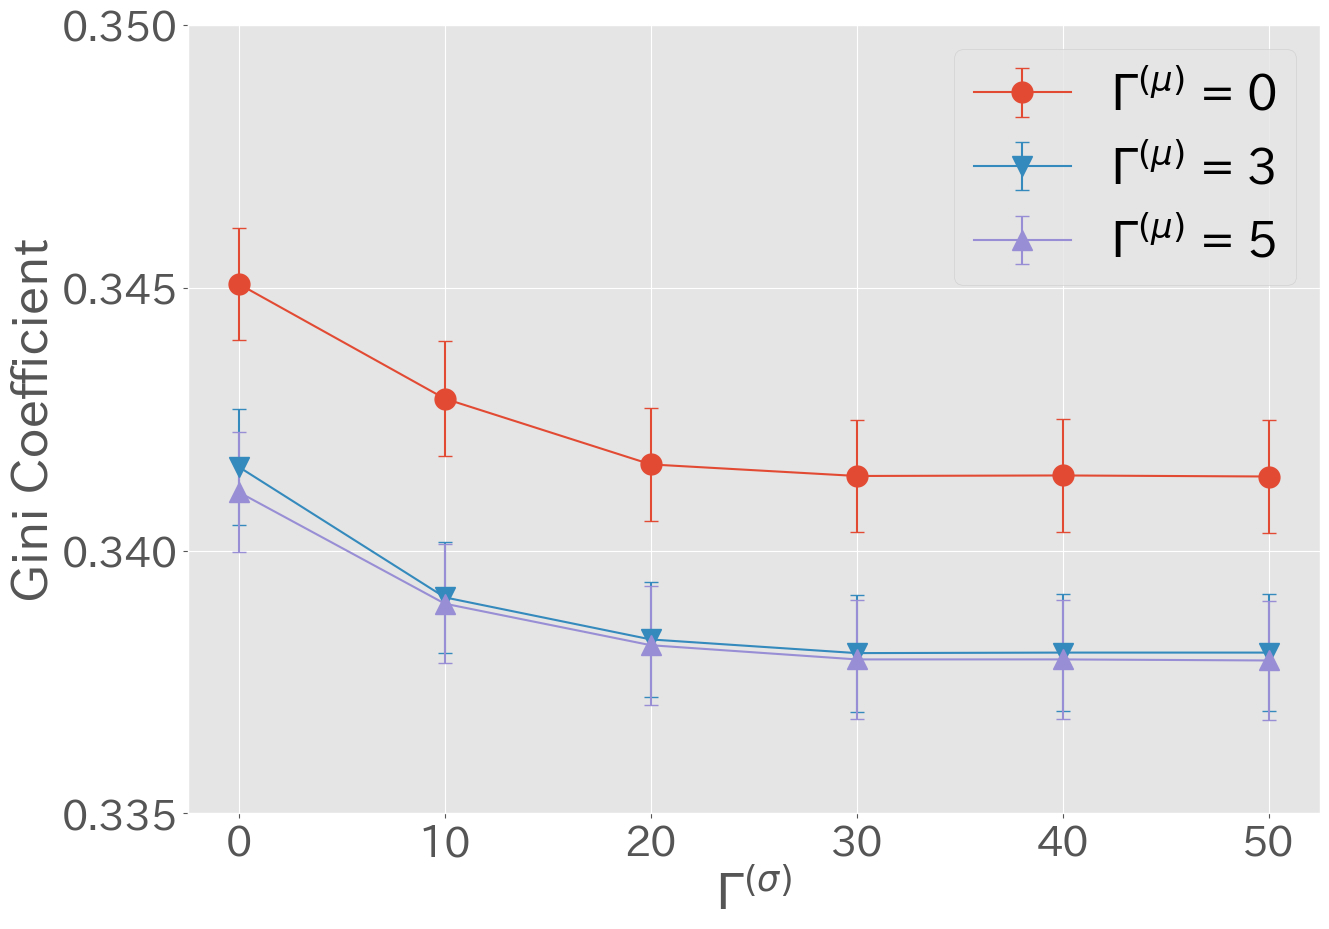
Fig. 1 shows the F1 scores and Gini coefficients of recommendations () with various values of and on the MovieLens 100K dataset. Recall that these results were averaged over five repetitions, with standard errors displayed as error bars in the figures.
We first focus on the effect of the cardinality parameter of variation in the expected ratings. The F1 score improved as increased (Fig. 1(a)), which suggests that considering the uncertainty in expected ratings can upgrade the accuracy of recommendations. Conversely, the Gini coefficient increased as increased (Fig. 1(c)), which implies that considering the uncertainty in expected ratings can decrease the diversity of recommendations among items. This is likely because popular items are preferentially recommended to a wide range of users to avoid uncertainty in expected ratings.
We next move on to the effect of the cardinality parameter of variation in the rating covariance. Increasing had relatively small impacts on the F1 score (Fig. 1(b)). In contrast, increasing led to a reduction in the Gini coefficient (Fig. 1(d)), which suggests that considering the uncertainty in rating covariance can enhance the diversity of recommendations among items. This effect is due to the recommendation of item pairs with lower covariance, resulting in more diverse sets of recommended items.
These results on the MovieLens 100K dataset (Fig. 1) demonstrate that our robust portfolio optimization method can significantly improve the accuracy or diversity of recommendations by appropriately tuning the cardinality parameters and , compared to not considering the uncertainty in the expectation and covariance of ratings (i.e., ).
4.5 Results for the Yahoo! R3 dataset
Fig. 2 shows the F1 scores and Gini coefficients of recommendations () with various values of and on the Yahoo! R3 dataset. Note that the error bars displayed in the figures represent standard errors estimated from 10 bootstrap runs.
We first focus on the effect of the cardinality parameter of variation in the expected ratings. The F1 score improved as increased (Fig. 2(a)) as well as the MovieLens 100K dataset (Fig. 1(a)). Moreover, in contrast to Fig. 1(c) on the MovieLens 100K dataset, the Gini coefficient decreased as increased (Fig. 2(c)). This indicates that considering the uncertainty in expected ratings can significantly improve both the accuracy and diversity of recommendations.
We next move on to the effect of the cardinality parameter of variation in the rating covariance. Increasing had relatively small impacts on the F1 score (Fig. 2(b)) as well as the MovieLens 100K dataset (Fig. 1(b)). In contrast, increasing led to a reduction in the Gini coefficient (Fig. 2(d)) as well as the MovieLens 100K dataset (Fig. 1(d)). This suggests that considering the uncertainty in rating covariance can significantly enhance the diversity of recommendations among items.
These results on the Yahoo! R3 dataset (Fig. 2) demonstrate that our robust portfolio optimization method can improve recommendation diversity without reducing recommendation accuracy, compared to not considering the uncertainty in the expectation and covariance of ratings (i.e., ). This positive result can be attributed to the fact that the accuracy of rating prediction was lower on the Yahoo! R3 dataset (RMSE: 1.42) than on the MovieLens 100K dataset (RMSE: 0.92), as mentioned in Section 4.2.
5 Conclusion
We proposed a robust portfolio optimization model for recommendation that copes with the uncertainty of estimated statistics. Specifically, we introduced the cardinality-based uncertainty sets [4] of the expectation and covariance of ratings in the mean–variance portfolio optimization model for recommender systems. Our robust portfolio optimization model can be reduced to a mixed-integer linear optimization problem, which can be solved exactly using mathematical optimization solvers.
We conducted numerical experiments using two publicly available rating datasets. For the MovieLens 100K dataset, our method improved the accuracy or diversity of recommendations by appropriately tuning the cardinality parameters. For the Yahoo! R3 dataset, our method improved the recommendation diversity without reducing the recommendation accuracy. Importantly, our method has the potential to improve the recommendation quality of various rating prediction algorithms (e.g., collaborative filtering [29], matrix factorization [21], and deep learning techniques [12, 38]).
Solving the mixed-integer optimization problem (Eqs. (7)–(11)) becomes challenging as the numbers of users and items increase. A future direction of study will be to apply high-performance algorithms for solving cardinality-constrained portfolio optimization problems [9, 20]. Other research directions for our method include combining it with price optimization [10, 16], developing privacy preservation mechanisms for it [13, 35], and extending it to multiperiod/dynamic portfolio optimization [6, 30].
References
- [1] Adomavicius, G., Tuzhilin, A.: Toward the next generation of recommender systems: A survey of the state-of-the-art and possible extensions. IEEE Transactions on Knowledge and Data Engineering 17(6), 734–749 (2005)
- [2] Aggarwal, C.C.: Recommender Systems. Springer (2016)
- [3] Bertsimas, D., Brown, D.B., Caramanis, C.: Theory and applications of robust optimization. SIAM Review 53(3), 464–501 (2011)
- [4] Bertsimas, D., Sim, M.: The price of robustness. Operations Research 52(1), 35–53 (2004)
- [5] Bobadilla, J., Ortega, F., Hernando, A., Gutiérrez, A.: Recommender systems survey. Knowledge-Based Systems 46, 109–132 (2013)
- [6] Boyd, S., Busseti, E., Diamond, S., Kahn, R.N., Koh, K., Nystrup, P., Speth, J.: Multi-period trading via convex optimization. Foundations and Trends® in Optimization 3(1), 1–76 (2017)
- [7] Broadie, M.: Computing efficient frontiers using estimated parameters. Annals of Operations Research 45, 21–58 (1993)
- [8] Castells, P., Hurley, N., Vargas, S.: Novelty and diversity in recommender systems. In: Recommender Systems Handbook, pp. 603–646. Springer (2021)
- [9] Chang, T.J., Meade, N., Beasley, J.E., Sharaiha, Y.M.: Heuristics for cardinality constrained portfolio optimisation. Computers & Operations Research 27(13), 1271–1302 (2000)
- [10] Den Boer, A.V.: Dynamic pricing and learning: historical origins, current research, and new directions. Surveys in Operations Research and Management Science 20(1), 1–18 (2015)
- [11] Elton, E.J., Gruber, M.J., Brown, S.J., Goetzmann, W.N.: Modern Portfolio Theory and Investment Analysis. John Wiley & Sons (2009)
- [12] Gao, C., Wang, X., He, X., Li, Y.: Graph neural networks for recommender system. In: Proceedings of the 15th ACM International Conference on Web Search and Data Mining. pp. 1623–1625 (2022)
- [13] Himeur, Y., Sohail, S.S., Bensaali, F., Amira, A., Alazab, M.: Latest trends of security and privacy in recommender systems: A comprehensive review and future perspectives. Computers & Security 118, 102746 (2022)
- [14] Hug, N.: Surprise: A python library for recommender systems. Journal of Open Source Software 5(52), 2174 (2020)
- [15] Hurley, N., Zhang, M.: Novelty and diversity in top- recommendation—Analysis and evaluation. ACM Transactions on Internet Technology 10(4), 1–30 (2011)
- [16] Ikeda, S., Nishimura, N., Sukegawa, N., Takano, Y.: Prescriptive price optimization using optimal regression trees. Operations Research Perspectives 11, 100290 (2023)
- [17] Iwanaga, J., Nishimura, N., Sukegawa, N., Takano, Y.: Improving collaborative filtering recommendations by estimating user preferences from clickstream data. Electronic Commerce Research and Applications 37, 100877 (2019)
- [18] Kaminskas, M., Bridge, D.: Diversity, serendipity, novelty, and coverage: A survey and empirical analysis of beyond-accuracy objectives in recommender systems. ACM Transactions on Interactive Intelligent Systems 7(1), 1–42 (2016)
- [19] Kim, J.H., Kim, W.C., Fabozzi, F.J.: Recent advancements in robust optimization for investment management. Annals of Operations Research 266, 183–198 (2018)
- [20] Kobayashi, K., Takano, Y., Nakata, K.: Cardinality-constrained distributionally robust portfolio optimization. European Journal of Operational Research 309(3), 1173–1182 (2023)
- [21] Koren, Y., Bell, R., Volinsky, C.: Matrix factorization techniques for recommender systems. Computer 42(8), 30–37 (2009)
- [22] Kunaver, M., Požrl, T.: Diversity in recommender systems—A survey. Knowledge-Based Systems 123, 154–162 (2017)
- [23] Kwon, Y.: Improving top- recommendation techniques using rating variance. In: Proceedings of the 2008 ACM Conference on Recommender Systems. pp. 307–310 (2008)
- [24] Lu, J., Wu, D., Mao, M., Wang, W., Zhang, G.: Recommender system application developments: A survey. Decision Support Systems 74, 12–32 (2015)
- [25] McNee, S.M., Riedl, J., Konstan, J.A.: Being accurate is not enough: How accuracy metrics have hurt recommender systems. In: CHI’06 Extended Abstracts on Human Factors in Computing Systems. pp. 1097–1101 (2006)
- [26] Möller, J., Trilling, D., Helberger, N., van Es, B.: Do not blame it on the algorithm: An empirical assessment of multiple recommender systems and their impact on content diversity. In: Digital Media, Political Polarization and Challenges to Democracy, pp. 45–63. Routledge (2020)
- [27] Shani, G., Gunawardana, A.: Evaluating recommendation systems. Recommender Systems Handbook pp. 257–297 (2011)
- [28] Shi, Y., Zhao, X., Wang, J., Larson, M., Hanjalic, A.: Adaptive diversification of recommendation results via latent factor portfolio. In: Proceedings of the 35th International ACM SIGIR Conference on Research and Development in Information Retrieval. pp. 175–184 (2012)
- [29] Su, X., Khoshgoftaar, T.M.: A survey of collaborative filtering techniques. Advances in Artificial Intelligence 2009(1), 421425 (2009)
- [30] Takano, Y., Gotoh, J.: Dynamic portfolio selection with linear control policies for coherent risk minimization. Operations Research Perspectives 10, 100262 (2023)
- [31] Wang, J.: Mean–variance analysis: A new document ranking theory in information retrieval. In: European Conference on Information Retrieval. pp. 4–16. Springer (2009)
- [32] Wang, J., Zhu, J.: Portfolio theory of information retrieval. In: Proceedings of the 32nd International ACM SIGIR Conference on Research and Development in Information Retrieval. pp. 115–122 (2009)
- [33] Williams, H.P.: Model Building in Mathematical Programming. John Wiley & Sons (2013)
- [34] Xiao, Y., Pei, Q., Yao, L., Wang, X.: Recrisk: An enhanced recommendation model with multi-facet risk control. Expert Systems with Applications 158, 113561 (2020)
- [35] Yanagi, T., Ikeda, S., Sukegawa, N., Takano, Y.: Privacy-preserving recommender system using the data collaboration analysis for distributed datasets. arXiv preprint arXiv:2406.01603 (2024)
- [36] Yasumoto, Y., Takano, Y.: Mean–variance portfolio optimization with shrinkage estimation for recommender systems. Optimization Online (2023)
- [37] Zhang, M., Hurley, N.: Avoiding monotony: Improving the diversity of recommendation lists. In: Proceedings of the 2008 ACM Conference on Recommender Systems. pp. 123–130 (2008)
- [38] Zhang, S., Yao, L., Sun, A., Tay, Y.: Deep learning based recommender system: A survey and new perspectives. ACM Computing Surveys 52(1), 1–38 (2019)