TACCO: Task-guided Co-clustering of Clinical Concepts and Patient Visits for Disease Subtyping based on EHR Data
Abstract.
The growing availability of well-organized Electronic Health Records (EHR) data has enabled the development of various machine learning models towards disease risk prediction. However, existing risk prediction methods overlook the heterogeneity of complex diseases, failing to model the potential disease subtypes regarding their corresponding patient visits and clinical concept subgroups. In this work, we introduce TACCO, a novel framework that jointly discovers clusters of clinical concepts and patient visits based on a hypergraph modeling of EHR data. Specifically, we develop a novel self-supervised co-clustering framework that can be guided by the risk prediction task of specific diseases. Furthermore, we enhance the hypergraph model of EHR data with textual embeddings and enforce the alignment between the clusters of clinical concepts and patient visits through a contrastive objective. Comprehensive experiments conducted on the public MIMIC-III dataset and Emory internal CRADLE dataset over the downstream clinical tasks of phenotype classification and cardiovascular risk prediction demonstrate an average 31.25% performance improvement compared to traditional ML baselines and a 5.26% improvement on top of the vanilla hypergraph model without our co-clustering mechanism. In-depth model analysis, clustering results analysis, and clinical case studies further validate the improved utilities and insightful interpretations delivered by TACCO. Code is available at https://github.com/PericlesHat/TACCO.
1 INTRODUCTION
Electronic Health Records (EHR) is a significant advancement in medical data management. They store patient data such as medical history, treatments, and lab results. EHRs have played a crucial role in advancing healthcare applications, such as treatment decision support (Sutton et al., 2020) and preventive care (Liu et al., 2018; Shah and Luo, 2017). In recent years, machine learning (ML) has been employed to extract valuable insights from EHRs and is widely studied in healthcare informatics. This leads to innovations in various applications such as suicide risk prediction (Cheng et al., 2016; Su et al., 2020), diagnosis prediction (Pang et al., 2021; Ma et al., 2017; Hosseini et al., 2018), phenotypes classification (Fu et al., 2019; Xu et al., 2022, 2023), and drug recommendation (Yang et al., 2021).
Among various ML models for EHR data, graph-based models have shown promise with their capabilities of modeling complex structures within EHRs (Choi et al., 2017; Shang et al., 2019; Liu et al., 2020; Choi et al., 2020). Given the lack of generic ways of constructing reliable graph structures from EHR, hypergraphs have recently been used as a flexible data structure that directly models the interactions between clinical concepts (i.e., names of medical codes in EHR) and patient visits (Xu et al., 2022, 2023). These higher-order modeling approaches are robust with sparse incomplete features and can generate interpretable predictions on the important clinical concepts for analyzed diseases.
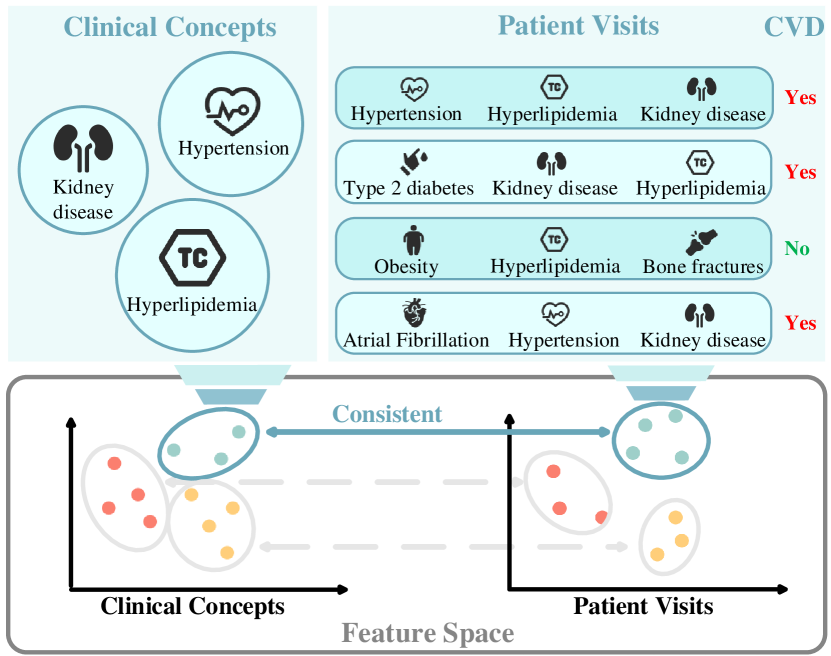
Understanding disease subtypes is crucial for studying the mechanisms of complex diseases and establishing personalized treatments. Disease subtypes refer to specific variations within a broader disease category, differentiated by unique characteristics, symptoms, or treatment responses. In EHR, disease subtypes can be defined as subgroups of patients who exhibit similar patterns related to clinical concepts such as diagnoses, medications, and procedures received in their medical visits (Wang and Wang, 2023; Maiorino and Loscalzo, 2023). In this work, beyond the commonly defined disease types such as in Current Procedural Terminology (CPT) and International Classification of Diseases (ICD), we are interested in further discovering fine-grained disease subtypes such as regarding subgroups of diabetic patients with high risks of stroke, retinopathy, neuropathy, or nephropathy (L’heveder and Nolan, 2013). On the other hand, modeling disease subtypes and the complex interactions between clinical concepts and patient visits can also assist in the risk prediction of specific diseases. For example, in Figure 1, clinical concepts such as hypertension, kidney disease, and hyperlipidemia can indicate a group of patients at high risk of CVD (Xu et al., 2023), who may require targeted therapies to mitigate the risk of further diabetes-related complications (Ahlqvist et al., 2018). These connections can help medical professionals gain fine-grained understandings of the risks and design precise effective interventions.
To the best of our knowledge, jointly analyzing the subgroups of clinical concepts and patient visits is rarely studied in healthcare informatics. Previous models have used simple algorithms like K-means (Shen et al., 2007, 2009; Ahlqvist et al., 2018), single variable analysis (Gujral et al., 2013), and matrix factorization (Varghese et al., 2021) to identify disease subtypes. However, these statistical methods lack guidance from risk prediction tasks and thus need manually pre-defined sets of clinical concepts for specific diseases (Christensen et al., 2022; Parikh et al., 2023). In recent years, more advanced clustering techniques such as Deep Embedded Clustering (Xie et al., 2016) and other self-supervised approaches (Zhang et al., 2020; Guo et al., 2017; Li et al., 2021) have been studied for EHR-based clinical predictions. However, these methods can only cluster one type of entity and do not consider the higher-order interactions among clinical concepts and patient visits (Huang et al., 2021; Zhao et al., 2023; Zhang and Kiryu, 2022).
We aim to develop a model to jointly identify clusters of clinical concepts and patient visits for disease subtyping on EHR data. Task-guided co-clustering is used to analyze clinical concepts and patient visits, providing meaningful interpretations for predictive tasks. However, some challenges need to be addressed: (1) Inadequate Graph Representation. Conventional GNNs struggle to efficiently represent medical concepts and patient visits due to their focus on pairwise relationships. EHR data contains multiple medical codes that can be repeated across various visits, requiring a higher-order graph modeling technique for accurate representation. Existing work (Xu et al., 2023; Ma et al., 2018; Ochoa and Mustafa, 2022; Lu and Uddin, 2021) only focus on geometric structures and ignore clinical natural language descriptions from medical coding systems, limiting the ability of GNNs to learn a comprehensive representation and negatively impacting downstream tasks. (2) Lack of Supervision for Interpretation. Recent ML research in healthcare has increasingly shifted towards not only showcasing model performance but also providing interpretability. Approaches such as factual counterfactual reasoning (Guidotti et al., 2019; Xu et al., 2022) and time-aware mechanisms (Sun et al., 2021; Zhang et al., 2021) can extract interpretable subsets for EHR data, but they require supervised learning. In our case, we aim to uncover patterns through co-clustering without supervision and find consistency between clinical concepts and patient visits for interpretations.
In this work, we introduce TACCO (Task-guided Co-Clustering), the first framework that clusters clinical concepts and patient visits on EHR networks using self-supervised co-clustering and a contrastive alignment module. Our framework TACCO “homogenizes” clusters to reveal deeper insights into the connections between subgroups of clinical concepts and patient visits. The contributions of our work are summarized as follows:
-
•
We identify a novel task for disease subtyping in EHR analysis, where clusters of clinical concepts and patient visits are jointly studied and contribute to understanding complex diseases.
-
•
We develop TACCO, a task-guided self-supervised framework that uncovers patterns through co-clustering without supervision. The model is built based on a text-enhanced hypergraph transformer with a dual application of deep clustering on both nodes and hyperedges. The model further aligns clinical concepts and patient visit clusters through contrastive learning for identifying consistent disease subtypes.
-
•
Extensive quantitative experiments and clustering analysis are conducted on two clinical EHR datasets, the publicly available MIMIC-III (Johnson et al., 2016) and the private CRADLE. TACCO outperforms the previous state-of-the-art model (Xu et al., 2022) and demonstrates a notable 5.26% improvement across four metrics compared to hypergraph model backbone (Xu et al., 2023). Case studies further show that TACCO is capable of grouping consistent clinical concepts and patient visits that reveal disease subtypes related to a specific disease (e.g., CVD). As validated by a domain expert, the captured disease subtypes could have different levels of relationships (e.g., positive, weak, or negative) with specific diseases for a fine-grained understanding in practice.
2 RELATED WORK
Machine Learning in Healthcare. Medical research has utilized various model architectures to analyze healthcare data. Earlier research efforts mainly employed fundamental model architectures. For instance, Liu et al. (2014b) used auto-encoders to diagnose Alzheimer’s disease. Choi et al. (2016c) utilized word2vec (Mikolov et al., 2013) to learn the representations of medical concepts. More recent models, such as Convolutional Neural Networks and Recurrent Neural Networks have also been widely applied in various applications (Choi et al., 2016b; Pham et al., 2016; Choi et al., 2016a; Nguyen et al., 2016; Harutyunyan et al., 2019).
To capture the intrinsic structures of healthcare data, there is a growing interest in graph-based methods. For example, event sequences are modeled as weight graphs for heart failure prediction (Liu et al., 2015), robust relations among medical codes are learned (Choi et al., 2020), and medical knowledge graphs are incorporated for downstream reasoning (Choi et al., 2017; Ma et al., 2018). To consider the higher-level relations in structured data, Xu et al. (2023, 2022) proposed to model patient visits as hyperedges in a hypergraph transformer, which overcomes the limitations of pairwise relations and provides interpretable insights.
Clustering Methods. Traditional clustering methods are mostly algorithmic and heuristic-based, e.g., K-means (Lloyd, 1982), hierarchical clustering (Johnson, 1967), and density-based spatial clustering of applications with noise (DBSCAN) (Ester et al., 1996). While effective for linearly separable data, these algorithms are not learning-based and cannot generalize to unseen data. To address this limitation, deep clustering techniques like DEC (Xie et al., 2016) introduced self-supervised techniques for complex cluster representation. Subsequently, several self-supervised clustering approaches (Zhang et al., 2020; Guo et al., 2017; Li et al., 2021; Yang et al., 2016; Huang et al., 2014) were proposed to enhance the robustness of clustering and were generalized to various settings.
Clustering techniques have been employed to identify meaningful subsets of medical concepts in healthcare. For example, iCluster (Shen et al., 2009) jointly estimated the latent tumor subtypes by refining K-means and Gaussian latent variable models. SilHAC (Nidheesh et al., 2020) tackled cluster number estimation and identification in cancer data based on the Silhouette Index. NCIS (Liu et al., 2014a) identified cancer subtypes based on gene expression with network-assisted co-clustering. MODEC (Zhang and Kiryu, 2022) leveraged DEC for cancer subtype identification and clinical feature analysis. However, none of these studies has explored the co-clustering of clinical concepts and patient visits to improve downstream prediction tasks and provide interpretations.
3 METHOD

3.1. Problem Definition
We define a hypergraph where is a set of vertices, each representing a medical code, and is a set of hyperedges, each representing a patient visit that includes a subset of medical codes from . The goals of this study include: (1) Given a patient’s clinical record, predict the clinical outcome of that patient. (2) Analyze clusters of clinical concepts and patient visits for disease subtyping based on the hypergraph constructed from EHR data.
3.2. Text-enhanced Hypergraph Transformer
To effectively capture the intricate relationships in EHR, we adopt a hypergraph transformer (Chien et al., 2021). As shown in the middle part of Figure 2, the node embedding of each medical code in the hypergraph are initialized with information from two aspects: structures and semantics. The structural part is obtained from DeepWalk (Perozzi et al., 2014), where we apply random walks on to train a Skip-gram model. For the semantical part, we process the medical code descriptions of nodes with SapBERT (Liu et al., 2021), a transformer-based model pre-trained on extensive biomedical literature, to generate text embeddings . We directly concatenate these two vectors as the initial node embeddings:
| (1) |
For the -th layer of the hypergraph, node and hyperedge embeddings are denoted by and , where and are dimensionality parameters of the node and hyperedge feature spaces, respectively. The embeddings are updated through a two-step message-passing mechanism:
| (2) |
where is the representation of nodes contained in the hyperedge , and denote the representations of hyperedges that contain the node . For the two functions , we leverage a self-attention mechanism (Vaswani et al., 2017) that allows the model to focus on the most informative parts:
| (3) |
where is the output from the multi-head self-attention block:
| (4) |
denotes the scaled dot-product attention mechanism:
| (5) |
where , , and are parameter matrices for the -th head corresponding to queries, keys, and values, respectively. The input sequence will be projected into different heads. The output of each head is then concatenated (denoted by ) to form the multi-head attention output. The input dimensionality is evenly split across the heads in dimensions. The multi-head attention output is combined with a feed-forward neural network (FFN), which is composed of a 2-layer Multilayer Perceptron (MLP) with a ReLU activation. In our task, we do not include the position encoding technique in the standard Transformer due to the lack of such information in our datasets. A 2-layer MLP is utilized for the disease risk prediction task, along with a sigmoid activation function, denoted by :
| (6) |
The learning objective is a binary cross-entropy loss, where represents the truth label and is the predicted probability:
| (7) |
3.3. Deep Self-Supervised Co-clustering
The main challenge in our problem is the lack of supervision for generating clusters of clinical concepts and patient visits for disease subtyping. Since there are no labels available, traditional supervised methods such as classification cannot be applied directly. Some previous works use simple K-means to extract specific disease subtypes, but these methods are not data-driven and cannot be integrated into deep models. Inspired by Xie et al. (2016), we employ a deep clustering method that iteratively learns the cluster assignments in a self-supervised manner. This deep clustering technique has been proven to be effective in graphs and can be jointly optimized with embedding propagation (Yang et al., 2020).
In TACCO, we propose a dual application of Deep Embedded Clustering (DEC) on both clinical concepts and patient visits, as shown in the left and right parts of Figure 2. Specifically, we seek to jointly learn soft clustering assignments for both nodes and hyperedges, denoted as and , respectively. For any given node (or hyperedge) and cluster , the soft assignment is calculated based on the similarity between the node’s (or hyperedge’s) embedding and the cluster centroid, formalized as:
| (8) |
where is the embedding of node (or hyperedge) and is the centroid of the -th cluster. Similarly to DEC, we perform standard K-means to initialize centroids .
Subsequent to the determination of , we construct a refined target distribution , which aims to enhance cluster purity by emphasizing confident assignments. The components of are computed by squaring the elements of and normalizing them across each cluster, as follows:
| (9) |
with representing the sum of the soft assignments to the -th cluster. We then minimize the Kullback-Leibler divergence between and , which serves as the self-training clustering loss:
| (10) |
3.4. Cluster Contrastive Alignment
We further align these clusters across two domains in a shared feature space, which helps to generate consistent clusters on clinical concepts and patient visits for interpretations. The cluster centroids are computed by incorporating the soft assignment probabilities from the matrix . Specifically, for each cluster , the centroid is determined by the weighted average of the node (or hyperedge) embeddings, with the weights given by the soft assignments for node (or hyperedge) . This is formally expressed as:
| (11) |
where the denominator is the sum of the soft assignments to cluster . Unlike the rigid nature of hard clustering that strictly assigns nodes/hyperedges based on maximal probability, soft assignment reflects the intrinsic nature of disease subtypes, where clinical concepts (e.g., obesity) may serve as potential causes for multiple diseases. With soft assignments, TACCO preserves such natural but often overlooked overlaps present in EHR data.
To enable an unsupervised cluster alignment across two domains, existing strategies (Deng et al., 2019; Wang et al., 2022) propose to match the first-order moments of the -th cluster from the source domain and target domain. Their loss function is designed to minimize the distance between the node clusters embedding and hyperedge clusters embedding of the corresponding clusters across two domains. However, these strategies presuppose that the indices of clusters between the two domains are pre-aligned. Our task centers on discovering these correspondences in situations where clusters are randomly generated. Thus, we cannot rely on alignment methods that assume index matching between two domains.
Using the principle of contrastive learning, we align the consistent clusters by minimizing the distance between each node cluster centroid and its nearest hyperedge cluster centroid while maximizing the separation from less similar centroids. This process is illustrated on the top of Figure 2. In this design, the node and hyperedge embeddings from Eq. (2) are independently processed by a projection MLP head (Grill et al., 2020), which contains 2 linear layers with batch normalization and a ReLU activation:
| (12) |
We use the triplet loss function to align cross-domain embedding without explicit label correspondences, which is calculated as:
| (13) |
where (i.e., anchor) is the -th embedding from , is the positive sample for within , and represents other negative samples, with measuring distance and setting the minimum desired difference between positive and negative samples. In this case, the distance is measured by negative cosine similarity, which has been proven to be effective in contrastive learning (Chen and He, 2021):
| (14) |
where denotes dot product, and is the -norm.
3.5. Learning Objective
The final learning objective of TACCO is the sum of three parts:
| (15) |
where and are hyperparameters for weighting different losses.
4 EXPERIMENTS
In this section, we evaluate TACCO on two EHR datasets, in terms of the performance of downstream clinical tasks, in-depth model analysis, clustering analysis, and case studies.
4.1. Experiment Settings
Datasets and Tasks. We adopt the public MIMIC-III dataset (Johnson et al., 2016) for a phenotype classification task. MIMIC-III comprises de-identified health-related data associated with over forty thousand patients who stayed in critical care units of the Beth Israel Deaconess Medical Center between 2001 and 2012. We follow the setting of (Harutyunyan et al., 2019) to identify 25 phenotypes, including 12 acute conditions (e.g., pneumonia), 8 chronic conditions (e.g., chronic kidney disease), and 5 mixed conditions (e.g., conduction disorders). In terms of experiments, we choose patients with more than one visit and utilize the records from a preceding visit to predict the diagnostic phenotypes of the subsequent visit. These visits are represented as hyperedges within our hypergraph modeling framework, each annotated with a 25-category multihot label.
We also utilize the CRADLE (Emory Clinical Research Analytics Data Lake Environment) dataset for a CVD risk prediction task. Project CRADLE contains close to 48 thousand de-identified patient records with type 2 diabetes seen at Emory Healthcare System between 2013 and 2017. Following (Xu et al., 2023), our study aims to predict the onset of CVD within one year following the initial diagnosis of type 2 diabetes, utilizing ICD-9 and ICD-10 codes to identify CVD events such as coronary heart disease (CHD), congestive heart failure (CHF), myocardial infarction (MI), or stroke. The patients are considered positive if they develop a CVD complication within a year and negative otherwise.
The dataset statistics are summarized in Table 1. Our tasks also include a clustering analysis, where task-guided clusters for clinical concepts and patient visits are generated to discover disease subtypes. We also visualize the distribution of disease subtypes and patient subgroups using t-SNE. Their significant relationships are captured and analyzed through case studies in Sec. 4.5.
| Stats | MIMIC-III | CRADLE |
|---|---|---|
| # of diagnosis | 846 | 7915 |
| # of procedure | 2032 | 4321 |
| # of service | 20 | — |
| # of prescription | 4525 | 489 |
| # of nodes | 7423 | 12725 |
| # of hyperedges | 36875/12353 | 36611 |
Metrics. To deal with the imbalanced labels within the EHR data, we follow (Xu et al., 2023) to adopt Accuracy, AUROC, AUPR, and Macro F1 score as the metrics of downstream clinical tasks. To measure the quality of clusters TACCO generates, we utilize Silhouette Coefficient (Rousseeuw, 1987) for an unsupervised evaluation.
| Model | MIMIC-III | CRADLE | ||||||
|---|---|---|---|---|---|---|---|---|
| Accuracy | AUROC | AUPR | Marcro-F1 | Accuracy | AUROC | AUPR | Marcro-F1 | |
| LR | ||||||||
| SVM | ||||||||
| MLP | ||||||||
| XGBoost | ||||||||
| GCT | ||||||||
| GAT | ||||||||
| HGNN | ||||||||
| HyperGCN | ||||||||
| HCHA | ||||||||
| HypEHR | ||||||||
| TACCO | ||||||||
| w/ DCC | ||||||||
| w/ IDEC | ||||||||
| w/ DEC | ||||||||
| hypergraph w/ | MIMIC-III | CRADLE | |||||||||
|---|---|---|---|---|---|---|---|---|---|---|---|
| text | node | edge | align | Accuracy | AUROC | AUPR | Macro-F1 | Accuracy | AUROC | AUPR | Macro-F1 |
| ✓ | |||||||||||
| ✓ | ✓ | ||||||||||
| ✓ | ✓ | ||||||||||
| ✓ | ✓ | ✓ | |||||||||
| ✓ | ✓ | ✓ | ✓ | ||||||||
Baselines. In terms of the two disease prediction tasks, we compare our TACCO with the following baselines:
(1) Traditional ML. The traditional ML baselines include models that process EHR data without utilizing graph structures. Specifically, we consider:
-
•
LR (Menard, 2002): Logistic Regression, a linear model for classification that estimates probabilities using a logistic function.
-
•
SVM (Cortes and Vapnik, 1995): Support Vector Machine, an algorithm that finds the hyperplane that best separates different classes.
-
•
MLP (Naraei et al., 2016): Multilayer Perceptron, an artificial neural network that consists of at least three layers of nodes.
-
•
XGBoost (Chen and Guestrin, 2016): an implementation of gradient-boosted decision trees designed for speed and performance.
(2) Graph-based Models. We also compare advanced GNN models for further analysis of EHR data. In this category, we evaluate:
(3) Hypergraph-based Models. Hypergraph modeling has become the state-of-the-art approach in EHR analysis. We select several representative methods including:
-
•
HGNN (Feng et al., 2019): Hypergraph Neural Network, a hypergraph model that learns the hidden representation via high-order structures.
-
•
HyperGCN (Yadati et al., 2019): Hypergraph Convolutional Network, a model that uses convolution for semi-supervised learning based on higher-order graph modeling.
-
•
HCHA (Bai et al., 2021): Hypergraph Convolution and Hypergraph Attention, a hypergraph model that integrates both convolution and attention mechanisms.
- •
We also compare several clustering methods with the default DEC in TACCO in terms of the clustering quality:
-
•
HDBSCAN (McInnes and Healy, 2017): Hierarchical Density-Based Spatial Clustering of Applications with Noise, a clustering algorithm that identifies clusters of varying densities by building a hierarchy of clusters using a density-based approach.
-
•
IDEC (Guo et al., 2017): Improved Deep Embedded Clustering, which improves DEC by introducing an additional autoencoder for embedding reconstructions.
-
•
DCC (Zhang et al., 2020): Deep Constraint Clustering, which explores different constraints that benefit the clustering performance. In our implementation, we choose a global size constraint that assumes each cluster should be approximately the same size.
Implementation Details. All the experiments are run on one NVIDIA H100 Tensor Core GPU. We implement most of our experiments using PyTorch111https://pytorch.org/. For traditional ML baselines, we implement the code with scikit-learn222https://scikit-learn.org/. For the other baselines, we follow the original settings suggested by the authors to train them. For our TACCO, we use Adam optimizers for all modules and tune the learning rates in . The frozen SapBERT encoder is implemented from Hugging Face333https://huggingface.co/cambridgeltl/SapBERT-from-PubMedBERT-fulltext. To ensure a fair comparison, we strictly adhere to the hyperparameter settings of the backbone hypergraph (Xu et al., 2023), with layers, heads, and as the hidden feature dimension in each hypergraph layer. For our best model in Table 2, we set , , , and . The datasets are split into train/validation/test sets by 7:1:2. For the training, we warm up the hypergraph transformer alone with 100 epochs. For further insights into our hyperparameter selection, please refer to Sec. 3.
4.2. Overall Performance Comparison
We perform two downstream tasks, i.e., the phenotype classification on MIMIC-III and the CVD risk prediction on CRADLE, to evaluate the predictive performance of our proposed TACCO. The comparison with other baselines we discuss in Sec. 4.1 is presented in Table 2. It is evident that TACCO consistently outperforms all baselines on four metrics across both datasets, with DEC performing the best as the clustering module. We can observe a significant improvement of 31.25% on top of the traditional ML models, which often suffer from the sparse nature of large-scale EHR networks. TACCO also gains an improvement of 12.36% over the two graph-based models. These notable improvements highlight the effectiveness of modeling higher-order relations within complex EHR data.
Hypergraph-based models such as HCHA demonstrate better results compared to the traditional ones as they model EHR data beyond pairwise relations and learn robust representations. Compared to these advanced approaches, TACCO still maintains its lead by an average improvement of 7.89% across two datasets. Compared with the suboptimal HypEHR, our model raises the overall performance by 5.26%. These results further validate the effectiveness of our task-guided co-clustering in terms of improving downstream predicting.
4.3. In-depth Model Analysis
Model Ablation. We conduct detailed ablation studies to better understand the efficacy of different components in TACCO. As shown in Table 3, we observe a significant improvement in all four metrics when semantic information is involved compared to the backbone model. This suggests that clinical concept semantics are vital in providing more information for structured modeling. Additionally, both node and hyperedge clustering techniques improve the model’s predictive power, with hyperedge clustering bringing a slightly better gain. The model’s performance is further improved by equipping it with cross-domain alignment loss, which minimizes the distance between similar cluster centroids to generate more consistent results. Optimal performance is achieved when all the clustering and aligning components are integrated. This highlights the collective contribution of all four proposed components towards the enhanced model performance, with better interpretability as an additional benefit as shown in Sec. 4.5.
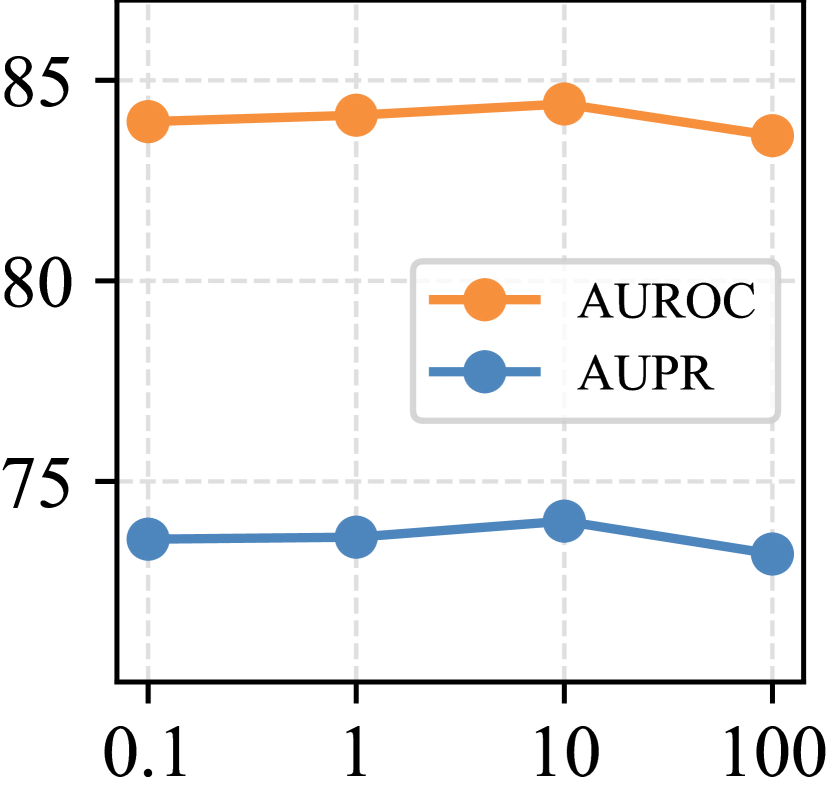
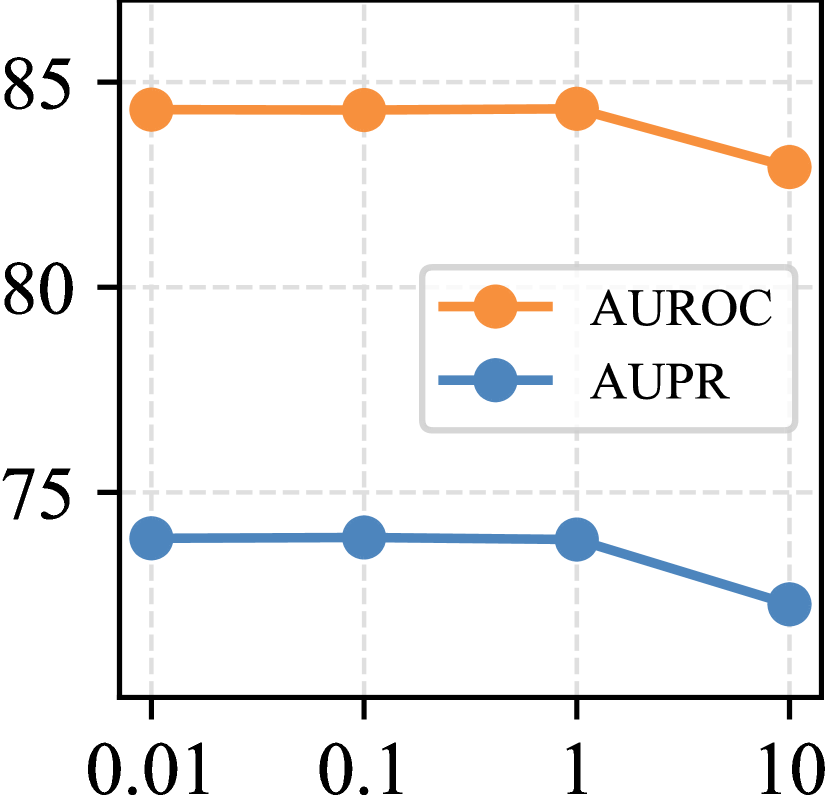
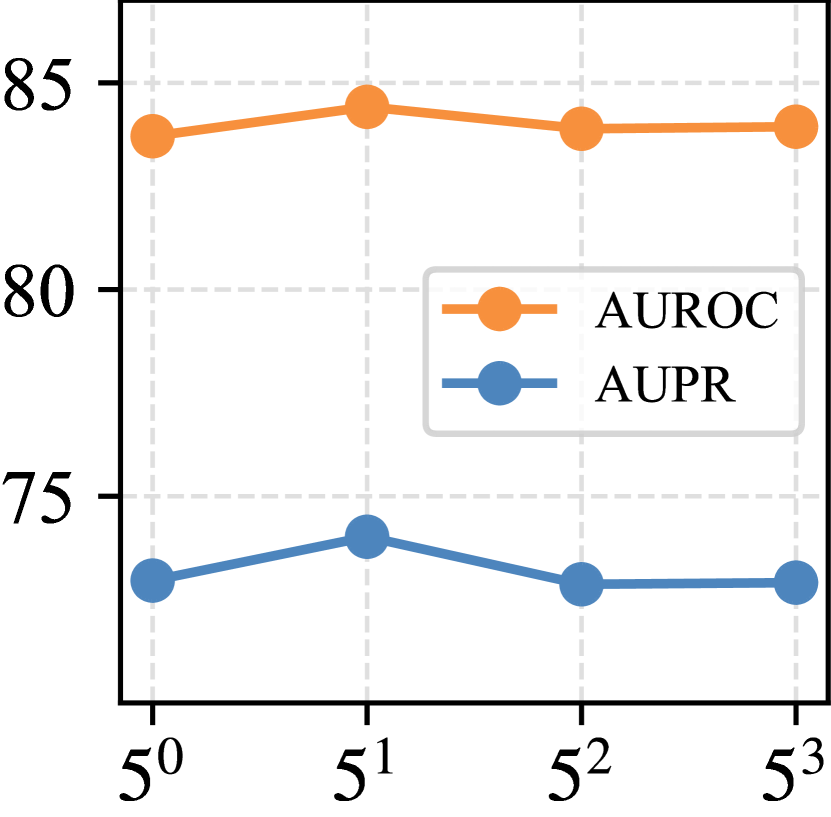
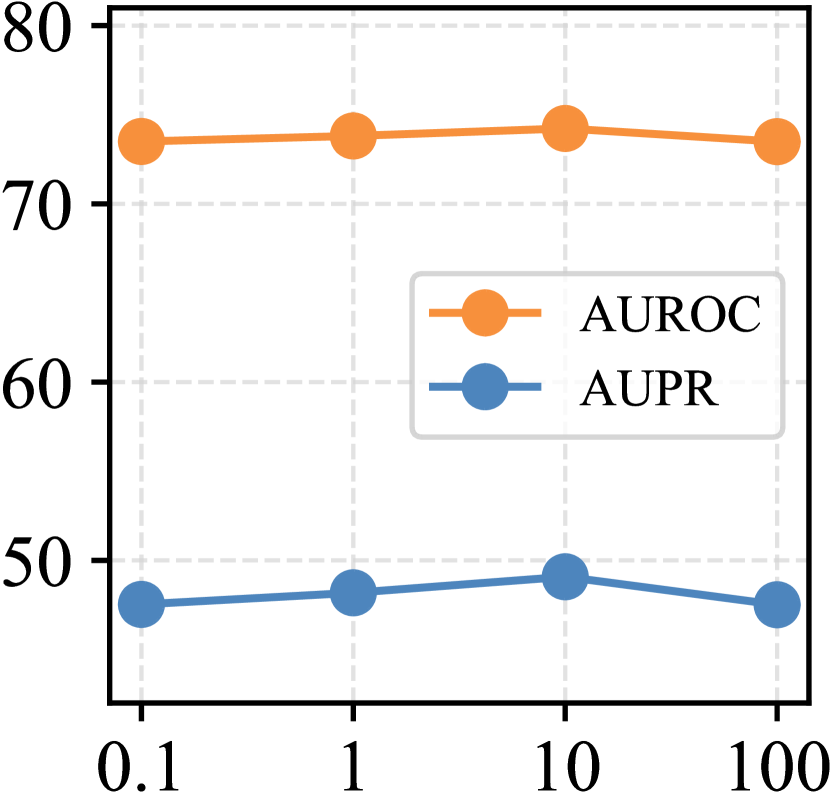

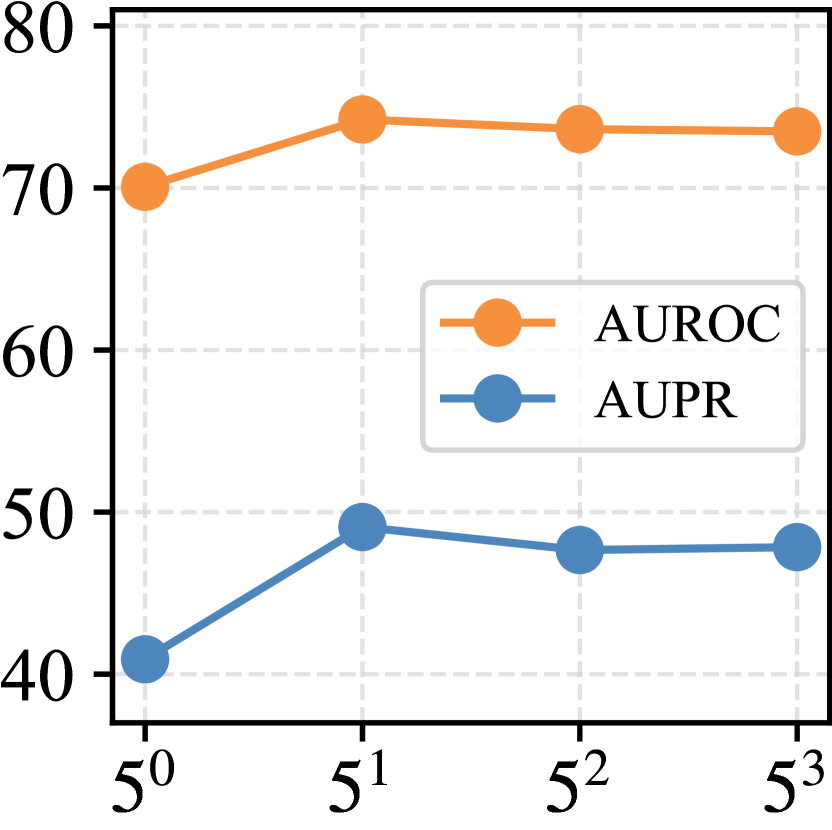
Hyperparameter Study. We analyze the impact of important hyperparameters in our TACCO model, which includes the loss weight parameters and in Eq. (15), and the number of clusters . We vary the contribution of different terms in Eq. (15) by adjusting their respective loss weights, as their numerical values are at different scales. The results are displayed in Figure 3. Our findings indicate that the best performance is attained when is set at 10 and is set at 0.1. We also change the number of clusters and select the value that yielded the best performance for the model.
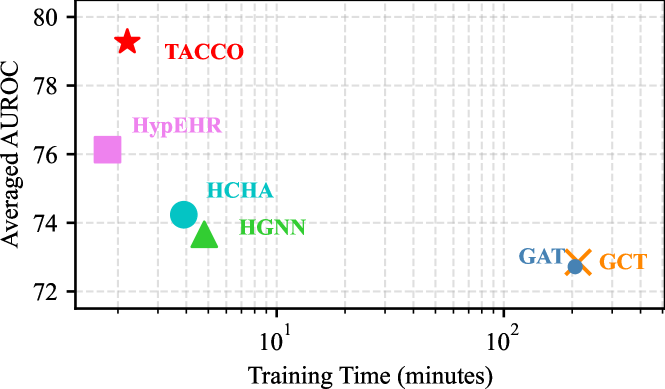
Efficiency Study. Efficiency experiments on our downstream tasks reveal that TACCO achieves the best trade-off of efficiency and performance. As shown in Figure 4, while TACCO’s training time is slightly longer than HypEHR’s by less than a minute, it achieves the highest AUROC scores in both MIMIC-III and CRADLE datasets. TACCO also easily outperforms other graph-based and hypergraph-based models. Especially for GCT and GAT, their extended training times can be attributed to their lack of hypergraph architecture, which results in significant computational overhead due to the need to flatten all hyperedges.
| Model | MIMIC-III | CRADLE | ||
|---|---|---|---|---|
| HDBSCAN | 0.1270 | 0.4186 | 0.0399 | 0.0461 |
| K-means () | 0.4131 | 0.8811 | 0.1715 | 0.2313 |
| K-means () | 0.2852 | 0.6350 | 0.1136 | 0.1531 |
| TACCO () | ||||
| w/ DCC | 0.0959 | 0.3476 | 0.1390 | 0.1441 |
| w/ IDEC | 0.4993 | 0.7639 | 0.2197 | 0.2226 |
| w/ DEC | 0.4999 | 0.8881 | 0.3033 | 0.5083 |
| TACCO () | ||||
| w/ DCC | 0.1209 | 0.2834 | 0.1717 | 0.0879 |
| w/ IDEC | 0.4877 | 0.7648 | 0.2044 | 0.2204 |
| w/ DEC | 0.5849 | 0.7888 | 0.2242 | 0.3727 |


4.4. Clustering Analysis
To investigate the quality of our co-clustering assignment, we run the model on the CRADLE dataset with and , respectively. The high-dimensional embeddings of nodes and hyperedges are then projected into a shared 2D space via t-SNE (Van der Maaten and Hinton, 2008). The visualizations are presented in Figure 5, with (a), (c), and (e) from the first model with , as well as (b), (d), and (f) from the second model with . The clustering outcomes reveal that, regardless of whether 5 or 10 clusters are targeted, the results consistently form 3-4 major distinct clusters. This consistency highlights the model’s stable ability to capture the major patterns underlying the interactions of clinical concepts and patient visits within EHR data. Notably, the clusters on hyperedges and ground-truth CVD labels on hyperedges demonstrate a certain level of concordance. When , the cyan cluster in panel (c) (denoted as Subtype#1) largely coincides with the population diagnosed with CVD. This indicates that our self-supervised clustering on hyperedges is significantly guided by signals from the specific downstream disease prediction task. Such guiding signals are further propagated to the node clusters through our contrastive alignment objective in Eq. (13), as evidenced by the similarity in color distributions observed between panels (a) and (c), as well as (b) and (d).
From a more quantitative perspective, we provide a clustering comparison on MIMIC-III and CRADLE datasets in Table 4 with HDBSCAN (McInnes and Healy, 2017) and K-means applied post-training at the final epoch of the hypergraph model. We also discuss the how different deep clustering methods (IDEC (Guo et al., 2017) and DCC (Zhang et al., 2020)) perform in our framework. We take the Silhouette Coefficient as our metric, which offers a robust measure of cluster purity and separation. The Silhouette Coefficient is defined as , where is the average intra-cluster distance, i.e., cohesion, and is the average distance to the nearest cluster that is not part of, i.e., separation. We can observe that TACCO using the default DEC (Sec. 3.3) generates clusters with the highest quality in both nodes and hyperedges. The other deep clustering methods show suboptimal results potentially due to additional learning targets they introduce. The Silhouette Coefficient of TACCO averaged over 5 runs is 0.5213, which is 77.93% higher than the average of HDBSCAN and K-means. These quantitative results further demonstrate our method’s superior capability in discerning and grouping clinical concepts and patient visits within the EHR datasets.
4.5. Case Studies
To demonstrate the aligned clusters of clinical concepts and patient visits generated by TACCO, as well as their practical values in clinical settings, we illustrate actual clinical concepts and patient visits from our clusters of nodes and hyperedges. Specifically, we select 3 clusters from each of the two domains corresponding to the cyan, pink, and purple colors in Figure 5 (a) and (c). From the node clusters, we select the top 15 clinical concept candidates based on the clustering assignment probability from Eq. (8). Those are presented in the left panel of Table 5. Notably, we mark the subtype-indicative clinical concepts with color after consulting a model-blinded clinical expert. Similarly, from the hyperedge clusters, we select 3 patient visits based on the clustering assignment probability from Eq. (8), and illustrate each of them with the top 5 clinical concepts determined by the highest attention weights within the hypergraph transformer. They are shown in the right panel of Table 5. We also color the subtype-indicative clinical concepts as suggested by the clinical expert. As shown in Table 5, we can observe a notable overlap in clinical concepts between the clinical concept and patient visit clusters across all three subtypes, which validates the effectiveness of our cluster alignment in producing consistent clusters.
![[Uncaptioned image]](/html/2406.10061/assets/x16.png)
For Subtype#1, after consulting with the clinical expert, we interpret this subtype as indicative of a heightened risk for CVD. In general, the presence of medications like Imidazoline Derivatives and conditions such as Severe Hyperglycaemia and End-stage Renal Disease signals a significant cardiovascular risk (Head and Mayorov, 2006; Laakso, 1999; Foley et al., 1998). Diagnostic practices, including Preoperative Cardiovascular Evaluations and Electrocardiograms, further enhance the probability of cardiovascular disease presence in this subtype (Bhatia and Dorian, 2018). We identify that 34 out of the top 50 patients were confirmed to have CVD a year after their visits, which is consistent with the distribution in Figure 5 where dots of Subtype#1 in Figure 5 (c) largely align with dots with CVD labels in Figure 5 (e). The records of Patient#681 and #716, who are diagnosed with CVD, also align closely with the representative clinical concepts within Subtype#1.
Subtype#2 emphasizes metabolic and thyroid disorders. It delineates conditions closely associated with Type 2 Diabetes Mellitus. Within the top 50 patients in the cluster aligning with Subtype#2, 20 individuals are diagnosed with CVD, which indicates a comparatively moderate association with cardiovascular risk. Unlike Subtype#1, Subtype#2 is not marked by the use of potent pharmacological interventions and the presence of severe disease states. This demonstrates that TACCO is capable of capturing nuanced disease subtypes, thereby facilitating more targeted monitoring and intervention strategies in clinical practice for these subgroups. This advantage could potentially mitigate patients’ risk of progressing to cardiovascular diseases.
Subtype#3 focuses on orthopedic and neurologic injuries affecting multiple body regions, such as Sprain of Knee and Closed Fracture Lumbar Vertebra, with no direct ties to CVD, as evidenced by the ground truth distribution in Figure 5(e). We also cannot observe obvious patients with CVD-related patterns. Instead, most of them share similar clinical records in musculoskeletal disorders, which are likely negatively correlated with CVD risk. This highlights that our deep co-clustering benefits from the guidance of specific disease predictions, and thereby efficiently identifies subtypes that are positively, weakly, or negatively correlated with a particular disease, such as CVD. These insights are advantageous for medical professionals in conducting precise clinical stratification and management.
5 CONCLUSION AND DISCUSSION
In this work, we introduce TACCO, a novel framework that jointly clusters clinical concepts and patient visits in EHR data. Specifically, we encode semantic information within the clinical concepts into a hypergraph transformer. We design a deep self-supervised co-clustering module that jointly learns a soft clustering assignment for both nodes and hyperedges. The learned clusters are then aligned through a contrastive learning objective for capturing the consistent patterns between clinical concepts and patient visits within the EHR data. Our comprehensive experiments demonstrate the superior performance of TACCO, which is 5.26% higher than the vanilla hypergraph backbone model and 31.25% higher than other ML baselines. Notably, TACCO is capable of discerning insightful disease subtypes related to specific diseases at different levels, enabling more targeted clinical interventions.
Currently, TACCO is in a stage of secondary data analysis. It has been tested on data from both academic benchmark MIMIC-III, and Project CRADLE, which is an actual application within the Emory Hospital Systems that provides substantial support to medical staff and researchers in the greater Atlanta and Georgia areas. Specifically, this work contributes to Project CRADLE’s ongoing efforts in cardiovascular and diabetes disease management over 48 thousand patients. In a significant expansion, the method is also being adapted for use in the National Institutes of Health’s All of Us444https://allofus.nih.gov/ research program. This deployment aims to harness the diverse medical records of over 38 thousand participants across the United States. Looking forward, we aim to broaden TACCO’s applicational scope by extending the framework to accommodate large-scale, heterogeneous datasets that contain more modalities.
Acknowledgements.
Research reported in this publication was mainly supported by the National Institute of Diabetes and Digestive and Kidney Diseases of the National Institutes of Health under Award Number K25DK135913. The research also receives partial support from the National Science Foundation under Award Number IIS-2145411, IIS-2312502, and IIS-2319449. Opinions expressed herein are those of the authors and do not necessarily represent the views of the U.S. Government. The research has also benefited from the Microsoft Accelerating Foundation Models Research (AFMR) grant program.References
- (1)
- Ahlqvist et al. (2018) Emma Ahlqvist, Petter Storm, Annemari Käräjämäki, Mats Martinell, Mozhgan Dorkhan, Annelie Carlsson, Petter Vikman, Rashmi B Prasad, Dina Mansour Aly, Peter Almgren, et al. 2018. Novel subgroups of adult-onset diabetes and their association with outcomes: a data-driven cluster analysis of six variables. The lancet Diabetes & endocrinology 6, 5 (2018), 361–369.
- Bai et al. (2021) Song Bai, Feihu Zhang, and Philip HS Torr. 2021. Hypergraph convolution and hypergraph attention. Pattern Recognition 110 (2021), 107637.
- Bhatia and Dorian (2018) R Sacha Bhatia and Paul Dorian. 2018. Screening for cardiovascular disease risk with electrocardiography. JAMA Internal Medicine 178, 9 (2018), 1163–1164.
- Chen and Guestrin (2016) Tianqi Chen and Carlos Guestrin. 2016. Xgboost: A scalable tree boosting system. In Proceedings of the 22nd acm sigkdd international conference on knowledge discovery and data mining. 785–794.
- Chen and He (2021) Xinlei Chen and Kaiming He. 2021. Exploring simple siamese representation learning. In Proceedings of the IEEE/CVF conference on computer vision and pattern recognition. 15750–15758.
- Cheng et al. (2016) Yu Cheng, Fei Wang, Ping Zhang, and Jianying Hu. 2016. Risk prediction with electronic health records: A deep learning approach. In Proceedings of the 2016 SIAM international conference on data mining. SIAM, 432–440.
- Chien et al. (2021) Eli Chien, Chao Pan, Jianhao Peng, and Olgica Milenkovic. 2021. You are allset: A multiset function framework for hypergraph neural networks. arXiv preprint arXiv:2106.13264 (2021).
- Choi et al. (2016a) Edward Choi, Mohammad Taha Bahadori, Andy Schuetz, Walter F Stewart, and Jimeng Sun. 2016a. Doctor ai: Predicting clinical events via recurrent neural networks. In Machine learning for healthcare conference. PMLR, 301–318.
- Choi et al. (2017) Edward Choi, Mohammad Taha Bahadori, Le Song, Walter F Stewart, and Jimeng Sun. 2017. GRAM: graph-based attention model for healthcare representation learning. In Proceedings of the 23rd ACM SIGKDD international conference on knowledge discovery and data mining. 787–795.
- Choi et al. (2016b) Edward Choi, Mohammad Taha Bahadori, Jimeng Sun, Joshua Kulas, Andy Schuetz, and Walter Stewart. 2016b. Retain: An interpretable predictive model for healthcare using reverse time attention mechanism. Advances in neural information processing systems 29 (2016).
- Choi et al. (2020) Edward Choi, Zhen Xu, Yujia Li, Michael Dusenberry, Gerardo Flores, Emily Xue, and Andrew Dai. 2020. Learning the graphical structure of electronic health records with graph convolutional transformer. In Proceedings of the AAAI conference on artificial intelligence, Vol. 34. 606–613.
- Choi et al. (2016c) Youngduck Choi, Chill Yi-I Chiu, and David Sontag. 2016c. Learning low-dimensional representations of medical concepts. AMIA Summits on Translational Science Proceedings 2016 (2016), 41.
- Christensen et al. (2022) Diana Hedevang Christensen, Sia K Nicolaisen, Emma Ahlqvist, Jacob V Stidsen, Jens Steen Nielsen, Kurt Hojlund, Michael H Olsen, Sonia García-Calzón, Charlotte Ling, Jørgen Rungby, et al. 2022. Type 2 diabetes classification: a data-driven cluster study of the Danish Centre for Strategic Research in Type 2 Diabetes (DD2) cohort. BMJ Open Diabetes Research and Care 10, 2 (2022), e002731.
- Cortes and Vapnik (1995) Corinna Cortes and Vladimir Vapnik. 1995. Support-vector networks. Machine learning 20 (1995), 273–297.
- Deng et al. (2019) Zhijie Deng, Yucen Luo, and Jun Zhu. 2019. Cluster alignment with a teacher for unsupervised domain adaptation. In Proceedings of the IEEE/CVF international conference on computer vision. 9944–9953.
- Ester et al. (1996) Martin Ester, Hans-Peter Kriegel, Jörg Sander, Xiaowei Xu, et al. 1996. A density-based algorithm for discovering clusters in large spatial databases with noise. In kdd, Vol. 96. 226–231.
- Feng et al. (2019) Yifan Feng, Haoxuan You, Zizhao Zhang, Rongrong Ji, and Yue Gao. 2019. Hypergraph neural networks. In Proceedings of the AAAI conference on artificial intelligence, Vol. 33. 3558–3565.
- Foley et al. (1998) Robert N Foley, Patrick S Parfrey, and Mark J Sarnak. 1998. Clinical epidemiology of cardiovascular disease in chronic renal disease. American Journal of Kidney Diseases 32, 5 (1998), S112–S119.
- Fu et al. (2019) Tianfan Fu, Trong Nghia Hoang, Cao Xiao, and Jimeng Sun. 2019. Ddl: Deep dictionary learning for predictive phenotyping. In IJCAI: proceedings of the conference, Vol. 2019. NIH Public Access, 5857.
- Grill et al. (2020) Jean-Bastien Grill, Florian Strub, Florent Altché, Corentin Tallec, Pierre Richemond, Elena Buchatskaya, Carl Doersch, Bernardo Avila Pires, Zhaohan Guo, Mohammad Gheshlaghi Azar, et al. 2020. Bootstrap your own latent-a new approach to self-supervised learning. Advances in neural information processing systems 33 (2020), 21271–21284.
- Guidotti et al. (2019) Riccardo Guidotti, Anna Monreale, Fosca Giannotti, Dino Pedreschi, Salvatore Ruggieri, and Franco Turini. 2019. Factual and counterfactual explanations for black box decision making. IEEE Intelligent Systems 34, 6 (2019), 14–23.
- Gujral et al. (2013) Unjali P Gujral, R Pradeepa, Mary Beth Weber, KM Venkat Narayan, and Vishwanathan Mohan. 2013. Type 2 diabetes in South Asians: similarities and differences with white Caucasian and other populations. Annals of the New York Academy of Sciences 1281, 1 (2013), 51–63.
- Guo et al. (2017) Xifeng Guo, Long Gao, Xinwang Liu, and Jianping Yin. 2017. Improved deep embedded clustering with local structure preservation.. In Ijcai, Vol. 17. 1753–1759.
- Harutyunyan et al. (2019) Hrayr Harutyunyan, Hrant Khachatrian, David C Kale, Greg Ver Steeg, and Aram Galstyan. 2019. Multitask learning and benchmarking with clinical time series data. Scientific data 6, 1 (2019), 96.
- Head and Mayorov (2006) GA Head and DN Mayorov. 2006. Imidazoline receptors, novel agents and therapeutic potential. Cardiovascular & Hematological Agents in Medicinal Chemistry (Formerly Current Medicinal Chemistry-Cardiovascular & Hematological Agents) 4, 1 (2006), 17–32.
- Hosseini et al. (2018) Anahita Hosseini, Ting Chen, Wenjun Wu, Yizhou Sun, and Majid Sarrafzadeh. 2018. Heteromed: Heterogeneous information network for medical diagnosis. In Proceedings of the 27th ACM International Conference on Information and Knowledge Management. 763–772.
- Huang et al. (2014) Peihao Huang, Yan Huang, Wei Wang, and Liang Wang. 2014. Deep embedding network for clustering. In 2014 22nd International conference on pattern recognition. IEEE, 1532–1537.
- Huang et al. (2021) Yufang Huang, Yifan Liu, Peter AD Steel, Kelly M Axsom, John R Lee, Sri Lekha Tummalapalli, Fei Wang, Jyotishman Pathak, Lakshminarayanan Subramanian, and Yiye Zhang. 2021. Deep significance clustering: a novel approach for identifying risk-stratified and predictive patient subgroups. Journal of the American Medical Informatics Association 28, 12 (2021), 2641–2653.
- Johnson et al. (2016) Alistair Johnson, Tom Pollard, and Roger Mark. 2016. MIMIC-III clinical database (version 1.4). PhysioNet 10, C2XW26 (2016), 2.
- Johnson (1967) Stephen C Johnson. 1967. Hierarchical clustering schemes. Psychometrika 32, 3 (1967), 241–254.
- Laakso (1999) Markku Laakso. 1999. Hyperglycemia and cardiovascular disease in type 2 diabetes. Diabetes 48, 5 (1999), 937–942.
- Li et al. (2021) Yunfan Li, Peng Hu, Zitao Liu, Dezhong Peng, Joey Tianyi Zhou, and Xi Peng. 2021. Contrastive clustering. In Proceedings of the AAAI conference on artificial intelligence, Vol. 35. 8547–8555.
- Liu et al. (2015) Chuanren Liu, Fei Wang, Jianying Hu, and Hui Xiong. 2015. Temporal phenotyping from longitudinal electronic health records: A graph based framework. In Proceedings of the 21th ACM SIGKDD international conference on knowledge discovery and data mining. 705–714.
- Liu et al. (2021) Fangyu Liu, Ehsan Shareghi, Zaiqiao Meng, Marco Basaldella, and Nigel Collier. 2021. Self-Alignment Pretraining for Biomedical Entity Representations. In Proceedings of the 2021 Conference of the North American Chapter of the Association for Computational Linguistics: Human Language Technologies. 4228–4238.
- Liu et al. (2018) Jingshu Liu, Zachariah Zhang, and Narges Razavian. 2018. Deep ehr: Chronic disease prediction using medical notes. In Machine Learning for Healthcare Conference. PMLR, 440–464.
- Liu et al. (2014b) Siqi Liu, Sidong Liu, Weidong Cai, Sonia Pujol, Ron Kikinis, and Dagan Feng. 2014b. Early diagnosis of Alzheimer’s disease with deep learning. In 2014 IEEE 11th international symposium on biomedical imaging (ISBI). IEEE, 1015–1018.
- Liu et al. (2014a) Yiyi Liu, Quanquan Gu, Jack P Hou, Jiawei Han, and Jian Ma. 2014a. A network-assisted co-clustering algorithm to discover cancer subtypes based on gene expression. BMC bioinformatics 15, 1 (2014), 1–11.
- Liu et al. (2020) Zheng Liu, Xiaohan Li, Hao Peng, Lifang He, and S Yu Philip. 2020. Heterogeneous similarity graph neural network on electronic health records. In 2020 IEEE International Conference on Big Data (Big Data). IEEE, 1196–1205.
- Lloyd (1982) Stuart Lloyd. 1982. Least squares quantization in PCM. IEEE transactions on information theory 28, 2 (1982), 129–137.
- Lu and Uddin (2021) Haohui Lu and Shahadat Uddin. 2021. A weighted patient network-based framework for predicting chronic diseases using graph neural networks. Scientific reports 11, 1 (2021), 22607.
- L’heveder and Nolan (2013) Ronan L’heveder and Tim Nolan. 2013. International diabetes federation. Diabetes research and clinical practice 101, 3 (2013), 349–351.
- Ma et al. (2017) Fenglong Ma, Radha Chitta, Jing Zhou, Quanzeng You, Tong Sun, and Jing Gao. 2017. Dipole: Diagnosis prediction in healthcare via attention-based bidirectional recurrent neural networks. In Proceedings of the 23rd ACM SIGKDD international conference on knowledge discovery and data mining. 1903–1911.
- Ma et al. (2018) Fenglong Ma, Quanzeng You, Houping Xiao, Radha Chitta, Jing Zhou, and Jing Gao. 2018. Kame: Knowledge-based attention model for diagnosis prediction in healthcare. In Proceedings of the 27th ACM International Conference on Information and Knowledge Management. 743–752.
- Maiorino and Loscalzo (2023) Enrico Maiorino and Joseph Loscalzo. 2023. Phenomics and Robust Multiomics Data for Cardiovascular Disease Subtyping. Arteriosclerosis, Thrombosis, and Vascular Biology 43, 7 (2023), 1111–1123.
- McInnes and Healy (2017) Leland McInnes and John Healy. 2017. Accelerated hierarchical density based clustering. In 2017 IEEE International Conference on Data Mining Workshops (ICDMW). IEEE, 33–42.
- Menard (2002) Scott Menard. 2002. Applied logistic regression analysis. Number 106. Sage.
- Mikolov et al. (2013) Tomas Mikolov, Kai Chen, Greg Corrado, and Jeffrey Dean. 2013. Efficient estimation of word representations in vector space. arXiv preprint arXiv:1301.3781 (2013).
- Naraei et al. (2016) Parisa Naraei, Abdolreza Abhari, and Alireza Sadeghian. 2016. Application of multilayer perceptron neural networks and support vector machines in classification of healthcare data. In 2016 Future technologies conference (FTC). IEEE, 848–852.
- Nguyen et al. (2016) Phuoc Nguyen, Truyen Tran, Nilmini Wickramasinghe, and Svetha Venkatesh. 2016. Deepr: a convolutional net for medical records. IEEE journal of biomedical and health informatics 21, 1 (2016), 22–30.
- Nidheesh et al. (2020) N Nidheesh, KA Abdul Nazeer, and PM Ameer. 2020. A Hierarchical Clustering algorithm based on Silhouette Index for cancer subtype discovery from genomic data. Neural Computing and Applications 32 (2020), 11459–11476.
- Ochoa and Mustafa (2022) Juan G Diaz Ochoa and Faizan E Mustafa. 2022. Graph neural network modelling as a potentially effective method for predicting and analyzing procedures based on patients’ diagnoses. Artificial Intelligence in Medicine 131 (2022), 102359.
- Pang et al. (2021) Xueqin Pang, Christopher B Forrest, Félice Lê-Scherban, and Aaron J Masino. 2021. Prediction of early childhood obesity with machine learning and electronic health record data. International journal of medical informatics 150 (2021), 104454.
- Parikh et al. (2023) Hemang M Parikh, Cassandra L Remedios, Christiane S Hampe, Ashok Balasubramanyam, Susan P Fisher-Hoch, Ye Ji Choi, Sanjeet Patel, Joseph B McCormick, Maria J Redondo, and Jeffrey P Krischer. 2023. Data Mining Framework for Discovering and Clustering Phenotypes of Atypical Diabetes. The Journal of Clinical Endocrinology & Metabolism 108, 4 (2023), 834–846.
- Perozzi et al. (2014) Bryan Perozzi, Rami Al-Rfou, and Steven Skiena. 2014. Deepwalk: Online learning of social representations. In Proceedings of the 20th ACM SIGKDD international conference on Knowledge discovery and data mining. 701–710.
- Pham et al. (2016) Trang Pham, Truyen Tran, Dinh Phung, and Svetha Venkatesh. 2016. Deepcare: A deep dynamic memory model for predictive medicine. In Advances in Knowledge Discovery and Data Mining: 20th Pacific-Asia Conference, PAKDD 2016, Auckland, New Zealand, April 19-22, 2016, Proceedings, Part II 20. Springer, 30–41.
- Rousseeuw (1987) Peter J Rousseeuw. 1987. Silhouettes: a graphical aid to the interpretation and validation of cluster analysis. Journal of computational and applied mathematics 20 (1987), 53–65.
- Shah and Luo (2017) Setu Shah and Xiao Luo. 2017. Extracting modifiable risk factors from narrative preventive healthcare guidelines for EHR integration. In 2017 IEEE 17th International Conference on Bioinformatics and Bioengineering (BIBE). IEEE, 514–519.
- Shang et al. (2019) Junyuan Shang, Tengfei Ma, Cao Xiao, and Jimeng Sun. 2019. Pre-training of graph augmented transformers for medication recommendation. In International Joint Conference on Artificial Intelligence. International Joint Conferences on Artificial Intelligence.
- Shen et al. (2007) Jess J Shen, Phil Hyoun Lee, Jeanette JA Holden, and Hagit Shatkay. 2007. Using cluster ensemble and validation to identify subtypes of pervasive developmental disorders. In AMIA Annual Symposium Proceedings, Vol. 2007. American Medical Informatics Association, 666.
- Shen et al. (2009) Ronglai Shen, Adam B Olshen, and Marc Ladanyi. 2009. Integrative clustering of multiple genomic data types using a joint latent variable model with application to breast and lung cancer subtype analysis. Bioinformatics 25, 22 (2009), 2906–2912.
- Su et al. (2020) Chang Su, Robert Aseltine, Riddhi Doshi, Kun Chen, Steven C Rogers, and Fei Wang. 2020. Machine learning for suicide risk prediction in children and adolescents with electronic health records. Translational psychiatry 10, 1 (2020), 413.
- Sun et al. (2021) Chenxi Sun, Hongna Dui, and Hongyan Li. 2021. Interpretable time-aware and co-occurrence-aware network for medical prediction. BMC medical informatics and decision making 21, 1 (2021), 1–12.
- Sutton et al. (2020) Reed T Sutton, David Pincock, Daniel C Baumgart, Daniel C Sadowski, Richard N Fedorak, and Karen I Kroeker. 2020. An overview of clinical decision support systems: benefits, risks, and strategies for success. NPJ digital medicine 3, 1 (2020), 17.
- Van der Maaten and Hinton (2008) Laurens Van der Maaten and Geoffrey Hinton. 2008. Visualizing data using t-SNE. Journal of machine learning research 9, 11 (2008).
- Varghese et al. (2021) Jithin Sam Varghese, Joyce C Ho, Ranjit Mohan Anjana, Rajendra Pradeepa, Shivani A Patel, Saravanan Jebarani, Viswanathan Baskar, KM Venkat Narayan, and Viswanathan Mohan. 2021. Profiles of Intraday glucose in type 2 diabetes and their association with complications: an analysis of continuous glucose monitoring data. Diabetes technology & therapeutics 23, 8 (2021), 555–564.
- Vaswani et al. (2017) Ashish Vaswani, Noam Shazeer, Niki Parmar, Jakob Uszkoreit, Llion Jones, Aidan N Gomez, Łukasz Kaiser, and Illia Polosukhin. 2017. Attention is all you need. Advances in neural information processing systems 30 (2017).
- Veličković et al. (2017) Petar Veličković, Guillem Cucurull, Arantxa Casanova, Adriana Romero, Pietro Lio, and Yoshua Bengio. 2017. Graph attention networks. arXiv preprint arXiv:1710.10903 (2017).
- Wang and Wang (2023) Richard C Wang and Zhixiang Wang. 2023. Precision medicine: Disease subtyping and tailored treatment. Cancers 15, 15 (2023), 3837.
- Wang et al. (2022) Shuang Wang, Dong Zhao, Chi Zhang, Yuwei Guo, Qi Zang, Yu Gu, Yi Li, and Licheng Jiao. 2022. Cluster Alignment With Target Knowledge Mining for Unsupervised Domain Adaptation Semantic Segmentation. IEEE Transactions on Image Processing 31 (2022), 7403–7418.
- Xie et al. (2016) Junyuan Xie, Ross Girshick, and Ali Farhadi. 2016. Unsupervised deep embedding for clustering analysis. In International conference on machine learning. PMLR, 478–487.
- Xu et al. (2023) Ran Xu, Mohammed K Ali, Joyce C Ho, and Carl Yang. 2023. Hypergraph Transformers for EHR-based Clinical Predictions. AMIA Summits on Translational Science Proceedings 2023 (2023), 582.
- Xu et al. (2022) Ran Xu, Yue Yu, Chao Zhang, Mohammed K Ali, Joyce C Ho, and Carl Yang. 2022. Counterfactual and factual reasoning over hypergraphs for interpretable clinical predictions on ehr. In Machine Learning for Health. PMLR, 259–278.
- Yadati et al. (2019) Naganand Yadati, Madhav Nimishakavi, Prateek Yadav, Vikram Nitin, Anand Louis, and Partha Talukdar. 2019. Hypergcn: A new method for training graph convolutional networks on hypergraphs. Advances in neural information processing systems 32 (2019).
- Yang et al. (2020) Carl Yang, Liyuan Liu, Mengxiong Liu, Zongyi Wang, Chao Zhang, and Jiawei Han. 2020. Graph clustering with embedding propagation. In 2020 IEEE International Conference on Big Data (Big Data). IEEE, 858–867.
- Yang et al. (2021) Chaoqi Yang, Cao Xiao, Fenglong Ma, Lucas Glass, and Jimeng Sun. 2021. SafeDrug: Dual Molecular Graph Encoders for Recommending Effective and Safe Drug Combinations. In Proceedings of the 30th International Joint Conference on Artificial Intelligence, IJCAI 2021 (IJCAI International Joint Conference on Artificial Intelligence), Zhi-Hua Zhou (Ed.). International Joint Conferences on Artificial Intelligence, 3735–3741.
- Yang et al. (2016) Jianwei Yang, Devi Parikh, and Dhruv Batra. 2016. Joint unsupervised learning of deep representations and image clusters. In Proceedings of the IEEE conference on computer vision and pattern recognition. 5147–5156.
- Zhang et al. (2020) Hongjing Zhang, Sugato Basu, and Ian Davidson. 2020. A framework for deep constrained clustering-algorithms and advances. In Machine Learning and Knowledge Discovery in Databases: European Conference, ECML PKDD 2019, Würzburg, Germany, September 16–20, 2019, Proceedings, Part I. Springer, 57–72.
- Zhang et al. (2021) Xianli Zhang, Buyue Qian, Yang Li, Shilei Cao, and Ian Davidson. 2021. Context-aware and time-aware attention-based model for disease risk prediction with interpretability. IEEE Transactions on Knowledge and Data Engineering (2021).
- Zhang and Kiryu (2022) Yanting Zhang and Hisanori Kiryu. 2022. MODEC: an unsupervised clustering method integrating omics data for identifying cancer subtypes. Briefings in Bioinformatics 23, 6 (2022), bbac372.
- Zhao et al. (2023) Jing Zhao, Bowen Zhao, Xiaotong Song, Chujun Lyu, Weizhi Chen, Yi Xiong, and Dong-Qing Wei. 2023. Subtype-DCC: decoupled contrastive clustering method for cancer subtype identification based on multi-omics data. Briefings in Bioinformatics 24, 2 (2023), bbad025.