[1] organization=Department of Industrial Economics and Technology Management, Norwegian University of Science and Technology, addressline=Alfred Getz’ vei 3, city=7491 Trondheim, country=Norway \affiliation[2] organization=Institute for Industrial Production, Karlsruhe Institute of Technology, addressline=Hertzstr. 16, city=76187 Karlsruhe, country=Germany
Coordinated Trading Strategies for Battery Storage in Reserve and Spot Markets
Abstract
Quantity and price risks are key uncertainties market participants face in electricity markets with increased volatility, for instance, due to high shares of renewables. From day ahead until real-time, there is a large variation in the best available information, leading to price changes that flexible assets, such as battery storage, can exploit economically. This study contributes to understanding how coordinated bidding strategies can enhance multi-market trading and large-scale energy storage integration. Our findings shed light on the complexities arising from interdependencies and the high-dimensional nature of the problem. We show how stochastic dual dynamic programming is a suitable solution technique for such an environment. We include the three markets of the frequency containment reserve, day-ahead, and intraday in stochastic modelling and develop a multi-stage stochastic program. Prices are represented in a multidimensional Markov Chain, following the scheduling of the markets and allowing for time-dependent randomness. Using the example of a battery storage in the German energy sector, we provide valuable insights into the technical aspects of our method and the economic feasibility of battery storage operation. We find that capacity reservation in the frequency containment reserve dominates over the battery’s cycling in spot markets at the given resolution on prices in 2022. In an adjusted price environment, we find that coordination can yield an additional value of up to 12.5 %.
keywords:
Markov processes , OR in energy , Stochastic programming , Stochastic Dual Dynamic Programming , Battery storageThis work sheds light on the complexities arising from interdependencies and the high-dimensional nature of the coordinated bidding problem of a storage operator and shows how to derive an optimal trading strategy with SDDP.
We have developed a stochastic multi-market bidding model using SDDP for coordinated bidding under uncertainty of a battery storage operator across a total of three electricity markets (DA, ID and FCR).
At the model’s four-hour resolution, revenue-maximising bidding is dominated by the FCR market with limited advantages from coordination.
In another case, with adjusted price levels, coordinated bidding can result in up to 12.5 % higher revenues.
1 Introduction
Renewable energy sources (RES) supersede controllable power plants in the electricity system due to their economic competitiveness and the need to reduce carbon emissions [32, 24]. However, RES rely on weather conditions and are often located far from demand centres. This intensifies inflexibility issues in space and time [25, 10]. Due to RES’s limited predictability and semi-dispatchability, it is difficult to increase RES shares further and reduce controllable generation [6]. Increased demands for balancing capacity and reserves are expected to ensure the system balance. However, it can be observed from field studies that market design improvements and the introduction of the Intraday (ID) market have led to the opposite effect of reduced balancing needs [20]. The authors named this phenomenon the "German Balancing Paradox". Benefits from the integration of markets are not limited to Germany or the ID market. Sector coupling can leverage well-studied synergies from different energy markets [14]. The recent cost reductions and the ability to store energy with little lead times made battery storage a potential solution for reducing the need for backup capacity in the future. However, integrating battery storage into the markets is challenging. For batteries to be economically viable and to have a competitive edge in liberalised power markets, they require multiple revenue streams [7].
Multiple revenue streams can be achieved by participating in different electricity markets, potentially coordinating this participation for even higher revenue. Market coordination refers to a process of coordinating decisions across multiple markets, taking into account the expectations of subsequent markets [26]. Instead of a series of individual optimisations, market coordination determines optimal decisions across all markets. This approach includes the uncertainty of future parameters at the time of decision-making. In the context of battery storage, bidding for prices and quantities involves making decisions under uncertainty. There are inherent time gaps between bidding and market clearing and between market clearing and resource deployment across different markets. Battery storage operators can economically exploit these gaps, benefiting from price movements and risk diversification through portfolio optimisation. However, the complexity of multi-stage decision-making with time coupling constraints makes determining optimal trading strategies highly challenging, and it suffers heavily from the curse of dimensionality. This often leads to necessary simplifications in trading and valuation approaches, such as perfect foresight or insufficient representation of uncertainty.
Given these challenges, the main research question addressed in this paper is: Is the use of Stochastic Dual Dynamic Programming (SDDP) adequate to depict the storage operator’s problem for coordinated bidding in three markets under given computational and technical limitations while following the German market schedule? This paper aims to explore optimal strategies for battery storage operators in coordinated markets, providing insights into overcoming the inherent complexities and uncertainties.
In this paper, we develop a scalable method for multi-market battery storage bidding under uncertainty, which considers the sequential timing structure and utilises SDDP. We consider the intricate relationships between the times of bid submissions and market clearings, State-of-Charge (SoC) constraints, and dynamic price environment. By doing so, we develop a methodology that can be generalised to give insights into the economics of large energy storage capacities in the rapidly evolving energy landscape. We apply the method to a case study of a battery operator in Germany who can trade in the Day-ahead (DA), ID and the Frequency Containment Reserve (FCR) balancing market. Leveraging comprehensive data collected from the German electricity market for the year 2022, we assess the economics of large-scale storage in a period with high price volatility. We provide insights into optimal market participation by analysing bidding strategies that allow for multi-market coordination.
This paper is divided into several Sections. In Section 2, we provide a literature review on the advancements in coordination across markets and the use of SDDP as a solution technique for complex sequential decision problems. In Section 3, we introduce the trading problem of the battery operator and data processing in the German electricity market. We describe the structures of the involved markets and estimate a Markov chain. Then, we present the case study in Section 4 and simulate the policy. In Section 5, we present our findings and discuss them in Section 6. Finally, we conclude in Section 7 and point out suggestions for further research.
2 Literature Review
The literature review delves into the sequential market problem and its implications for coordinated bidding in electricity markets. We show how stochastic programming methods have evolved for selling electricity under the uncertainty of volatile prices. We highlight the application of SDDP in hydropower reservoir management and emphasise its effectiveness in dealing with complex multi-stage decisions. Additionally, we discuss various price modelling techniques essential for effective market participation. Our contribution bridges gaps in the literature by focusing on coordinating battery storage operations across three markets.
2.1 Sequential Markets and Coordinated Bidding
The use of stochastic programming methods for coordinated selling of electricity across multiple markets has been motivated by the goal to hedge the risk of selling now at volatile prices or in advance on future or options markets [13]. Over the years, this has been extended with the coordination of sequential short-term power markets [31, 5, 23].
Motivated by the high complexity of hydro reservoirs and their electricity production, stochastic dual dynamic programming has been developed and evolved to the de-facto standard solution technique in hydropower reservoir management where multi-stage decisions with time-coupling constraints over a longer time span require advanced solution methods [30, 34, 35]. Plazas et al. [31] and Fleten & Kristoffersen [11] link market coordination to the solution method of SDDP in the hydropower sellers’ problem under price uncertainty. Since then, many authors have investigated the complicated relationship between price and weather uncertainty by coordinated bidding using stochastic programming with a gradual improvement of methodology in the literature. Löhndorf et al. [27] added an exogenous Markov process that allows, in coordination with SDDP, an approximation of the value function of multiple connected hydro reservoirs. The technique, named approximate dual dynamic programming (ADDP), significantly increased computational performance.
An increase in computational resources and refining of the methodology over time allows the inclusion of more markets and stages. Boomsma et al. [5] consider a hydropower producer in the Nordics with coordination of bids in the DA and balancing market in the Nordics in 2010 with sequential dependencies of balancing prices on spot prices. The properties of the balancing market they describe share similarities with the ID market we know today. Ottesen et al. [28] extend coordination efforts to three sequential markets for selling demand-side flexibility but simplify the decision space by creating new models sequentially each time information is revealed and consolidating the number of stages to three for tractability. As a consequence, inter-market trading is limited. The influence of the gradual revealing of information with the ability to react between decisions becomes apparent with Wozabal & Rameseder [38] describing the time gap and complex interplay between markets and stages based on the flow of information. Löhndorf & Wozabal [26] explicitly model the coordination value at different examples of storages, including grid-connected battery storage, for two spot markets as a major extension for modelling a battery’s complicated time coupling constraints.
Despite the vast amount of literature, there is no consensus on the monetary benefits of coordination. Studies by Wozabal & Rameseder [38] and Löhndorf & Wozabal [26] find that a value for coordinating bids over markets exists and can be up to 20 %. In turn, Kongelf et al. [21] find only a small gain from coordination and further describe a dependency on portfolio size. Unwanted incentives for coordination exist, too. Boomsma et al. [5] find that under a two-price balancing setup (down-regulation balancing price, upregulation spot market price), it is financially beneficial to hold back capacity under some market conditions by providing down-regulation.
One element missing in the literature is coordinating short-term battery storage operations across spot and reserve markets while obeying the complex decision structure between bidding and execution. We aim to investigate this in the current work. With a three-day planning horizon, we position ourselves between daily operational and long-term models. Furthermore, we coordinate across a total of three markets.
2.2 Price Modelling
With interactions between reserve and spot market prices, a correct representation of price movements is important to train effective trading strategies under a reasonable computational effort. While spot markets and their respective prices have received considerable attention (see, e.g. [28, 38, 26]), academic research on balancing market prices, like the FCR, is sparse. The few contributions point out difficulties in modelling. Baetens et al. [3] highlight the challenges associated with calibrating forecasting models while Backe et al. [2] question the significance of predictive information with balancing markets from historical data. Other works on bidding in balancing markets consider market structures different to what is used now in Germany: Klæboe et al. [19] benchmark various models for predicting prices and volumes of the Norwegian balancing market, some in combination with spot prices. Their depiction of balancing markets in Norway at the time shares properties with the ID market of today. The authors find that price calibrations are complex and conclude: "[…] the volume and the premium in the balancing market are random. In fact, it could be interpreted as a sign of an efficient electricity market that it is impossible to predict the balancing market price " [19]. Boomsma et al. [5] find strong autocorrelations and cross-correlations between the spot and balancing markets. Specifically, the German balancing market seems to suffer from additional intricacy, as it "is known for hardly explainable prices, supposedly due to a high market concentration" [23].
Another aspect is the choice of methodology for analysing and constructing scenarios from historical data. Previous works have explored various methods, including Autoregressive Integrated Moving Average (ARIMA) models [19], Seasonal Autoregressive Integrated Moving Average (SARIMA) models [5, 3], Seasonal Auto-Regressive Integrated Moving Average with exogenous factors (SARIMAX) [22], neuronal networks [22] and fixed prices approach [16].111Price modelling success might be dependent on the training data. It is therefore important to mention that even recent works by the authors of Baetens et al. [3], Kraft et al. [22] exclusively used a now obsolete German market scheme, lasting until July 1st, 2020, that involved daily availability auctions rather than the more recent four-hour interval structure. The recent market regime change means that there is a scarcity of training data to calibrate advanced models for this market.
2.3 Contribution
The paper makes a threefold contribution to the field. It introduces a (1) multi-stage stochastic decision model for dispatchable battery storage. We add a balancing service to the two distinct spot markets (e.g., the FCR, DA and ID markets) and effectively coordinate among them. To maintain computational tractability, we replicate the real-time bidding processes at a reduced resolution. We derive decision policies under uncertainty by using SDDP as a solution method. The advantage of this method is that it helps mitigate the curse of dimensionality of stochastic programming while we are significantly more training data-efficient than big-data approaches.
As a prerequisite for sound decision-making, we construct and calibrate (2) econometric models for price processes. These price models are calibrated on the difficult market circumstances of the year 2022 data and prove that a good representation of stochastic price behaviour is possible from a small amount of data. By separating market environment from intrinsic stochasticity, we ensure broad applicability, which can serve as a blueprint for related studies.
The developed approach can be used for (3) valuation of model battery economics with multiple revenue streams. While arbitrage operations within or across spot market segments are discussed in the literature at length, this paper provides insights into the operation and trading strategies when considering more than two market segments. We compare profits within individual markets and explore the additional value generated through coordinated operations. Thereby, we model realistic trading behaviour under uncertainty and do not rely on perfect foresight assumptions. The method can be used to determine the value of coordination for a battery over time and across markets, shedding light on multi-market battery business models. The German market in our case study serves as an illustrative example, but the application can be generalised and applied to short-term markets worldwide.
3 Coordinated Battery Trading
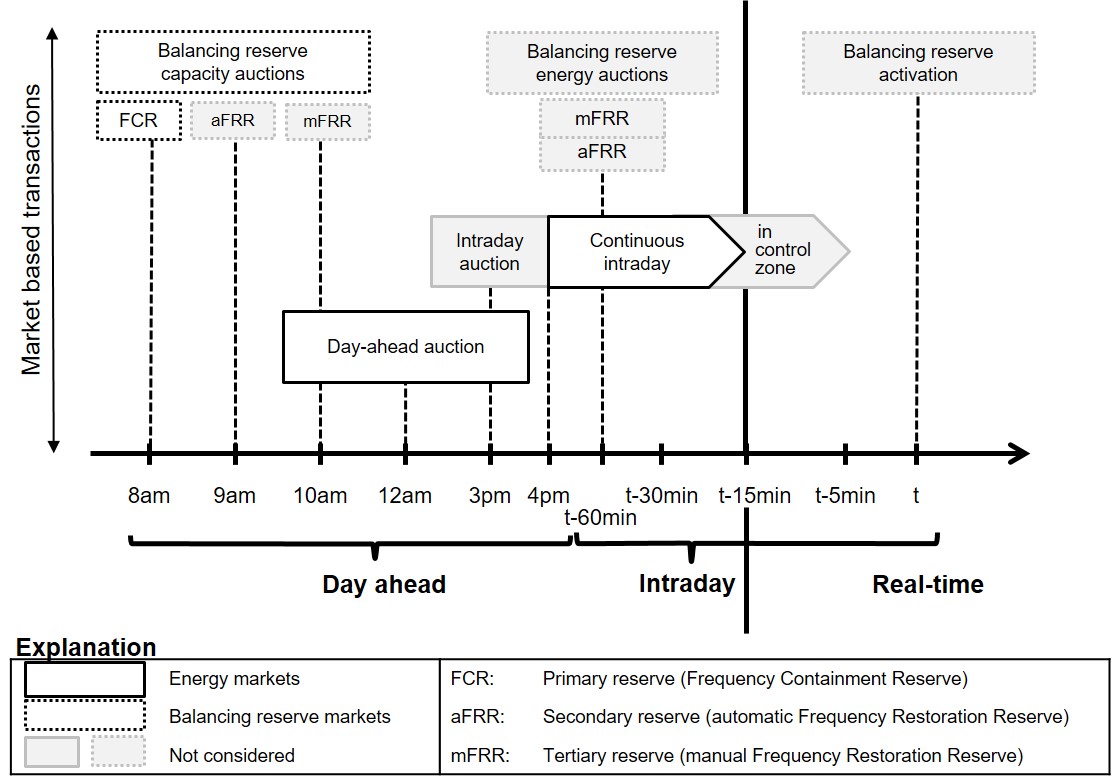
The battery storage operation problem involves deciding on the markets, quantities, and timing of bids to maximise revenue. Unlike traditional assets, batteries have no long lead times for operation, making battery storage highly flexible to react to price changes. From market bidding to real-time, there lies a significant variation in the best available information. This leads to market volatility and uncertainty that flexible assets, such as battery storage, can exploit economically. Figure 1 shows the schedule of electricity markets. Power can be reserved in the FCR balancing market before any energy market closes. The DA market opens after and is typically cleared from 1 p.m. to 2 p.m. daily. DA price quantity pairs are available for each hour of the next day. Updated information, mostly influenced by weather and RES proportion [17], requires the market participants to correct their DA position. These adjusted quantities are traded in the ID market until 30 minutes before delivery.
The complexity of the problem stems from its multidimensional nature, arising from the complex interplay between markets, time coupling constraints of the battery, and the multi-day optimisation horizon. To cope with the market sequence’s complexity, traders can simplify decision-making by (1) focusing only on a subset of markets, (2) making sequential decisions following the market schedule, (3) limiting the foresight and planning horizon, (4) neglecting information about uncertainty or (5) expanding the market intervals to fewer decision periods. Our trading model builds on three coordinated markets on a three-day planning horizon, does not decompose the problem sequentially, considers a realistic representation of uncertainty and only shortens the market’s intervals to four hours.
3.1 Market Structures
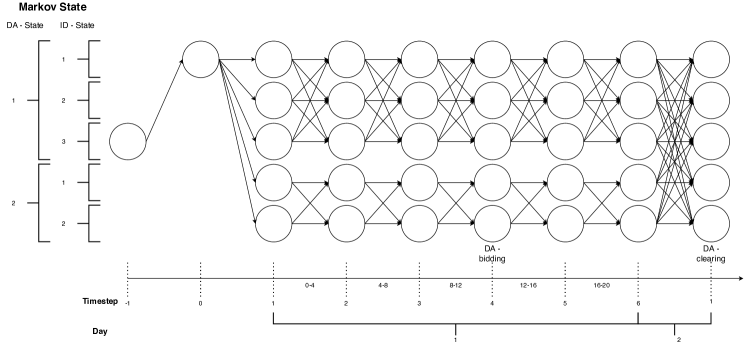
This Section describes the relationship between individual markets and the fundamental model assumptions. We use a Markov Chain [18] to model prices, where a finite number of states are interconnected by conditional probabilistic movements called state transitions. A state is a discrete point in time containing available information (prices in our case). Only one state can be visited at a time, and the process is memoryless, meaning that the transitions depend solely on the currently active state.
Our model emphasises the correct timing of the German electricity market schedule but can easily be adapted to other use cases. The lowest common denominator of all markets is the four-hour resolution of the FCR market. Sub-stages for both other markets are possible but not considered in this work. A 24-hour operational day is divided into six four-hourly time blocks , where represents the interval 00:00–04:00, the interval 04:00–08:00, and so on. A combination defines a stage of the decision problem. The model starts at midnight, with no commitments for the DA and FCR markets before their first clearing since we do not consider a possible deterministic pre-clearing from the previous day. We do not allow bidding on the FCR and DA markets on the last day of the planning horizon to avoid running into end-of-horizon distortions. The individual markets are modelled as follows:
-
1.
FCR Market: At day , in block , the FCR market takes capacity bids on a four-hour resolution for the next day . The market is then cleared at . Bidding and clearing are done for the whole next day with all six four-hour blocks.
-
2.
DA Market: The DA market follows the same structure as the FCR market. At day , in block , we bid for all six blocks of day . We defer the market clearing to the next day . 222This modelling choice is motivated by the dependency of ID prices on DA prices; ID price selection requires the current DA state. An early clearing (for the next day) would overwrite the DA state needed for ID prices of the current day. Unlike variable values, we can not temporarily store Markov chain movements. By extending the clearing to midnight, we preserve the location of the policy graph at the cost of not revealing the freshly cleared quantities two steps before the next day. We assume that possible trading gains from ID actions until DA clearings are minor.
-
3.
ID Market: The ID market’s price is modelled as a price spread compared to realised DA prices. At a given four-hour block , bidding takes place for the following block , with realization and delivery of the implied commitment in . The market consists of three levels: one level at the mean of the distribution against DA prices, one level above and one level below the given price. This is similar to the discrete intra-stage price process in [27].
Figure 2 shows a simplified Markov chain with transitions for two of the three markets. The DA stochastic process changes states from bidding in in , revealing the uncertainty in in . The implied cost of an operator’s decisions may enter the objective function with a delay between bidding and clearing, which makes optimal decision-making more complex. We assume no inherited DA and FCR commitments before the first clearing. Until then, only ID market actions are allowed on the first day.
3.2 Price Modelling
The electricity market prices in Europe have been experiencing significant fluctuations in recent years, largely due to geopolitical tensions. We argue that simple time series analysis alone is insufficient to accurately represent stochastic movements of prices when exposed to external shocks. Using more ordinary price years to train the models might lead to a poor fit in exceptional years. Our goal is to construct effective trading strategies in any price environment. As such, we have developed a method that first normalises the data. We divide the prices into two components: a predictable part that adjusts to macroeconomic conditions and a stochastic part. For the predictable component, we use fundamental models that have provided accurate estimations in the past and can capture non-linearities [29]. We build relative price scenarios from the stochastic components and combine these scenarios with forecasts from our fundamental models for the final market bidding. The relative stochastic price movements, relevant for short-term market price changes, can predominantly be explained by variations in weather, load, plant unavailability and market conditions. In practice, battery operators might consult commercial forecasts with prediction tools or specialised companies for macroeconomic regressors while keeping the relative scenario generation in-house.
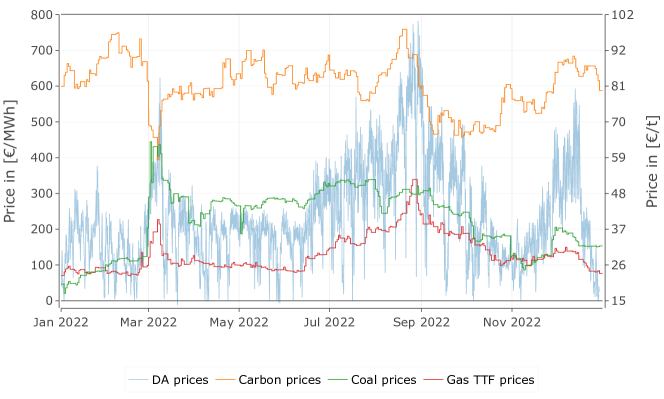
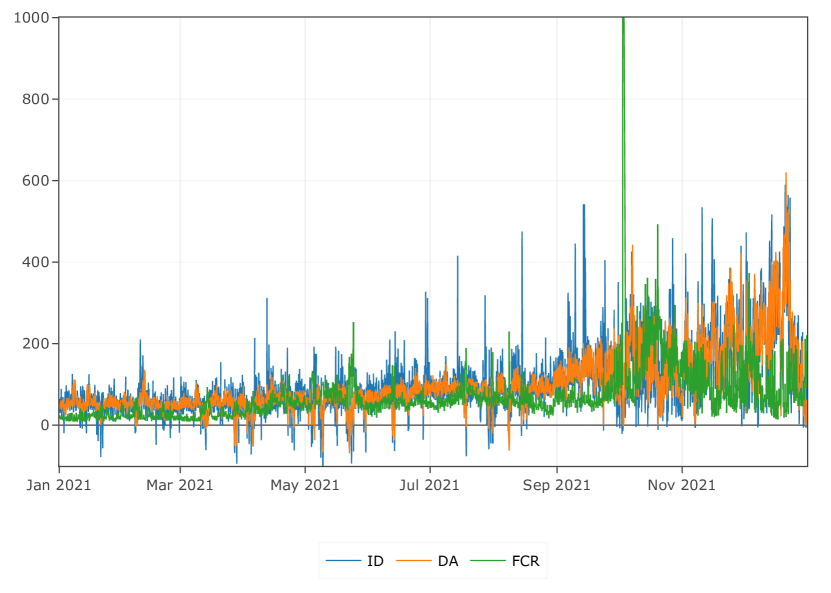
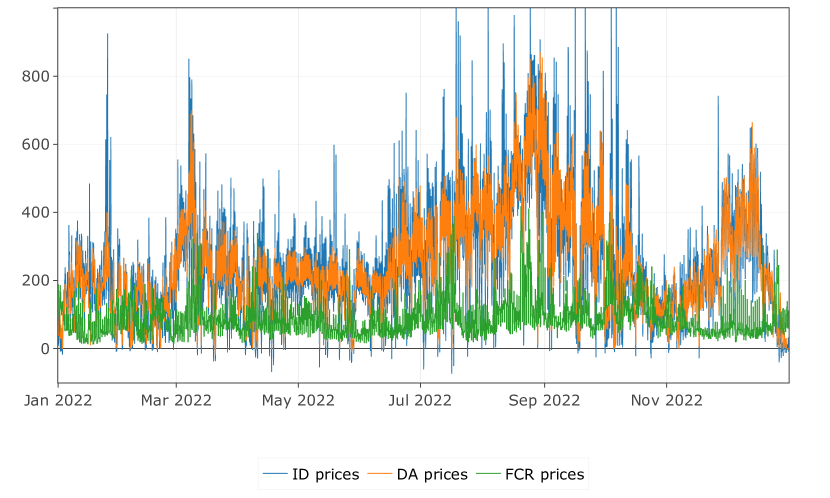
In this section, we develop fundamental price models for the different markets and use them to extract the stochastic components, which are then used to estimate the Markov chain of price transitions. We start by visually inspecting the time series of prices for the three markets of DA, ID and FCR market prices, observing a high price level with increased volatility throughout the year 2022 (Figure 17), especially compared to 2021 (Figure 17). We selected residual load, Gas Title Transfer Facility (TTF), and price as explanatory variables based on their statistical significance and the resulting adjusted . Figure 3 depicts the evolution of these explanatory variables throughout the year, showing seasonal (gas TTF and ) and daily variations (residual load).
In the next step, we reduce the DA and ID time series from hourly to 4-hour resolution by calculating the mean value within the interval. We then split the DA and FCR price time series into a deterministic and a stochastic component by Ordinary Least Squares (OLS) econometric models. Further, we calculate the lower- and upper quantiles of residual load for later usage as explanatory variables in the econometric price separation. In Section 3.3, we use the stochastic component for estimating the Markov chain. Table 1 provides descriptions and notation for the explanatory variables used in the subsequent sections.
| Variable | Content | Variable type |
|---|---|---|
| Gas TTF price | continuous | |
| Carbon price | continuous | |
| Residual Load | continuous | |
| Upper quantile residual Load | dummy | |
| Lower quantile residual load | dummy | |
| Weekend | dummy | |
| of the day | dummy | |
| of the day | dummy | |
| of the day | dummy | |
| of the day | dummy | |
| of the day | dummy |
3.2.1 DA Prices
The DA price from the historical time series can be separated into a deterministic term and stochastic residual , as defined in the following econometric model.
| (1) | ||||
| (2) |
Explanatory variables are the Dutch Title Transfer Facility (TTF) natural gas price, Carbon certificate price and the residual load. The model achieves an adjusted of 84.8 % in 2022 and 84.9 % in 2021. Therefore, it is deemed a good fit to predict price developments with few explanatory variables. We find strong positive autocorrelations with a Durbin-Watson value of 0.154.
3.2.2 ID Prices
ID prices can be modelled as a price spread, being dependent on previous DA price realizations [15, 33], or as an independent equilibrium between ID supply and demand [29]. We use the first approach and model ID prices as up- or downward spreads of forecasting errors from the previously cleared DA price. Hence, ID prices are dependent on DA clearing prices of the previous Section 3.2.1 where .
3.2.3 FCR Prices
Our literature review shows that the FCR market price is particularly challenging to estimate. However, our trading policy depends on reliable price scenarios that contain meaningful information rather than just noise. This is important to ensure that our trading strategy is not adversely affected. In our investigation, we have discovered that there is hardly a linear correlation between DA and FCR market prices (correlation coefficient of -). Another argument against the dependency of FCR prices on DA prices is the timing of these markets, with DA clearings after FCR clearings. It might be possible to anticipate and behave strategically, but we do not find evidence from the time series to support this assumption. Therefore, we consider the FCR market to be price-independent of other markets and estimate it by another linear regression. We use a separation procedure for broader macroeconomic situations and stochastic movements in a linear regression similar to that of the DA price model.
| (3) |
We use dummy variables for the day’s different four h intervals to capture time-dependent patterns. Furthermore, we use the log function for the prediction and residual demand quantiles as independent variables to include scarcity effects.
| (4) |
Including residual demand quantiles as a simple regressor significantly improves predictability. Residual demand refers to the demand that is not met by renewable generation sources like wind, solar, and hydropower, which have no marginal costs.
For further information on how to estimate quantile levels, we refer to the work of Aneiros et al. [1], Do et al. [8], who achieved good results in short- and long-term predictions using a functional nonparametric model and quantile regression. For long-term predictions, Do et al. [8] show that non-electricity market factors from weather and economic production changes play an essential role and should be included. Estimating the quantile levels in advance is not within the scope of this work, and we assume they are known. Simple interpolations on our dataset with residual demand from the year 2021 to 2022 show that correcting the annual sum of demand and renewable share results in an overestimation of the lower quantile and an underestimation of the upper quantile. This shows that simple methods are sufficient to support our assumption for known demand quantiles in practice. In 2022, using the residual load quantile as a predictor in scarcity situations increased the explained variations in the OLS by a factor of three, resulting in a 36 % R-squared value. When the same model was applied to the data in 2021, the R-squared value was over 53 %. Additionally, there are no significant signs of autocorrelation in the FCR prices.
3.3 Estimating the Markov Chain
The following explains how we get data from historical time series to input into our SDDP model. The model requires discrete price states for the individual markets and a corresponding transition probability lattice to define the Markov chain. Figure 4 provides a schematic overview of the individual steps involved.
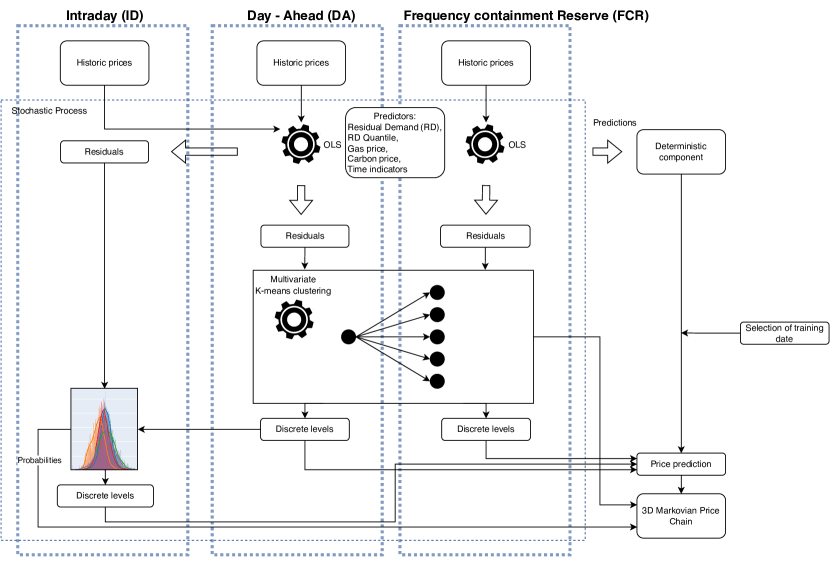
The residuals of the econometric models are input for the clustering of stochastic price components. Three successive days form a sequence for the later SDDP model, totalling 121 (=363/3) historic price combinations. The last two days of the year are omitted to make the allocation integral. The FCR and DA markets require a prediction for six consecutive 4-hour intervals of the next day. We reduce these 121 sequential price movements by employing a multivariate Euclidean k-means clustering approach. We then achieve a reduced number of representative clusters, consisting of six consecutive four-hour data points, for each of the three days of the planning horizon. Figure 7 presents elbow plots to determine the number of necessary clusters. We observe two slight elbows at a cluster count of 3 and 5 clusters. Based on this, we proceed with five clusters as discrete descriptions of stochastic price levels. The same procedure is applied to the FCR market, with clusters depicted in Figure 9. We decide on three clusters based on the elbow plot in Figure 9.
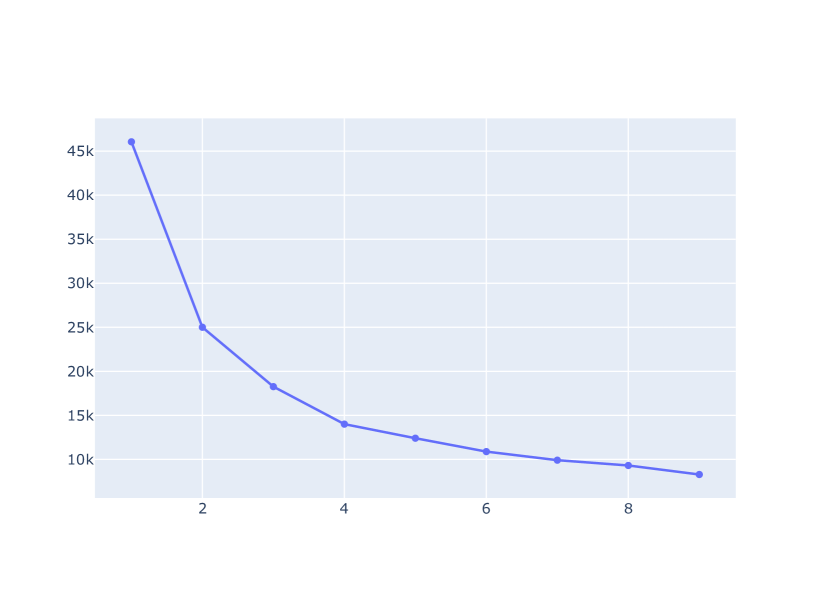
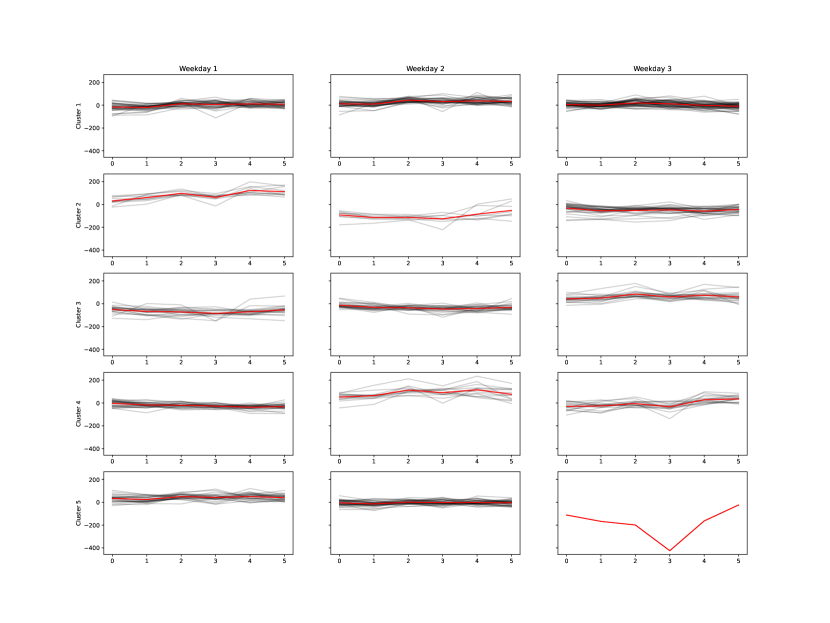
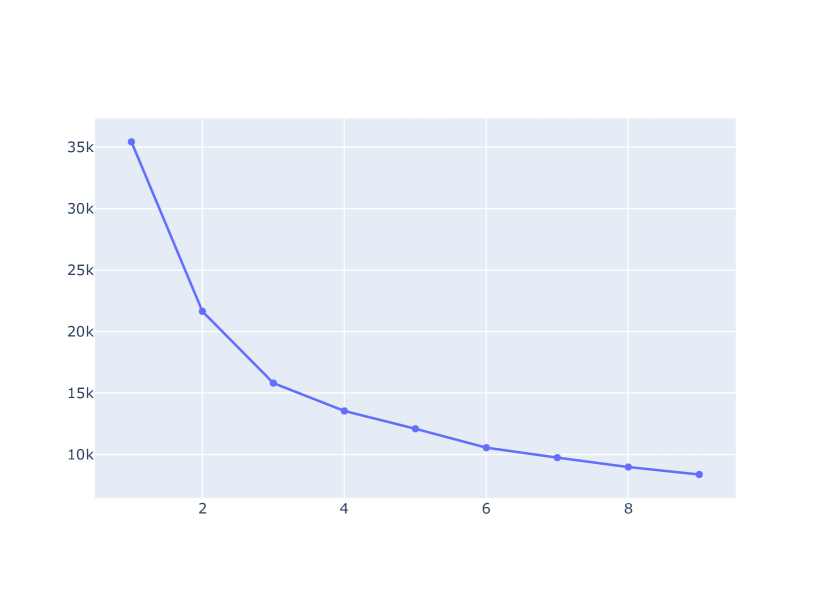
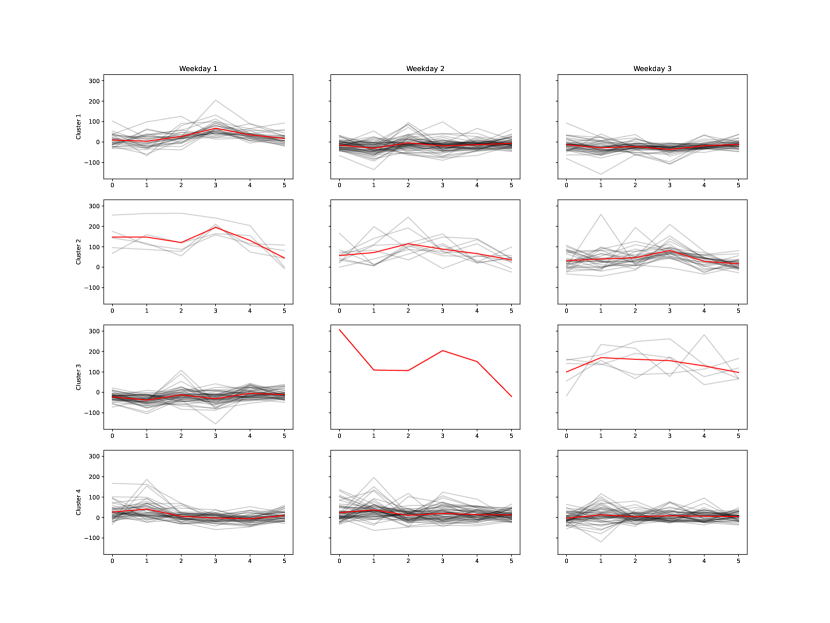
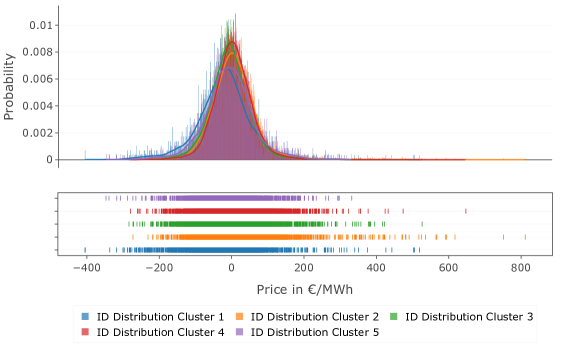
Figure 5 shows the probability density functions of ID deviations for the different DA clusters. The probability density function is characterised by long tails of deviations in both directions, particularly in the positive price direction. Tests for normality of the ID deviations were rejected in all DA clusters despite desirability from an efficient market theory perspective. We discovered that the distribution of ID spreads differs in mean and variance depending on the DA price cluster. We take advantage of this and derive the ID price as a cluster-dependent difference to DA prices with . Based on the distributions of the differences, we define three discrete ID price levels for each of the five DA levels and the respective probabilities: the mean and the 15 and 85 percentiles of each ID distribution.
Next, we calculate the transition probabilities between Markov states based on the discrete cluster allocation of historical prices and their changes over time. Once we have the cluster allocation for a sequence of days, we can analyse the allocation of the preceding and succeeding sequences to calculate the transition probabilities. This is done by counting the transitions and weighting the counts appropriately based on the cluster allocation.
In the last step, we built a prediction for the investigated period shortly before market participation. We use the dependent variables of the OLS model (TTF gas, carbon price, and residual load) and assume that market participants have access to in-house- or external forecasts from specialised firms. The forecasted fundamentals and clustered stochastic residuals are then merged into a Markov chain, representing the current market situation with stochastic market uncertainty. Based on these prices, the SDDP model can be trained, resulting in an optimal policy that a battery operator can use for his trades.
A comparison of the discrete prices in the Markov chain (green) to the historical prices (blue) in an exemplary period is visualised in Appendix A.4.
3.4 Mathematical Model
In this section, we explain our coordinated multi-market battery storage trading model. In the model formulation, we make use of a step-function returning one if and 0 otherwise. Moreover, Table LABEL:tab:nomenclature lists parameters, variables and sets.
| Sets | |
| Set of markets: | |
| Set of price levels: | |
| Set of days: | |
| Set of 4 hour blocks within a day: | |
| Set of time stages indexed by | |
| Parameters | |
| Storage capacity of the battery | |
| Start- and end storage level of the battery | |
| Rated power of the battery | |
| Penalty term for the usage of slack variables | |
| Random Variables | |
| Cleared market price in market at time stage in four hour block (in €/MW) | |
| State Variables | |
| State of Charge in time stage (in MWh) | |
| Bid quantities in market , at price level for block in time stage (in MWh) | |
| (Offset corrected) committed market quantities for market at time stage for block (in MWh) | |
| Helper variable for offset correction at time stage and for block (in MWh) | |
| Local Variables | |
| Market clearing quantities at the time of clearing for market and block in MWh | |
| Slack variable | |
3.4.1 Objective Function
The objective function maximises the profit from trading on the FCR, DA and ID markets by summing the products of prices and quantities. The FCR and DA markets clear daily in periods and , respectively. We add a penalty term for storage level violations.
| (5) |
3.4.2 Constraints
Equation (6) is the main market clearing constraint. Each market is cleared according to quantity bids on discrete price levels, matching the discrete levels in the Markov states. The step-function returns 1 if the price of the bid is lower than or equal to the sampled market price () and 0 if higher ().
| (6) |
Bids for the ID and FCR markets are submitted one timestep before respective market clearing, with the DA market submitting bids in block four each day. We follow the approach of Fleten & Pettersen [12], Löhndorf et al. [27], and Wozabal & Rameseder [38] to model the bidding function: quantity bids are implemented on the discrete price levels as monotonically increasing bid curves, as ensured by Constraint 7.
| (7) |
ID constraints We limit ID bidding quantities to quantities not exceeding storage constraints, including previously cleared markets. This is not expected to limit the quality of the solution since it only excludes non-optimal parts of the solution space. Special care has to be taken to the last period each day where the restriction applies to bids, instead of cleared quantities. We have verified the validity of this assumption in Section A.3.
| (8) | |||||
| (9) | |||||
| (10) | |||||
| (11) |
Offset constraints The offset between market clearing timing and real-time deliveries requires caching of commitments in additional variables for the FCR market. Otherwise, the cleared quantities for the rest of the day would be overwritten with new quantities. We ensure correct values by caching variables: At the time of clearing, commitments for the first part of the next day (until the next clearing) are updated as described in Equation (12a). The commitments for the second part of the day are cached as in Equation (13a). At the start of a new day, Equation (12b) then inserts cached commitments into the actual commitments. The information is passed on for all other periods, as given in Equation (12c) and (13b).
| (12a) | |||||
| (12b) | |||||
| otherwise. | (12c) |
| (13a) | |||||
| otherwise. | (13b) |
We have that , , and is used to denote the Cartesian product of two sets.
The state of charge should always stay within boundaries set by the capacity of the battery, reduced by capacity reservations for the FCR, . We assume that the reserved power in the FCR market is available in both directions, and we need to ensure that the respective power is covered by an appropriate SoC level. Hence, we reserve the respective up and down capacities. Slack variables, which are penalised in the objective, relax these constraints and ensure the SDDP algorithm’s feasibility. We assume no efficiency losses for the battery since our focus is on a short-term operation where the high-efficiency rates of commercial battery racks are considered to be neglectable for operational decisions.
| (14a) | |||||
| (14b) | |||||
| (14c) | |||||
Domains. Trading of the battery in all markets and for all variable types is restricted by the battery’s rated power and storage capacity. Bidding volumes in the ID and DA markets are limited by the battery’s rated power, while the FCR bids are limited to half the battery’s rated power as a conservative assumption. SoC is limited by the battery’s capacity, and slack variables are not limited.
| (15) | ||||||
| (16) | ||||||
| (17) | ||||||
| (18) | ||||||
| (19) | ||||||
| (20) | ||||||
| (21) |
4 Case Study and Implementation
We have implemented a case study on a 10MW/10MWh battery storage located in the German electricity market zone and used data from EpexSpot for the year 2022. While spot markets haven’t seen many regulatory changes in recent years, the FCR market structure has recently changed. At the time of writing, reservations are cleared in a pay-as-cleared remuneration system. The market is intended for small imbalances and therefore procured as a symmetrical product with at least 1 MW power and 30 seconds of activation time.333Frequency Containment Reserve by regelleistung.net, the official market portal for Germany, accessed: 20.11.2023 Unlike other balancing markets, only the provision of capacity is reimbursed without a price for energy since positive and negative activations are expected to balance out on average.444Definition Frequency Containment Reserve (FCR) by Nextkraftwerke, accessed: 20.11.2023 The demand for the reserve is determined by a potential outage of the largest two power generators in the synchronous region and split across the participants.555ibid. Activation quantities for similar products are described in the literature as negligible, like the Fast Frequency Response (FFR) and disturbance (FCR-D) products in the Nordic synchronous area [37]. Saretta et al. [36] state that FCR activations are not energy intensive, and activation payments can be negligible.
Based on this, we create a case to make the power available to the FCR market for each of the six daily four-hour blocks. We model bids as a symmetrical product, with half of the battery power in the positive direction and the other half in the negative direction since we don’t know in which direction we might get activated beforehand. An appropriate filling of the storage ensures that activations in both directions are feasible. For the two days that we can participate in the market, we have a maximum cumulative volume of 60 MW. We model no activations and assume balanced activation quantities at a low volume during each four-hour interval. Unused capacity can be used for spot market trading. We impose no limits on the allocation ratio of each market and let the model determine the optimal ratio.
The problem is implemented in Julia, where we utilise the sddp.jl package by [9]. We calculate an optimal trading policy based on the mathematical problem formulation presented in Section 3.4 and the approximated Markov chain from Section 3.3. From the data curation, we have 1081 individual price level combinations and 73 state variables, which implicitly define the Markov chain’s approximately billion price paths. The SDDP algorithm takes about 45 minutes to estimate the optimal policy for a subset of combinations, using 18,000 iterations (forward and backward passes of the SDDP algorithm) with an Apple M1 Pro notebook processor. We found a CPU utilization of around 10 % in serial operation, indicating room for improvement by parallelising the training algorithm. Parallelisation requires a full model in working memory for each instance, which quickly reaches the hardware limits of the notebook. Moving the calculations to a server is possible and recommended for more detailed implementations. For the multi-market optimisation, we add a stopping criterion to the SDDP algorithm, which stops the algorithm if the upper bound improves with an absolute of less than 0.1 over the last 3000 iterations after an initial 5000 iterations. Otherwise, the algorithm runs until 18,000 iterations. The first trading day contains only the ID market actions and is omitted for a fair comparison of markets in the result tables.
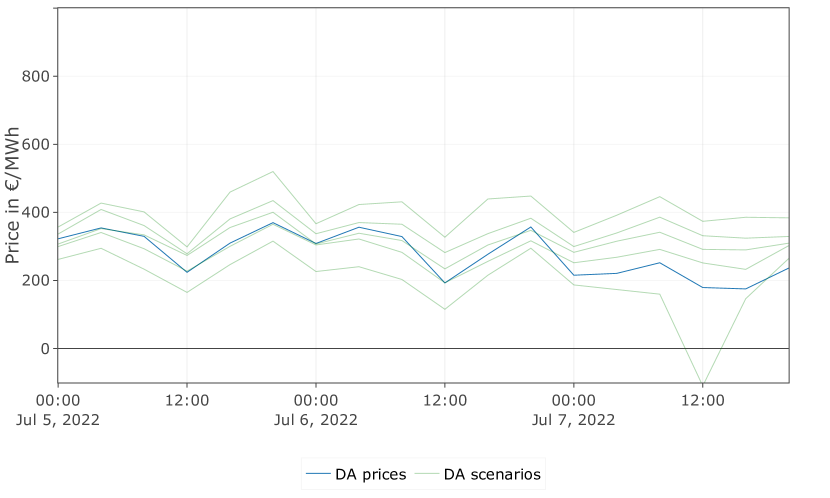
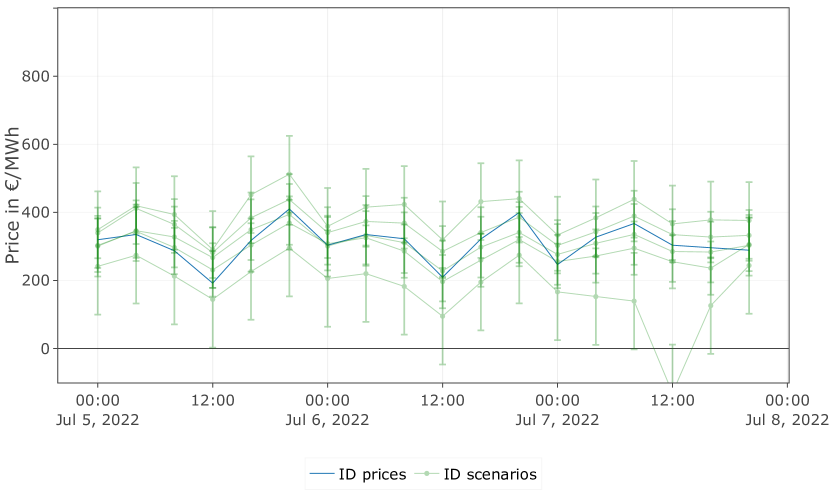
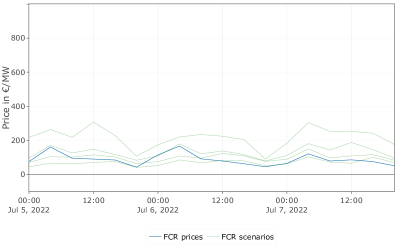
To illustrate the model’s functioning, we simulate the obtained policy in a simulation on fundamentals of the exemplary time period from 05.07.2022 to 08.07.2022. We tested multiple random periods and found consistent patterns with only minor variations in revenue and shares between markets that can be attributed to different arbitrage potentials for the prevailing prices. The 05.07.2022 - 08.07.2022 period sees relatively high volatility, which is favourable for spot-market participation.
5 Results
In this section, we describe the quality of the trained policy from the SDDP algorithm and analyse the achieved trading strategy across markets.
5.1 Policy Evaluation
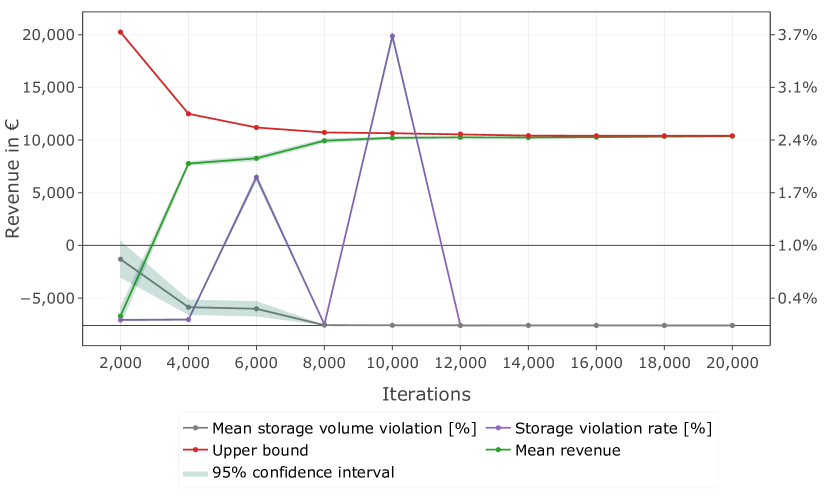
We start by evaluating the computational performance of the most general policy, considering all markets. Figure 11 shows the convergence of the SDDP algorithm as a function of the number of iterations.
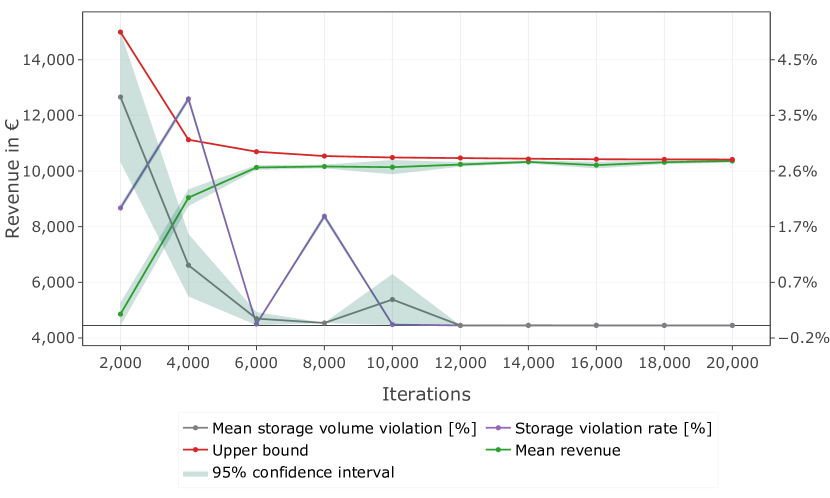
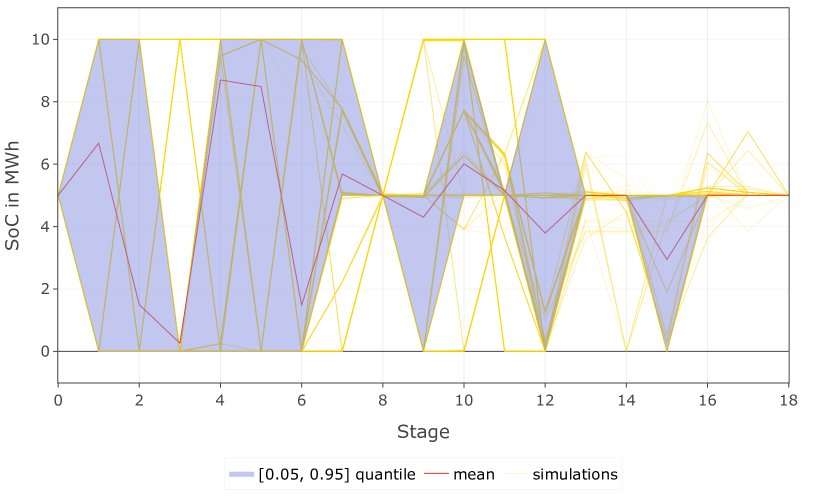
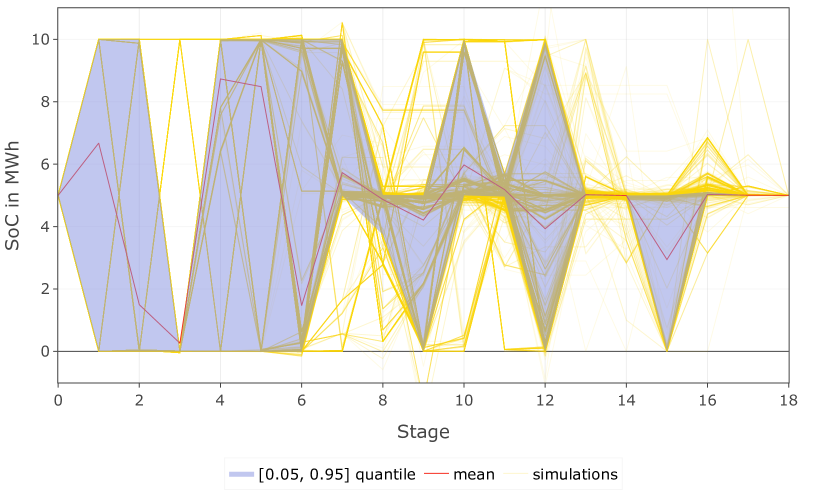
We observe that the policy quality improves with a higher number of iterations used in the training, resulting in a smaller gap between the true upper bound and simulations, as shown in Figure 11. We achieve a tight optimality gap after around 6,000 iterations. Storage violations are already below after approximately 4,000 training iterations with less than of the storage volume. From 12,000 iterations on, storage violations no longer exist, and the model solely focuses on optimising the trading strategy. Further training improvements flatten out with higher iteration counts, while the marginal computational costs increase. Exemplary storage changes of a policy with 18,000 iterations with 10,000 simulation runs of simulated data are visualised in Figure 11. Based on the assessment of storage violations, the convergence of the true upper bound and the mean simulated revenue, we decided to continue with 18,000 iterations. The mean revenue of all simulations from three days of trading converges to an upper bound of 10,415€.
5.2 Multi-Market Coordination
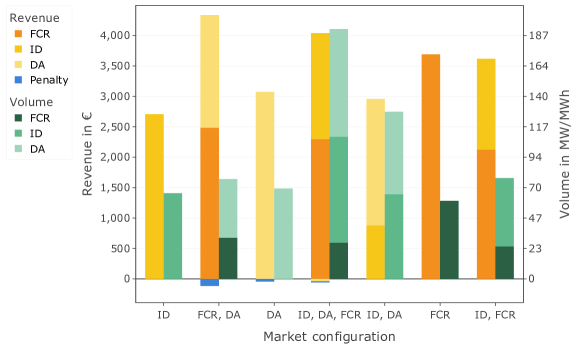
To assess the value of multi-market participation, we construct a range of policies considering different market combinations. Since only ID operations are possible on the first day (only bid submissions for the other markets), we compare the last two days of operation. The revenues and balances of policies with different market participation are presented in Table 3 and Figure Figure 12.
| Market configuration | FCR | ID | DA | FCR, DA | ID, FCR | ID, DA | FCR, ID, DA | |
| DA | Revenue [€] | - | - | 3092.4 | 500.3 | - | 2066.0 | -1037.7 |
| Volume [MW/MWh] | - | - | 69.8 | 13.6 | - | 63.3 | 107.1 | |
| Balance [MWh] | - | - | 0.0 | 0.0 | - | 1.2 | -4.9 | |
| ID | Revenue | - | 2705.9 | - | - | -351.4 | 892.6 | 1099.4 |
| Volume | - | 65.9 | - | - | 20.1 | 65.3 | 106.3 | |
| Balance | - | 0.0 | - | - | 0.0 | -1.2 | 4.9 | |
| FCR | Revenue | 7384.1 | - | - | 6907.1 | 6818.5 | - | 6954.7 |
| Volume | 60.0 | - | - | 52.8 | 51.3 | - | 53.0 | |
| Penalty | Cost [€] | 0.0 | 0.0 | 105.6 | 238.9 | 0.0 | 0.0 | 0.5 |
| Total | Revenue | 7384.1 | 2705.9 | 2986.8 | 7168.5 | 6467.1 | 2958.6 | 7015.9 |
| Volume | 60.0 | 65.9 | 69.8 | 66.4 | 71.4 | 128.6 | 266.4 | |
The operational results show that a policy that exclusively bids in the FCR market outperforms all other policies in terms of revenue. In the FCR market only case, the SDDP algorithm converges quickly to a policy that reserves all available capacity in that market. Policies that add the DA market or DA and IF market result in similar revenues at higher volumes from additional spot market cycling.
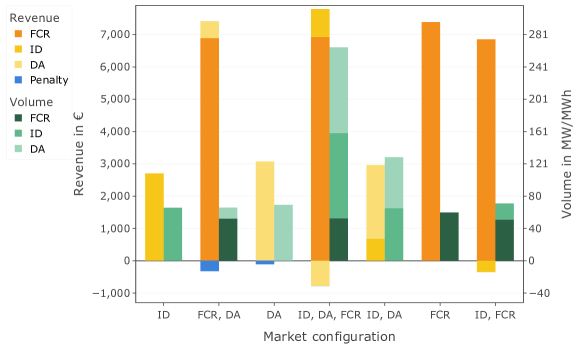
The single DA market operation and the combination of DA and FCR markets result in the highest penalty costs, stemming from uncertainty in the clearing. When combined with ID operation, these penalties can be effectively reduced. We observe that combinations of FCR with ID and DA markets neither see the exclusive allocation to the FCR market nor increased revenues. Nevertheless, they achieve reasonably close revenues while still having a small optimality gap.
The computational complexity increases by adding markets. When combining the FCR market with spot markets, the corner solution (only participating in the FCR market) is not picked up, and the model picks a near-optimal solution. Additional tests showed that the optimality gap between pure FCR operation and a combination with spot markets reduces for higher iterations.
The combination of ID and FCR markets introduces trading losses by ID participation and serves as an exception where coordination is non-beneficial. The addition of the ID market sometimes struggles to deliver additional value. However, this is not a surprise given the unpredictability and limited cycling potential on the four-hour time slices of our model compared to the 15-minute intervals in reality.
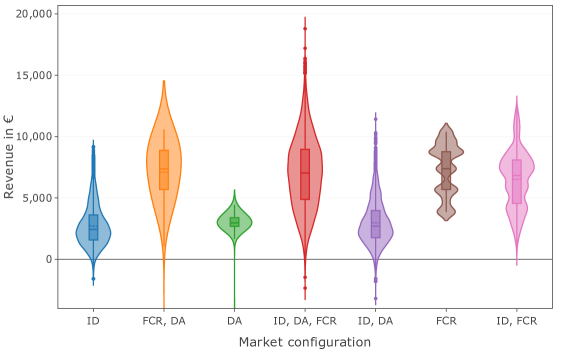
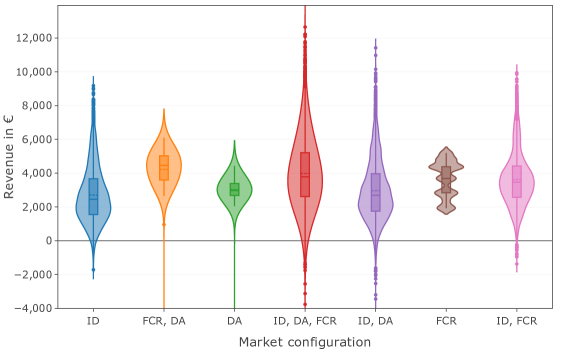
Further insights into the distribution of revenues over the policy simulations are presented in Figure 13. ID operation increases the upper and lower tail of the revenue distribution. Pure DA operation shows symmetrically bell-shaped revenues around its mean, with a long tail for negative revenues. Some simulations yield a substantial negative revenue due to penalised storage violations. Moreover, we observe that considering multiple markets can increase revenues in the tails well above the revenue of individual markets.
Trading volumes increase significantly when combining markets. We observe opposing trading patterns of ID and DA markets, indicating that the policy exploits arbitrage trading strategies. We approximate arbitrage trading with two different metrics. The direction metric is defined as:
| direction | (22) |
where
| (23) |
The intuition behind this metric is that the minimum of both trades with opposing signs is covered by the other market and doesn’t affect the storage balance and is therefore arbitrage between markets. Moreover, the feasibility metric calculates the storage-bound violations caused by DA and FCR trades that must be balanced in the ID:
| feasibility | (24) |
where
| (25) |
Our results show that across all simulations, on average 39.6 % of the combined volume of both markets corresponds to arbitrage trading, using the direction metric and on average 39.5 % of the combined market volume using the feasibility metric. The shifted volumes from the DA to the ID market are significant, resulting in a surplus of 3.87 MWh sold in the ID over the three days.
5.3 Reduced FCR prices
For the given input data and a four-hour time resolution, we found that the optimal policy was to trade solely on the FCR market. However, we would expect multi-market trading strategies to be optimal under different market conditions. We acknowledge that our approach, which considers the same temporal resolution for all markets, differs from the real-world market setup. In reality, the DA and ID markets have finer time resolutions, capturing more volatility and price spreads. This can smooth out short-term fluctuations and narrow observed price spreads, potentially reducing profitability. To address this and provide a clearer view of the potential benefits of coordinated bidding, we create a new test instance with reduced FCR price levels by 50 %. This adjustment ensures that our comparative analysis to a larger extent considers the intrinsic market dynamics and compensates for reduced cycling on the spot markets, thus providing a clearer view of the benefits of coordinated bidding. The results are shown in Table 4 and Figure 14.
| Market configuration | FCR | ID | DA | FCR, DA | ID, FCR | ID, DA | FCR, ID, DA | |
| DA | Revenue [€] | - | - | 3073.4 | 1852.1 | - | 2079.0 | -40.6 |
| Volume [MW/MWh] | - | - | 69.5 | 45.1 | - | 63.4 | 82.7 | |
| Balance [MWh] | - | - | 0.0 | 0.0 | - | 1.2 | -3.1 | |
| ID | Revenue | - | 2705.9 | - | - | 1493.3 | 879.9 | 1740.8 |
| Volume | - | 65.9 | - | - | 52.6 | 65.3 | 81.4 | |
| Balance | - | 0.0 | - | - | 0.0 | -1.2 | 3.1 | |
| FCR | Revenue | 3689.9 | - | - | 2484.2 | 2124.4 | - | 2298.5 |
| Volume | 60.0 | - | - | 31.7 | 25.0 | - | 28.0 | |
| Penalty | Cost [€] | 0.0 | 0.0 | 43.8 | 115.6 | 0.0 | 0.0 | 18.5 |
| Total | Revenue | 3689.9 | 2705.9 | 3029.6 | 4220.7 | 3617.7 | 2958.9 | 3980.3 |
| Volume | 60.0 | 65.9 | 69.5 | 76.8 | 77.6 | 128.7 | 192.1 | |
We see that the profitability ranking of the single markets remained intact, with ID, DA, and FCR markets in ascending order. The revenues and volumes of arrangements containing only DA and ID markets see little impact from the price changes and stay at the original cases’ levels. Policies that include the FCR market obviously show reduced revenues caused by lower prices.
Most strikingly, we observe that multi-market policies now outperform single-market policies. Multi-market policies see a higher volume allocation to both spot markets and a lower allocation to the FCR market, leading to increased revenues. Combining DA and ID markets with the FCR market sees additional value from coordination over individual market participation. The combination of FCR and DA markets results in additional revenue of 530.8€, or 12.5 %, compared to the FCR market alone. Considering all markets resulted in a revenue increase of 5.7 %. When all markets are combined, we see a decrease in storage violation penalties and reduced negative income from the ID market. However, consistent with the base case, there is no value in coordinating the ID and FCR markets. The arbitrage volume between the ID and DA market reduces significantly to 28.5 % or 25.5 %, depending on the approximation.
6 Discussion
This section analyses our findings on model performance and practical usability. We discuss the implications of our assumptions and configuration decisions and highlight future investigations in the following five categories.
Value of Coordination. In line with Kongelf et al. [21], we find no significant coordination values in expectation at the chosen modelling resolution but notice higher spikes at both ends of the revenue distribution. We also find significant volume shifts between DA and ID markets, indicating arbitrage trading between markets. Contrary to [26], we find no increases in profits from the increased volatility of trading on the ID market. However, for a different price environment with lower FCR prices, we observe additional value in coordinating spot and balancing markets. These lower FCR prices bring revenues from capacity reservation and revenues from time arbitrage of spot markets closer together. This showcases a main dilemma of modelling battery storage revenues: the choice of model resolution can critically influence model performance. Increasing the resolution might make the problem very challenging to solve in a reasonable amount of time (or at all), even with advanced stochastic optimisation approaches such as SDDP. Strengthening the argument of coordinated bidding instead of allocating capacity in the FCR market alone is that the FCR size in Germany is only 600MW and will soon be saturated as a revenue stream with an increase of large battery projects, whereas DA size and ID size are not expected to be saturated in the near future. That means that cannibalisation effects with decreasing prices will leave no alternative to splitting up revenues the shares of the battery and stack revenue streams.
Resolution and Battery Properties. Our choice of methodology is appropriate to capture the broader market environment and the joint stochasticity of the market, and the solution methods can handle the complexity in a time frame that is appropriate for practitioners. However, a four-hour resolution underestimates the revenue potential in the wholesale markets in the case study’s data. Spot market revenue depends on time arbitrage when filling storage at a low price and selling at a high price. Limiting this cycling by a low time resolution limits spot market revenues. Reserving capacity in the balancing market is cycling independent and yields higher profits. We also use average prices for the four-hour intervals, which smoothened price spikes, especially in the ID market. The battery’s power rating is high enough to complete a full cycle within an hour, but an operator would then need to focus more on the technical properties of the battery, like degradation, temperature and losses caused by heavy cycling. An even faster cycling in the 15-minute ID market with periodic (and storage level dependent) fast charging could further improve revenues but comes at the expense of high computational costs and additional (technical) constraints. In that regard, the battery’s power/capacity configuration (10MW/10MWh) can also influence the revenues of the different markets. Larger power ratings favour flexibility provision in capacity markets, i.e. FCR. A battery in a 0.5C configuration (10MW/20MWh) would make the same FCR revenues but considerably higher revenues on the spot markets. The power and capacity ratio can thus be investigated as a sensitivity parameter in future work.
Solution Method. A general shortcoming of SDDP as a solution technique for large-scale optimisation problems is that stochastic scenarios from the Markov chain are sampled, and the cost-to-go function is approximated. This can lead to some price paths not being evaluated, resulting in close-to-optimal solutions. Our example shows that participation in the FCR market is the best solution in expectation, even when combined with other markets. However, the model does not pick up on this single market solution but finds market combinations that are close to optimal. We tested increased iterations and found that they improved the expected revenue further by closing the gap to the optimal solution but never reached it. Given the high complexity of the problem and the curse of dimensionality that makes it practically impossible to visit all possible combinations, we navigate by SDDP and solve at most 5,107,075 of the Markovian price paths ( of all combinations). The achieved optimality gap of 5 % compared to the single FCR market solution is deemed acceptable. Another limitation may apply to imbalances of the battery’s storage energy from capacity activations in the FCR market. Although at a low probability and with little energy content, this can lead to disturbances in the battery’s energy balance, triggering costly short-notice buy actions on the market. It is interesting to see how these additional costs rebalance the allocation of volumes between the markets against the high expected revenues. To our best knowledge, no publicly available data exists on FCR activations, rendering it difficult to perform a critical validation. Furthermore, we want to point out that slack variables for stabilising the SDDP algorithm to stay within the storage constraints might have adverse effects. The results showed that a small number of simulated policies caused substantial negative revenues by capacity violations. This highlights the dilemma between achieving a policy that returns feasible actions (regarding storage violations) and keeping within a realistic cost framework. In reality, our fixed imbalance penalty might be too conservative compared to a short-notice ID settlement or the risk of imposed balancing costs from the grid operator. Therefore, the penalty term might cut off trades too early when the storage constraint is violated.
Storage as a Price Taker. In addition, the price-taker assumption on markets with limited liquidity requires special attention. While the DA market is characterised by its high liquidity, this is not necessarily the case for the ID and FCR markets, where the price can be influenced towards lower volatility and consequently reduced revenues666There exist market analyses for the DA in grey literature that question if the price taker assumption holds in reality. See for example: regelleistung-online: Preiseffekte durch den Ausbau von Batteriespeichern – Teil 3: Arbitrage in der Day-Ahead Auktion, accessed \DTMdisplaydate20230708-1). Investigating a price impact requires SDDiP, which is significantly more computationally expensive. We note that the volume of the asset in the case study consists of a battery with a storage size that is not large enough to expect a significant price impact from its market participation, given the liquidity of the markets in Germany. To analyse larger storage assets and their price impact, we refer to [4].
Scenario Generation. Next, we want to emphasise that using more advanced data preparation and scenario reduction techniques could enhance revenues when constructing the Markov chain. Employing k-means clustering may overlook complex patterns within the underlying data. For example, it becomes apparent from Figure 9 that in weekday three, cluster four in the second time step, higher and lower values around the mean even out. We tried to capture these dependencies on time with our econometric models and time variables, but limitations apply in some cases. Since these variations ended in the stochastic component, further pattern recognition with advanced clustering algorithms, like Density-based spatial clustering of applications with noise (DBSCAN), can be investigated in future work.
7 Conclusion
In this work, we extend the literature on the coordinated trading of a battery storage operator in electricity markets. We included the two spot markets of DA and ID, as well as the FCR balancing market, which has received little attention so far. Our research highlights the challenges of time coupling constraints of a battery and its high complexity and serves as fundamental research for further real-world applications. We implemented a case study on coordinating a 10MW/10MWh battery storage in Germany across three markets. To achieve this, we developed a stochastic multi-market bidding model and solved it using SDDP within reasonable computational times while adhering to time coupling and storage boundary constraints. Additionally, we developed and calibrated econometric price models for the FCR, DA, and ID markets to coordinate bids effectively. Introducing quantiles of residual demands as a regressor for scarcity effects notably enhanced our econometric models, particularly in the FCR market. Our stochastic bidding model consistently yields profits in expectation across all markets and configurations. Notably, the FCR balancing market, in the singular configuration, dominated expected revenues compared to combinations of wholesale markets. A profit-maximizing operator would prefer this corner solution over market coordination, although spot market trading is impacted by the four-hour temporal resolution of our model. However, an instance with a reduced FCR price level demonstrated coordination benefits between spot and balancing markets of up to 12.5 %.
Further research attention on multi-market coordination in battery storage trading is needed. Our findings shed light on the complexities arising from interdependencies and the high-dimensional nature of the problem. Moreover, our results can be used to provide valuable insights into the economic feasibility of energy storage deployment within the German energy sector, offering a forward-looking perspective on the role of storage technologies in the evolving energy landscape. We recommend future research focus on higher resolution intervals following market developments, the interaction between offered volumes and prices and extending coordination to multiple products. In practice, increasing coordination by battery storage might further motivate investigations into incentive compatibility of the current market setup since capacities contracted in the FCR balancing market are unavailable in both spot markets for shifting supply and demand and smoothing price peaks.
Acknowledgements
The Research Council of Norway funded this work via the PowerDig project (Digitalization of short-term resource allocation in power markets) via the ENERGIX program No. 320789. We acknowledge funding from the KIT House of Young Scientists (KHYS) in the form of a travel budget for visiting KIT in Karlsruhe. Special thanks to Benedikt Krieger for his support in data compilation and Oscar Dowson for the continuous support of the SDDP.jl package. We thank colleagues and participants of the NTNU’s Energy System Seminar and the Transatlantic Infraday Conference 2023 in Paris for their input and valuable feedback.
Declaration of Competing Interest
The authors declare that they have no known competing financial interests or personal relationships that could have appeared to influence the work reported in this paper at the time of writing.
CRediT
References
- Aneiros et al. [2013] Aneiros, G., Vilar, J. M., Cao, R., & Munoz San Roque, A. (2013). Functional prediction for the residual demand in electricity spot markets. IEEE Transactions on Power Systems, 28, 4201–4208.
- Backe et al. [2023] Backe, S., Riemer-Sørensen, S., Bordvik, D. A., Tiwari, S., & Andresen, C. A. (2023). Predictions of prices and volumes in the nordic balancing markets for electricity. In 19th International Conference on the European Energy Market (EEM) (pp. 1–6). Lappeenranta, Finland: IEEE.
- Baetens et al. [2020] Baetens, J., De Kooning, J. D. M., Van Eetvelde, G., & Vandevelde, L. (2020). A two-stage stochastic optimisation methodology for the operation of a chlor-alkali electrolyser under variable DAM and FCR market prices. Energies, 13, 5675.
- Barbry et al. [2019] Barbry, A., Anjos, M. F., Delage, E., & Schell, K. R. (2019). Robust self-scheduling of a price-maker energy storage facility in the new york electricity market. Energy Economics, 78, 629–646.
- Boomsma et al. [2014] Boomsma, T. K., Juul, N., & Fleten, S.-E. (2014). Bidding in sequential electricity markets: the nordic case. European Journal of Operational Research, 238, 797–809.
- Bublitz et al. [2019] Bublitz, A., Keles, D., Zimmermann, F., Fraunholz, C., & Fichtner, W. (2019). A survey on electricity market design: Insights from theory and real-world implementations of capacity remuneration mechanisms. Energy Economics, 80, 1059–1078.
- Castagneto Gissey et al. [2018] Castagneto Gissey, G., Dodds, P. E., & Radcliffe, J. (2018). Market and regulatory barriers to electrical energy storage innovation. Renewable and Sustainable Energy Reviews, 82, 781–790.
- Do et al. [2021] Do, L. P. C., Lyócsa, S., & Molnár, P. (2021). Residual electricity demand: an empirical investigation. Applied Energy, 283, 116298.
- Dowson & Kapelevich [2021] Dowson, O., & Kapelevich, L. (2021). SDDP.jl : a julia package for stochastic dual dynamic programming. INFORMS Journal on Computing, 33, 27–33.
- Edenhofer et al. [2013] Edenhofer, O., Hirth, L., Knopf, B., Pahle, M., Schlömer, S., Schmid, E., & Ueckerdt, F. (2013). On the economics of renewable energy sources. Energy Economics, 40, S12–S23.
- Fleten & Kristoffersen [2007] Fleten, S.-E., & Kristoffersen, T. K. (2007). Stochastic programming for optimizing bidding strategies of a nordic hydropower producer. European Journal of Operational Research, 181, 916–928.
- Fleten & Pettersen [2005] Fleten, S.-E., & Pettersen, E. (2005). Constructing bidding curves for a price-taking retailer in the norwegian electricity market. IEEE Transactions on Power Systems, 20, 701–708.
- Fleten et al. [2002] Fleten, S.-E., Wallace, S. W., & Ziemba, W. T. (2002). Hedging electricity portfolios via stochastic programming. In D. N. Arnold, F. Santosa, C. Greengard, & A. Ruszczynski (Eds.), Decision making under uncertainty (pp. 71–93). New York, NY: Springer New York volume 128.
- Fridgen et al. [2020] Fridgen, G., Keller, R., Körner, M.-F., & Schöpf, M. (2020). A holistic view on sector coupling. Energy Policy, 147, 111913.
- Hagemann [2013] Hagemann, S. (2013). Price determinants in the german intraday market for electricity: an empirical analysis. SSRN Electronic Journal, .
- Henni et al. [2022] Henni, S., Becker, J., Staudt, P., Vom Scheidt, F., & Weinhardt, C. (2022). Industrial peak shaving with battery storage using a probabilistic forecasting approach: economic evaluation of risk attitude. Applied Energy, 327, 120088.
- Kiesel & Paraschiv [2017] Kiesel, R., & Paraschiv, F. (2017). Econometric analysis of 15-minute intraday electricity prices. Energy Economics, 64, 77–90.
- Kirkwood [2015] Kirkwood, J. R. (2015). Markov processes. Advances in applied mathematics. Boca Raton, FL: CRC Press/Taylor & Francis Group.
- Klæboe et al. [2015] Klæboe, G., Eriksrud, A. L., & Fleten, S.-E. (2015). Benchmarking time series based forecasting models for electricity balancing market prices. Energy Systems, 6, 43–61.
- Koch & Hirth [2019] Koch, C., & Hirth, L. (2019). Short-term electricity trading for system balancing: An empirical analysis of the role of intraday trading in balancing Germany’s electricity system. Renewable and Sustainable Energy Reviews, 113, 109275.
- Kongelf et al. [2019] Kongelf, H., Overrein, K., Klæboe, G., & Fleten, S.-E. (2019). Portfolio size’s effects on gains from coordinated bidding in electricity markets: a case study of a norwegian hydropower producer. Energy Systems, 10, 567–591.
- Kraft et al. [2020] Kraft, E., Keles, D., & Fichtner, W. (2020). Modeling of frequency containment reserve prices with econometrics and artificial intelligence. Journal of Forecasting, 39, 1179–1197.
- Kraft et al. [2022] Kraft, E., Russo, M., Keles, D., & Bertsch, V. (2022). Stochastic optimization of trading strategies in sequential electricity markets. European Journal of Operational Research, .
- Kuik et al. [2019] Kuik, O., Branger, F., & Quirion, P. (2019). Competitive advantage in the renewable energy industry: evidence from a gravity model. Renewable Energy, 131, 472–481.
- Lund et al. [2015] Lund, P. D., Lindgren, J., Mikkola, J., & Salpakari, J. (2015). Review of energy system flexibility measures to enable high levels of variable renewable electricity. Renewable and Sustainable Energy Reviews, 45, 785–807.
- Löhndorf & Wozabal [2022] Löhndorf, N., & Wozabal, D. (2022). The value of coordination in multimarket bidding of grid energy storage. Operations Research, .
- Löhndorf et al. [2013] Löhndorf, N., Wozabal, D., & Minner, S. (2013). Optimizing trading decisions for hydro storage systems using approximate dual dynamic programming. Operations Research, 61, 810–823.
- Ottesen et al. [2018] Ottesen, S. O., Tomasgard, A., & Fleten, S.-E. (2018). Multi market bidding strategies for demand side flexibility aggregators in electricity markets. Energy, 149, 120–134.
- Pape et al. [2016] Pape, C., Hagemann, S., & Weber, C. (2016). Are fundamentals enough? Explaining price variations in the german day-ahead and intraday power market. Energy Economics, 54, 376–387.
- Pereira & Pinto [1991] Pereira, M. V. F., & Pinto, L. M. V. G. (1991). Multi-stage stochastic optimization applied to energy planning. Mathematical Programming, 52, 359–375.
- Plazas et al. [2005] Plazas, M., Conejo, A., & Prieto, F. (2005). Multimarket optimal bidding for a power producer. IEEE Transactions on Power Systems, 20, 2041–2050.
- Ramsebner et al. [2021] Ramsebner, J., Haas, R., Ajanovic, A., & Wietschel, M. (2021). The sector coupling concept: a critical review. WIREs Energy and Environment, 10.
- Rintamäki et al. [2020] Rintamäki, T., Siddiqui, A. S., & Salo, A. (2020). Strategic offering of a flexible producer in day-ahead and intraday power markets. European Journal of Operational Research, 284, 1136–1153.
- Rotting & Gjelsvik [1992] Rotting, T., & Gjelsvik, A. (1992). Stochastic dual dynamic programming for seasonal scheduling in the norwegian power system. IEEE Transactions on Power Systems, 7, 273–279.
- Rougé & Tilmant [2016] Rougé, C., & Tilmant, A. (2016). Using stochastic dual dynamic programming in problems with multiple near-optimal solutions: SDDP and multiple near-optimal solutions. Water Resources Research, 52, 4151–4163.
- Saretta et al. [2023] Saretta, M., Raheli, E., & Kazempour, J. (2023). Electrolyzer scheduling for nordic FCR services. In 2023 IEEE International Conference on Communications, Control, and Computing Technologies for Smart Grids (SmartGridComm) (pp. 1–6). Glasgow, United Kingdom: IEEE.
- Thingvad et al. [2022] Thingvad, A., Ziras, C., Ray, G. L., Engelhardt, J., Mosbak, R. R., & Marinelli, M. (2022). Economic value of multi-market bidding in nordic frequency markets. In 2022 International Conference on Renewable Energies and Smart Technologies (REST) (pp. 1–5). Tirana, Albania: IEEE.
- Wozabal & Rameseder [2020] Wozabal, D., & Rameseder, G. (2020). Optimal bidding of a virtual power plant on the spanish day-ahead and intraday market for electricity. European Journal of Operational Research, 280, 639–655.
Appendix A Appendix
A.1 Market prices in the investigated period
Market prices for the three markets of DA, ID and FCR in Germany are listed below for the years 2021 (Figure 17) and 2022 (Figure 17). They show a strong increase in the price level from the second half of 2021 and a general increase in volatility throughout 2022.
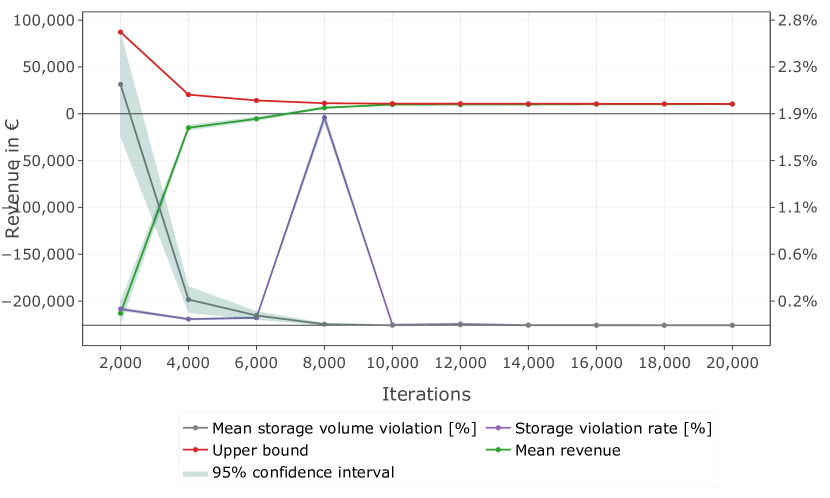
A.2 Selection of the Penalty Term
We have tested different configurations of storage violation penalties, including 100,000 €/MWh (Figure 19), 10,000 €/MWh (Figure 19), and 3,000 €/MWh (Figure 11), along with varying iteration counts. All configurations increase the storage violation penalty term and increase losses within simulations, especially at fewer iterations. After about 8,000 iterations, a violation magnitude of about 1 % for each violation can be observed. However, these minor violations occur more often. Notably, less-trained policies result in higher negative revenues due to storage limit violations, and we observe reduced convergence. The resulting policy at high iteration counts is comparable with lower penalty terms; therefore, we conclude that our lower penalty term of 3,000 €/MWh is sufficient and continue the rest of the investigation with it.
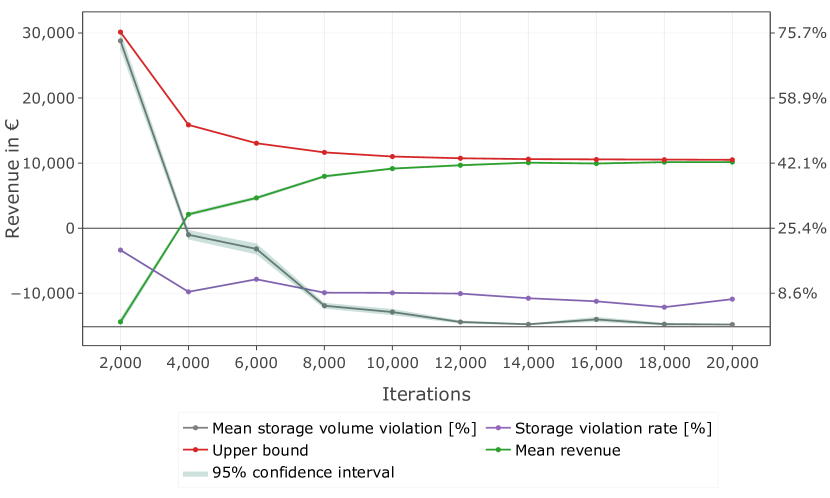
A.3 Removing the ID Constraint
Convergence is reached with an upper bound at 10,500 € but with significant penalty terms, even at higher iteration counts. This leads to higher storage violations, in absolute occurrence and relative strength of the violation, as observable in Figure 21. In Figure 21, we can see more storage violations, especially small fluctuations up and down of the storage limits. We find the general trading patterns unchanged.
A.4 Price Paths of the Markov Chain in the Investigated Period