Interaction of an outflow with surrounding gaseous clouds as the origin of the late-time radio flares in TDEs
Abstract
Close encounter between a star and a supermassive black hole (SMBH) results in the tidal disruption of the star, known as a tidal disruption event (TDE). Recently, a few TDEs, e.g., ASASSN-15oi and AT2018hyz, have shown late-time (hundreds of days after their UV/optical peaks) radio flares with radio luminosities of erg/s. The super-Eddington fallback or accretion in a TDE may generate a mass outflow. Here we investigate a scenario that the late-time radio flares come from the interaction of the outflow with the circum-nuclear gaseous clouds, in addition to the slow-evolving emission component due to the outflow-diffuse medium interaction. We calculate the associated radio temporal and spectral signatures and find that they reproduce well the observations. The outflows have the inferred velocity of 0.2 c, the total mass of and the ejection duration of a month to a year. The distances of the clouds to the SMBH are pc. This scenario has advantages in explaining the long delay, sharpness of the rise and the multiplicity of the late radio flares. Future observations may build up a much larger sample of late-time radio flares and enable their use as a probe of the TDE physics and the host circumnuclear environment.
1 Introduction
Most galaxies are considered to contain a supermassive black hole with a mass above at its nuclei (Ferrarese & Ford, 2005). A star wandering too close to the supermassive black hole would be tidally disrupted as a tidal disruption event (TDE) (Rees, 1988; Phinney, 1989). Accretion of the stellar debris would produce a bright flare in X-ray or UV/optical, which would last for months to years with the light curve decaying as (Rees, 1988; Phinney, 1989).
In TDEs, outflow can be produced via various mechanisms. At the moment of disruption, the unbound debris would fly away at a velocity of km/s (Guillochon et al., 2016; Yalinewich et al., 2019). Besides, a fraction of the matter initially bound to the black hole is likely to be blown away with a velocity of 0.1, where is the light speed, by the radiation pressure when the fallback rate, or the accretion rate, of these bound debris is super-Eddington at early times (Strubbe & Quataert, 2009; Bu et al., 2023b). Furthermore, for black holes with masses greater than , the self-crossing of the fallback stream, due to relativistic apsidal precession, can also generate energetic, fast outflow, and the speed of these outflow ranges from to (Lu & Bonnerot, 2020). Another possibility concerns the relativistic jet which can be generated in the presence of a large magnetic flux threading a rapidly spinning black hole (Blandford & Znajek, 1977; Tchekhovskoy et al., 2011; Bloom et al., 2011; Burrows et al., 2011).
When the high-speed outflow or jet interact with the circumnuclear medium (CNM), it would drive a forward shock in the CNM, and produce radio emission via the synchrotron radiation (Chevalier, 1998; Barniol Duran et al., 2013). In the past decade, dozens of TDEs indeed have shown these GRB-afterglow-like radio emissions, and their radio luminosities span from to erg/s (Alexander et al., 2020). However, the most recent radio observations of some TDEs reveal flares only at a late time ( days after TDE discovery) which are difficult to be explained by the conventional outflow-CNM scenario due to the rapid evolution of light curves, such as ASASSN-15oi and AT2018hyz. The steepest evolution from the outflow-CNM interaction is (Metzger et al., 2012; Krolik et al., 2016; Alexander et al., 2020), but ASASSN-15oi, as well as AT2018hyz, show a jump in flux density from non-detection to detection that requires a temporal power-law steeper than .
Various models have been proposed to explain these late and steeply rising radio flares in TDEs. Cendes et al. (2023) conclude that the delayed outflows, such as from delayed disk formation, are a preferred explanation for these ubiquitous late radio emissions. However, a systematic analysis of the X-ray emission in optically selected TDEs that include those events showing late radio flares, by Guolo et al. (2023), favors the viewing-angle unification models instead of the delayed formation of the accretion disk because early X-ray detection indicates that the accretion disk responsible for the X-ray emission is already present at very early times. Likewise, early radio detection such as AT2019azh suggests that the outflow tends to be launched at the occurrence of TDEs.
In addition, Teboul & Metzger (2023) and Lu et al. (2023) propose a misaligned precessing jet, which is initially choked by the disk wind and may only break out later when the disk eventually aligns itself with the BH spin axis due to the viscous damping of the precession. This jet may produce delayed radio rebrightening seen in TDEs. An alternative model is that of a decelerated off-axis jet (Matsumoto & Piran, 2023; Sfaradi et al., 2024), which we will address in Section 5. Besides, Matsumoto & Piran (2024) find that a power-law CNM density profile followed by a constant outside the Bondi radius can explain the radio flares in AT2020vwl, AT2019dsg, PS16dtm and ASASSN14ae, though it is difficult to explain a rise steeper than like in AT2018hyz.
In the active galactic nuclei, the SMBH is thought to be surrounded by a torus composed of gas clumps or clouds (Krolik & Begelman, 1988; Antonucci, 1993). It is natural to suspect there are circum-nuclear clouds in non-active galaxies as well. One direct evidence comes from the observation of the Milky Way galactic center, which reveals that there are clouds near the Sgr , and the distribution of these clouds indicates a ring-like structure (Mezger et al., 1996; Christopher et al., 2005).
Mou et al. (2022) propose the outflow–cloud interaction can generate considerable radio emission, which may account for the radio flares appearing months or years later after TDE outbursts, and successfully explain the temporal evolution of the peak frequencies of AT2019dsg (Cendes et al., 2021), ASASSN-14li (Alexander et al., 2016), and CSS161010 (Coppejans et al., 2020). Based on the TDEs wind-cloud interaction model, Bu et al. (2023a) find that the predicted peak radio emission frequency, the luminosity at peak frequency, and their time evolution can be well consistent with those in TDEs AT2019dsg (Cendes et al., 2021) and ASASSN-14li (Alexander et al., 2016). Besides the delayed radio flares, outflow-cloud interaction could also produce some other kinds of afterglows, such as neutrinos (Mou & Wang, 2021; Wu et al., 2022), gamma-rays (Mou & Wang, 2021), and X-rays (Mou et al., 2021; Chen & Wang, 2023).
Here, we investigate the outflow-cloud interaction model for these late-time radio flares, where the outflow mass loss rate follows a power law decay with time. This collision forms a bow shock in front of the inner face of the cloud, across which electrons are accelerated and the magnetic field is amplified. The late-time radio synchrotron emission is expected from the shocked outflow. An illustration of the interaction of the TDE outflow with the cloud is shown in Figure 1.
In section 2, we introduce the semi-analytical model for the wind-cloud interaction and calculate the associated synchrotron emission. We also take into account the effect of the interaction of the outflow with a diffuse CNM in section 3. The application of our model to a few TDEs will be presented in section 4. Discussion and conclusion will be given in sections 5 and 6, respectively.
2 Interaction of the outflow with the cloud

2.1 The clouds
Radio observations revealed tens of molecular clouds at a distance of pc from Sgr (Mezger et al., 1996; Christopher et al., 2005). The typical mass of a cloud is with a gas number density of and a size of about 0.1 pc, and the total mass of the torus is about (Mezger et al., 1996; Christopher et al., 2005). As for AGN, the clouds near the black hole have a smaller size of with a higher density of at a similar distance of cm (Armijos-Abendaño et al., 2022). Here we consider the simplest case where the outflow interacts with a cloud at a distance pc to the central blackhole and of a radius pc.
2.2 The outflow
We assume that an accretion-driven outflow was launched at the time of the TDE (). For simplicity, we take its shape to be conical, with a half opening angle of (a solid angle of , Curd & Narayan (2019)). The outflow has a mean velocity of , and the velocities of its front and rear ends are , respectively. The velocity spread is according to the super-Eddington accretion simulation of TDEs (Dai et al., 2018; Bu et al., 2023b). Hereafter we set =0.1 in all the calculation. The effect of a larger will be discussed at the end of Section 2.4.
The outflow was launched for a duration of months. Due to the velocity spread, the radial width of the outflow grows as , where and .
We define as the elapsed time since the start of the outflow-cloud collision, then the temporal evolution of the outflow mass rate at distance will determine the outflow’s density during the collision. We assume it increases linearly over time with a peak at and then follows a power law decay:
| (1) |
where is the peak mass loss rate near the SMBH and then the total mass of the outflow is .
2.3 Radiation properties
Assuming a fraction of the pre-shock outflow kinetic energy is converted into the magnetic energy density (Sari et al., 1998; Yalinewich et al., 2019), the magnetic field strength can be obtained as:
| (2) |
where , , and . Here has a wide range from to (Granot & van der Horst, 2014; Santana et al., 2014; Zhang et al., 2015; Beniamini et al., 2016).
The synchrotron radiation power and characteristic frequency from an electron with a Lorentz factor of are and , respectively, then the peak spectral power is and is independent of (Sari et al., 1998). Thus, the synchrotron peak flux density of the swept-up electrons is , where is the distance of the source and is the total number of emitting electrons.
2.3.1 Time dependence of Radiating electrons
The number of emitting electrons at any given time is:
| (3) |
where is the solid angle of the cloud with respect to the SMBH, so is the fraction of the outflow that indeed interacts with the cloud.
However, these electrons would cool due to both radiation and expansion (Dai et al., 1999), which needs to be taken into account in Eq.(3) . The synchrotron cooling time for electrons with is (Sari et al., 1998)
| (4) |
The adiabatic cooling timescale is generally estimated as the time required for the flow to cross the characteristic spatial scale s where pc (Barkov et al., 2019). However, according to the simulation of outflow-cloud interaction in Mou & Wang (2021), in the case of a long-lasting outflow , the motion of the post-shock stream is confined by the shocked outflow rather than being a free expansion, while it approaches the free expansion if . Therefore, we use the following fitting formula (see Figure B2 in Mou & Wang. 2021) to estimate
| (5) |
The Lorentz factor of electrons which radiate mainly in GHz is about since is of the order of 0.1 G, and we have . Therefore, the electron cooling is dominated by the adiabatic expansion.
Taking this cooling timescale into account, Eq.(3) would be corrected as:
| (6) |
since the electrons accelerated at a time of earlier would have all cooled down.
2.3.2 Synchrotron spectrum
The synchrotron flux density at any given frequency can be calculated with and the spectral shape (Sari et al., 1998). Electrons are usually accelerated to a power-law distribution as where is the spectral index and is the minimum Lorentz factor of the electrons (Sturner et al., 1997; Gaisser et al., 1998; Sari et al., 1998). The coefficient is obtained with . Assuming a fraction of the outflow’s kinetic energy goes into accelerating electrons, can be calculated based on the total energy of the accelerated electrons: .
The spectrum produced by these power-law electrons is featured with three breaking frequencies. Figure 2 shows all the six possible spectra cases, each of which consists of three or four power law segments, and the red star marks (Granot & Sari, 2002; Gao et al., 2013).

The first breaking frequency is the characteristic frequency:
| (7) |
where .
The second is the self-absorption frequency , below which the emitting region is optically thick. It can be obtained by solving where is the radial width of the emitting region and is the self-absorption coefficient (Rybicki & Lightman, 1986). Thus, this frequency is numerically estimated as:
| (8) |
where days.
The cooling frequency , where electrons with Lorentz factor would have cooled down in the time , can be obtained by solving which gives (Sari et al., 1998), and the corresponding cooling frequency is
| (9) |
A comparison of these three breaking frequencies suggests that the upper right case () in Figure 2 is concerned most of the time. Given that the observational frequencies are near the peak frequency which would lead to significant deviation in flux by our asymptotic computation, here we smooth our analytical spectra with the following equation (Granot & Sari, 2002):
| (10) |
where ,, and .
2.4 Light curve from the shocked outflow
The radio flare from the outflow-cloud interaction would appear at a time of 0.1 pc/0.1 c s (years after TDEs). The peak luminosity at 1 GHz at time can be crudely estimated as:
| (11) |
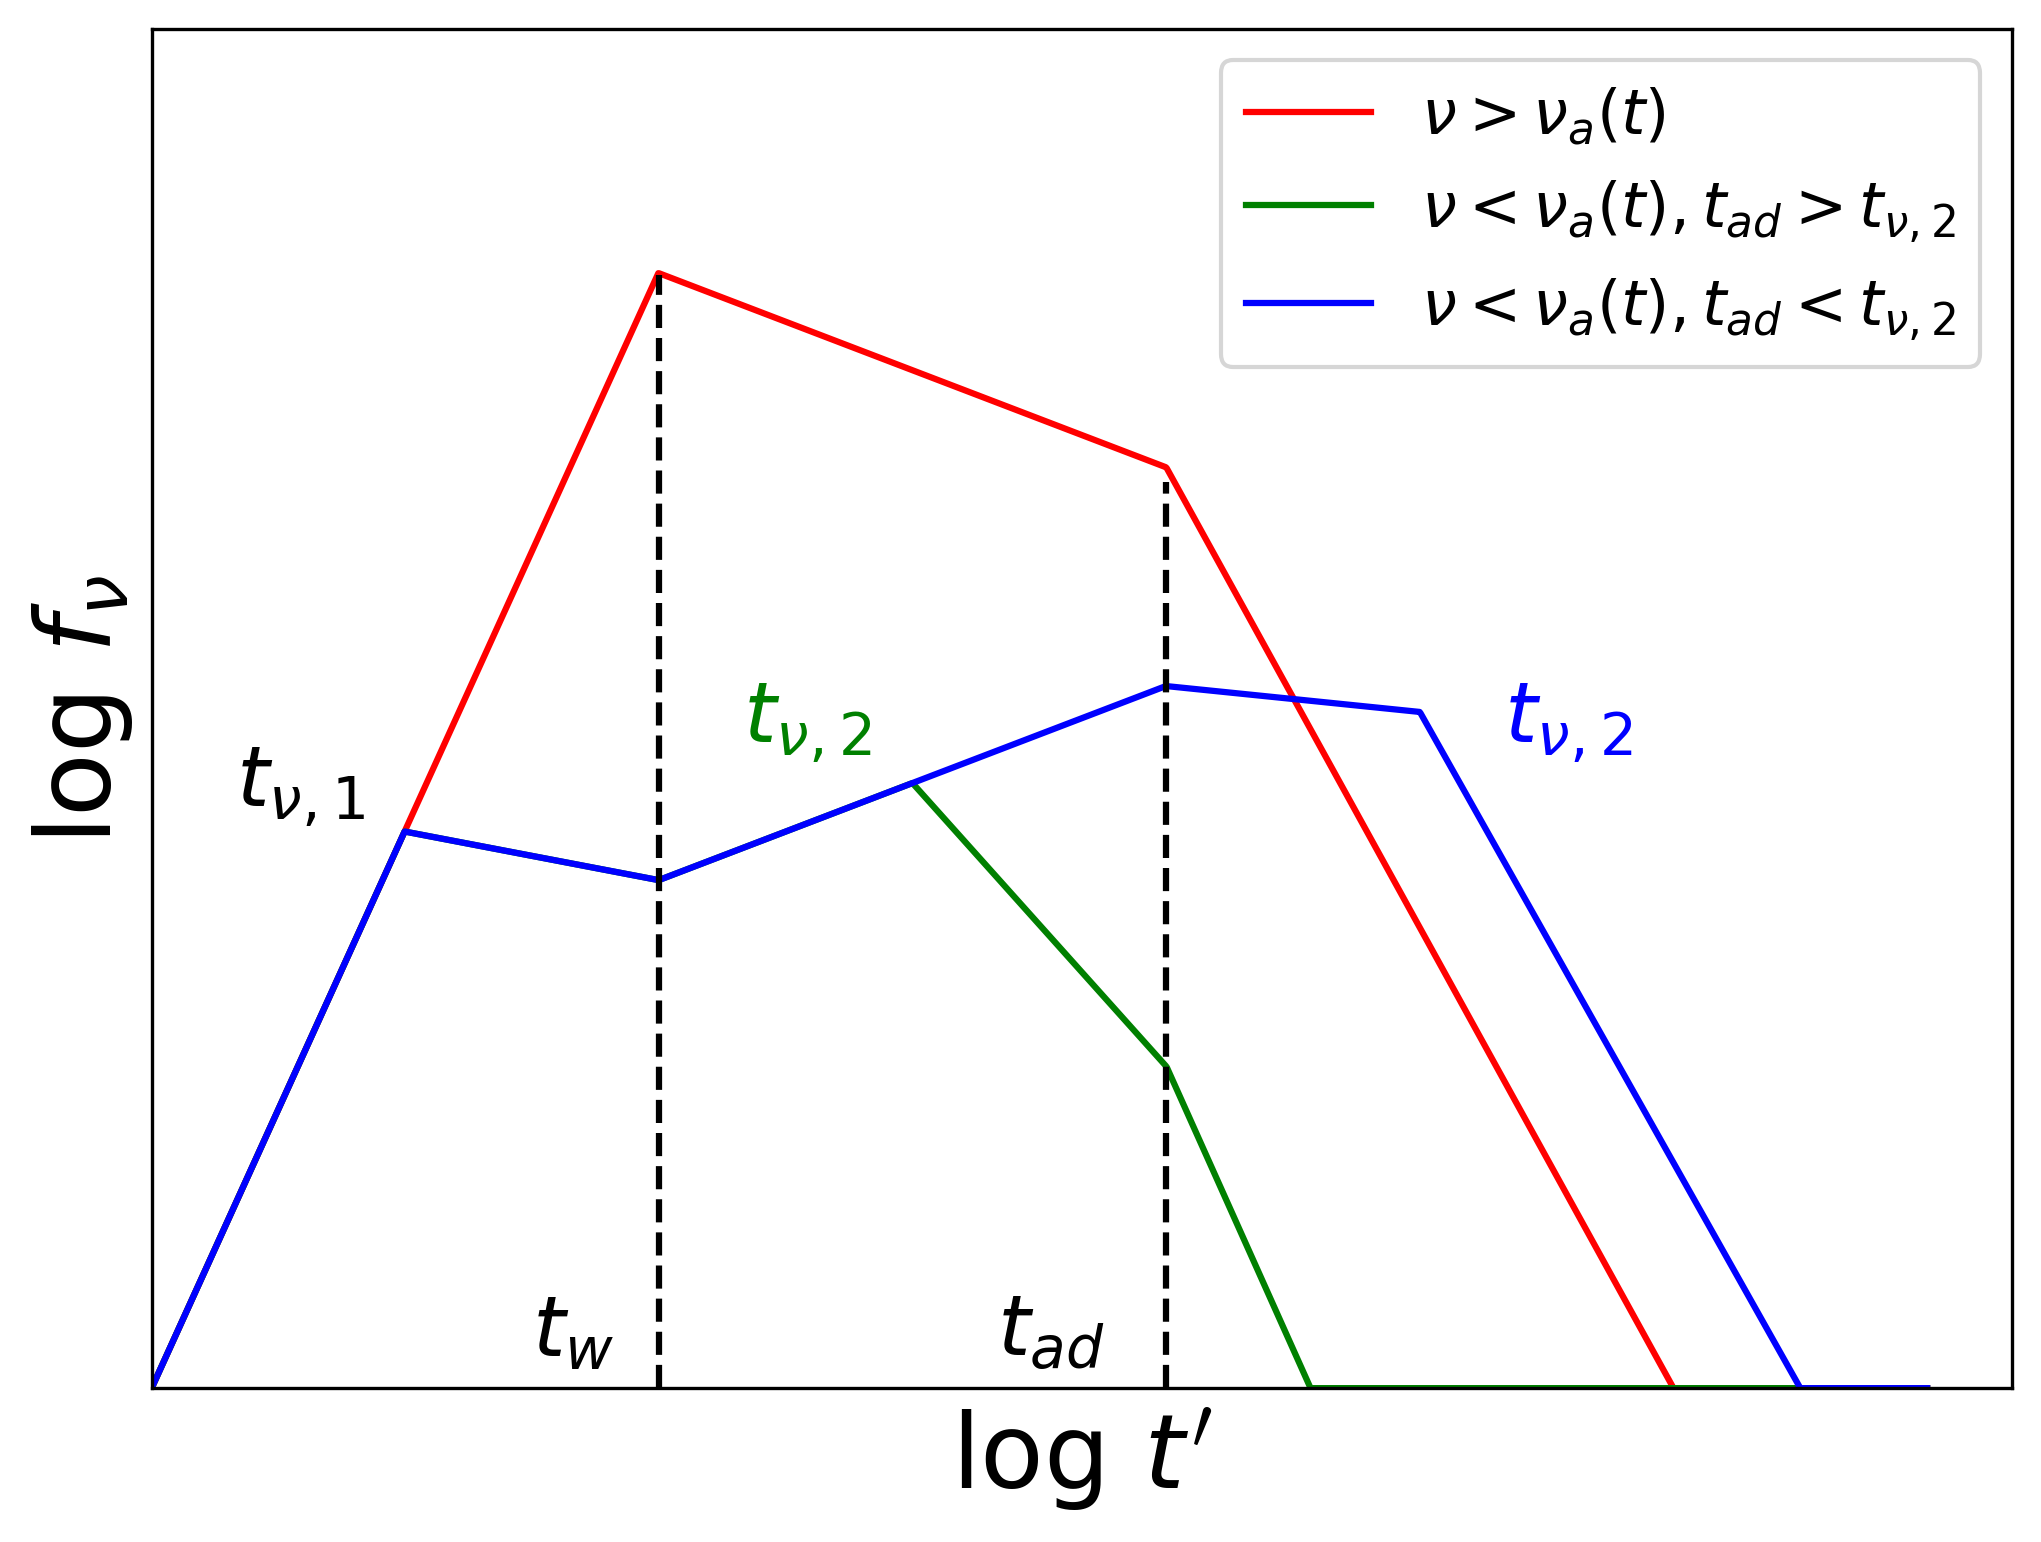
Since changes with the density of the outflow and peaks at , the flux at different frequencies would evolve differently. Figure 3 shows the sketch of the predicted radio light curve at different frequencies.
For (red line), the radio light curve would vary with the growth of the density of the outflow as . Later it would peak at , when the density of the outflow starts declining in the power-law form while remains nearly unchanged. As passes , the decrease in due to the adiabatic expansion would make decrease more rapidly.
For (green line), as increases with time, the light curve would decline as after . Later when peaks at and starts to decrease, the light curve would rise again as and then decline as once drops below . Likewise, the light curve would decrease faster after .
It is worth noting that the decrease in would star earlier than (blue line). In this case, the radio light curve would peak at , and its subsequent decay would be slowed (or even re-rise) as drops to . Later when crosses , the light curve would decline faster.
It is clear from the above discussion that the light curve of the radio flare would rise on the timescale of , which is in turn determined by the width of the outflow . Since usually for , it would be natural for this model to reproduce the observed sharp rise of the late radio flare.
However, a larger would cause a wider width, and thus a shallower rise of the light curve. We found that a small velocity spread is required in order to match the data, therefore is set in this paper.
3 The outflow-CNM interaction
Besides the clouds, there is almost certainly a diffuse CNM and the outflow-CNM interaction would produce radio emission as well. Furthermore, changes in the velocity of the outflow due to its interaction with the CNM would affect the radiation properties from the bow shock.
Here we assume a CNM density profile where is a constant and pc, similar to the density distribution of CNM around Sgr (Xu et al., 2006; Gillessen et al., 2019). We model the hydrodynamic evolution of the outflow under a set of hydrodynamical equations (Huang et al., 2000) :
| (12) | ||||
| (13) | ||||
| (14) |
where is the swept mass of the CNM by the forward shock and describes the radiation efficiency.
Integrating these equations with proper initial conditions, we can obtain the hydrodynamic evolution of the outflow, and calculate the associated radiation properties from the shocked CNM according to Sari et al. (1998).
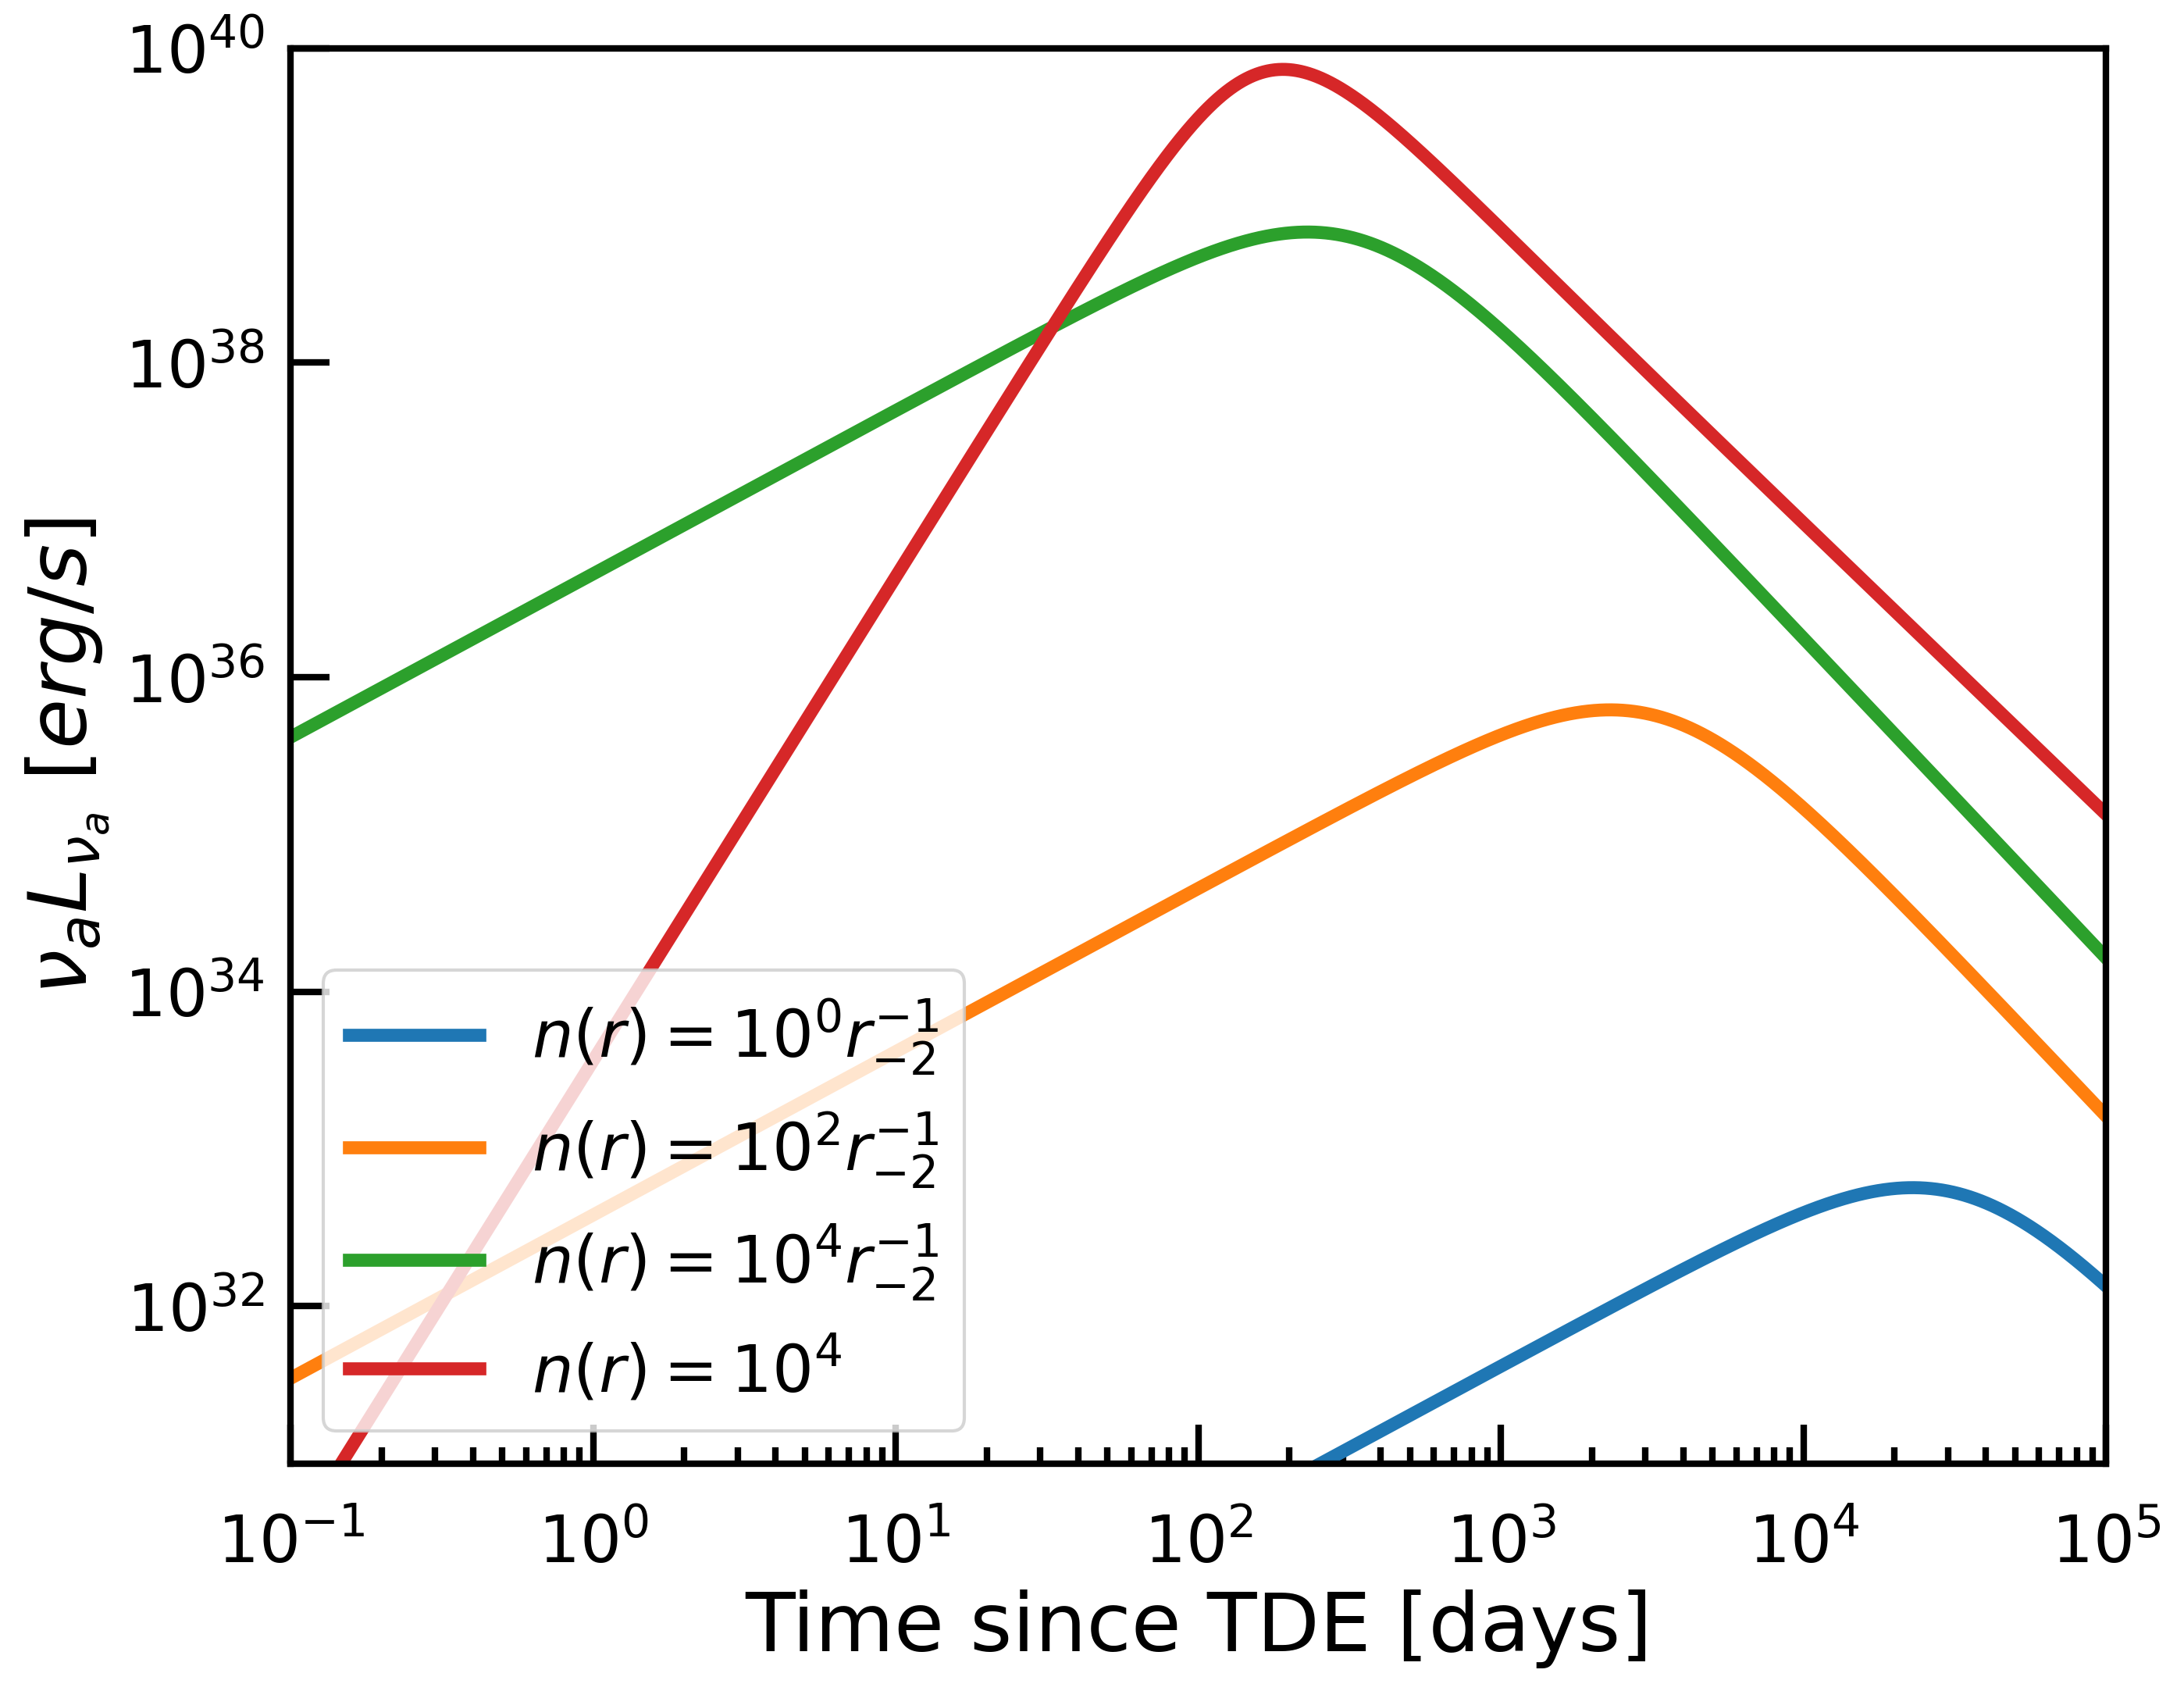
We then investigate the parameters dependence of the radio light curve from the shocked CNM. Figure 4 shows the predicted radio light curves at different CNM density profiles. The peak luminosities span a wide range from erg/s to erg/s. The radio light curve would rise until it reaches the peak at after which the forward shock starts to decelerate. The deceleration timescale can be crudely estimated by equaling the mass of the outflow to the mass of the shocked CNM.
Since the energy transformed to the shock is the same, a denser CNM (i.e. a higher A) would produce a brighter and earlier radio flare, while a more dilute CNM would lead to a dimmer, thus maybe undetectable, flare ( erg/s), as shown in Figure 4. In addition, when applying the outflow-cloud model, the CNM density profile should be set carefully to make sure that the outflow velocity is high enough while colliding with the cloud so that it can produce a bright late-time radio flare.
4 Application
| CNM | Forward shock | Outflow | Cloud | Bow shock | ||||||
| [ ] | [] | [] | [] | [ day] | [ pc] | [ pc] | ||||
| AT 2020vwl | 5.8 | 2 | 1 | 0.24 | 0.6 | 0.4 | 1.22 | 0.81 | 20 | 100 |
| AT 2019azh | 0.85 | 1 | 1 | 0.46 | 0.45 | 0.9 | 1.06 | 0.38 | 5 | 40 |
| AT 2019azh(2) | 2 | 0.8 | 20 | 140 | ||||||
| IGR J12580+0134 | 7 | 1 | 1 | 0.41 | 4 | 0.56 | 4.23 | 1.9 | 10 | 100 |
| AT 2018hyz | 0.8 | 17 | 3.12 | 5.6 | 2.13 | 5 | 1 | |||
| ASASSN-15oi(1) | 0.85 | 1 | 0.3 | 0.66 | 0.1 | 5 | 1 | |||
| ASASSN-15oi(2) | 0.8 | 1.13 | 0.3 | 2 | 2 | |||||
| ASASSN-15oi(3) | 0.73 | 1.52 | 0.67 | 2 | 3 | |||||
| ASASSN-15oi(4) | 0.70 | 6.67 | 1.75 | 20 | 100 | |||||
| ASASSN-15oi(5) | 0.68 | 12.4 | 4.3 | 20 | 100 | |||||

In this section, we apply our model to five TDE candidates with late-time radio flares: AT2018hyz, AT2019azh, ASASSN-15oi, IGR J12580+0134 and AT2020vwl. Their radio light curves are shown in Figure 5, with peak luminosities of erg/s.
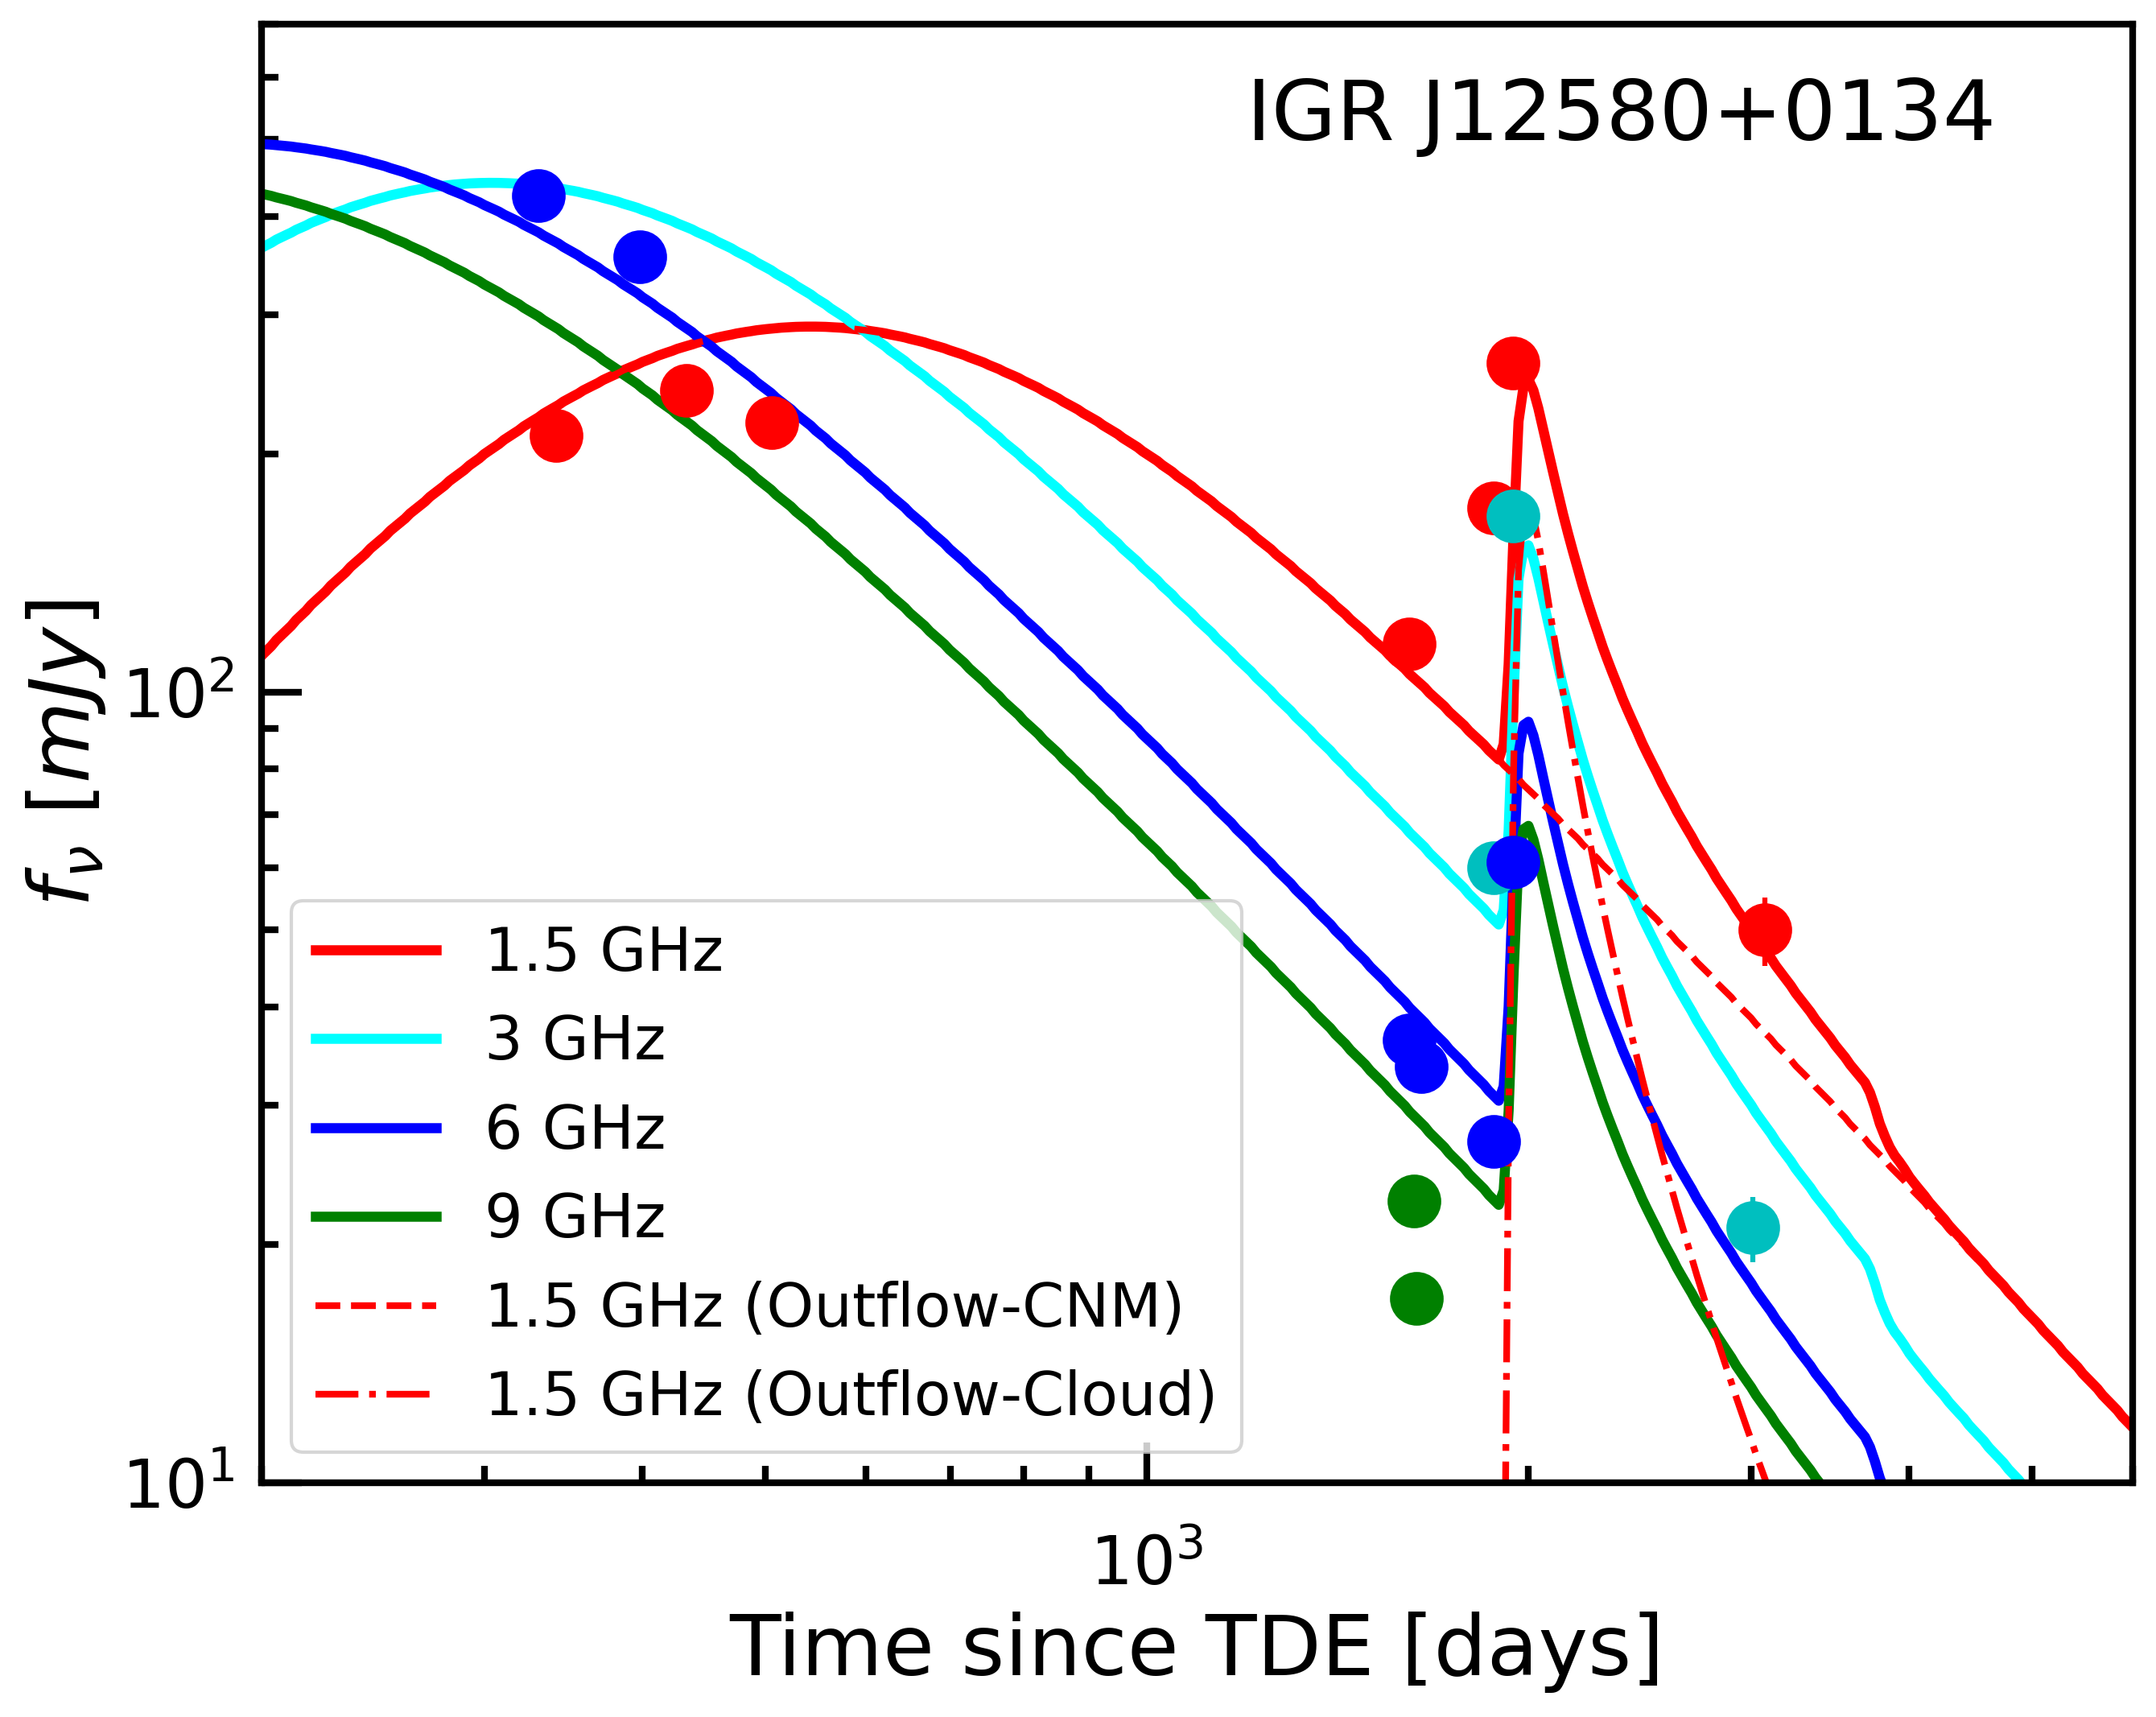
Besides showing late-time radio flares, two events, AT2019azh and AT2020vwl, show an earlier peak (t200 days) as well. Noticing their apparent slow evolution, we would interpret these early flares as being due to the outflow-CNM interaction. A third event, IGR J12580+0134, shows a slow decline before the late, rapid rebrightening (see Figure 9). We would interpret this decline as being the outflow-CNM interaction as well. Note that the early radio flare would be missing if the CNM is dilute enough, which we think to be the case for the other events.
4.1 AT2020vwl
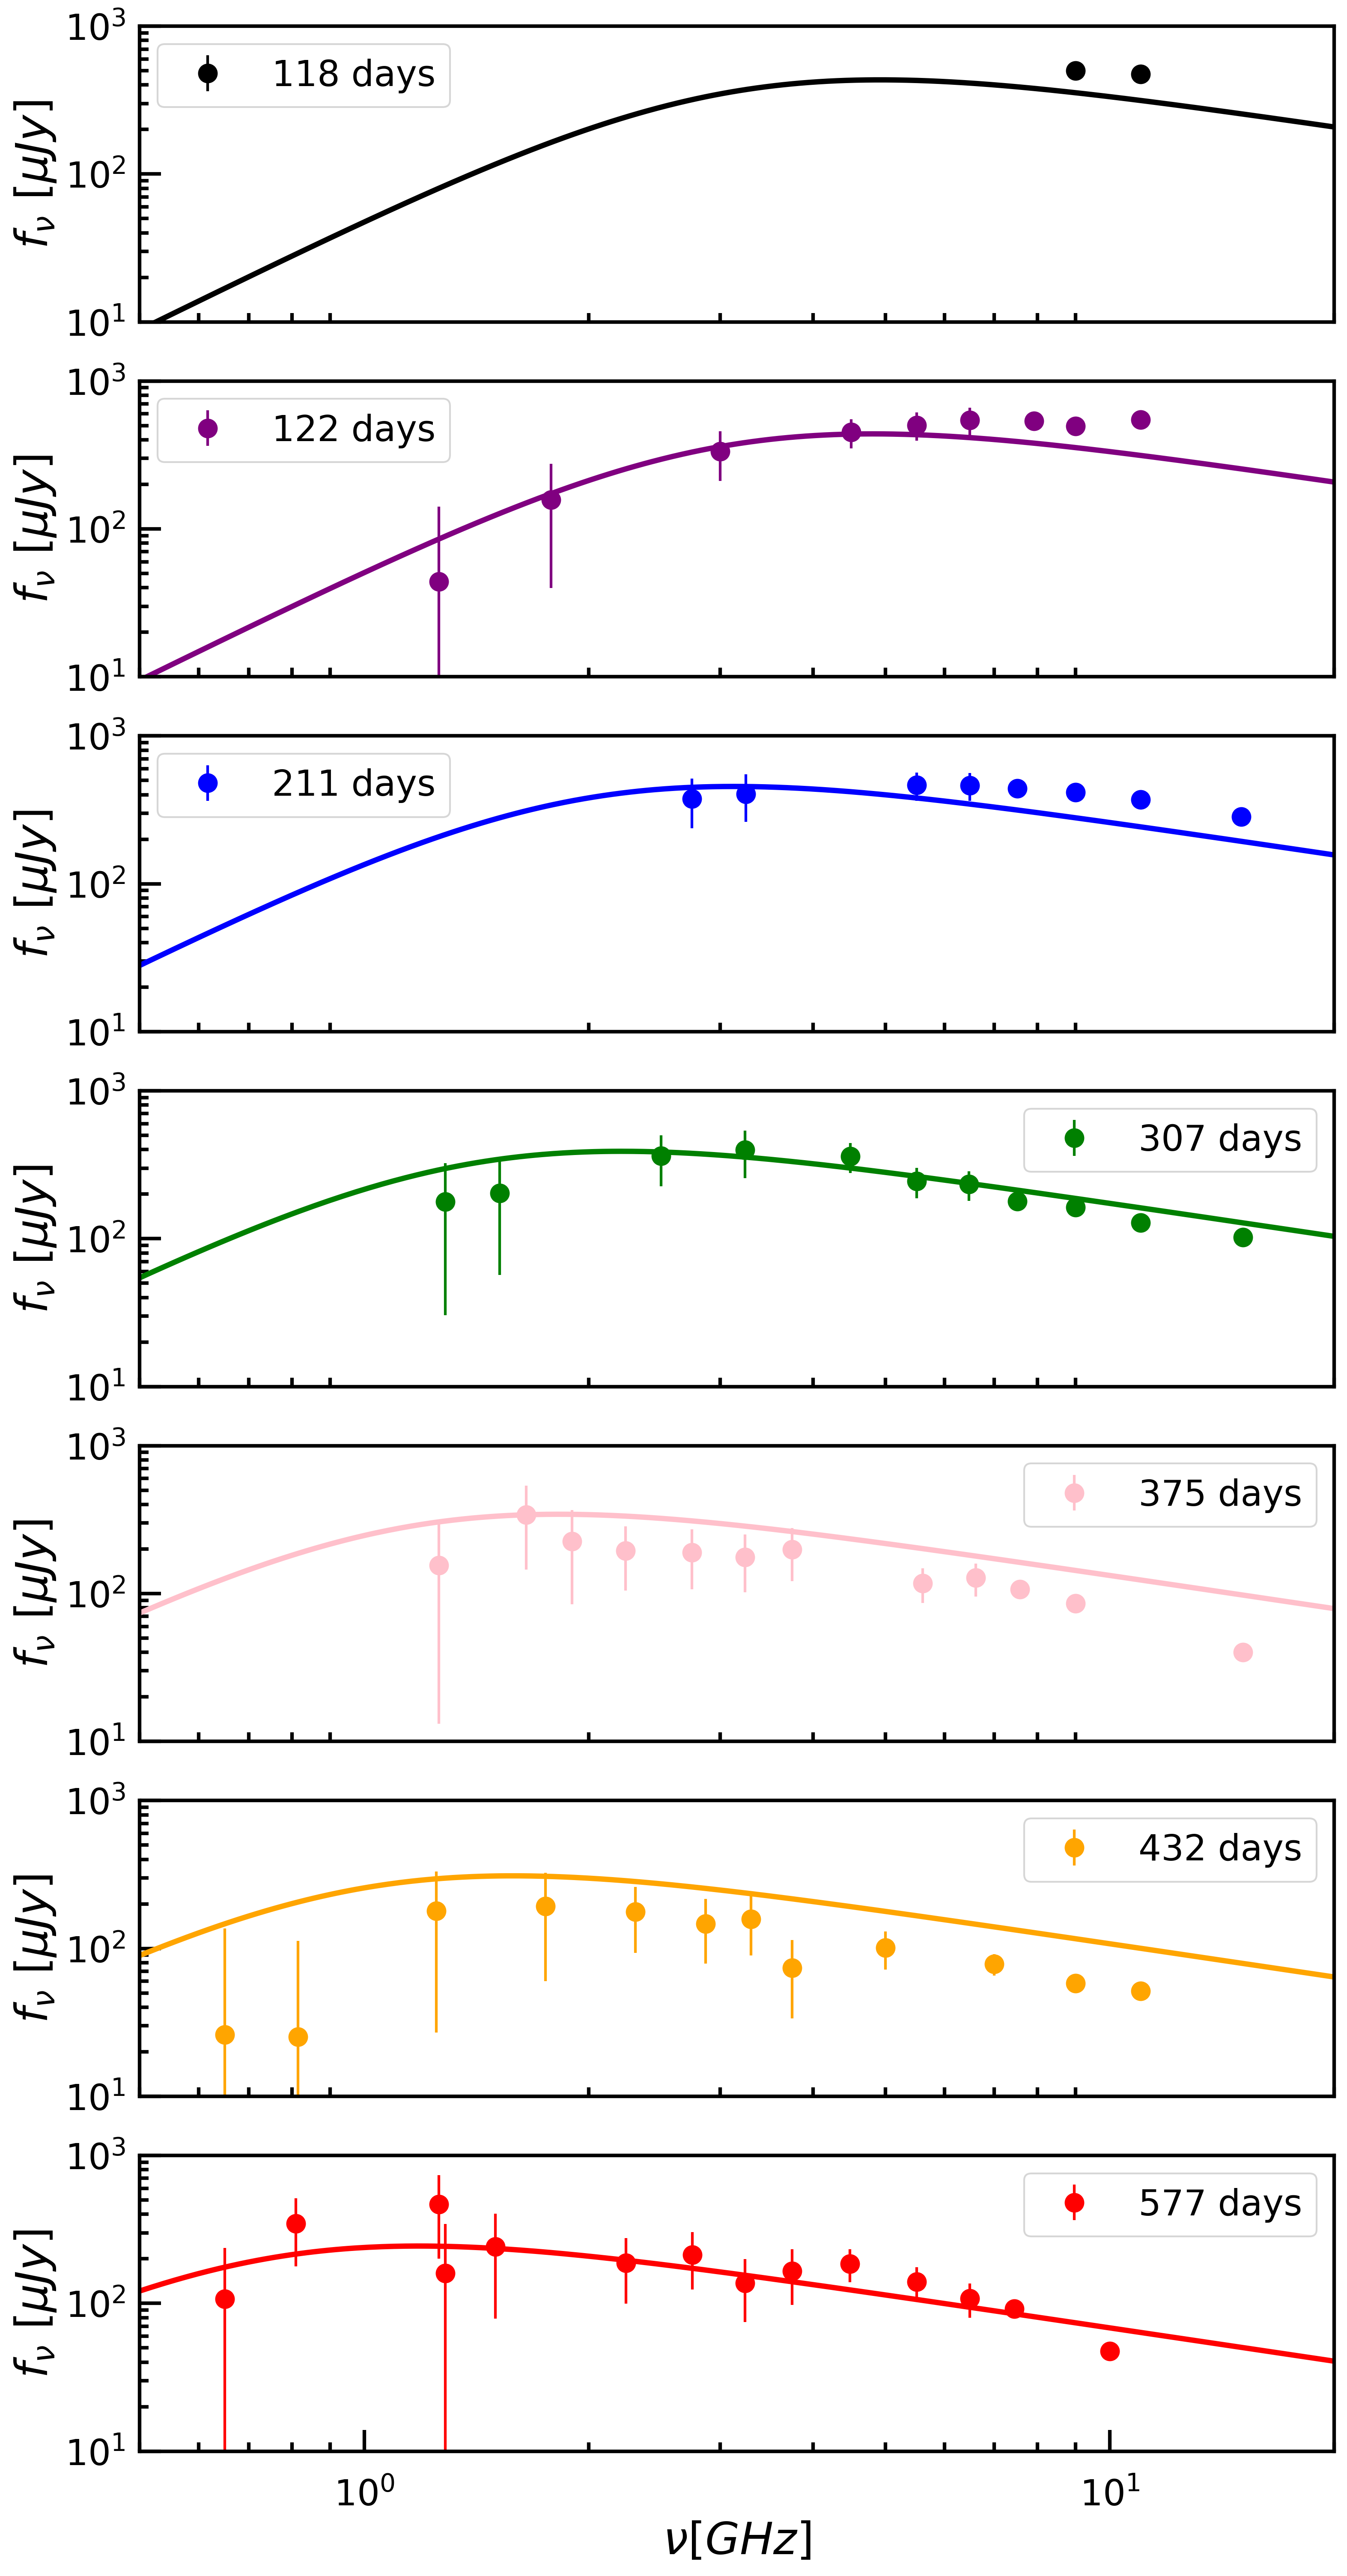

Figure 6 shows the model fittings of the temporal evolution of the spectra from the outflow-CNM interaction for AT2020vwl with parameters listed in Table 1. The peak frequency from observations exhibits a slow decay that our model can reproduce, and the spectrum at 577 days is well explained by the outflow-CNM interaction.
For the rebrightening at days, we model with the outflow-cloud interaction. Figure 7 shows the light curve comparison between the model and observation at 5 GHz.
4.2 AT2019azh
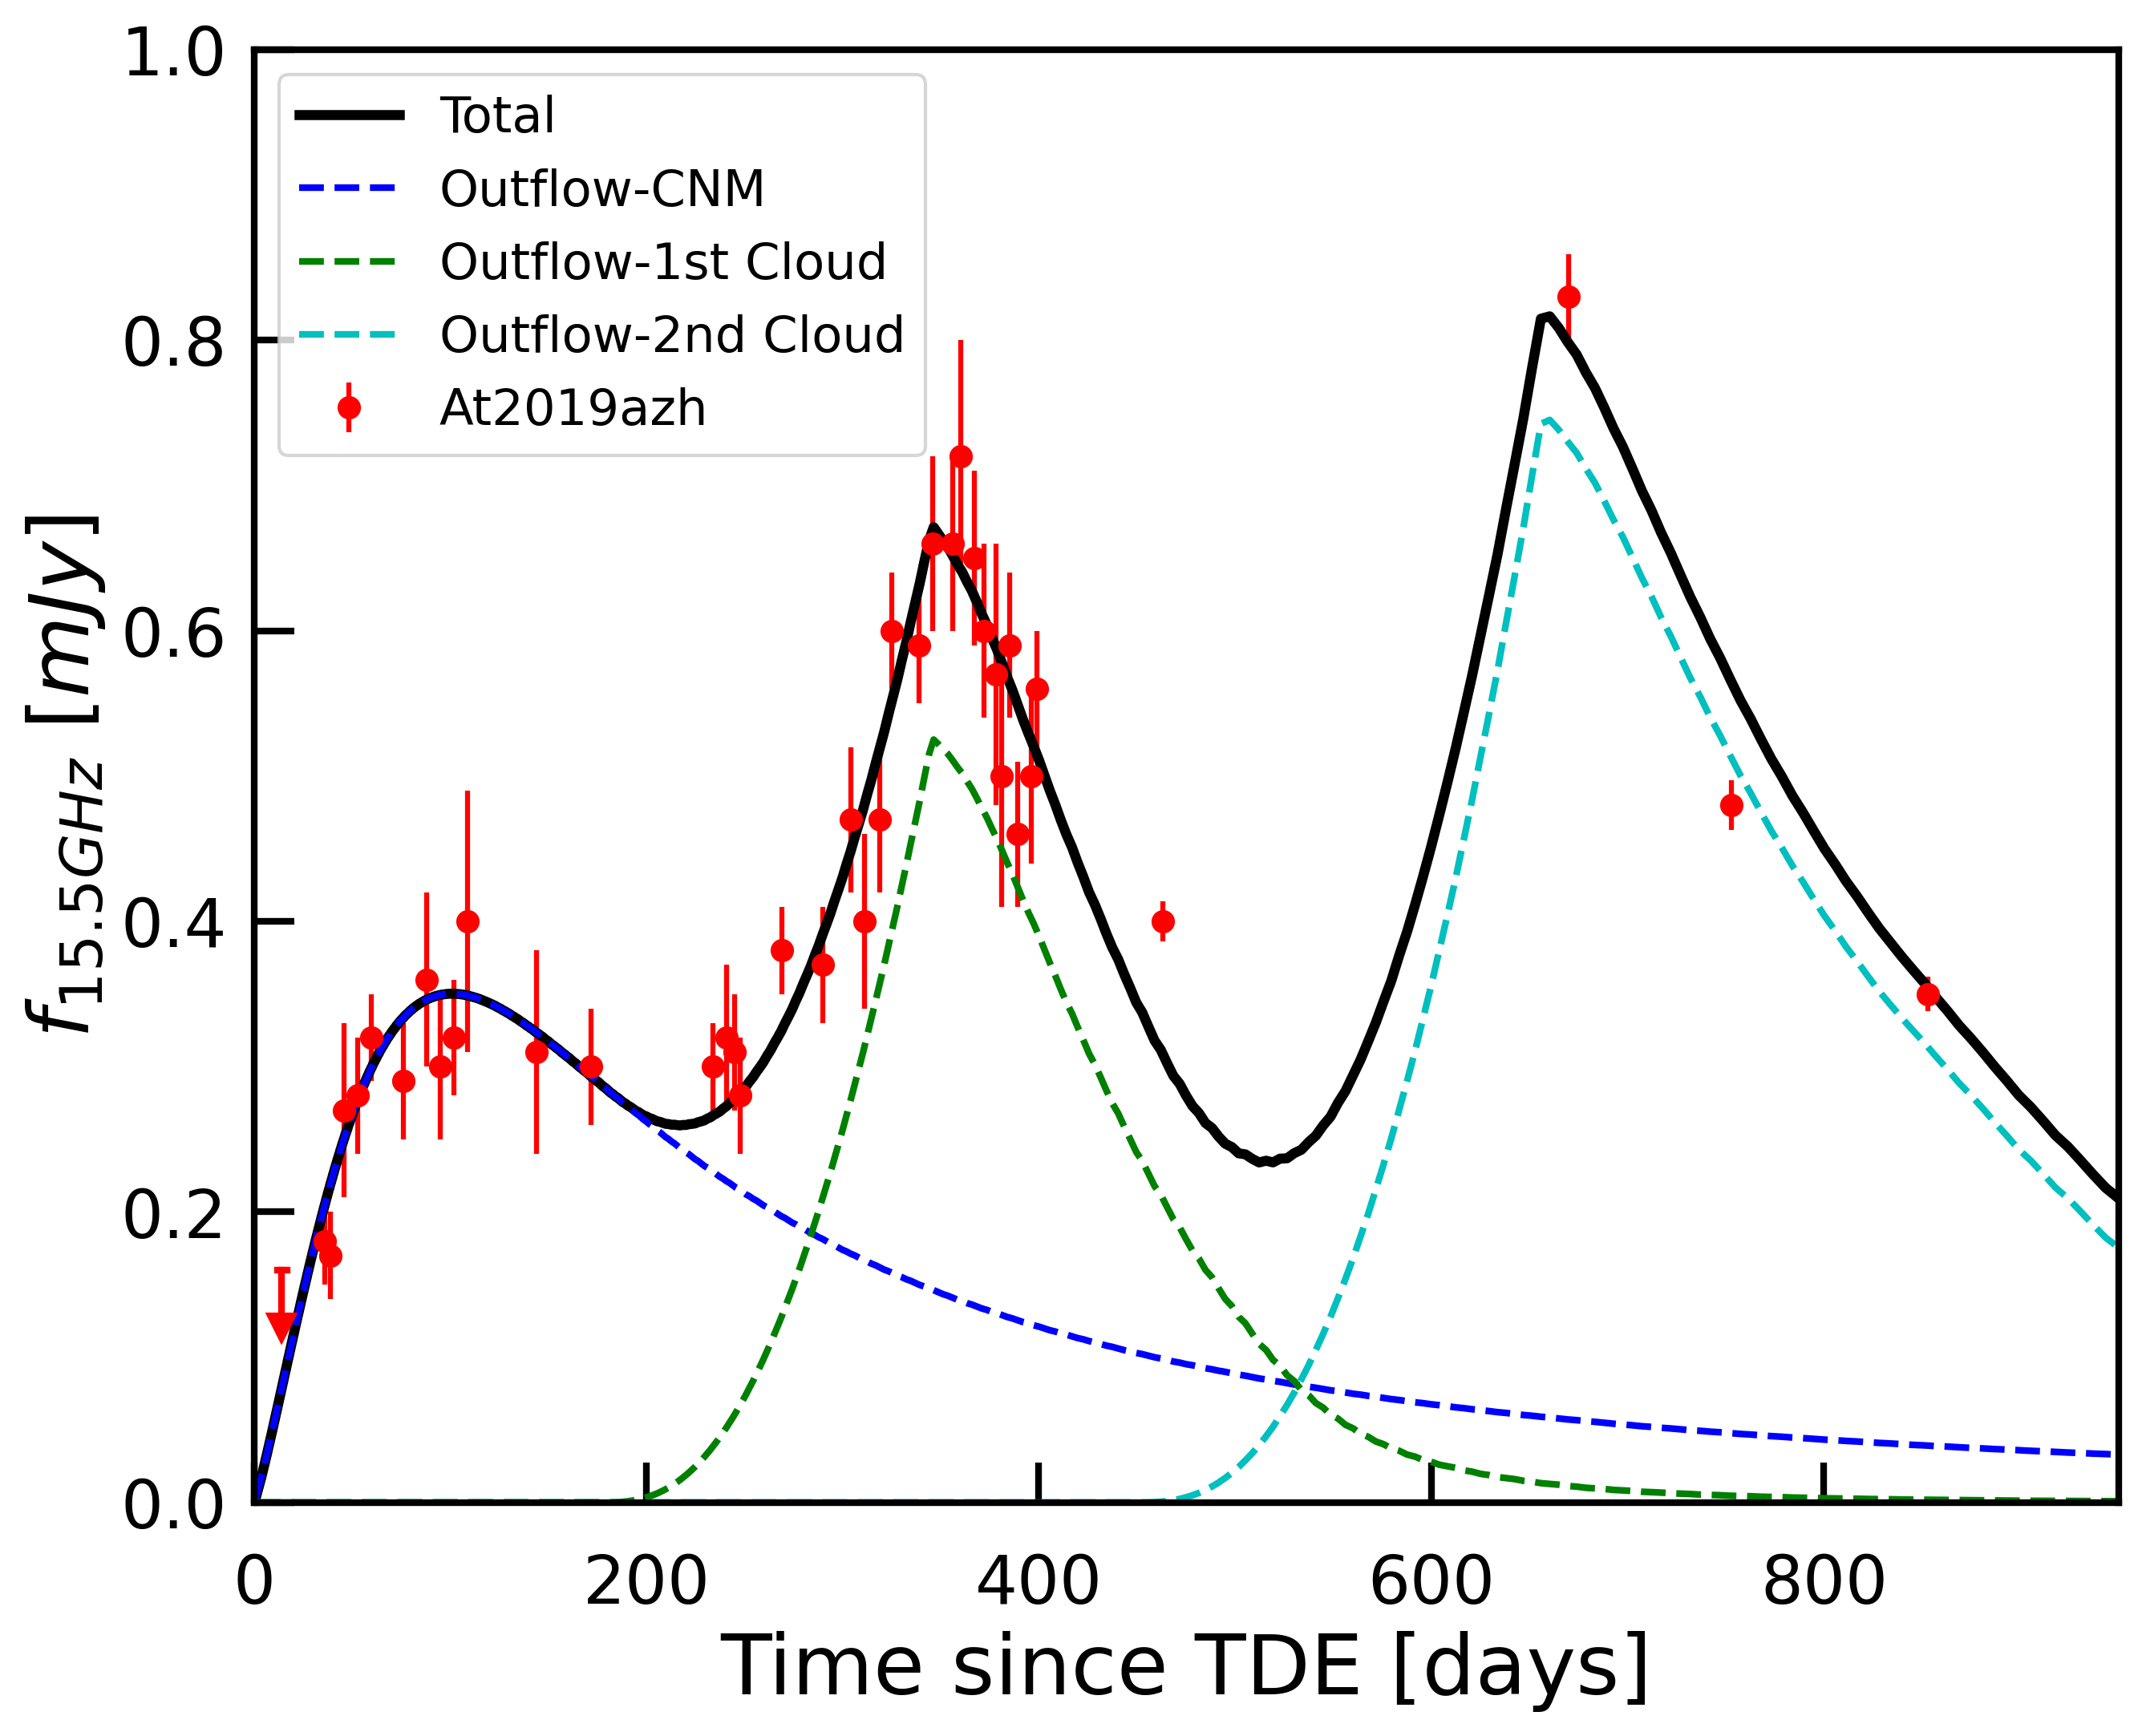
The 15.5 GHz radio observation in AT2019azh shows an early rise of about 30 days and is followed by a late-time brighter radio flare with a peak luminosity of erg/s at about 350 days (Sfaradi et al., 2022). Even later (t400 days) observation at GHz by Goodwin et al. (2022) reveals that the light curve at 15.5 GHz would have re-brightened again at days, with an even higher peak. These would suggest that the outflow might have collided with two clouds, one inner and the other outer in distance. Figure 8 shows the light curves from the model calculation, compared with the observational data at 15.5 GHz. The later (t400 days) data has been extrapolated from GHz to 15.5 GHz using a power-law spectral model. The overall model parameters adopted are listed in Table 1.
The outflow-CNM interaction produces a radio flare that peaks at about 100 days. Though the outflow is decelerating, its velocity is higher than 0.2 c while colliding with the clouds. So when the clouds are hit, with high and , the late-time and brighter radio flares are generated. The power-law index of the temporal decay of the outflow mass rate determines how fast the flare decays and we found an index of 2 is preferred over .
4.3 IGR J12580+0134
The radio emission of IGR J12580+0134 was detected 350 days after the X-ray outburst and shows a decline, while later observation at 1,300 days reveals a second flare in the radio with a peak luminosity of erg/s (Perlman et al., 2022). Figure 9 shows the comparison of our model with the observed light curves at different frequencies. The parameters adopted are listed in Table 1.
For the outflow-CNM interaction, the light curve at would all peak at , while at lower frequencies they would peak at a later time when crosses them. As for the outflow-cloud interaction, the predicted light curves are expected to peak at the same time since these observed frequencies are all higher than in our model.
4.4 AT2018hyz
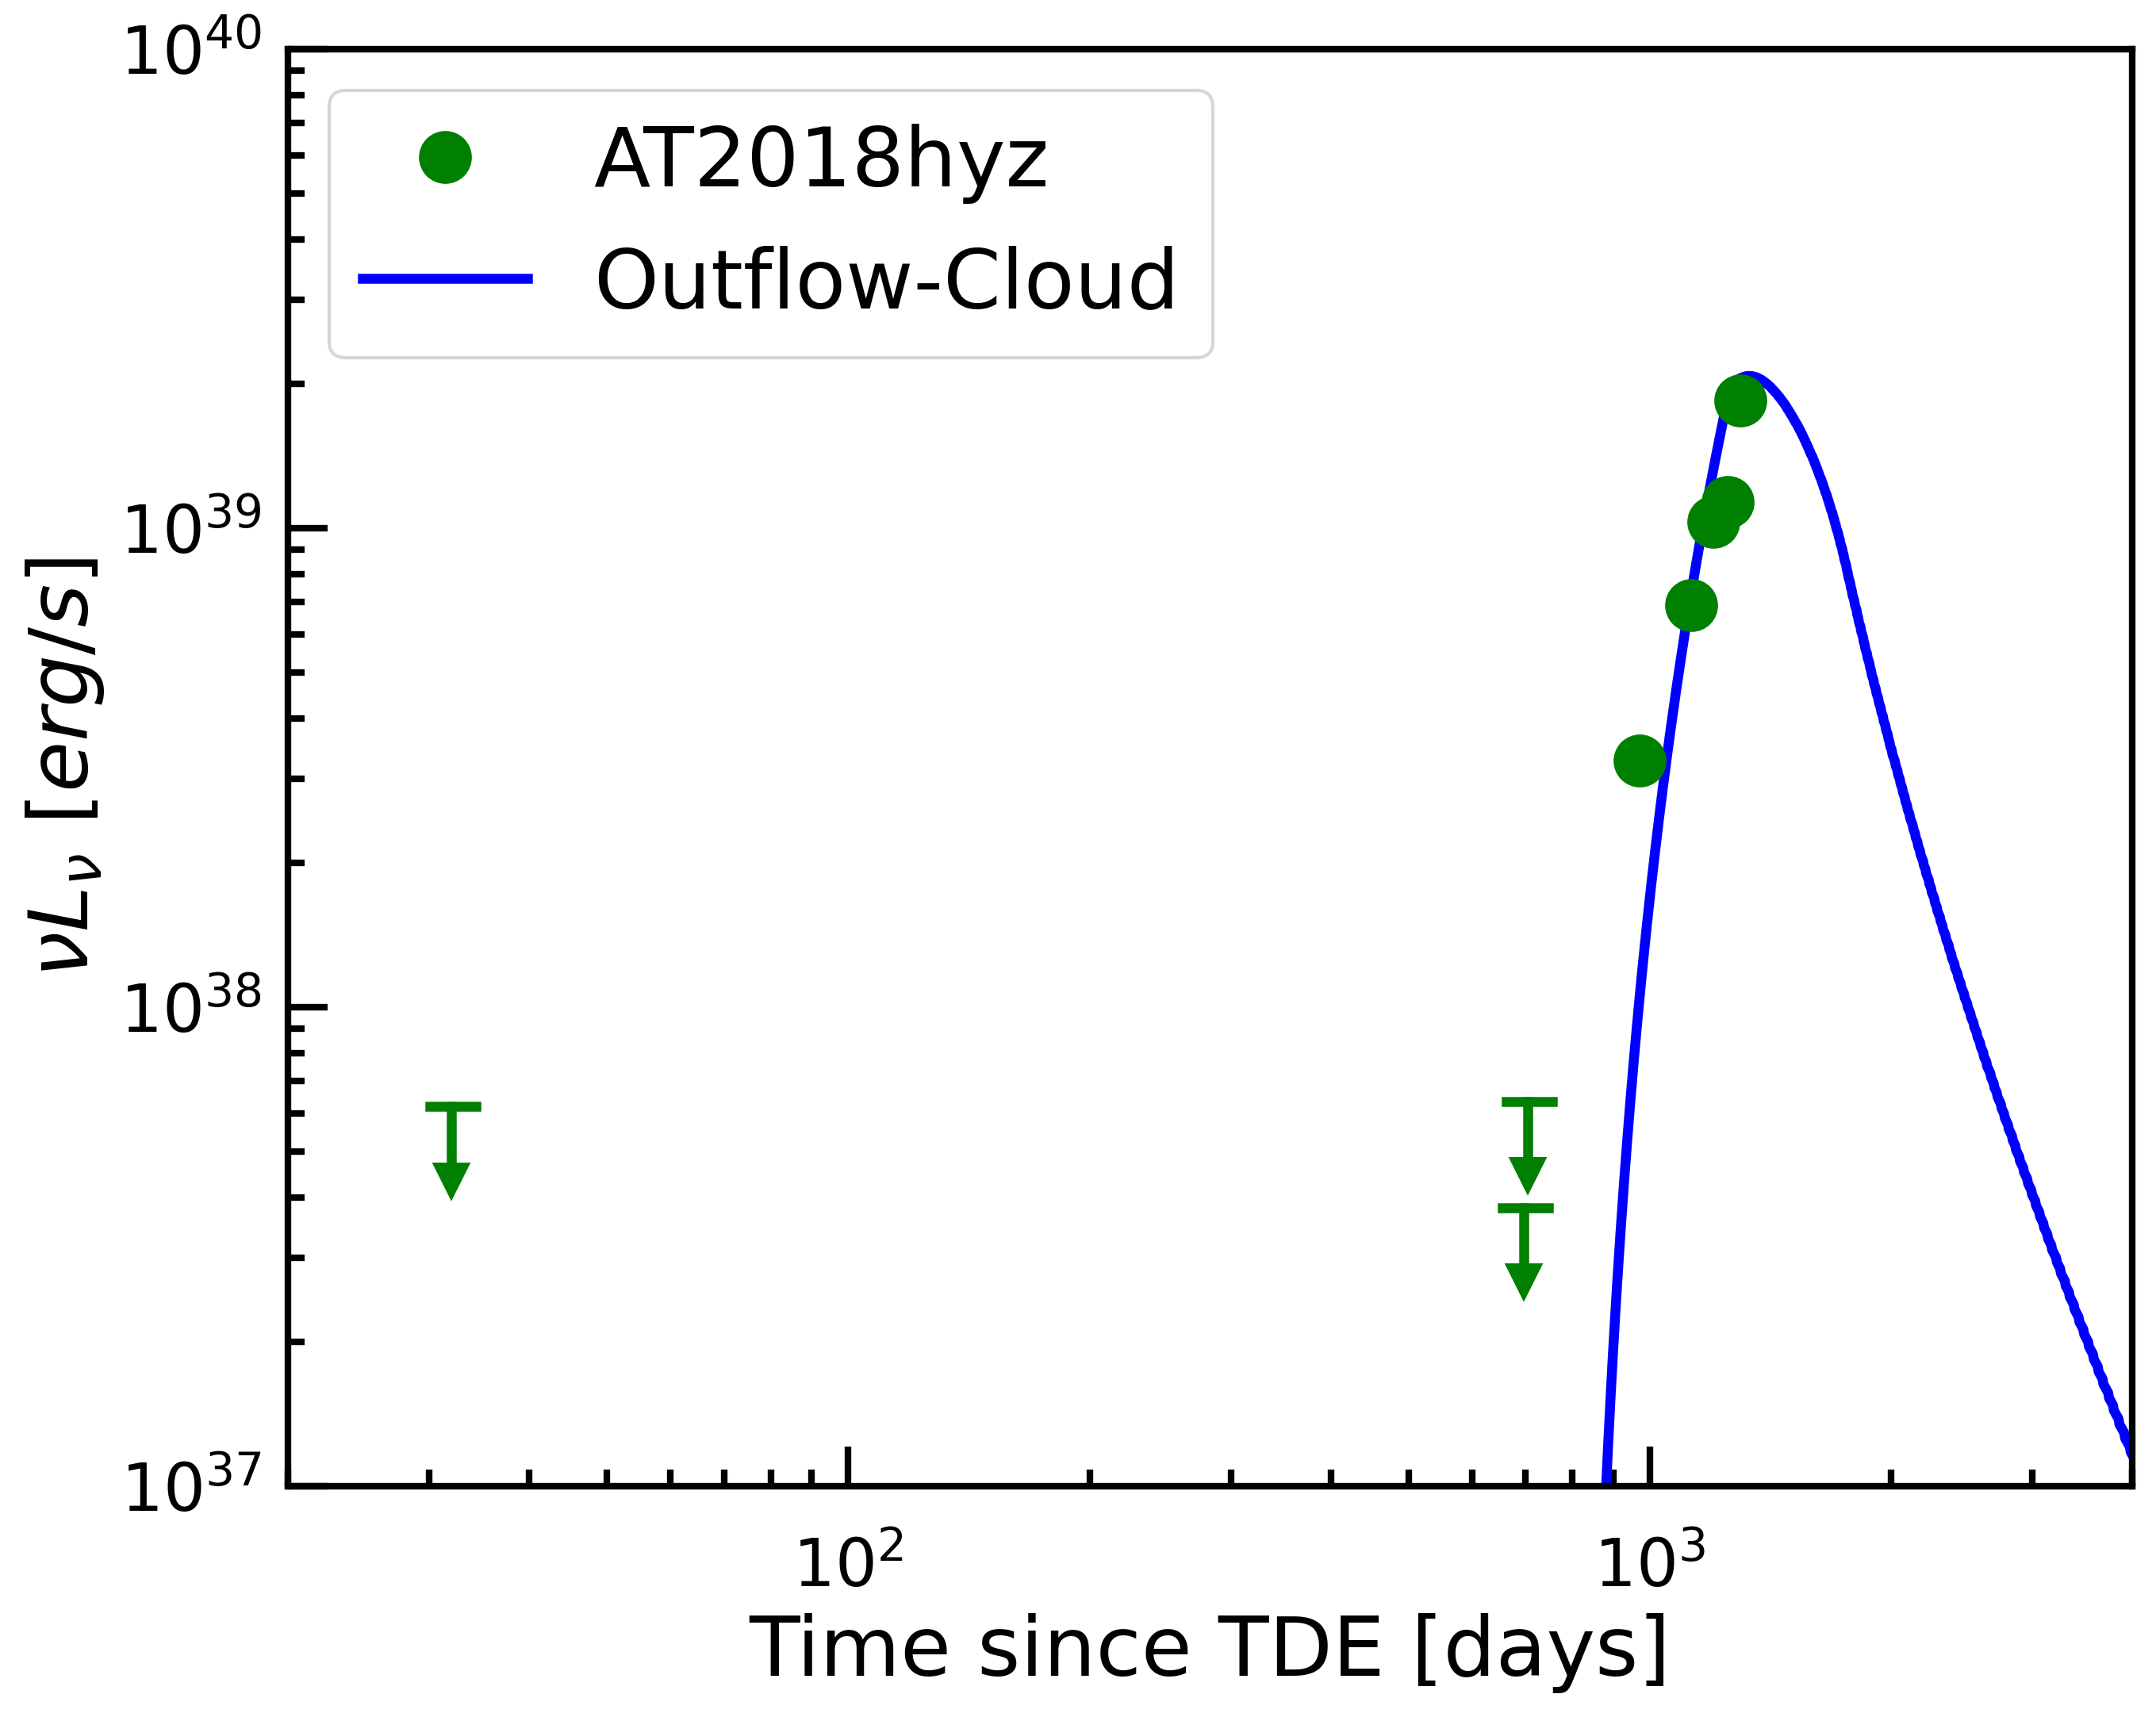
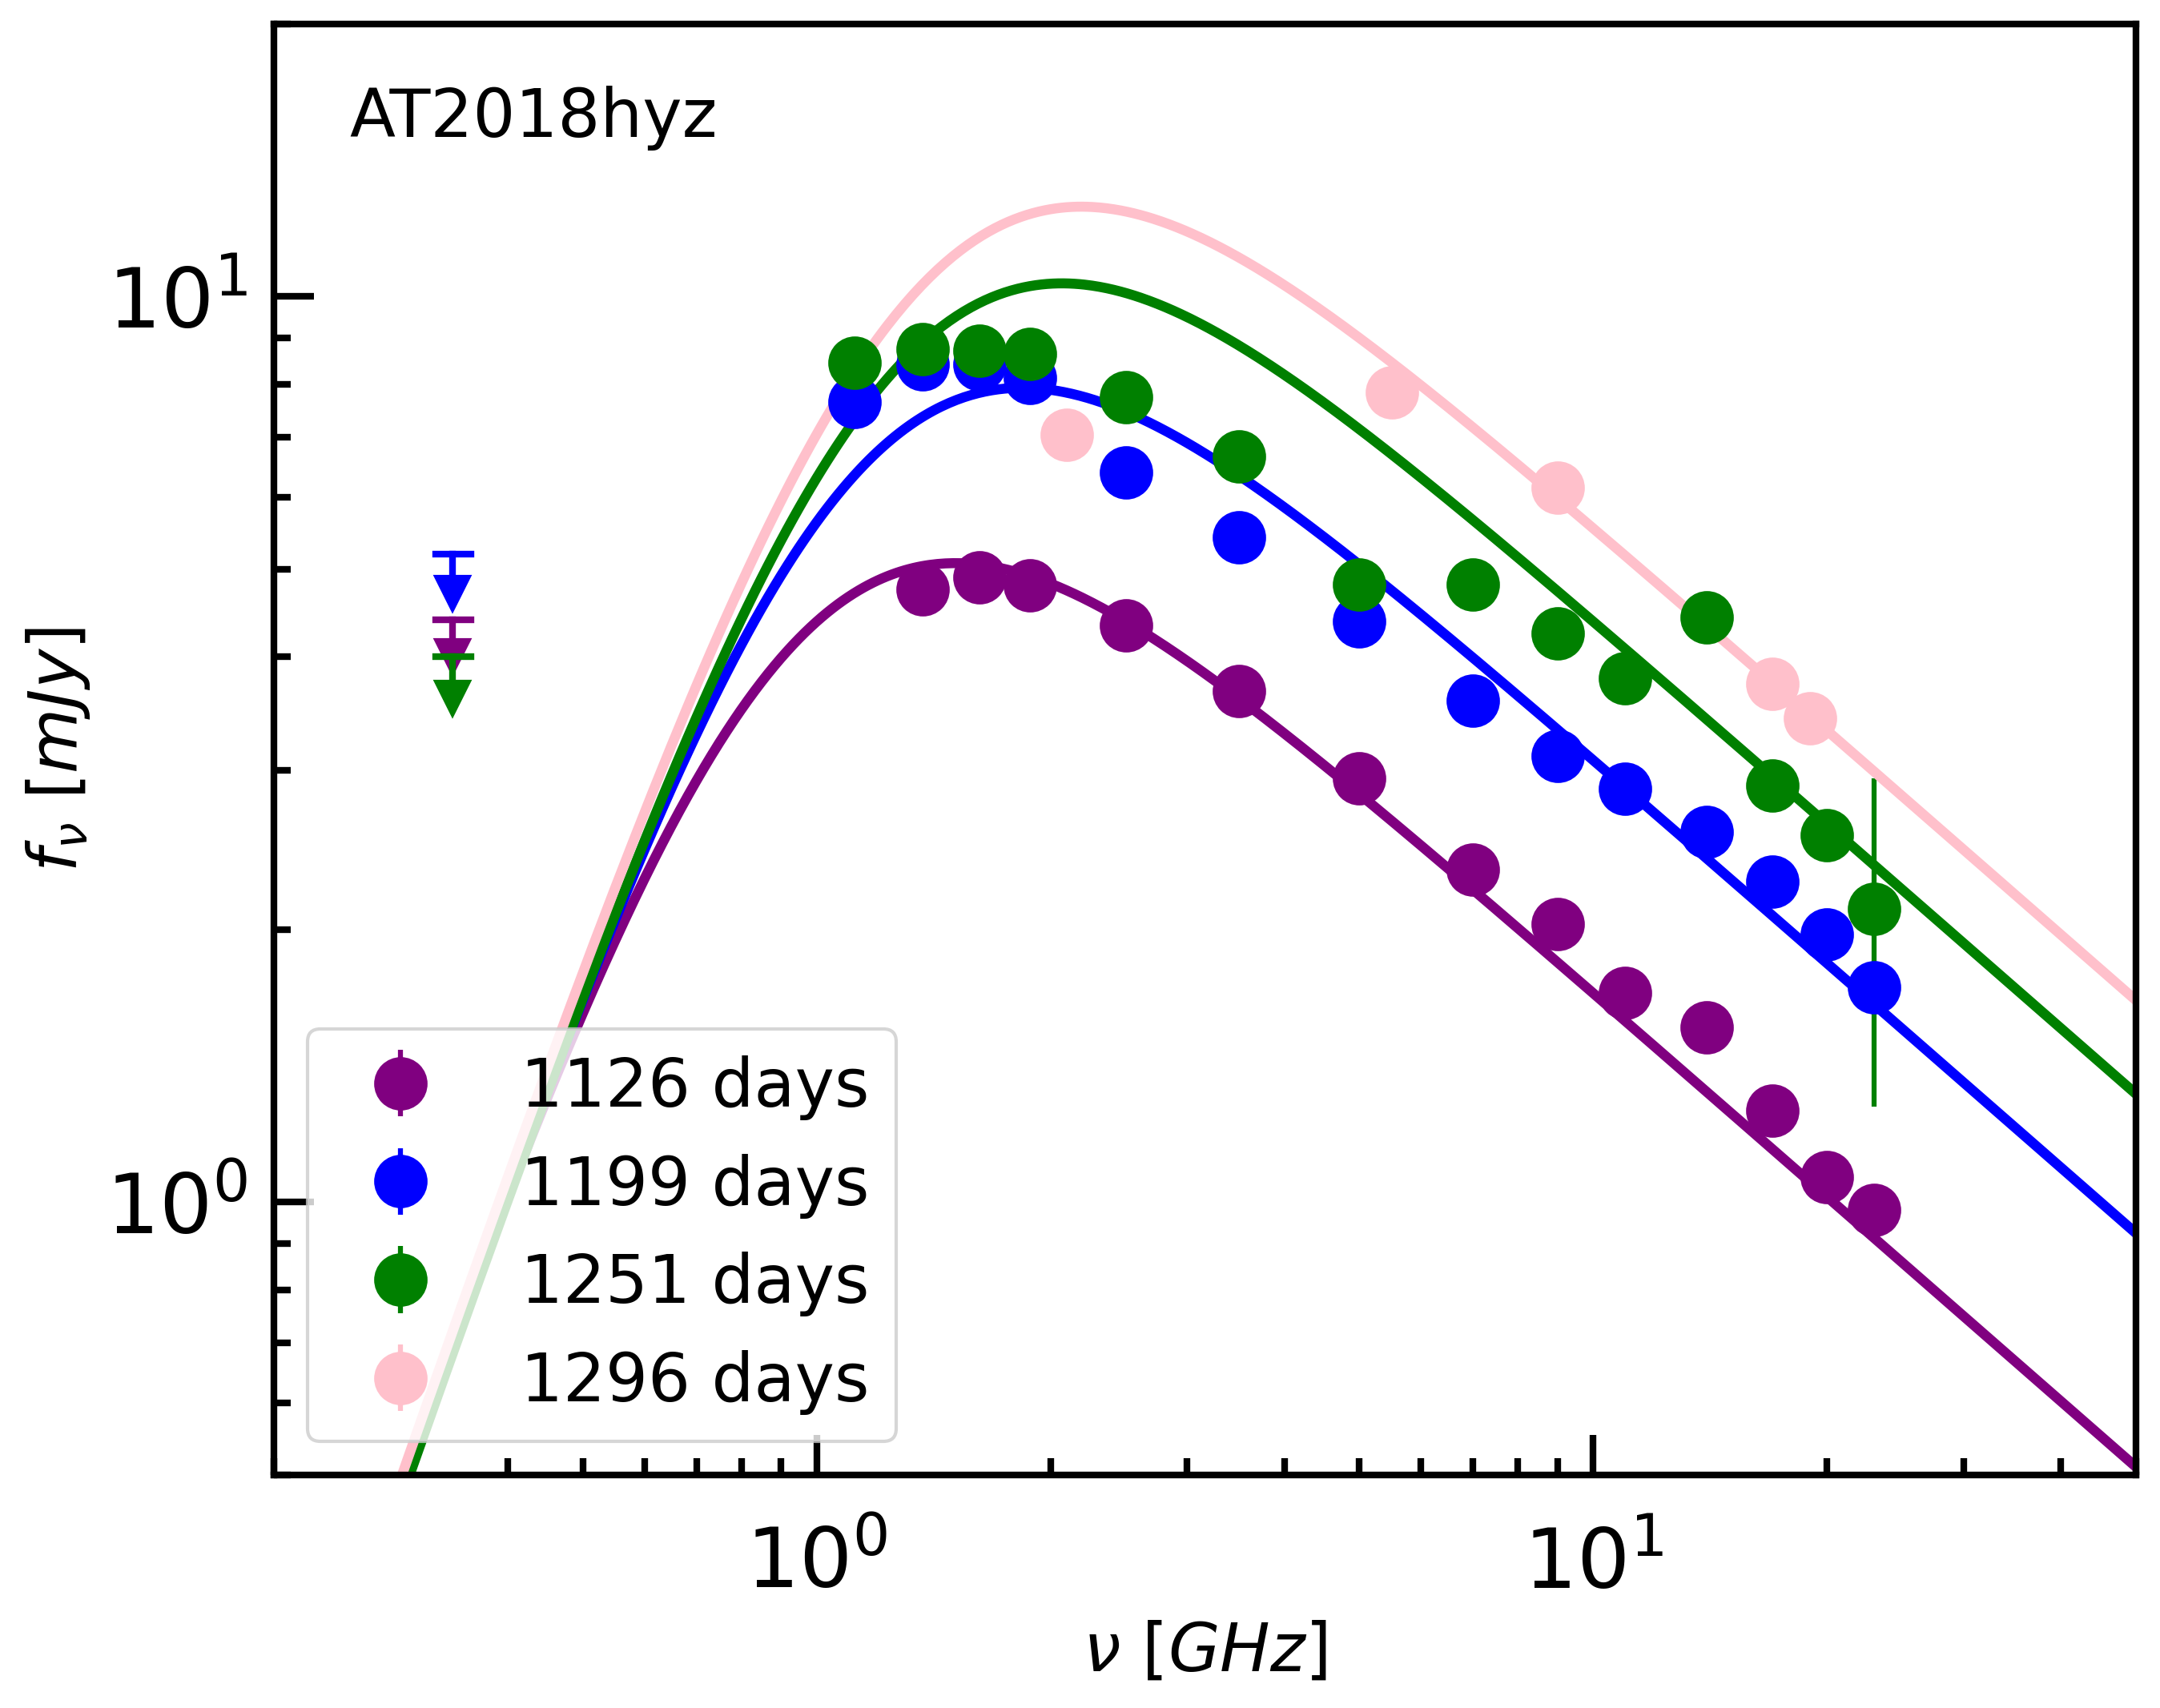
The late-time radio flare in AT2018hyz appeared almost 1000 days after the optical discovery with a luminosity of erg/s (Gomez et al., 2020; Cendes et al., 2022).
Figure 10 shows the comparison between the observed radio light curve and the model prediction, while Figure 11 shows the modeling of the spectra. The steep rise of the flare is well reproduced by the outflow-cloud model. The model also shows a rapid decay after the peak of the flare, if there is no additional outflow-cloud interaction.
4.5 ASASSN-15oi
Significant radio detection of ASASSN-15oi began after about 190 days with a flux of 1.3 mJy and showed a decline after. A rebrightening at 3 GHz with a flux of 8.4 mJy is detected approximately 1,400 days after the optical discovery (Horesh et al., 2021). Recently, Australian SKA Pathfinder (ASKAP) observations reveal flux variations after 1,400 days (Anumarlapudi et al., 2024).
ASASSN-15oi is the only candidate having multiple late-time radio flares, thus in our model additional clouds are needed. As for the flare before 700 days, apart from the sudden change of the peak frequency at the 4th observation, the complex evolution of the light curve (fast - slow - fast decay) is not predicted by our model (see Figure 5). We suspect the flare before 1000 days comes from the interaction of the outflow with at least two closely located clouds. Overall, we consider these multiple late-time radio flares are from the interaction of the outflow with at least five giant clouds at different distances. Figure 12 shows the modeling of the light curve and Figure 13 shows the spectra comparison. The adapted parameter values for these five collisions are shown in Table 1.
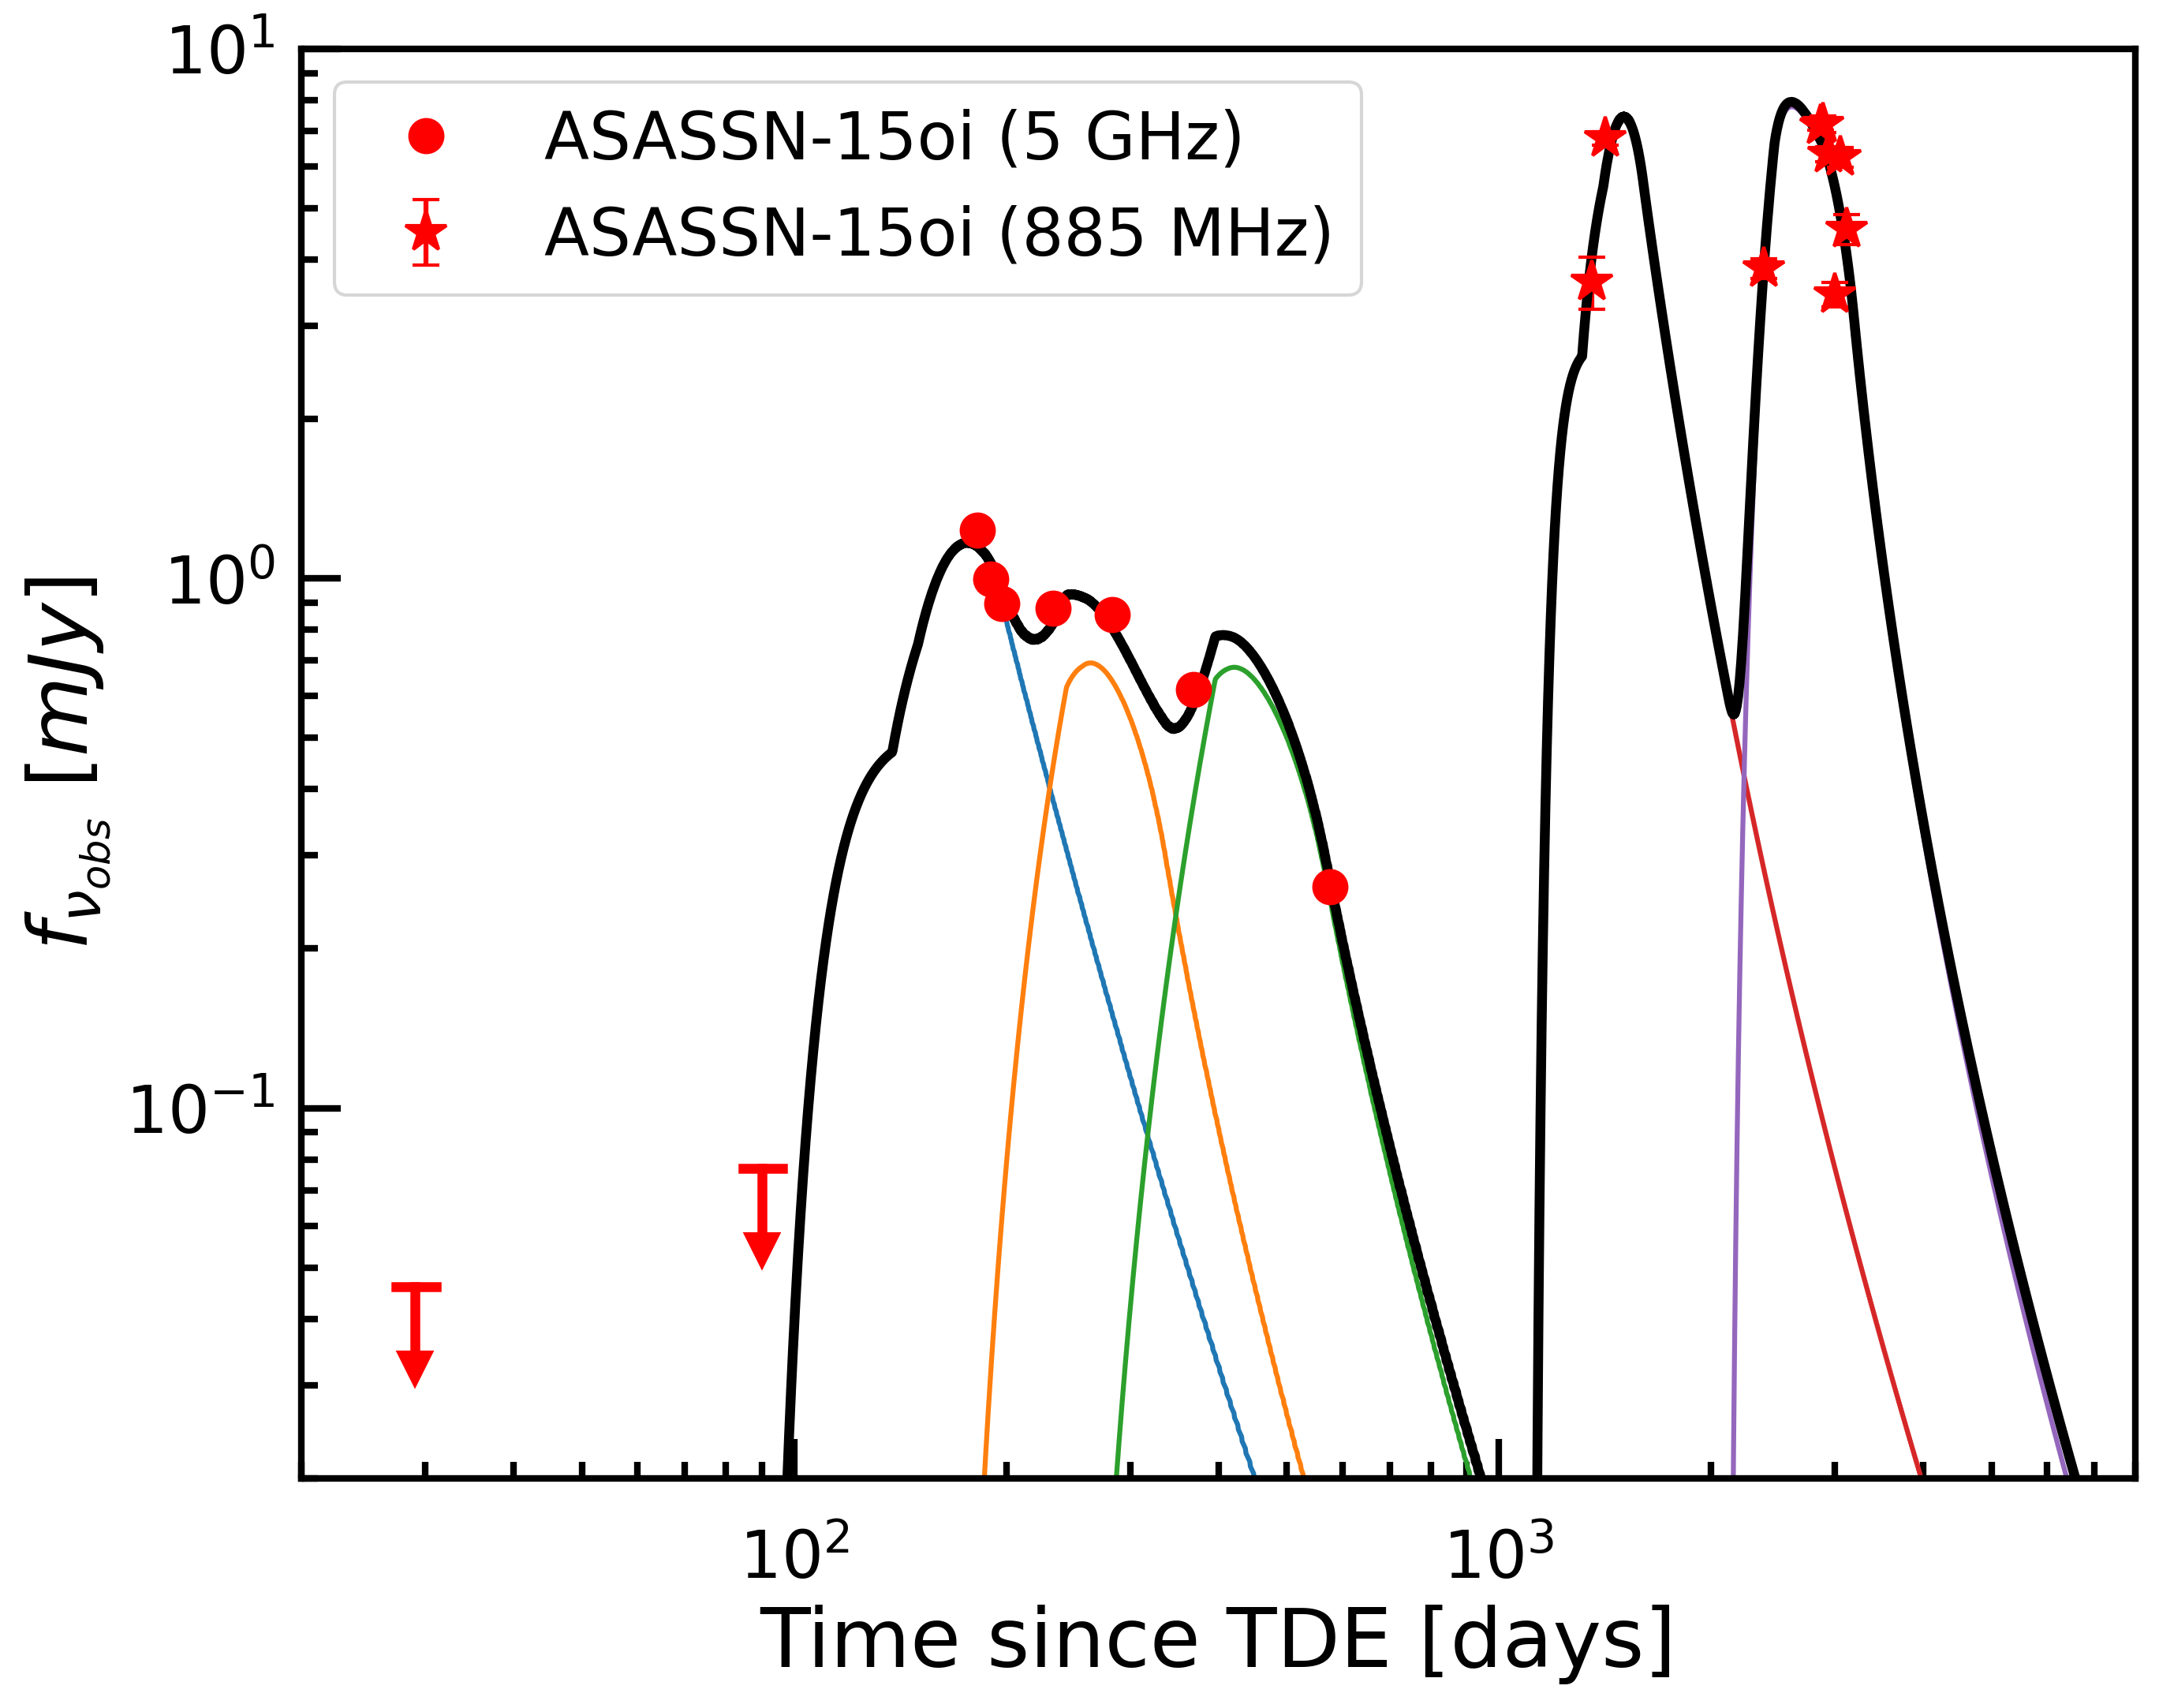
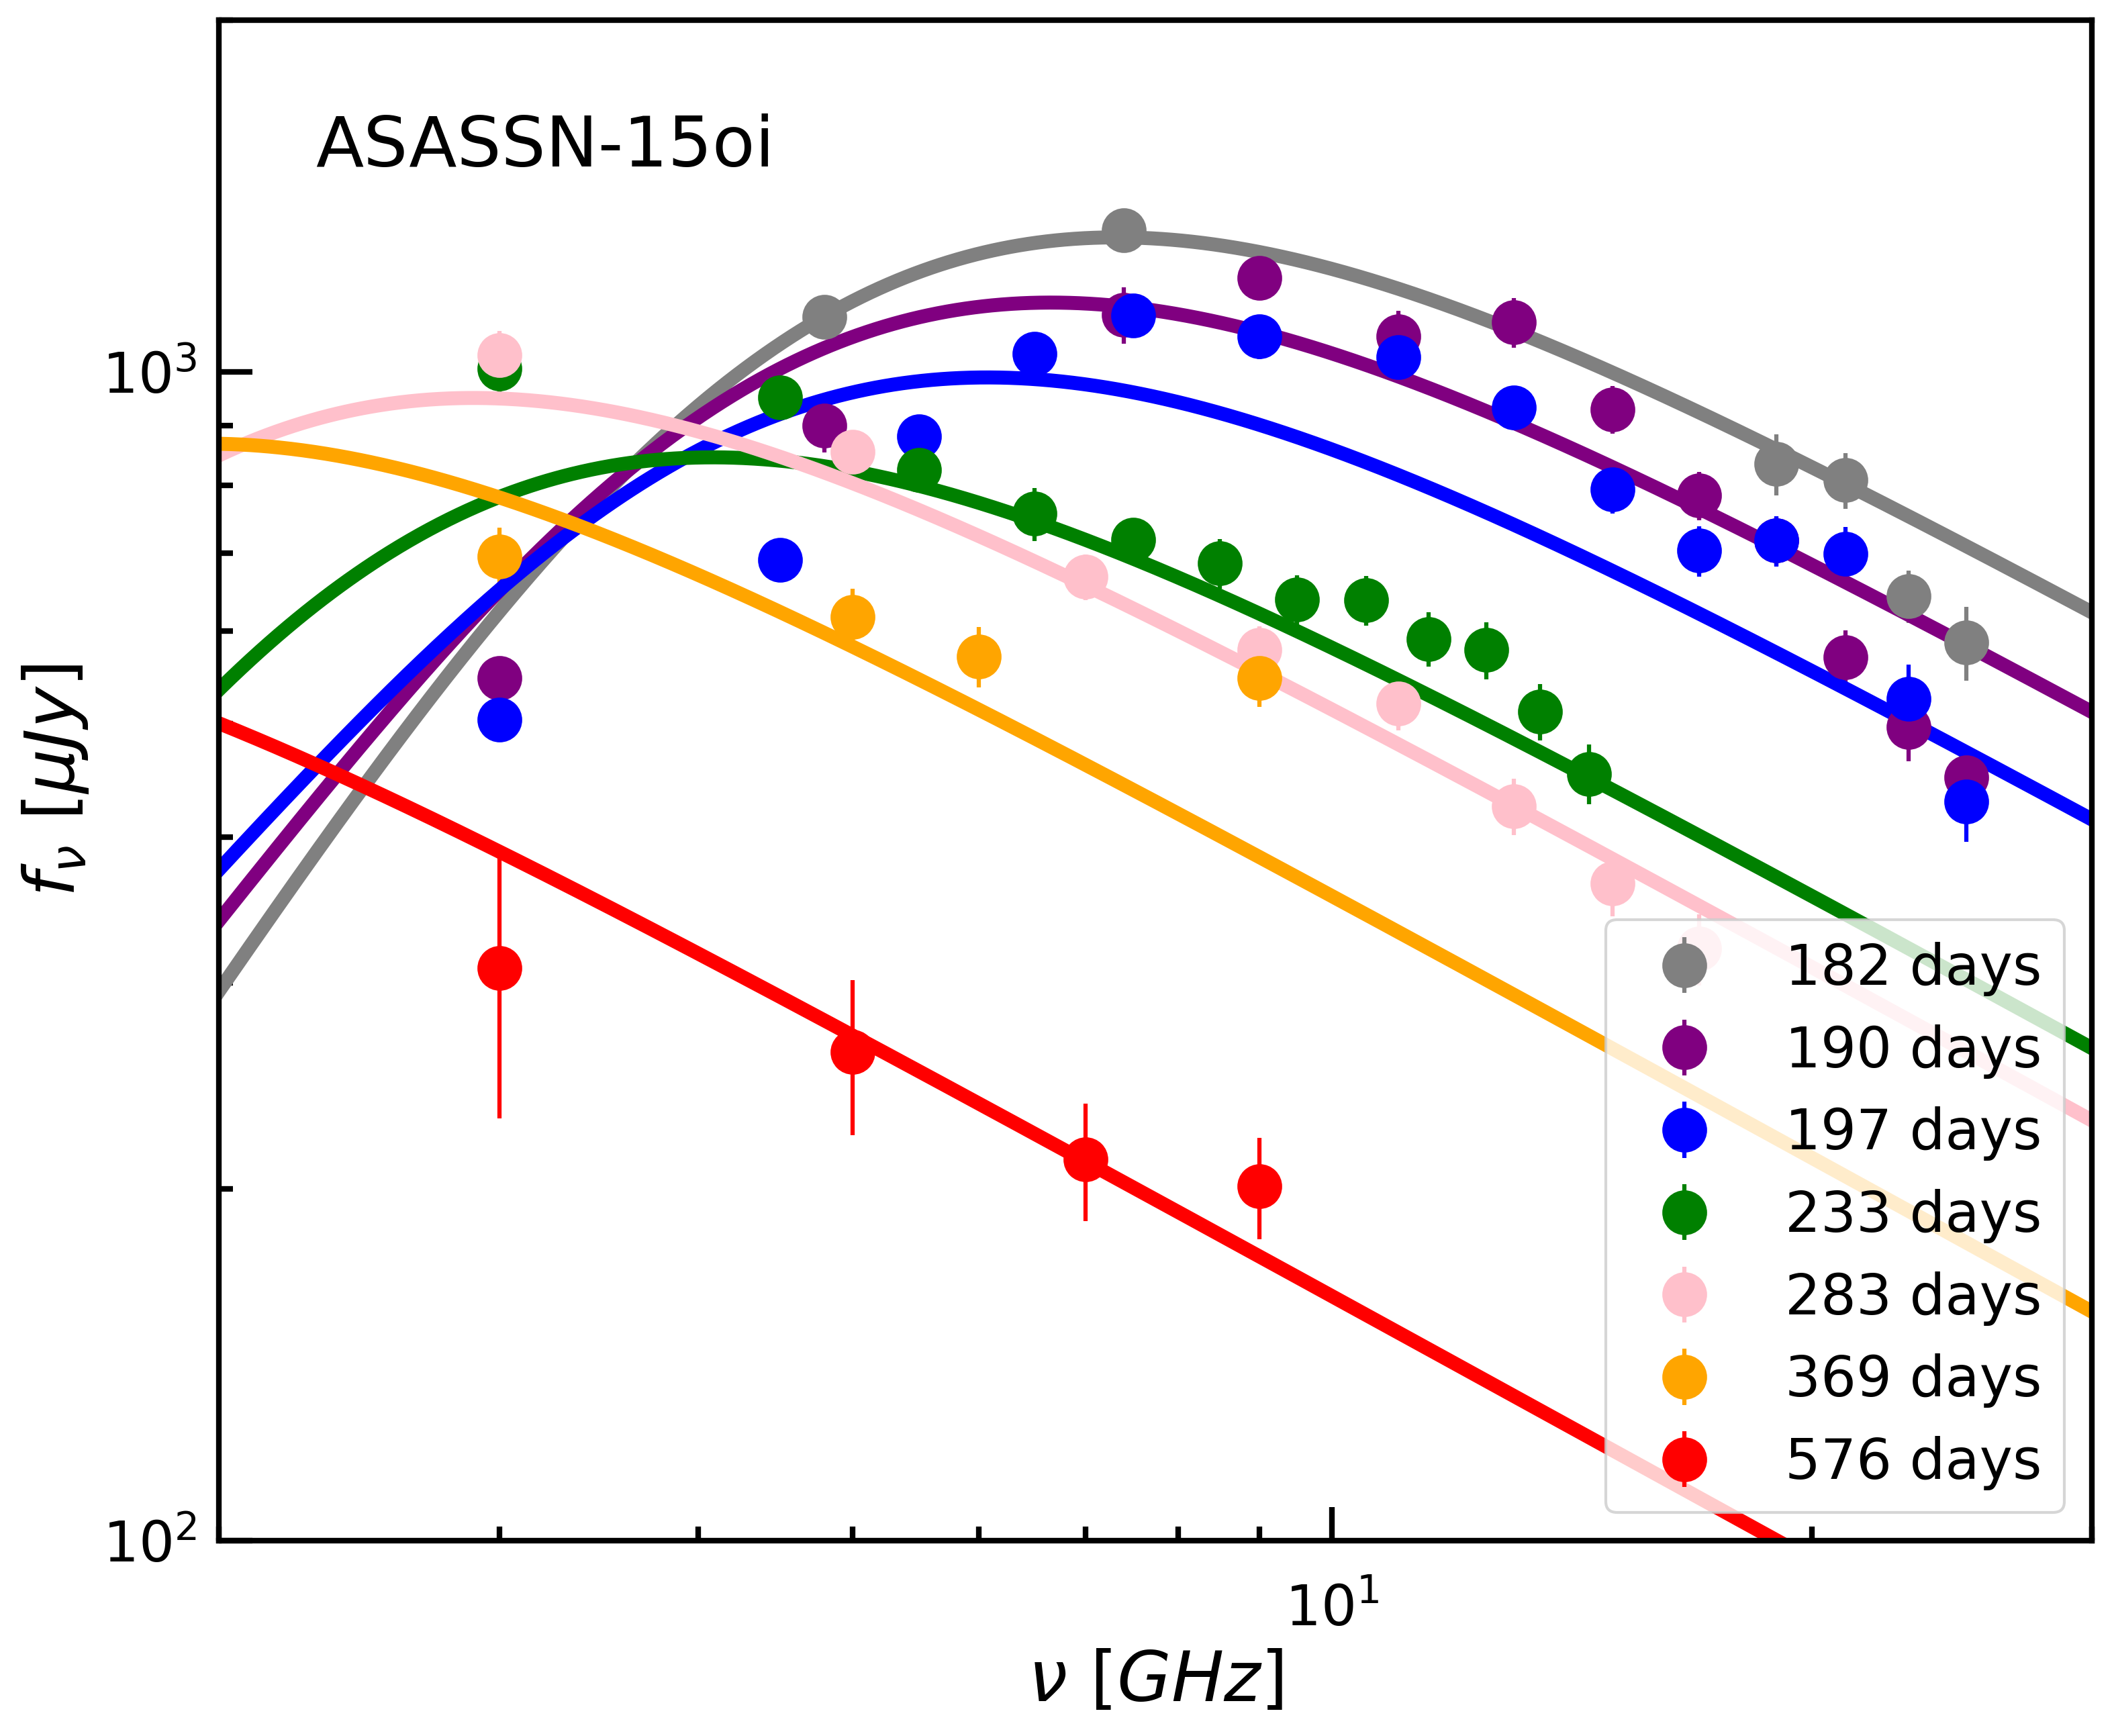
Here among these collisions, the total mass of the outflow remains unchanged. The radial width increases with distance due to the radial expansion of the outflow. The adopted value of the outflow velocity decreases after each cloud collision due to the dissipation of the kinetic energy and the swept mass of CNM. In addition, as the outflow moves outwards and the density of the outflow decreases, we found that the adopted and for the last two clouds have to be much greater than the inner clouds to account for the later brighter flares.
5 Discussion
Here we discuss an off-axis jet, which can produce the steep rise as observed and is proposed to be one of the explanations for these late radio flares (Matsumoto & Piran, 2023; Sfaradi et al., 2024). Also, we would analyze the accompanying possible X-ray emission from the outflow-cloud interaction.
5.1 An off-axis jet
A TDE might generate a relativistic jet (Frank & Rees, 1976; De Colle et al., 2012; Metzger et al., 2012). The shock interaction between the relativistic jet and the CNM powers non-thermal radio synchrotron radiation (Giannios & Metzger, 2011). The radio signal is beamed away from the observers initially if we are not located within the initial jet aperture (an off-axis jet). As the jet decelerates, the emission from the jet becomes detectable to observers at larger viewing angles , producing a steep rise as for (Rhoads, 1999; Granot et al., 2002).
In the off-axis jet scenario, the radio would peak at a time with a peak luminosity ( = 1 GHz) as (Nakar et al., 2002; Gottlieb et al., 2019):
| (15) | ||||
| (16) |
where is the energy of the jet in units of erg; is the uniform ambient density in . The equations reveal that a flare with a peak time of about 1,000 days and a peak luminosity of erg/s is possible.
Lei et al. (2016) find that the the data before 1,000 days in IGR J12580+0134 are consistent with an off-axis relativistic jet. Besides, Sfaradi et al. (2024) also find that the off-axis jet model can explain the full set of radio observations of AT2018hyz. However, the delayed radio flare seen in ASASSN-15oi cannot be explained by such a model, as Horesh et al. (2021) find that its best-fit parameters vary substantially between each epoch and no numerical solution can account for both the initial steep flux rise, and the complex spectral and temporal evolution. Sato et al. (2024) find that a structured two-component jet (a relativistic inner component and trans-relativistic outer component), instead of the one-component jet, can explain the radio data of ASASSN-15oi before 1,400 days, as well as ASASSN-1eae, AT2018hyz and AT2019dsg. Nevertheless, the latest observed flux variation after 1,400 days in ASASSN-15oi is unlikely to be explained by this model.
5.2 X-ray emission from the outflow-clouds interaction
The interaction of outflow with a cloud can also drive a cloud shock that propagates into the cloud (McKee & Cowie, 1975). The velocity of the cloud shock is:
| (17) |
Where is the density ratio; is the gas number density of the cloud. The velocity of the bow shock is greater than that of the cloud shock, so the radio emission would be dominated by the shocked outflow. The temperature of the shocked cloud material is :
| (18) |
which means that the shocked cloud radiates in X-rays.
The internal energy gained by the shocked cloud per unit time is , and the energy conversion efficiency is :
| (19) |
where the is the kinetic luminosity of the outflow. Given that the inferred total energy of the outflow is about erg, then the energy gained by the cloud is erg.
Assuming that the total energy gained by the shocked cloud will be lost by radiative cooling, and substituting Eq.(5.2) into the cooling timescale formula (see Section 5.1), we have:
| (20) |
Then the X-ray luminosity from the shocked cloud can be estimated as:
| (21) |
where erg, both and are about unity. This result agrees with the prediction of the X-ray luminosity from the outflow-cloud interaction by Mou et al. (2021) and Zhuang & Shen (2021).
It is clear from Eq.(5.2) and (5.2) that when the density ratio is higher, the shocked cloud is inefficient in generating X-ray radiation. In addition, the optical depth, which is dominated by the Thomson scattering, of the shocked cloud plasma would increase as well. On the other hand, when is smaller, the cooling timescale would increase as approximately. Combined with Eq.(5.2), we have which shows that the estimated X-ray luminosity would be lower accordingly. As a result, the late-time radio flares may not be accompanied by a late-time X-ray flare.
In addition, Chen & Wang (2023) found that the thermal conduction inside the cloud can play a crucial role in increasing the cloud’s radiation, and up to 510 of the kinetic energy of the outflow impacting cloud could be converted into radiation. In this case, the estimated luminosity would become erg/s ().
6 Conclusion
In recent years, radio observation of some TDEs reveals flares only at a late time ( days after TDE discovery), such as in ASASSN-15oi and AT2018hyz, both of which have a radio luminosity of about erg/s. Due to the rapid evolution of light curves, some of these late-time radio flares are difficult to be explained by the conventional outflow-CNM interaction, of which the steepest evolution is (Metzger et al., 2012; Krolik et al., 2016; Alexander et al., 2020) while observation requires a temporal power-law steeper than .
A variety of explanations have been proposed for these late-time radio flares such as a delayed launch of the outflow (Cendes et al., 2023), a misaligned precessing jets (Lu et al., 2023), an off-axis jet (Matsumoto & Piran, 2023; Sfaradi et al., 2024), and a piecewise power-law distribution of CNM (Matsumoto & Piran, 2024).
In this paper, we developed a model for the late-time radio flares in which they are produced by the interaction of the outflow with the circum-nuclear gaseous clouds. This collision forms a bow shock, and the late-time radio synchrotron emission is produced from the shocked outflow. We found it is capable of generating bright radio flares years after TDE with a luminosity of erg/s.
The model is applied to five TDE candidates and our model can well explain the observed data, including the multiple late-time flares such as seen in ASASSN-15oi, when the outflow impacts multiple clouds. The inferred outflow velocity ranges from 0.2 to 0.9 with a mass outflow rate of about . The corresponding kinetic luminosity of these outflows is about erg/s which is consistent with the simulation (Strubbe & Quataert, 2009; Curd & Narayan, 2019; Bu et al., 2023b, a), and the total kinetic energy of the outflow is erg with a total mass of about . The distances of the cloud ( pc) are compatibel with observations (Mezger et al., 1996; Christopher et al., 2005; Armijos-Abendaño et al., 2022).
Note that although our model can explain the large delay, the sharpness of the rise and the multiplicity of the late radio flares, the adopted parameter values are not unique and there are degeneracies among them. Therefore, these values cannot be regarded as being exclusively constrained.
Our model may be tested by the accompanied X-ray or dust echo emission component. Chen & Wang (2023) suggested that the late-time X-ray emissions in ASASSN-15oi and AT2019azh can be explained by the outflow-cloud collision, which indicates this interaction may play an important role in the afterglow of TDEs. In addition, there may be lots of dust in the torus as well, such that high-energy emission from TDEs accretion such as X-ray may be absorbed and reprocessed into the infrared (Lu et al., 2016).
With more late-time radio flares by future observation, we will examine whether our model can be applied to these events and offer constraints on the outflow to help better understand TDEs. In addition, they can also be used as a tool to study the circumnuclear environment.
ACKNOWLEDGEMENTS
We thank Adelle Goodwin for helpful comments. R. Shen and J. Zhuang are supported by National Natural Science Foundation of China (grants 12073091 and 12261141691) and by the Strategic Priority Research Program of Chinese Academy of Sciences (grant XDB0550200). G. Mou is supported by the NSFC (No.12133007).
References
- Alexander et al. (2016) Alexander, K. D., Berger, E., Guillochon, J., Zauderer, B. A., & Williams, P. K. G. 2016, ApJ, 819, L25, doi: 10.3847/2041-8205/819/2/L25
- Alexander et al. (2020) Alexander, K. D., van Velzen, S., Horesh, A., & Zauderer, B. A. 2020, Space Sci. Rev., 216, 81, doi: 10.1007/s11214-020-00702-w
- Antonucci (1993) Antonucci, R. 1993, ARA&A, 31, 473, doi: 10.1146/annurev.aa.31.090193.002353
- Anumarlapudi et al. (2024) Anumarlapudi, A., Kaplan, D., Dobie, D., et al. 2024, The Astronomer’s Telegram, 16502, 1
- Armijos-Abendaño et al. (2022) Armijos-Abendaño, J., López, E., Llerena, M., & Logan, C. H. A. 2022, MNRAS, 514, 1535, doi: 10.1093/mnras/stac1442
- Barkov et al. (2019) Barkov, M. V., Lyutikov, M., & Khangulyan, D. 2019, MNRAS, 484, 4760, doi: 10.1093/mnras/stz213
- Barniol Duran et al. (2013) Barniol Duran, R., Nakar, E., & Piran, T. 2013, ApJ, 772, 78, doi: 10.1088/0004-637X/772/1/78
- Beniamini et al. (2016) Beniamini, P., Nava, L., & Piran, T. 2016, MNRAS, 461, 51, doi: 10.1093/mnras/stw1331
- Blandford & Znajek (1977) Blandford, R. D., & Znajek, R. L. 1977, MNRAS, 179, 433, doi: 10.1093/mnras/179.3.433
- Blondin et al. (1998) Blondin, J. M., Wright, E. B., Borkowski, K. J., & Reynolds, S. P. 1998, ApJ, 500, 342, doi: 10.1086/305708
- Bloom et al. (2011) Bloom, J. S., Giannios, D., Metzger, B. D., et al. 2011, Science, 333, 203, doi: 10.1126/science.1207150
- Bu et al. (2023a) Bu, D.-F., Chen, L., Mou, G., Qiao, E., & Yang, X.-H. 2023a, MNRAS, 521, 4180, doi: 10.1093/mnras/stad804
- Bu et al. (2023b) Bu, D.-F., Qiao, E., & Yang, X.-H. 2023b, MNRAS, 523, 4136, doi: 10.1093/mnras/stad1696
- Burrows et al. (2011) Burrows, D. N., Kennea, J. A., Ghisellini, G., et al. 2011, Nature, 476, 421, doi: 10.1038/nature10374
- Cendes et al. (2021) Cendes, Y., Alexander, K. D., Berger, E., et al. 2021, ApJ, 919, 127, doi: 10.3847/1538-4357/ac110a
- Cendes et al. (2022) Cendes, Y., Berger, E., Alexander, K. D., et al. 2022, ApJ, 938, 28, doi: 10.3847/1538-4357/ac88d0
- Cendes et al. (2023) —. 2023, arXiv e-prints, arXiv:2308.13595, doi: 10.48550/arXiv.2308.13595
- Chen & Wang (2023) Chen, J., & Wang, W. 2023, MNRAS, 518, 5163, doi: 10.1093/mnras/stac3409
- Chevalier (1998) Chevalier, R. A. 1998, ApJ, 499, 810, doi: 10.1086/305676
- Christopher et al. (2005) Christopher, M. H., Scoville, N. Z., Stolovy, S. R., & Yun, M. S. 2005, ApJ, 622, 346, doi: 10.1086/427911
- Coppejans et al. (2020) Coppejans, D. L., Margutti, R., Terreran, G., et al. 2020, ApJ, 895, L23, doi: 10.3847/2041-8213/ab8cc7
- Curd & Narayan (2019) Curd, B., & Narayan, R. 2019, MNRAS, 483, 565, doi: 10.1093/mnras/sty3134
- Dai et al. (2018) Dai, L., McKinney, J. C., Roth, N., Ramirez-Ruiz, E., & Miller, M. C. 2018, ApJ, 859, L20, doi: 10.3847/2041-8213/aab429
- Dai et al. (1999) Dai, Z. G., Huang, Y. F., & Lu, T. 1999, ApJ, 520, 634, doi: 10.1086/307463
- Dalgarno & McCray (1972) Dalgarno, A., & McCray, R. A. 1972, ARA&A, 10, 375, doi: 10.1146/annurev.aa.10.090172.002111
- De Colle et al. (2012) De Colle, F., Guillochon, J., Naiman, J., & Ramirez-Ruiz, E. 2012, ApJ, 760, 103, doi: 10.1088/0004-637X/760/2/103
- Ferrarese & Ford (2005) Ferrarese, L., & Ford, H. 2005, Space Sci. Rev., 116, 523, doi: 10.1007/s11214-005-3947-6
- Frank & Rees (1976) Frank, J., & Rees, M. J. 1976, MNRAS, 176, 633, doi: 10.1093/mnras/176.3.633
- Gaisser et al. (1998) Gaisser, T. K., Protheroe, R. J., & Stanev, T. 1998, ApJ, 492, 219, doi: 10.1086/305011
- Gan et al. (2019) Gan, Z., Ciotti, L., Ostriker, J. P., & Yuan, F. 2019, ApJ, 872, 167, doi: 10.3847/1538-4357/ab0206
- Gao et al. (2013) Gao, H., Lei, W.-H., Wu, X.-F., & Zhang, B. 2013, MNRAS, 435, 2520, doi: 10.1093/mnras/stt1461
- Giannios & Metzger (2011) Giannios, D., & Metzger, B. D. 2011, MNRAS, 416, 2102, doi: 10.1111/j.1365-2966.2011.19188.x
- Gillessen et al. (2019) Gillessen, S., Plewa, P. M., Widmann, F., et al. 2019, ApJ, 871, 126, doi: 10.3847/1538-4357/aaf4f8
- Gomez et al. (2020) Gomez, S., Nicholl, M., Short, P., et al. 2020, MNRAS, 497, 1925, doi: 10.1093/mnras/staa2099
- Goodwin et al. (2023a) Goodwin, A., Miller-Jones, J., Alexander, K. D., et al. 2023a, The Astronomer’s Telegram, 16165, 1
- Goodwin et al. (2022) Goodwin, A. J., van Velzen, S., Miller-Jones, J. C. A., et al. 2022, MNRAS, 511, 5328, doi: 10.1093/mnras/stac333
- Goodwin et al. (2023b) Goodwin, A. J., Alexander, K. D., Miller-Jones, J. C. A., et al. 2023b, MNRAS, doi: 10.1093/mnras/stad1258
- Gottlieb et al. (2019) Gottlieb, O., Nakar, E., & Piran, T. 2019, MNRAS, 488, 2405, doi: 10.1093/mnras/stz1906
- Granot et al. (2002) Granot, J., Panaitescu, A., Kumar, P., & Woosley, S. E. 2002, ApJ, 570, L61, doi: 10.1086/340991
- Granot & Sari (2002) Granot, J., & Sari, R. 2002, ApJ, 568, 820, doi: 10.1086/338966
- Granot & van der Horst (2014) Granot, J., & van der Horst, A. J. 2014, PASA, 31, e008, doi: 10.1017/pasa.2013.44
- Guillochon et al. (2016) Guillochon, J., McCourt, M., Chen, X., Johnson, M. D., & Berger, E. 2016, ApJ, 822, 48, doi: 10.3847/0004-637X/822/1/48
- Guolo et al. (2023) Guolo, M., Gezari, S., Yao, Y., et al. 2023, arXiv e-prints, arXiv:2308.13019, doi: 10.48550/arXiv.2308.13019
- Horesh et al. (2021) Horesh, A., Cenko, S. B., & Arcavi, I. 2021, Nature Astronomy, 5, 491, doi: 10.1038/s41550-021-01300-8
- Huang et al. (2000) Huang, Y. F., Gou, L. J., Dai, Z. G., & Lu, T. 2000, ApJ, 543, 90, doi: 10.1086/317076
- Kereš et al. (2005) Kereš, D., Katz, N., Weinberg, D. H., & Davé, R. 2005, MNRAS, 363, 2, doi: 10.1111/j.1365-2966.2005.09451.x
- Krolik et al. (2016) Krolik, J., Piran, T., Svirski, G., & Cheng, R. M. 2016, ApJ, 827, 127, doi: 10.3847/0004-637X/827/2/127
- Krolik & Begelman (1988) Krolik, J. H., & Begelman, M. C. 1988, ApJ, 329, 702, doi: 10.1086/166414
- Lei et al. (2016) Lei, W.-H., Yuan, Q., Zhang, B., & Wang, D. 2016, ApJ, 816, 20, doi: 10.3847/0004-637X/816/1/20
- Lin & Murray (2000) Lin, D. N. C., & Murray, S. D. 2000, ApJ, 540, 170, doi: 10.1086/309317
- Lu & Bonnerot (2020) Lu, W., & Bonnerot, C. 2020, MNRAS, 492, 686, doi: 10.1093/mnras/stz3405
- Lu et al. (2016) Lu, W., Kumar, P., & Evans, N. J. 2016, MNRAS, 458, 575, doi: 10.1093/mnras/stw307
- Lu et al. (2023) Lu, W., Matsumoto, T., & Matzner, C. D. 2023, arXiv e-prints, arXiv:2310.15336, doi: 10.48550/arXiv.2310.15336
- Matsumoto & Piran (2023) Matsumoto, T., & Piran, T. 2023, MNRAS, 522, 4565, doi: 10.1093/mnras/stad1269
- Matsumoto & Piran (2024) —. 2024, arXiv e-prints, arXiv:2404.15966, doi: 10.48550/arXiv.2404.15966
- McKee & Cowie (1975) McKee, C. F., & Cowie, L. L. 1975, ApJ, 195, 715, doi: 10.1086/153373
- Metzger et al. (2012) Metzger, B. D., Giannios, D., & Mimica, P. 2012, MNRAS, 420, 3528, doi: 10.1111/j.1365-2966.2011.20273.x
- Mezger et al. (1996) Mezger, P. G., Duschl, W. J., & Zylka, R. 1996, A&A Rev., 7, 289, doi: 10.1007/s001590050007
- Mou et al. (2022) Mou, G., Wang, T., Wang, W., & Yang, J. 2022, MNRAS, 510, 3650, doi: 10.1093/mnras/stab3742
- Mou & Wang (2021) Mou, G., & Wang, W. 2021, MNRAS, 507, 1684, doi: 10.1093/mnras/stab2261
- Mou et al. (2021) Mou, G., Dou, L., Jiang, N., et al. 2021, ApJ, 908, 197, doi: 10.3847/1538-4357/abd475
- Nakar et al. (2002) Nakar, E., Piran, T., & Granot, J. 2002, ApJ, 579, 699, doi: 10.1086/342791
- Perlman et al. (2022) Perlman, E. S., Meyer, E. T., Wang, Q. D., et al. 2022, ApJ, 925, 143, doi: 10.3847/1538-4357/ac3bba
- Phinney (1989) Phinney, E. S. 1989, in The Center of the Galaxy, ed. M. Morris, Vol. 136, 543
- Raymond et al. (1976) Raymond, J. C., Cox, D. P., & Smith, B. W. 1976, ApJ, 204, 290, doi: 10.1086/154170
- Rees (1988) Rees, M. J. 1988, Nature, 333, 523, doi: 10.1038/333523a0
- Rhoads (1999) Rhoads, J. E. 1999, ApJ, 525, 737, doi: 10.1086/307907
- Rybicki & Lightman (1986) Rybicki, G. B., & Lightman, A. P. 1986, Radiative Processes in Astrophysics
- Santana et al. (2014) Santana, R., Barniol Duran, R., & Kumar, P. 2014, ApJ, 785, 29, doi: 10.1088/0004-637X/785/1/29
- Sari et al. (1998) Sari, R., Piran, T., & Narayan, R. 1998, ApJ, 497, L17, doi: 10.1086/311269
- Sato et al. (2024) Sato, Y., Murase, K., Bhattacharya, M., et al. 2024, arXiv e-prints, arXiv:2404.13326, doi: 10.48550/arXiv.2404.13326
- Sfaradi et al. (2022) Sfaradi, I., Horesh, A., Fender, R., et al. 2022, ApJ, 933, 176, doi: 10.3847/1538-4357/ac74bc
- Sfaradi et al. (2024) Sfaradi, I., Beniamini, P., Horesh, A., et al. 2024, MNRAS, 527, 7672, doi: 10.1093/mnras/stad3717
- Strubbe & Quataert (2009) Strubbe, L. E., & Quataert, E. 2009, MNRAS, 400, 2070, doi: 10.1111/j.1365-2966.2009.15599.x
- Sturner et al. (1997) Sturner, S. J., Skibo, J. G., Dermer, C. D., & Mattox, J. R. 1997, ApJ, 490, 619, doi: 10.1086/304894
- Tchekhovskoy et al. (2011) Tchekhovskoy, A., Narayan, R., & McKinney, J. C. 2011, MNRAS, 418, L79, doi: 10.1111/j.1745-3933.2011.01147.x
- Teboul & Metzger (2023) Teboul, O., & Metzger, B. D. 2023, ApJ, 957, L9, doi: 10.3847/2041-8213/ad0037
- White & Rees (1978) White, S. D. M., & Rees, M. J. 1978, MNRAS, 183, 341, doi: 10.1093/mnras/183.3.341
- Wu et al. (2022) Wu, H.-J., Mou, G., Wang, K., Wang, W., & Li, Z. 2022, MNRAS, 514, 4406, doi: 10.1093/mnras/stac1621
- Xu et al. (2006) Xu, Y.-D., Narayan, R., Quataert, E., Yuan, F., & Baganoff, F. K. 2006, ApJ, 640, 319, doi: 10.1086/499932
- Yalinewich et al. (2019) Yalinewich, A., Steinberg, E., Piran, T., & Krolik, J. H. 2019, MNRAS, 487, 4083, doi: 10.1093/mnras/stz1567
- Zhang et al. (2015) Zhang, B.-B., van Eerten, H., Burrows, D. N., et al. 2015, ApJ, 806, 15, doi: 10.1088/0004-637X/806/1/15
- Zhuang & Shen (2021) Zhuang, J., & Shen, R.-F. 2021, Journal of High Energy Astrophysics, 32, 11, doi: 10.1016/j.jheap.2021.06.001