Compressive Beam Alignment for Indoor Millimeter-Wave Systems
Abstract
The dynamic nature of indoor environments poses unique challenges for next-generation millimeter-wave (mm-wave) connectivity. These challenges arise from blockages due to mobile obstacles, mm-wave signal scattering caused by indoor surfaces, and imperfections in phased antenna arrays. Consequently, traditional compressed sensing (CS) techniques for beam alignment become ineffective in practice under such settings. This paper proposes a novel beam alignment technique suited for mm-wave systems operating in indoor environments. The proposed technique exploits the energy compaction property of the discrete cosine transform to compressively sense and identify the strongest cluster locations in the transform domain for robust beamforming. Experimental results at 60 GHz demonstrate successful beam alignment with limited measurements even in the presence of partial blockages during the beam training phase.
Index Terms:
Millimeter-wave communications, indoor beam alignment, compressed sensing.I Introduction
The demand for low latency and high-speed communications to support new technology and applications such as advanced telehealth, immersive reality experiences, and high-definition video streaming is on the rise [1]. The abundance of bandwidth and high data rates in the millimeter-wave (mm-wave) band enables service providers to meet those demands [2]. However promising, the deployment of mm-wave communication systems is challenged by the sensitivity to line-of-sight (LoS) link blockages and requires precise alignment of the communication beams. While existing techniques such as codebook-based hierarchical beam training and compressed channel estimation have been proposed to address these challenges [4, 5, 3, 6, 7], they exhibit limitations in dense indoor environments where intermittent blockages are imminent. Furthermore, these techniques: (i) require sparse channel environments, (ii) cannot accurately estimate optimal beam directions if the communication link is partially obstructed during the beam training phase, (iii) require knowledge of the complete array response of all receivers and do not account for potential distortions introduced by the antenna front-end hardware, and (iv) often rely on a pre-defined channel model, which might not accurately reflect real-world conditions. These limitations necessitate the development of novel beam alignment techniques that can overcome mm-wave link blockages and achieve robust performance in dynamic indoor environments.
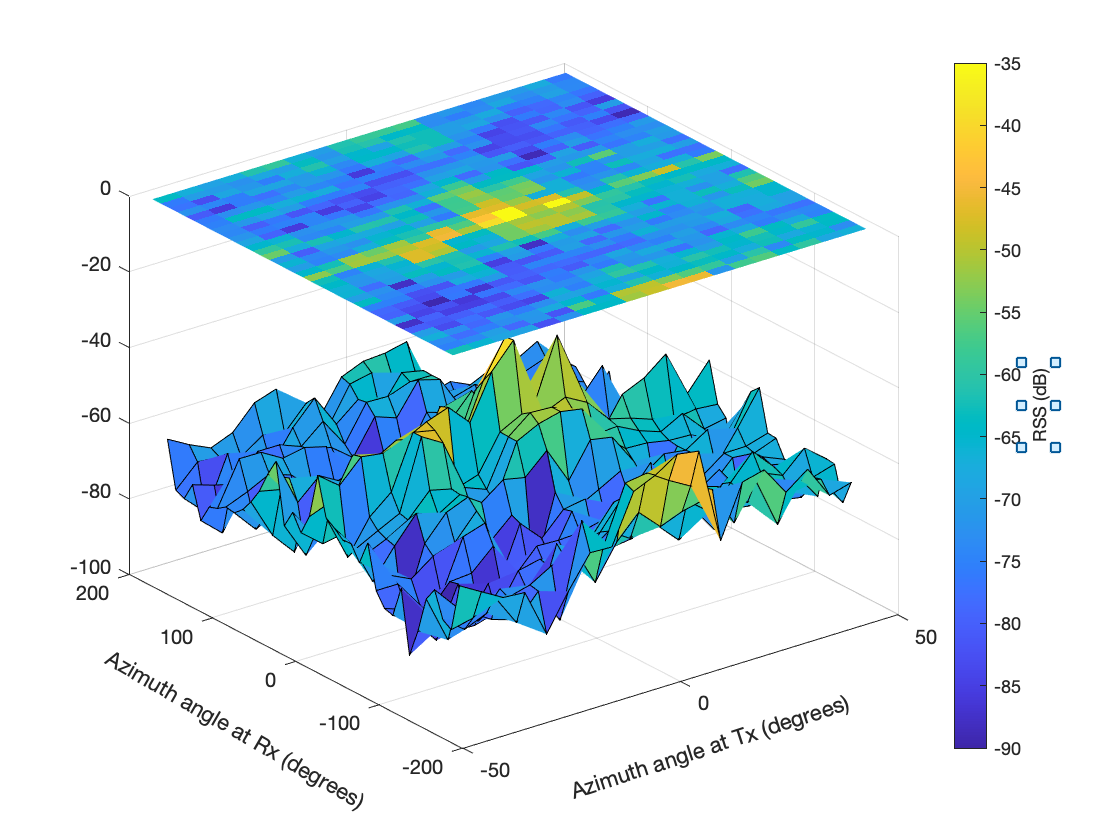
Compressed sensing (CS) has emerged as a promising signal processing technique for robust mm-wave channel estimation due to its ability to exploit channel sparsity [8, 9, 10]. The core principle of CS dictates that a sparse signal can be accurately reconstructed from a limited set of measurements using optimization algorithms, either in its original domain or a transformed domain [8]. Application of CS in mm-wave channel estimation translates to efficient bandwidth utilization and faster channel acquisition compared to traditional methods [9]. Nonetheless, existing CS-based mm-wave beam alignment techniques primarily focus on outdoor channels [6, 7, 9, 10]. Outdoor environments are generally static, and mm-wave propagation channels exhibit spatial sparsity due to path loss and scattering effects [10]. This sparsity aligns well with the assumptions of compressed sensing. Conversely, indoor environments pose a distinct challenge. They are characterized by dynamic blockages like walls, furniture, and various objects that significantly impact signal propagation, leading to denser and less sparse channels. Figure 1 illustrates this concept by plotting the received signal strength (RSS) measurements obtained at a line-of-sight (LoS) receiver within an indoor environment. As expected, the figure reveals that the strongest power is received at the LoS angles (0° for both transmit and receive). However, it also demonstrates the presence of significant scattered energy at non-line-of-sight (NLoS) directions. These secondary peaks likely arise from multipath propagation due to reflections and scattering induced by the interaction of the mm-wave signal with surrounding objects. This dense scattering profile underscores the key difference between indoor and outdoor mm-wave channels.
This paper presents a novel CS approach for beam alignment in indoor mm-wave environments. We depart from prior CS-based methods, which rely on sparse non-dynamic channels and assume prior knowledge of the communication channel model. Instead, we introduce a framework that leverages the discrete cosine transform (DCT) domain to achieve sparsity and approximate the directions of the strongest channel clusters in the transform domain. This framework offers two key advantages: (i) model-agnostic operation as it eliminates the need for prior knowledge of the channel model and the receiver array manifold, and (ii) robust blockage handling since beam training can proceed even in the presence of partial (mobile) blockages. This is achieved by exploiting the energy compaction property of the DCT which concentrates the signal energy in the lower-frequency coefficients. By focusing on these coefficients, we recover a compressed representation that closely approximates the original spatial domain signal. This behavior is analogous to a low-pass filter in image processing, which blurs the image but can reconstruct missing information to some extent. By incorporating blockage awareness, the proposed method becomes a strong candidate for beam alignment in dense indoor environments, where such disruptions are frequent. Furthermore, to the best knowledge of the authors, this work represents the first implementation of CS-based beam alignment in realistic indoor dense environments.
The rest of the paper is organized as follows. Sec. II introduces the system model and problem formulation, Sec. III presents our proposed compressed mm-wave beam alignment solution, setup and methodology. Sec. IV presents the measurement setup and methodology. Our experimental results are presented and discussed in V. Finally, Sec. VI concludes the paper.
II System Model and Problem Formulation
II-A System Model
We consider a system where a stationary mm-wave access point (AP) with antennas communicates with a stationary single receiver equipped with antennas. The access point uses one of beamforming vectors present in its codebook }, and similarly, the receiver uses one of its beamforming vectors for communication. The beamforming vector steers the transmit beam towards the angle , and similarly, the combining vector at the receiver steers the receiver’s beam towards the angle . Let , , be the complex symbol transmitted by the AP to the receiver using the beamformer , the received signal at the receiver using the combing vector is given by
| (1) |
where , , and represents the additive white Gaussian noise with a complex normal distribution. The matrix of size represents the unknown mm-wave channel between the AP and the receiver.
II-B Problem Formulation
In this paper, the received power at the receiver is adopted as the performance metric. Therefore, optimal transmit and receive beam selection occurs when the AP and the receiver pick the beamforming and combining vectors that maximizes the received power at the receiver, i.e. . This is achieved by selecting the ideal transmit beamforming vector and receive combining vector as follows
| (2) |
Without explicit knowledge of the channel , the optimal transmit and receive vectors can be obtained via an exhaustive search encompassing all codebook entries. However, this approach suffers from high computational complexity, making it impractical for real-world scenarios. In the next section, we propose a method for obtaining a set of transmit and receive beamforming vectors that maximize the power at the receiver without the need for an exhaustive search process.
III Proposed Compressed MM-Wave Beam Alignment Solution
This paper presents a new method to determine the received power, referred to as the received signal strength (RSS) in this paper, across all possible combinations of the transmit and receive beamforming vectors. It then identifies the optimal beam vectors () that maximize the RSS at the receiver without explicitly estimating the channel matrix . The following subsections will delve into the details of this approach.
III-A Initial Beam Measurements
To initiate sensing, the transmitter transmits beams using randomly selected beamforming vectors from its codebook . Similarly, the receiver uses randomly selects combining vectors from its codebook for each transmit beam to capture projections of the spatial distribution of the signal strength as follows
| (3) |
The matrix contains the sampled signal strength measurements using transmit and receive beams, the combing matrix consists of combining vectors randomly selected from the codebook , the beamforming matrix consists of beamforming vectors randomly selected from the codebook , and is the complex additive noise matrix.
III-B Sparse formulation for recovering missing measurements
For ease of exposition, we omit the effect of noise and rewrite (3) as
| (4) | |||||
| (5) |
In (4), we expressed as and as . The combining matrix consists of of all the combining vectors in , and the beamforming matrix consists of all the vectors in . The random selection matrices and are binary matrices where each row has a cardinality (number of “1”s) of 1, and each column has a cardinality of at most 1. The unknown matrix is of size and carries the projections of mm-wave signal strength across all transmit and receive codebooks entries. This matrix is unknown and can be estimated via exhaustive search over all transmit and receive beams. This brute force approach necessitates a total of measurements, where and represent the dimensions of the transmit and receive codebooks, respectively.
Vectorizing the matrix in (5) yields
| (6) |
where and is the Kronecker product operator. While the matrix might not be inherently sparse in the spatial domain, we exploit the energy compaction property of the DCT to enforce be sparse in the DCT domain. The DCT has the property of concentrating the signal’s energy into a few coefficients, particularly the low-frequency ones. By neglecting the higher-frequency DCT coefficients of , we enforce sparsity in the transformed domain. Using compressed sensing, an approximation to the DCT of is obtained and used to compute an approximation of in the spatial domain.
III-C Compressed sensing recovery
To recover in the transform domain rewrite (6) as follows
| (7) |
In (7), represent the inverse DCT matrix, and carries the DCT coefficients of the power measurement vector . Note in (7), the vector contains the signal strength measurements for only directions. To obtain the remaining entries of the vector we perform CS recovery by solving the following -minimization problem as follows
| (8) |
Sparse recovery algorithms such as LASSO, and the Orthogonal Matching Pursuit (OMP) can be used to recover the entries of . In this paper, we utilize the Regularized Orthogonal Matching Pursuit (ROMP) algorithm [11] which iteratively selects the largest DCT coefficients in a greedy fashion. Focusing on the strongest coefficients prioritizes recovery of lower frequency coefficients which we use to obtain an approximate of in the spatial domain by taking the inverse DCT of the recovered vector .
III-D Optimal beam selection
The indices of optimal beamforming/combining vector pair () that correspond to the maximum estimated received signal strength is selected as follows
where The selected transmit beamforming vector is and the selected receive combining vector is
IV Measurement Setup and Methodology
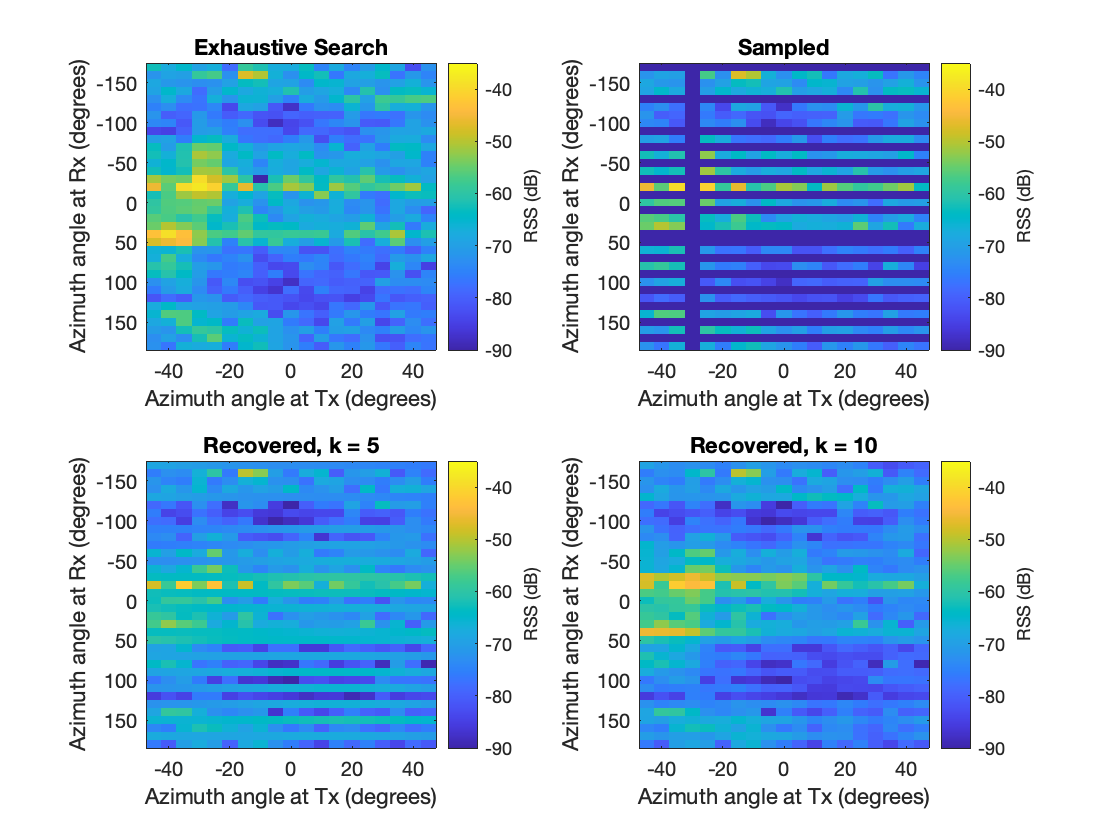
Indoor measurements were conducted in a lab environment with surfaces of varying materials including wood panel, glossy whiteboard, metal cabinets, and other environmental clutter. The transmitter (TX) was positioned at a fixed location, while the receiver (RX) was positioned at two locations, namely location A and B as shown in Fig. 2. At Location A, the receiver is aligned with the transmitter to create a LoS link. At Location B, the receiver is situated adjacent to a metallic equipment rack thereby resulting in an additional anticipated cluster as shown in Fig. 4.
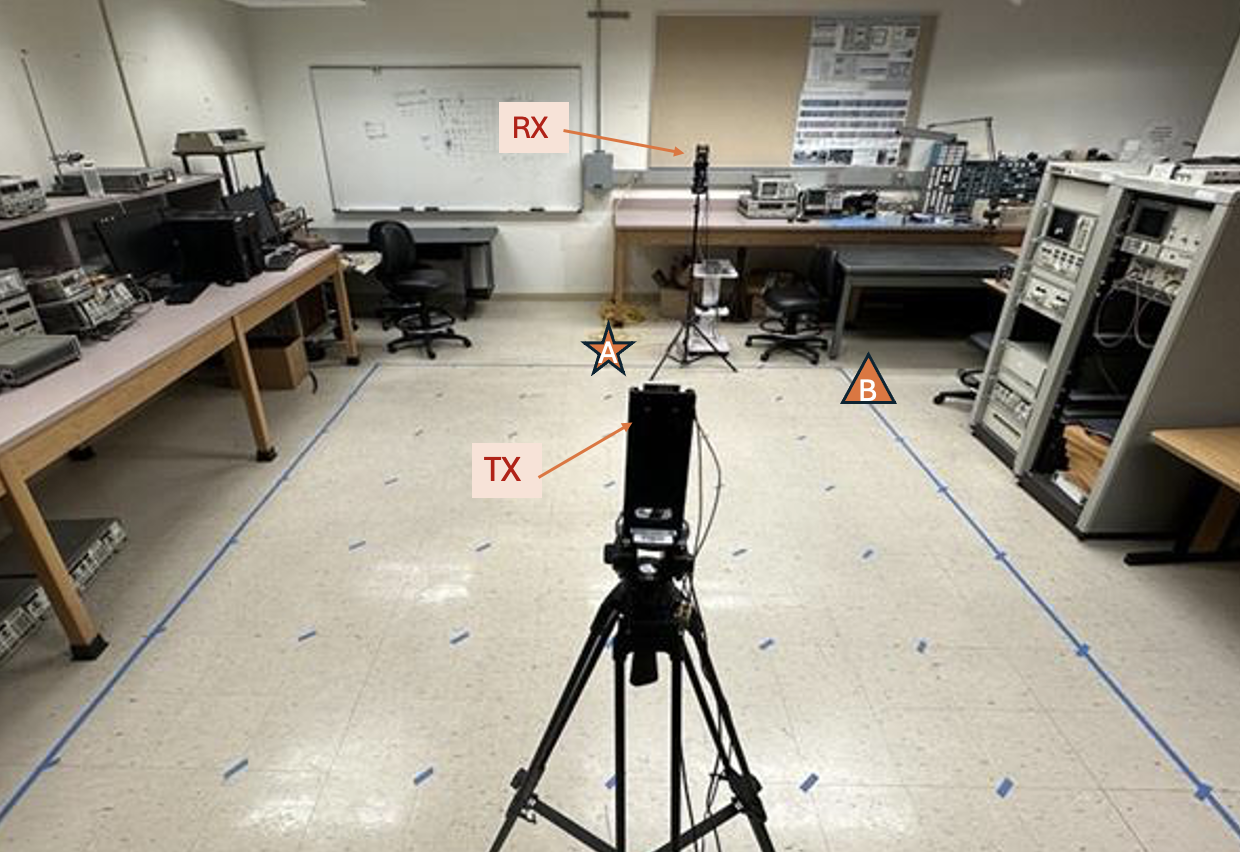
IV-A Phased antenna array setup
Two 60 GHz mm-wave phased antenna array transceiver kits (Sivers EVK02001) [12] were used for measurements as depicted in Fig. 2. The beam direction can be electronically steered from +45 to -45 degrees in the azimuth plane. Each antenna kit includes a 16 element antenna patch antenna module that is steered using codebooks . The transmit and receive beams can be steered in the azimuth plane in the range to . The transmit and receive codebooks can be found in [13].
IV-B Measurement procedure
A universal software radio peripheral (USRP) is used to generate a sinusoidal baseband signal with a sampling rate of 1 MHz. The phased antenna array transceiver kit up converts this signal to 60 GHz before transmission to the receiver. The receiver kit and USRP downconvert the received signal back to baseband. The power spectrum of the down converted signal is computed using a flattop window filter. To capture signal strength measurements across various angles, the receiver is steered in the azimuth plane in the range , to in increments of . Similarly, the transmit angles are electronically steered from +45 to -45 degrees in increments of 5 degrees in the azimuth plan. The received signal strength s extracted from the FFT power spectrum for each receive angle.
V Experimental Results and Discussions
In this section, we use real-world data to test the performance of the proposed compressed beam alignment technique outlined in Sec. III using the measurement setup outlined in Sec. IV. We analyze the efficacy of the proposed beam alignment technique based on measured RSS. The transmit codebook consists of 19 beam steering vectors, while the receive codebook consists of 36 entries.
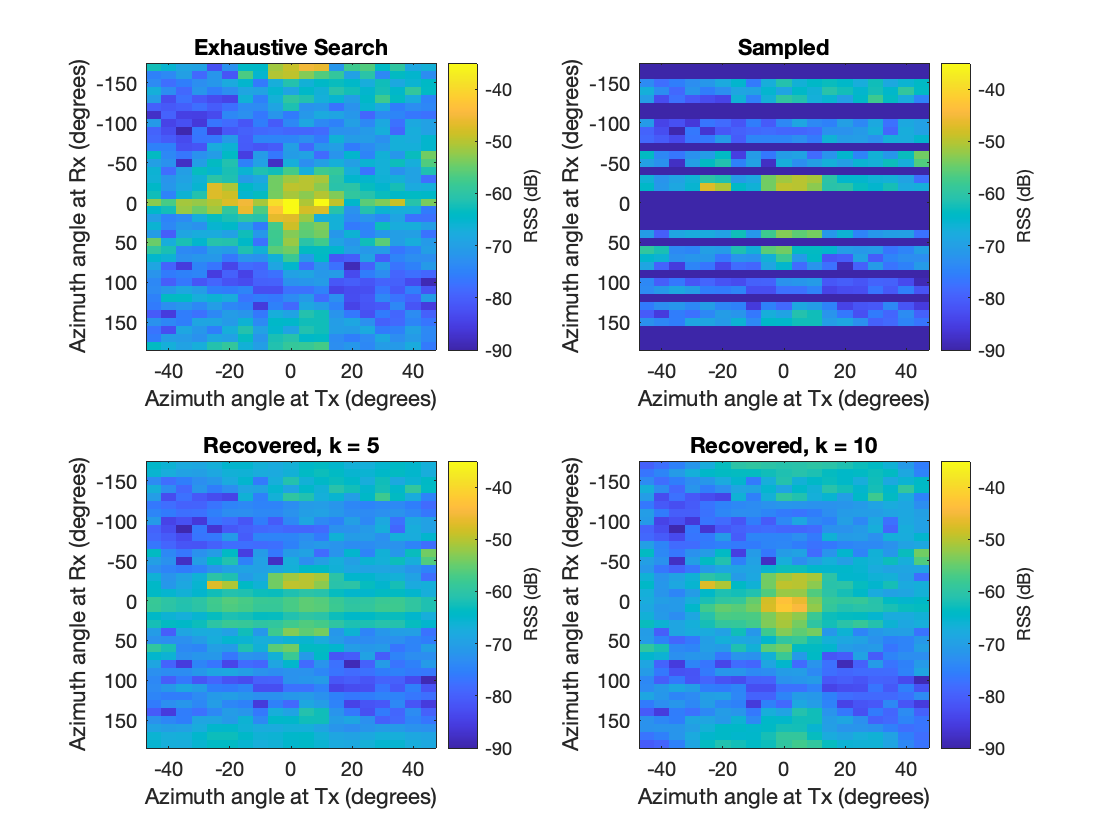
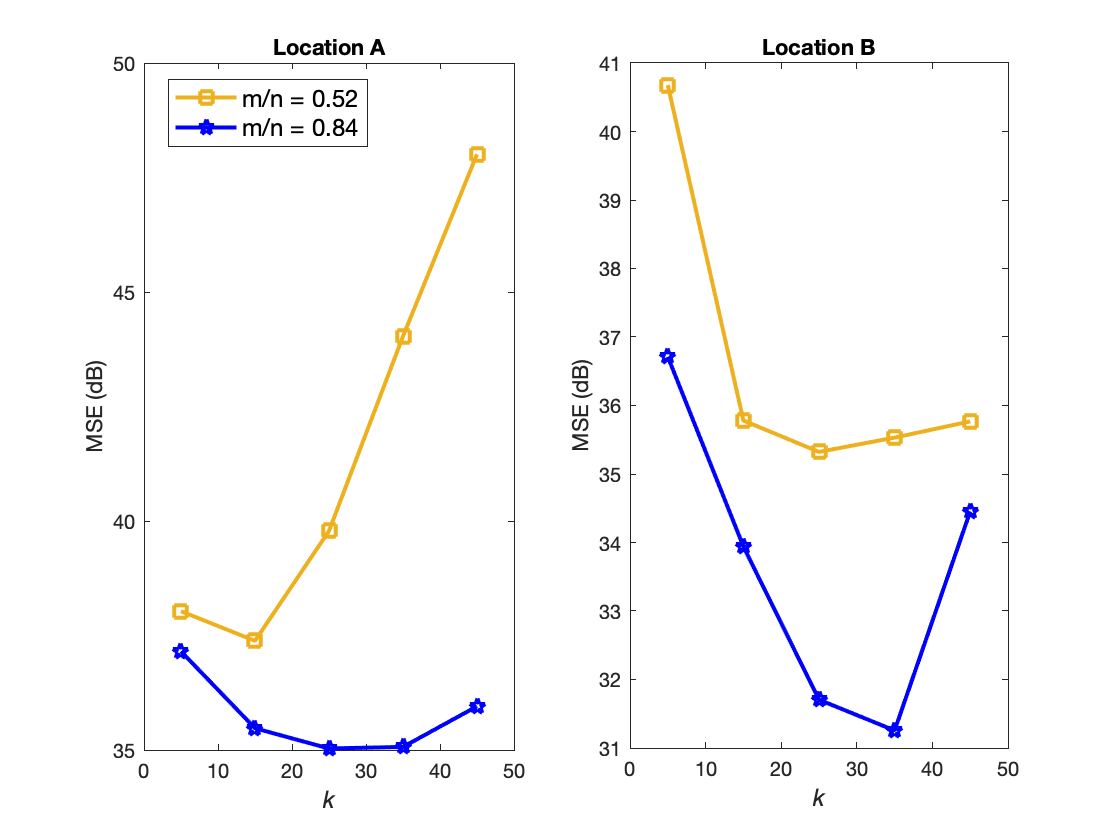
In Fig. 3 and Fig. 4, 361 out of 684 measurements were taken at Locations A and B respectively. As shown, the proposed technique recovered the remaining missing measurements, including the strongest cluster location(s) using limited measurements when is set to 10. In Fig. 5, the corresponding mean square error (MSE) is plotted for different values of DCT coefficients . The figure shows that there is an optimal value of that minimizes the mean square error between the recovered entires and the true entires obtained by exhaustive search at both Locations A and B. Fig. 5 also demonstrate that achieving minimum mean squared error requires a significantly lower number of coefficients for Location A compared to Location B. This observation can be attributed to the sparser signal representation at Location A. The LoS path at Location A leads to a channel with minimal multipath scattering, resulting in fewer high-frequency components in the DCT domain. Consequently, fewer compressed sensing measurements are required to accurately reconstruct the channel. Conversely, the presence of significant scattering in Location B, likely due to nearby metallic objects, results in higher number of high-frequency coefficients in the DCT domain. Recovering such a complex channel with a dense scattering profile necessitates a larger number of CS measurements to achieve an acceptable level of reconstruction accuracy.
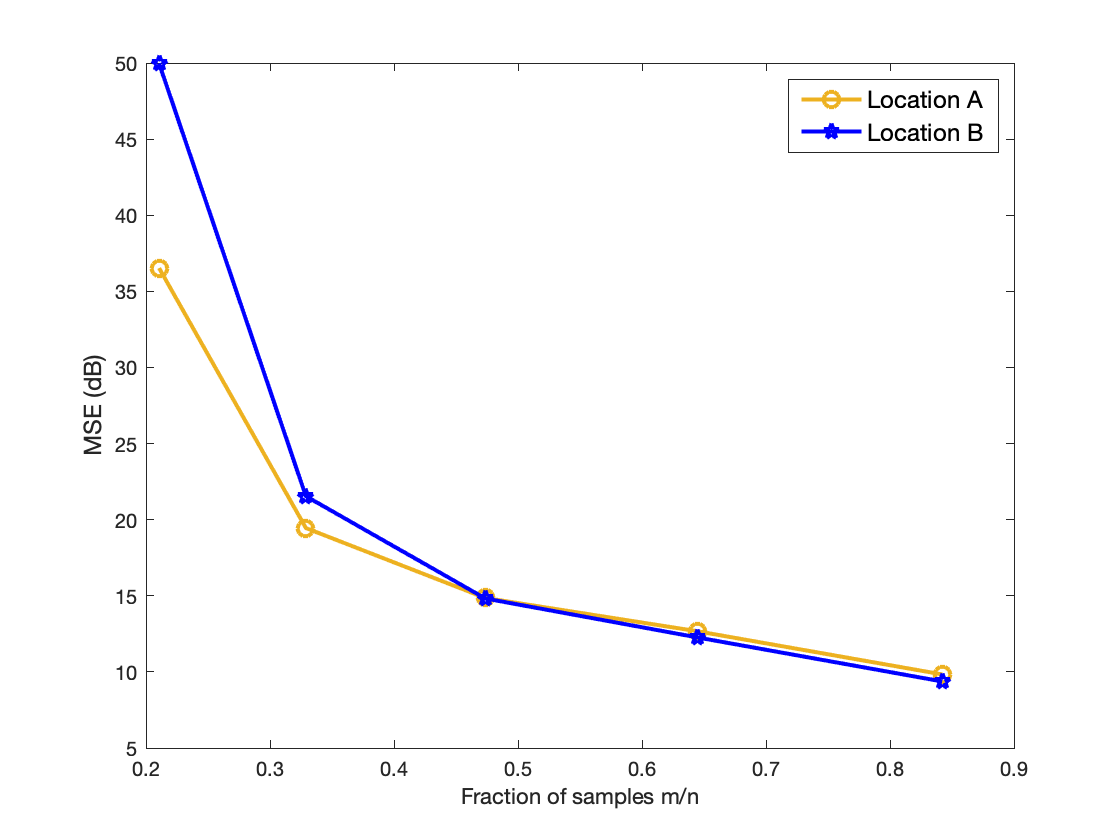
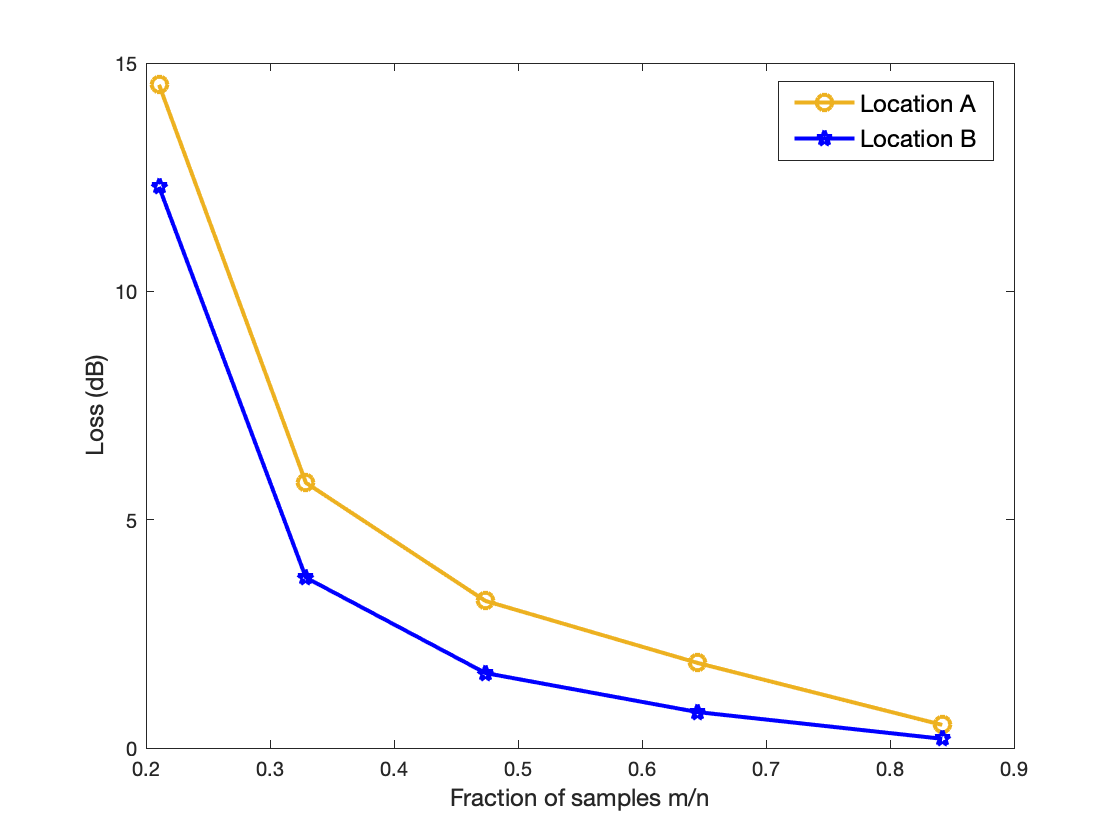
To account for variability and evaluate performance under different beam selection conditions, 1000 iterations of random codebook selection were conducted to generate an average performance metric in Figs. 6, and 7. This random selection results in scenarios with and without blocked beams to assess the robustness of the technique to channel blockages. Fig. 6 demonstrate that the average reconstruction error, measured by the mean squared error, exhibits a monotonically decreasing trend with an increasing number of compressed sensing measurements at both locations (A and B). In Fig. 7, we plot the average loss, which is the difference between the optimal RSS obtained via exhaustive search and the achieved RSS using the proposed technique, versus the fraction of measurements. The figure shows that with a fraction of 0.47 measurements, the average loss between the selected RSS achieved via exhaustive search and the proposed technique is 1.6 dB at Location B and 3.2 dB at location A. Location B exhibits a lower loss due to the secondary cluster which reduces the probability misalignment when compared to Location A. Nonetheless, the figure shows that the loss decreases with increasing measurements.
VI Conclusions
In this paper, we proposed and evaluated a novel mm-wave beam alignment technique specifically suited for dense indoor environments. Unlike conventional methods that exhaustively scan the signal strength across all directions, the proposed technique scans a fraction of the transmit-receive directions and leverages the energy compaction property of the DCT to reconstruct the missing signal strength values in the transform domain. Consequently, the optimal transmit-receive angles can be estimated even in the presence of blockages during the beam training phase. Our results demonstrates that this approach significantly reduces the beam alignment time compared to exhaustive search methods, thus making it highly attractive for practical mm-wave deployments in dense indoor environments. Future work will focus on beam alignment for multi-user scenarios and leveraging environment information to further reduce the fraction of samples required for indoor beam alignment.
Acknowledgment
This material is based on work supported by the National Science Foundation under grant No. NSF-2243089.
References
- [1] J. Zhang et al., “A Survey of mmWave-Based Human Sensing: Technology, Platforms and Applications,” in IEEE Communications Surveys & Tutorials, vol. 25, no. 4, pp. 2052-2087, Fourthquarter 2023.
- [2] T. S. Rappaport, Y. Xing, O. Kanhere, S. Ju, A. Madanayake, S. Mandal, A. Alkhateeb, and G. C. Trichopoulos, “Wireless communications and applications above 100 GHz: Opportunities and challenges for 6G and beyond,” IEEE Access, vol. 7, pp. 78 729–78 757, 2019.
- [3] S. Hur, T. Kim, D. J. Love, J. V. Krogmeier, T. A. Thomas, and A. Ghosh, “Millimeter wave beamforming for wireless backhaul and access in small cell networks,,” IEEE Transactions on Communications, vol. 61, no. 10, pp. 4391–4403, 2013.
- [4] M. E. Eltayeb, A. Alkhateeb, R. W. Heath, and T. Y. Al-Naffouri, “Opportunistic beam training with hybrid analog/digital codebooks for mmwave systems,” in 2015 IEEE Global Conference on Signal and Information Processing (GlobalSIP), 2015, pp. 315–319.
- [5] IEEE, “IEEE802.11-10/0433r2, PHY/MAC Complete Proposal Specification (TGad D0.1),” 2010.
- [6] A. Alkhateeb, O. El Ayach, G. Leus and R. W. Heath, “Channel Estimation and Hybrid Precoding for Millimeter Wave Cellular systems,” in IEEE J. Sel. Topics Signal Process, vol. 8, pp. 831-846, Oct. 2014.
- [7] R. Heath, N. Gonzalez-Prelcic, S. Rangan, W. Roh, and A. M. Sayeed, “An overview of signal processing techniques for millimeter wave mimo systems,” IEEE J. Sel. Top. Signal Process., vol. 10, no. 3, 2016.
- [8] D. L. Donoho, ”Compressed sensing,” IEEE Transactions on Information Theory, vol. 52, no. 4, pp. 1289-1306, April 2006.
- [9] D. E. Berraki, S. M. D. Armour and A. R. Nix, “Application of compressive sensing in sparse spatial channel recovery for beamforming in mmWave outdoor systems,” 2014 IEEE Wireless Communications and Networking Conference (WCNC), Istanbul, Turkey, 2014, pp. 887-892.
- [10] E. Khordad, I. B. Collings, S. V. Hanly and G. Caire, “Compressive Sensing-Based Beam Alignment Schemes for Time-Varying Millimeter-Wave Channels,” IEEE Transactions on Wireless Communications, vol. 22, no. 3, pp. 1604-1617, March 2023.
- [11] D. Needell, and R. Vershynin, “Uniform uncertainty principle and signal recovery via regularized orthogonal matching pursuit, ” Foundations of Computational Mathematics, vol. 9, pp. 317–334, 2009.
- [12] SiversIMA, “Product brief: EVK06002, ‘’ 2021. [Online]. Available: https://www.sivers-semiconductors.com/wp-content/uploads/2021/10/Product-Brief-EVK06002-202110.pdf.
- [13] A. Alkhateeb, G. Charan, T. Osman, A. Hredzak, N. Srinivas, U. Demirhan, and J. Morais, “DeepSense 6G: A Large-Scale Real-World Multi-Modal Sensing and Communication Dataset,” IEEE Dataport, October 31, 2022.