ROADWork Dataset: Learning to Recognize, Observe, Analyze and Drive Through Work Zones
Abstract
Perceiving and navigating through work zones is challenging and under-explored, even with major strides in self-driving research. An important reason is the lack of open datasets for developing new algorithms to address this long-tailed scenario. We propose the ROADWork dataset to learn how to recognize, observe and analyze and drive through work zones. We find that state-of-the-art foundation models perform poorly on work zones. With our dataset, we improve upon detecting work zone objects (+26.2 AP), while discovering work zones with higher precision (+32.5%) at a much higher discovery rate (12.8), significantly improve detecting (+23.9 AP) and reading (+14.2% 1-NED) work zone signs and describing work zones (+36.7 SPICE). We also compute drivable paths from work zone navigation videos and show that it is possible to predict navigational goals and pathways such that 53.6% goals have angular error (AE) (+9.9 %) and 75.3% pathways have (+8.1 %).
![[Uncaptioned image]](/html/2406.07661/assets/x1.png)
1 Introduction
Despite significant advances in autonomous navigation, driving through work zones safely remains challenging. Recently, several public incident reports have suggested that self-driving cars are stumped by even the simplest of work zone situations [98, 57, 54, 38, 97, 50]. Work zones are relatively rare as a fraction of time they are encountered by a vehicle, but they seem omnipresent due to continuous infrastructure building, repair and maintenance. As such, work zones are considered as one of the main challenges for self-driving today [16, 51]. In fact, work zones are challenging for human drivers too [76, 56, 85] – in the United States, over 700 fatalities occur in work zones each year, increasing by 62.8% since 2010. 2021 was a particularly deadly year with 954 fatalities and 42,151 injuries [58, 80].
Why are work zones so hard to understand? First, no two work zones are truly alike (See Figure 2). Objects encountered such as barriers, signs and construction vehicles widely vary by the type of work, the work’s status, location and geography. Navigational aids (like signs) are uncommon and customized to the particular work zone and require fine-grained understanding. The spatial configurations of work zone objects do not conform to the lane, road and sidewalk layouts. Often, rules of traffic are suspended and new rules are enforced that may change over time. All these reasons put work zones in the long-tail part of the scene distribution for self-driving.
Due to their long-tailed nature, work zones have not been historically part of the labeled public datasets that spurred visual scene understanding over the past decade. Work zone images themselves are rare in existing datasets. For instance, limited number of work zone images exist in large datasets like BDD100k [92] and Mapillary [60]. While some common objects such as cones do appear in many datasets [6, 74, 7, 88], none of the other objects associated with work zones have been annotated. We believe that the lack of availability of public datasets with detailed annotations related to work zones is inhibiting research and progress in this area. To ensure all images (and videos) are good quality apart from having visual and geographic diversity of work zones, we opted to curate our own data to form the ROADWork dataset.
We present a novel ROADWork dataset for perceiving and driving autonomously through work zones. While previous works have touched on individual aspects of dealing with work zones for self-driving [53, 26, 25, 89, 61, 20, 19], we believe a concerted and structured approach is needed to address this challenge. As it is well known in psychology, seeing is not observing and knowing is not understanding [73]. Accordingly, driving through work zones requires. comprehension at multiple levels (See Figure 3). Thus annotations in the ROADWork dataset include: (a) Recognizing work zones and detection of constituent objects using bounding box and segmentation labels, (b) Observing fine-grained details about the work zones using arrow board states, labeled text, arrows and drawings on signs, (c) Analyzing the work zones holistically enabled by detailed human description about the type of work, spatial understanding about blockage and activity, and (d) the traversable Driving path in 2D and 3D computed automatically from driving videos through work zones. In total, we have annotated more than 5000 work zones (over 7000 images) across 18 U.S. Cities covering 15 types of objects, 360 types of TTC signs and boards, scene descriptions and 2D/3D traversable paths (See Figure 1). Descriptions summarizing the work zone are detailed and are consistent across the dataset.
The ROADWork dataset sheds light on several common visual learning tasks and facilitates novel tasks as well for understanding and navigating work zones, allowing for significant improvements in following downstream tasks:
- 1.
-
2.
Interpreting work zone signs is still a significant challenge for foundation models. We show techniques like simple copy-paste [22] (+7.1 ) and crop-rescale (+14.2% 1 - NED) considerably improve performance of sign spotting and recognition.
-
3.
Visual-language foundation models [42, 46] also perform poorly while describing work zones. Lora [31] finetuning on ROADWork data significantly improves performance (+32.8 SPICE), but many scene elements are hallucinated. Composing a specialized work zone detection model to provide object context significantly reduces hallucinations (+3.9 SPICE).
-
4.
We formulate the work zone navigation problem as goal and pathway prediction in images, and show that it’s possible to predict both with average displacement errors of 80.58 (-21.3 % Err.) and 22.68 pixels (-27.49 % Err.) respectively.
We hope the novel ROADWork dataset and the baselines described will spur further research in this important and oft-neglected long tailed scenario to make autonomous driving successful in work zones.
2 Related Work
Long-Tail Scenarios in Autonomous Driving. Driving datasets, starting from KITTI [21] scaled up data for autonomous driving by introducing diversity and tasks [92, 6, 60, 14] and sensor suites [7, 74, 17]. However, these datasets lack long-tailed scenarios. For example, nuScenes contains only 19 driven sequences with work zones [71]. One long-tailed scenario that has received considerable interest is perception in bad weather. Collecting lots of data in inclement weather is difficult and data capture quality degrades with weather adversity [4] – datasets exist focused on these scenarios such as fog [4, 67], night [92, 66] and snow [4, 5].
Work Zones are yet another class of road conditions. Work zone situations are complex and have open-set elements and task formulation is difficult [71]. To the best of our knowledge, no large-scale public dataset exists for this scenario, and we are the first ones to provide such data. While the Michelin Mobility Intelligence (MMI) (formerly RoadBotics) Open Dataset [33] is publicly available, this data was collected for road inspection and consists only of raw videos. We designed scenario taxonomies, mined, and annotated work zones to create the ROADWork Dataset.
Work Zones in Autonomous Driving. Problems to handle few work zone edge-cases has been attempted in prior literature. For example, [26] recognize safety barriers using a laser scanner while [25] attempt to decide which lane lines define a valid lane in work zones. Later works [53, 71] attempt to classify and localize work zones. Another line of works attempt to update traditional maps [52] and HD maps [61] with additional work zone information. However, no prior work categorizes, formulates tasks and data concerning autonomous driving in work zones.
| Object Categories | Weather | Alteration | Time | Env. | |
| Cone | Tubular Marker | Partly Cloudy | Fully Blocked | Dark | Urban |
| Fence | Vertical Panel | Sunny | Lane Shift | Light | Suburban |
| Worker | Work Equipment | Unknown | Partially Blckd. | Twilight | Highway |
| Work Vehicle | Arrow Board | Wet | Other | Unknown | Rural |
| TTC Sign | TTC Msg. Board | Cloudy | None | Other | Unknown |
| Drum | Police Vehicle | Fog or Mist | Other | ||
| Barricade | Police Officer | Ice | |||
| Barrier | Othr Rdwork Objs | Other | |||
Language and Navigation in Work Zones. Unseen scenarios, such as, “new” work zones popping up in a route, is a big challenge for autonomous driving. Work zones are the classical example of navigation in open-ended driving scenes, these situations require a higher level of semantic generalization. Linguistic representations can help generalization, helping generate introspective explanations [36] leading to better action predictions [91].
Recently, visual language models (VLM’s) [46] (and large language models (LLM’s)) have been increasingly employed for scene understanding, demonstrating state-of-the-art generalization and reasoning capabilities. Recent efforts [86, 40, 49, 79, 41] have leveraged these VLM’s/LLM’s to redefine scene understanding and subsequently, motion planning. Navigating work zones require visuospatial and linguistic abilities to navigate through them. We propose a work zone description benchmark to address global scene understanding in workzones.
For navigation in work zones, we believe long horizon trajectory forecasting is necessary as relying on strong structural cues like lanes is not applicable in this situation. Prior works [48, 43, 27] explored a related setting, long horizon human trajectory forecasting. Inspired by this line of work, we propose a new pathway prediction problem and baselines to address this task.
3 ROADWork Dataset
ROADWork dataset contains images, object annotations, scene tags, text descriptions and 2D/3D drivable path annotations. We discuss image acquisition strategy, annotation workflow, protocols and dataset statistics.
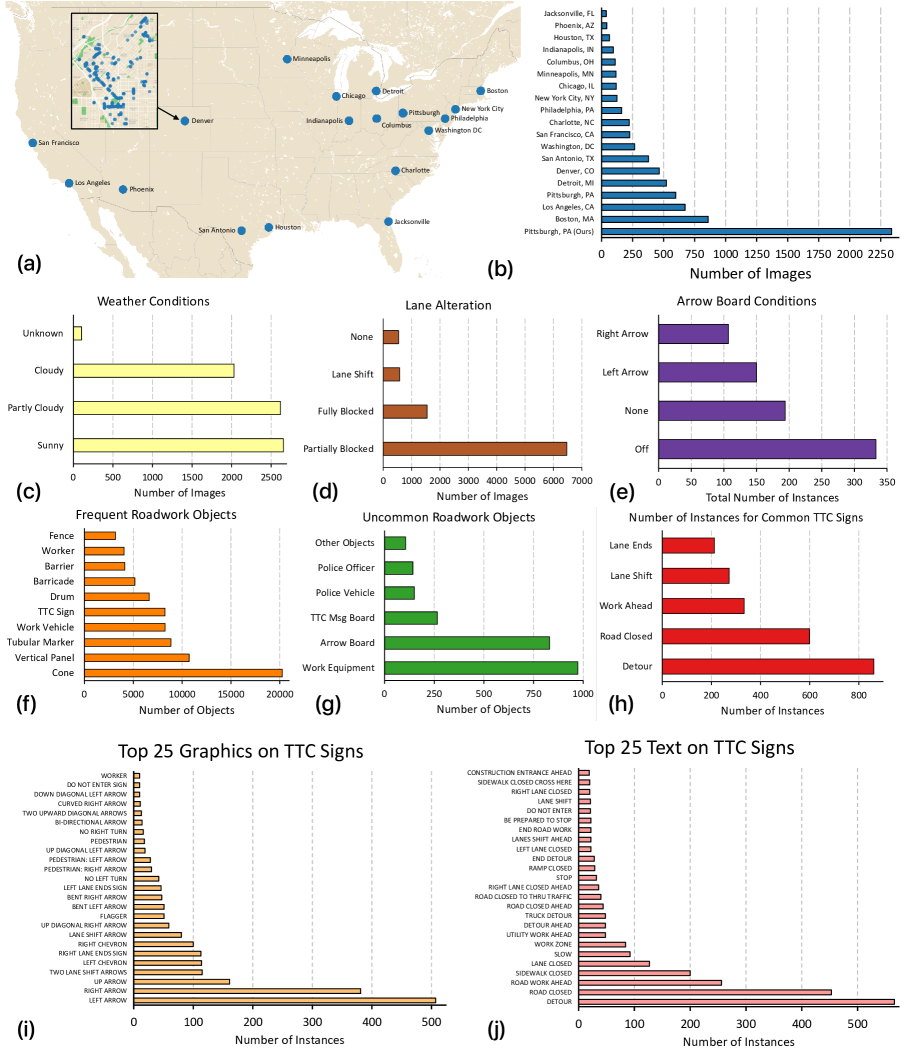
Image Acquisition. Visual data were acquired from cameras mounted inside a vehicle while driving through 18 U.S. cities. The dataset consists of 7,416 total images captured from two sources: images that we captured and images that were semi-automatically mined from the Michelin Mobility Intelligence (MMI) (formerly RoadBotics) Open Dataset [33]. We drove on urban, suburban, and rural roads in Pittsburgh and captured 2,338 () images with an iPhone 14 Pro Max paired with a Bluetooth remote trigger. Images from other U.S. cities were sourced from videos in the MMI Open Dataset. A combination of Detic [96] and a cone detector trained on NuScenes [6] were used to mine frames presumed to contain roadwork zones with detector confidence at – ensuring high recall with the tradeoff of low precision. Then we manually selected 5,078 (68%) images containing unique road objects or roadwork zones while prioritising individual scene diversity. Nearly all images in the dataset were captured during the daytime with no adverse weather conditions. U.S. cities where the images were captured and corresponding image distribution are shown in Figure 5.
Scene Tags. We labeled images with scene tags to capture the weather, time of day, travel alterations, road environment and if the work zone is active or not (See Table 1). Presence of roadwork objects in a scene does not necessarily constitute an active work zone, e.g., a cone in a parking lot. Work zones are labeled as active work zone, not active work zone, or unsure. Active work zone label includes roadwork as well as work that has potential impact on the mobility of vehicles or pedestrians, thus, objects must be located on a road or sidewalk where a vehicle or pedestrian could travel. Approximately 80% images were labeled as active work zones.
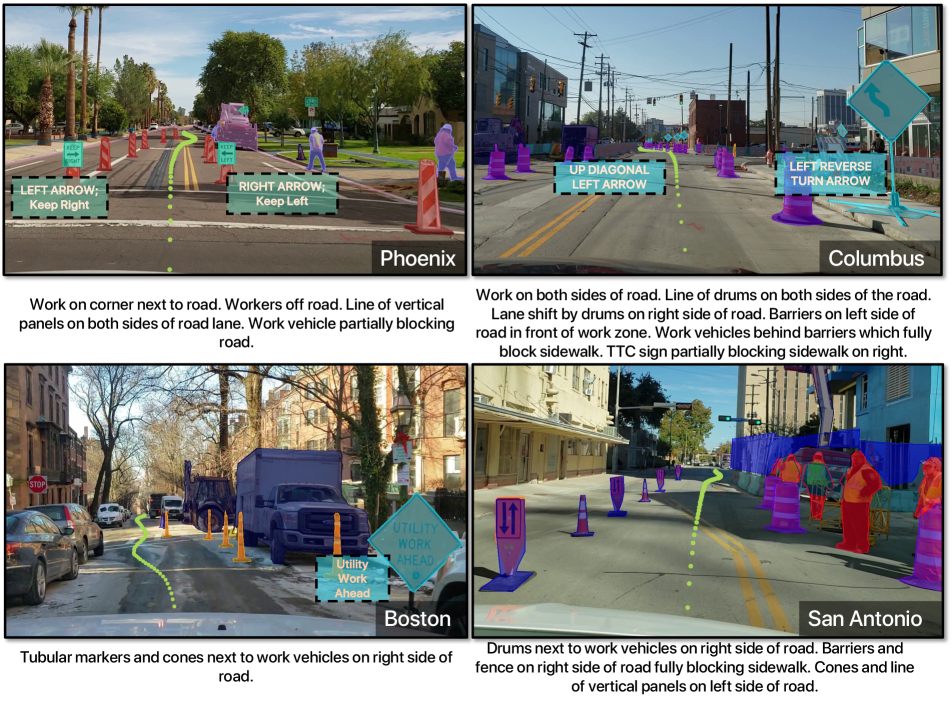
Scene Descriptions. Associated descriptions give details of important work zone elements, their locations and relationships in the scene (See Figure 2). Descriptions provide the approximate locations of work zones and objects on the road or sidewalk. Additionally, we convey the relative locations of objects relative to work zones and other objects. All the descriptions are consistent in terms of the vocabulary used and were written by one person.
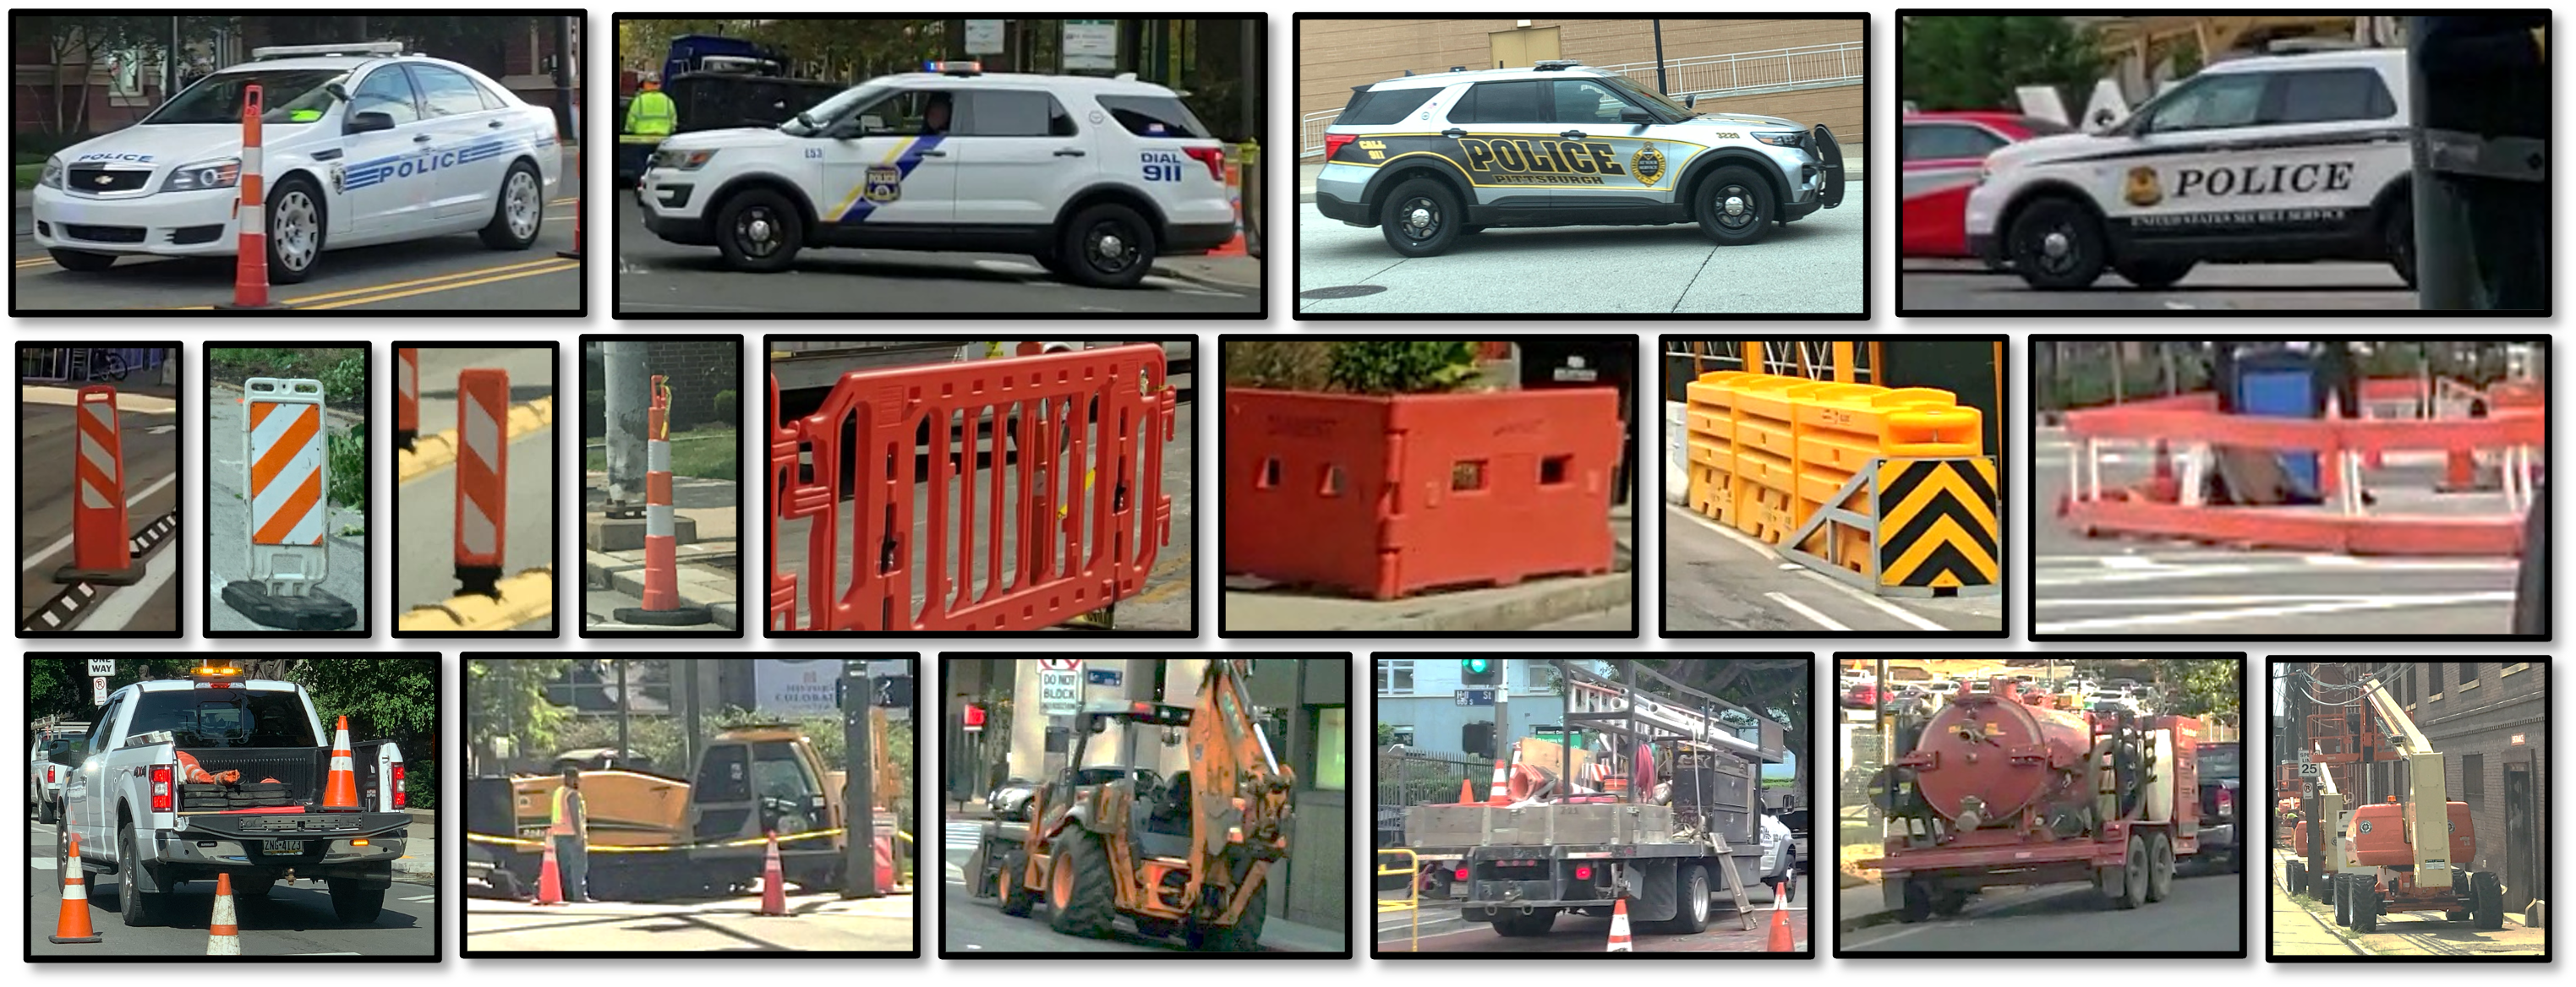
Object Annotations. We identified 15 categories of objects that are typically found in work zones. Objects include those that mark temporary traffic control pathways such as cones and tubular markers, fences, barriers, and drums. We also annotated objects that help navigation such as temporary traffic control (TTC) signs, TTC message boards and arrow boards. We also annotated Workers, Work Vehicles, Police officers and Police Vehicles since they influence and direct traffic in work zones. See Figure 4 and Table 1 for categories and examples of work zone objects.
Object annotation workflow involved a mix of automatic and manual labeling, and manual verification. To simplify manual annotation efforts, we employed Detic [96] using a custom vocabulary of “cone, drum, vehicle, traffic sign” on images captured by us to bootstrap our annotations. Category predictions from Detic [96] were discarded as Detic [96] made many classification errors. Polygons were simplified using the Vishwalingam-Wyatt algorithm [83] to facilitate editing. All object categories were manually assigned. Other objects in these images and objects for all other images were manually segmented and categorized. Finally, all annotations were manually verified by one person.
Fine-Grained Object Annotations. Objects that are partially blocked by other objects or truncated were marked as “occluded”. A few categories of objects have additional associated annotations, namely, arrow boards and TTC signs and TTC message boards. For example, state of the arrow boards (“OFF”, “LEFT”, “RIGHT”, “NONE”) is annotated (See Figure 5 for the distribution of arrow board states).
TTC sign and TTC message boards generally contain “text” and “graphics” (See Figure 6). We also annotate a description of the graphics (e.g. “LEFT ARROW”) and the associated text for each sign (e.g. “DETOUR AHEAD”). Additionally, the text (or graphic) are marked as “occluded” when the object is partially occluded or truncated by the image boundary. Sign text and graphic descriptions were parsed to identify common types of TTC signs (See Figure 5). The distribution of TTC sign graphics and text is long tailed (See Figure 5), 62 and 360 different types were annotated respectively.
Semantic Segmentation. We manually segmented roads, sidewalks, and a sparse sampling of bicycle lanes to provide contextual localization for work zone objects.
2D/3D Drivable Trajectories. The MMI Open Data Set [33] contains long video sequences with weakly aligned GPS information. This data was collected from a Samsung Galaxy S9; thus, the camera instrinsics are known. We use our mined and annotated work zone images to extract 30 second video snippets from the long video sequences. Then we sampled these videos at 5FPS and employed COLMAP [70] to generate sparse 3D reconstructions. Using the GPS coordinates, we geo-registered 3D reconstructions with a similarity transform to the Earth-Centered-Earth-Fixed (ECEF) Cartesian coordinates resulting in metric-scale 3D scenes. We then align the reconstructions to the road network. We also fit the ground plane selecting the 3D points that lie on the road using an off-the-shelf semantic segmentation model [9]. We project the camera poses onto the ground plane to obtain 3D trajectories, which are projected back onto the source images to obtain 2D drivable trajectories.
4 Analysis and Experiments
We present experiments, baselines and analysis of the ROADWork dataset, showcasing relevant problems in this domain and suggest directions for future research. We follow the experimental flow in terms of the levels of scene comprehension needed: Recognizing work zone scenes and objects, Observing fine-grained local scene elements like TTC signs, Analysing and generating the scene globally and predicting and forecasting Drivable paths.
4.1 Recognizing Work Zones
The problem of “recognizing” work zones and objects present in work zones is itself under-explored and little work has been done in this regard. We did not find previous work that defined the various objects present in a work zone, and ROADWork dataset provides that taxonomy (See Section 3). In the context of recognition, we consider detecting and segmenting work zone objects, discovering new work zone images that contain these objects to bootstrap and improve our models, and also study the adaptation problem arising from geographic variations while detecting work zone objects.
Detecting Work Zone Objects. Foundation models for open vocabulary scene understanding [96, 94, 90] have shown impressive zero-shot generalization on many existing datasets. No baseline exists for recognizing work zones and their constituent objects, leading us to consider these open-vocabulary foundation models. Please note that while earlier datasets did consider construction zone objects like cones [60, 6], they did not consider all types of work zone objects. As we identified and categorized 15 work zone objects (detailed in Section 3) as part of ROADWork dataset, thus it is important to understand if these existing foundation models could already recognize these objects.
We selected two popular open-vocabulary instance segmentation methods, Detic [96] and OpenSeeD [94], to verify if they demonstrate zero-shot generalization in our data. Table 2 shows our observations, while a few of these object categories appear to be common concepts, for example, “Fence” and “Police officer”, open-vocabulary methods [96, 94] fail to detect most of the objects, no matter which large-scale training source was used. Do note that they both employ a 400 Million size image-text paired dataset CLIP [63] is pre-trained on, thus it’s likely that the text data of such large datasets do not contain information about work zones. Correspondingly, finetuning Mask R-CNN [28] on our data significantly improves detection accuracy (+25.7 ) showing that performance of open vocabulary methods leaves much to be desired for work zone recognition. Existing large datasets woefully under-represent work zone objects which are not part of their vocabulary. We also attempted to see if copy-paste [22] augmentation helps further improve performance, but we observed that the improvement was small (+0.5 ) and actually hurt performance on small objects (-2.7 ).
| Supervision | ||||||
| Bbox + Segm. | 29.9 | 48.3 | 32.7 | 16 | 32.9 | 43.8 |
| Psuedo-Segmentations from SAM [37] | ||||||
| Bbox | 24.7 | 47.9 | 27.3 | 13.3 | 28.8 | 38.4 |
| Bbox + 5 pts | 25.4 | 46.5 | 25.3 | 16.2 | 28.9 | 37.9 |
| Bbox + 10 pts | 25.8 | 47.2 | 25.9 | 14.2 | 29.3 | 38.5 |
Are manual segmentations still needed? Foundation models for promptable segmentation [37] have shown competitive zero-shot generalization on many public datasets, putting in question the need for manual segmentations.
To verify if their claim holds for ROADWork dataset, we employ Segment Anything Model (SAM) [37] to perform zero-shot instance segmentation employing our ground truth boxes as the input to generate psuedo ground truth segmentations. We then train Mask R-CNN using ground truth and pseudo ground truth. From Table 3, we observe that manual segmentations improve performance by +5.2 . This gap is even more pronounced for rare workzone objects, for instance, “Arrow Board” (+26.9 ) and “TTC Msg Board” (+8.7 AP). However, for person classes which are common, i.e., “Worker” (+1.2 ) and “Police Officer” (-2.1 ), segmentations from SAM are comparable or slightly better. Thus, manual segmentations of rare objects are still useful.
We also studied whether alternate annotations (say points [10], which also show competitive performance to manual segmentations) would have sufficed, we prompt SAM [37] with not only the bounding box, but also 5 or 10 positive and negative points (simulated from ground truth masks). We observe while it improves performance, the gap remains around +4.1 .
Characterizing and Discovering Work Zones. As work zones are rare, discovering new work zones from vast amount of unlabeled data is an important task. As detailed in Section 3, we resorted to manual filtering of work zone images, which would be extremely cumbersome while scaling to millions of images.
Before we would attempt to discover work zones, it is important to define what constitutes a work zone. Existence of a work zone object (say, a cone or a work vehicle like cement mixer) does not necessarily amount to the scene being a work zone. From a vision perspective, we define work zone as any activity on the road, delineated by specific objects and human actors and activities, that redefine the road network and hence traffic rules on that road.
One proxy of work zone activity could be the “intensity” of a work zone. Intensity can be characterized by number of work zone objects and relative area occupied by them in the scene. We attempt to discover work zone following this intuition in existing self-driving datasets and devise a simple classification rule – an image is a work zone iff at least three instances of work zone objects from two unique categories occupying at least of the image area exist in the image. As we observe from Table 4, our method discovers more work zone images with far higher precision in both BDD100K [92] and Mapillary [60] datasets compared to Detic [96], discovering work zones from around the world (See Figure 7). Lastly, we discovered less than 1000 images from BDD100K [92] and Mapillary [60], representing and of the datasets.
Adapting to New Geographies. While we are able to discover work zones in new geographies (Figure 7), does the performance of our recognition model remain the same? As we scale autonomous driving to new regions, handling visual variations in work zones poses a significant challenge. Figure 4 shows challenges with work zone objects – visual variations are localized to specific regions and cities. It is important to recognize work zone objects that might be different in appearance while being functionally equivalent. While domain adaptation methods have looked at geographic adaptation, but only across countries [87, 81, 34, 95, 30] largely for common objects like cars [87]. However, domain gap exists within different cities in a country too, specially pronounced among rare work zone objects. We make two inferences; (a) we show this domain gap in our data and (b) state-of-the-art methods do not address this gap.
To observe the domain gap, we consider object detection with the coarse grained vocabulary, and test on data from all cities while progressively adding data from cities in decreasing order of sample size (Fig 8 (a)). We observe consistent improvement (+7.4 ) as supervised data from new cities is added. However, obtaining supervised data for new geographies is not scalable – restricting to cities itself, more than 500 cities with a million inhabitants exist [59], growing by 10 cities a year. Thus motivating the unsupervised geographic adaptation problem, where source domain is available with images and labels , i.e. dataset and target domain only consists of images , . In our case, we consider data from City X as source domain while the other cities form the target domain. Testing is done on target domain and we consider the simpler domain adaptive object detection problem. From Fig 8 (b), state-of-the-art adaptation methods [35, 95] do not improve adaptation significantly – large gaps even remain for heavily-represented objects like cones (-5.4 ), arrow boards (-11.6 ) and drums (-12.6 ) and are significant for rarer classes like barricades (-13.8 ) and vertical panels (-20.7 ).
4.2 Observing Work Zones
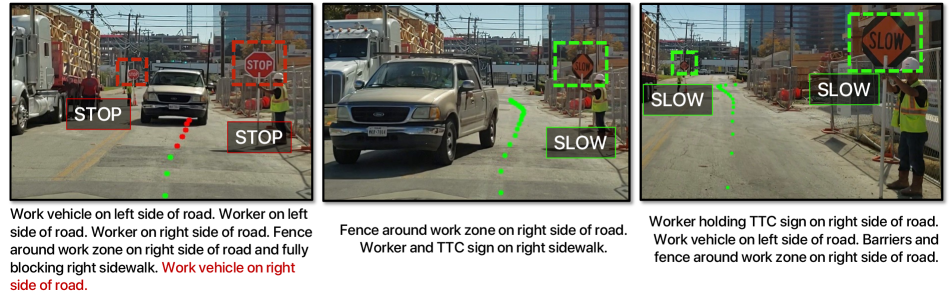
As discussed in Section 1, merely recognizing objects is not enough for navigating through work zones – we also need fine-grained local observations and understanding. The challenge of understanding and interpreting local semantics is what we term as “observing”. For example, observing arrow board states present on the street is very useful for navigation (Figure 5). Reading signs would also help greatly in planning and navigation. Figure 6 shows challenges with reading and interpreting TTC signs – compound combinations and variations of TTC sign appearances and texts form a long tail of rare instances making sign interpretation a challenge. We decompose sign interpretation into two sub problems – recognizing the graphical or pictorial representation in the sign and reading the text of the sign. Please note that “observing” work zones is not restricted to just interpreting signs or arrow board states, there are situations where human actions (say a police officer or a worker waving) may also need to be observed, but we restrict our scope to these inanimate objects we identified.
Detecting Fine-Grained Signs. “Graphics” refers to the pictoral diagrams and figures that are frequently present in signs, such as arrows or stick figures that depict humans. ROADWork dataset contains 62 different types of signs board “graphics”. As observed in Fig 5, the frequency distribution of these “graphics” is extremely long-tailed. In the coarse vocabulary considered in Section 4.1, all the TTC signs were binned as the general “TTC sign” category. We instead consider a fine-grained vocabulary, where each sign-board “graphics” is considered a separate category – expanding the label vocabulary to 49 classes. However, scarce categories (sign graphics with less than 5 instances) were binned into “Other” category.
| Edit. (1 - NED) | Word Acc. | Ch. Recall | Ch. Precision | Ch. F1 | |
| Glass [65] | 65.4 | 56.0 | 65.8 | 98.4 | 78.9 |
| Glass (w/ 1x crops) | 76.8 | 56.3 | 78.9 | 84.2 | 81.4 |
| Glass (w/ 2x crops) | 78.6 | 60.5 | 81.3 | 86.2 | 83.6 |
| Glass (w/ 3x crops) | 79.6 | 59.6 | 80.6 | 86.1 | 83.2 |
| Small Signs Subset (Area less than ) | |||||
| Glass [65] | 19.6 | 13.2 | 18.1 | 93.1 | 30.3 |
| Glass (w/ 1x crops) | 76.7 | 20.9 | 42.2 | 70.4 | 52.8 |
| Glass (w/ 2x crops) | 81.1 | 34.5 | 51.8 | 80.1 | 62.9 |
| Glass (w/ 3x crops) | 81.3 | 32.3 | 48.7 | 78.4 | 60.0 |
We employ open-vocubulary instance segmentation methods, Detic [96] and OpenSeeD [90] like Section 4.1, and consider fine-tuned Mask R-CNN [28] on ROADWork dataset for comparison. We report our observations in Table 5, open vocabulary instance segmentation methods [96, 94] are dismal in detecting these signs while Mask R-CNN [28] performs considerably better (+16.5 ). It is considerably worse than a model trained on the same data with coarse-grained vocabulary. To mitigate this, we employ simple copy-paste augmentation [22] which has shown to improve rare category segmentation. It further improves the accuracy of Mask R-CNN [28] by +7.1 . Recognizing small far away signs is important for navigation, remain a challenge as it appears that simple copy-paste marginally hurts performance (-0.3 ).
Reading Sign Text. ROADWork dataset contains 360 different TTC sign texts, all written in English. As sign text is unconstrained and provides navigational instructions, spotting and reading them accurately is important. We consider a popular scene text spotting and recognition method, Glass [65]. We evaluate the spotter and recognizer on TTC signs, and ignore other text present in the scene.
Glass [65], trained on TextOCR [72] dataset, spots and recognizes TTC signs, but fails on small, far away signs (See Figure 9). Our annotations do not include character level annotations required by Glass [65] so we did not finetune it on our data. We report common sentence, word and charecter level metrics for text spotting [65, 12]. From Table 6, we observed that while precision of Glass [65] is high out the box, recall was low. Thus, we adopted a simple cropping strategy, composing Glass [65] with Mask R-CNN [28] trained on ROADWork dataset in Section 4.1 and inferred only on crops of TTC signs. Our strategy increased recall significantly (+13.1%) at the expense of precision. Edit distance also significantly improved (+11.4%) but word accuracy didn’t improve a lot (+0.3%). However, merely increasing the scale of the crops improved all metrics, e.g. Word Accuracy (+4.5%) and Character F1 (+4.7%) improved significantly. Furthermore, there is a large performance gap in small signs – around 20%-30% lower. We considered signs whose bounding box area is smaller than as “small”, and crop-rescale strategy significantly improves performance in this case too. For instance, word accuracy (+21.3%) and Charecter F1 (+32.6%). Our results suggest current text spotters are not scale agnostic, and methods trading-off image scale globally [11, 23] or locally [77, 24, 78] are likely useful in this scenario too.
Another class of errors arise from partially occluded and vandalized signs. Our analysis suggests generating simulated data to composit different combinations (say, by simulating all TTC signs from the DMV handbook) appears to be promising direction for robustly observing and interpreting TTC Signs.
4.3 Analyzing Work Zones
In Sections 4.1 and 4.2, we focused on object recognition and fine-grained scene understanding. As we noted in Section 1 (also see Figure 3), analyzing the scene globally is required when navigating construction zones. “Analyzing” the work zone in this paper refers to generating a compressed representation of the scene (in the form of a description) to inform downstream planning and control algorithms. A faithful scene description is an extremely compressed scene representation, and can act as an additional context while navigating. Recently, Vision-Language Models [42, 46] have shown very good scene comprehension abilities and we understand their capabilities in generating these scene descriptions.
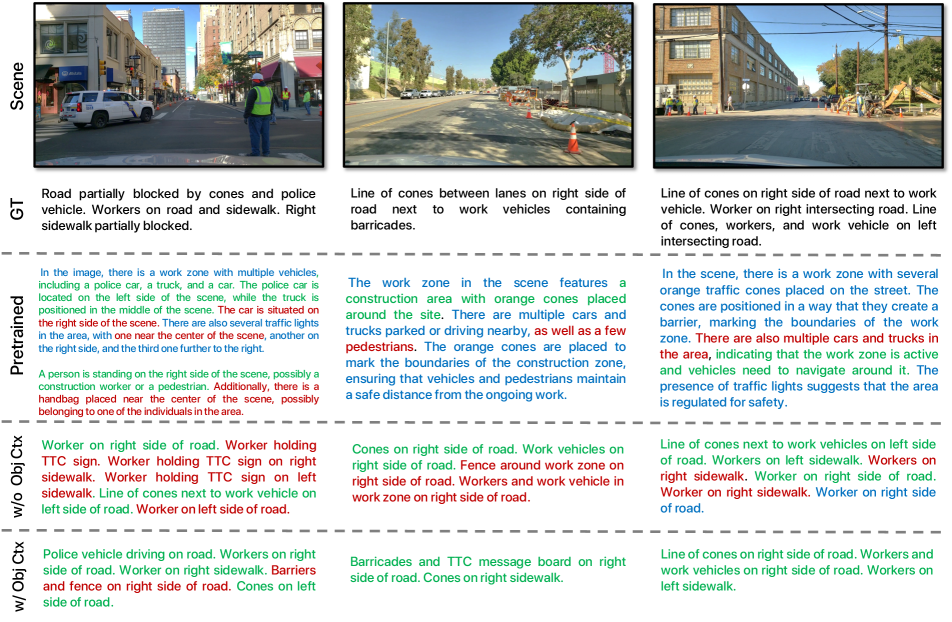
Generating Work Zone Descriptions. Visual-language foundation models have shown considerable performance in scene understanding and comprehension in many general situations [63, 42, 46]. However, work zones are underrepresented in their training sets, and pretrained BLIP [42] and LLaVA [46] models do not generate informative descriptions (Table 7).
It is expensive to perform full finetuning of these models due to memory constraints, however, low rank adaptation [31] performs comparably to full finetuning. Hence, we employ low rank adaptation [31] to finetune these models. The associated prompt to generate descriptions are “You are the planner of an autonomous vehicle, ONLY describe the workzone in the scene identifying and describing the spatial relationship of relevant objects to plan and navigate a route”. Even though the number of image-description pairs in ROADWork dataset is around 7K, as the descriptions are high-quality and consistent, we observe considerable improvements (See Table 7), and the bigger LLaVA-7B model [46] outperforms BLIP [42] on all metrics by a large margin – effectively utilizing the learned priors of a bigger model. We also tried different input prompts, but that didn’t affect performance considerably. Figure 10 shows some generated descriptions. We observe pre-trained LLaVA [46] generates many untrue and irrelevant sentences. In turn, finetuning the model helps, identifying many scene elements that exist, but also hallucinates scene elements that do not exist.
In light of the above observations, we hypothesized that incorporating uncertain object predictions as context would further improve description quality. We compose the detections of our work zone detector trained in Section 4.1 to align our descriptions with detected workzone objects. While training, we employ ground truth labels while finetuning LLaVA [46] by generating a programmatic prompt for each object – “(object_category: confidence) at [(x1, y1), (x2, y2)]” and providing this information in the prompt. While testing, we employ predictions from the work zone detector and we observed significant improvements over naive finetuning (See Table 7). We also provide the ground truth objects while testing instead, establishing an upper bound. A considerable performance gap exists on CIDEr [82] and SPICE [2] metrics which measure similarity with respect to human consensus and judgement. N-gram metrics, BLEU [62], ROUGE [44] and METEOR [3] do not capture faithfulness [82, 2] hence the performance gap exists but is not that significant.
4.4 Driving Through Work Zones
In Sections 4.1, 4.2 and 4.3, we studied challenges in recognizing, observing and analyzing work zones. In this section, we discuss challenges present while driving through work zones and our formulation towards solving this problem. We present an alternative and complementary way of tackling the navigation challenge in work zones – predicting goals and pathways in the image space.
| Goal | Path | Goal | Path | Goal | Path | Goal | Path | Goal | Path | |
| YNet [48] w/ Pretrained Segm. [14] | 43.7 | 67.2 | 63.5 | 82.8 | 79.0 | 90.5 | 89.6 | 96.0 | 94.5 | 98.5 |
| YNet [48] w/ ROADWork Segm. | 53.6 | 75.3 | 73.8 | 87.2 | 85.9 | 93 | 93.2 | 97.3 | 97.0 | 99.3 |
Pathway Prediction in Work Zone Images. Work zones require long-term planning and reasoning in the image view apart from the bird’s eye view (BEV) [13] that is extensively studied [75, 55, 32, 15] for common driving situations. For instance, driving on highways where following lanes is very strong cue and BEV representation suffices. Rare objects, fine-grained observations, and visuo-spatial interactions in the scene are important – it may not be feasible to efficiently represent all elements in a BEV representation. Work zones change the road network using objects like drums, cones and barriers apart from navigational signs. Thus navigation needs to be strongly coupled with ego-car vision in work zones. We predict drivable pathways in the image space while driving through work zones.
Many motion planning works [84, 64] forecast an ego trajectory within a predefined time window, say, the next seconds [15]. This short-term planning is often insufficient in complex environments like work zones. Work zones span several hundred meters and present dynamic changes and goals that are not effectively captured within a brief temporal window. We instead view the trajectory forecasting problem in terms of predicting longer term goals and passable trajectories that influence downstream planning.
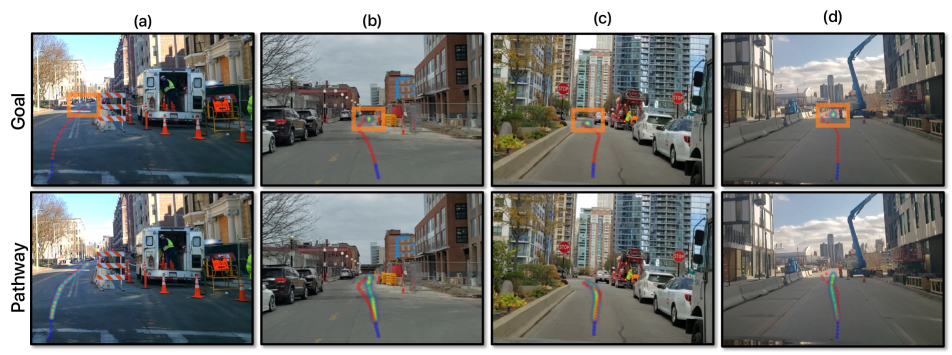
Long-term goals are dynamic, significantly influenced by scene elements. A good example depicting dynamic goals is illustrated in Figure 3, the stop sign is held by a worker as the other car passes by, the goal for the vehicle is to stay still or move forward a few feet, which may take several seconds. Only when both the slow sign is shown and the approaching car has passed, the goal changes to going straight. Navigational goals cannot be effectively captured within a fixed temporal window and are inherently multi-modal. Even assuming that we know the goal, passable regions conditioned on this goal continuously change. For e.g., intent of other agents, work zone vehicles or workers, are difficult to model and influence the pathway. Therefore, goals and pathways are multi-modal and stochastic and we model them as probability distributions. We envision perception cost maps for BEV planners [47, 18, 68] could be derived from these predicted goal and pathway probabilities. Long-term human forecasting shares many of these properties, thus we hypothesized YNet [48] architecture is transferable due to the similarity of objectives even if we operate in the ego-vehicle viewpoint.
We computed driving trajectories from driving videos (detailed in Section 3). 3D trajectories were then projected onto the image to obtain 2D waypoints. Not all waypoints lie on the road, so we filter to obtain longest continuous trajectory segment that lies on the road. Computed trajectory is timestamped and depends on car speed and can have any number of waypoints. We fit a spline and sampled 20 equidistant waypoints. The first five waypoints are the observed waypoints (input), the final waypoint is our goal and rest of the waypoints form the future pathway.
We employ YNet [48] architecture as is, however, we pre-train the segmentation model that YNet employs using the Cityscapes [14] dataset which contains no work zone object annotations and with ROADWork dataset for comparison. It should be the noted that both the models are then trained on pathways from ROADWork dataset. We employ Angular Error Percentage computed at an error threshold () for comparison. This is because pixel level metrics like average displacement error [48] but do not account for camera’s field of view in the ego-car’s viewpoint. We have access to the camera instrinsics and the angular error is computed by finding the angle between ground truth point and predicted point in pixel coordinates,
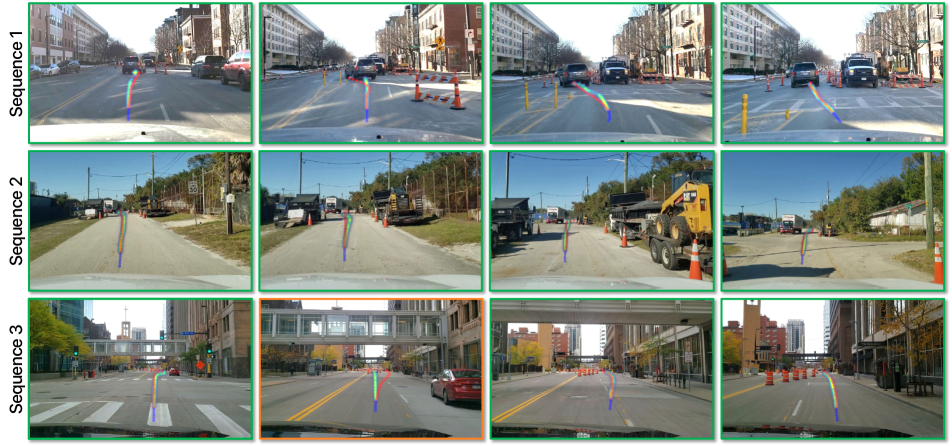
Now, we define as the percentage of predictions whose angular error is within a threshold . Do note horizontal field of view of our images are around . Table 8 presents our results with different thresholds, we can observe that the model trained on ROADWork dataset is better at all thresholds. For example, at the angle threshold of , ROADWork data improves the goal error % by +9.9% and pathway error % by +8.1%. Figure 11 shows cases where plausible goal and pathway heatmaps are predicted by the method, while Figure 12 shows major failure cases of the approach. Figure 13 shows predictions in a sequence – we observe that the trajectory heatmap is dynamic and stochastic employing different scene level cues while forecasting trajectories (such as locations of other vehicles navigating the same work zone or the available free space in the work zone). One major challenge we noticed in our predicted heatmaps is that modelling multimodality of goals is a challenge. It’s not easy to predict all possible goals, say at an intersection. Also, in heavily blocked work zones, both goal and pathway prediction fails. Investigating constraints to encourge goal and pathway diversity, possibly by employing simulated data, appears to be an important research direction. We shall also investigate BEV planning in work zones in future work.
5 Discussion
We discuss some key future directions and avenues of research, and limitations of our work.
Future Directions. Long-tailed situations like work zones are inherently data scarce, even after curating and mining thousands of hours of driving video data, number of images and annotations in ROADWork dataset is in thousands, and rarest of the rare objects situations are in tens and hundreds. The data scarcity problem might be addressed by identifying situations where internet and/or simulated data would be beneficial to tackle these situations and developing methods to continually improve our large LLMs or VLMs, in these scarce data situations. We expect generative methods to be an important piece of tackling this data scarcity problem. Another direction to address this challenge involves thinking about new and ingenious data sources that are economically viable, say, from traffic cameras or road inspection data [33] as we did.
Compound AI Systems [93], i.e., composing models with techniques like retrieval augmented generation [39] or search [1] are promising. UniAD [32] argued autonomous driving modules accumulate errors when standalone models are trained and employed, proposing unified query interfaces across modules to leverage complementary feature abstractions. These decentralized approaches seem amenable for tackling problems concerning work zones too. We looked at work zone sub-problems (object recognition, sign interpretation, pathway prediction etc) independently and proposed baselines – and saw improvements while incorporating context from other modules (Sections 4.2 and 4.3). Studying this design space – which modules are necessary (e.g., is sign interpretation needed?) or modeling their interactions (say, which modules need to be tightly coupled) is an important future direction.
Limitations. Our work has a few limitations. ROADWork dataset does not contain data from multiple calibrated cameras and most of the data is from smartphones, may have a domain gap with datasets collected with instrumented vehicles. We hope self-driving companies can release work zone datasets to address this issue. ROADWork dataset does not contain all possible traversable paths a vehicle could have taken. We speculate either simulated that data or alternative manual navigational instructions can help bridge this limitation. In our proposed problems and baselines, we did not investigate challenges with 3D perception and interpretation in work zones, where many such challenges are present. We plan to attempt to tackle these limitations in future work.
6 Conclusion
We presented ROADWork dataset to address scene understanding and navigation in a neglected long tailed self-driving scenario – work zones. We defined important problems concerning work zone situations, showed that pre-trained foundation models perform poorly, and presented baselines to significantly improve object recognition, observing fine-grained scene elements, analyzing scene globally and predicting drivable goals and pathways. We hope our work spurs further investigation in this interesting yet under-explored area of self-driving perception.
Acknowledgements. This work was supported by a research contract from General Motors Research-Israel, NSF Grant CNS-2038612, a US DOT grant 69A3551747111 through the Mobility21 UTC and grants 69A3552344811 and 69A3552348316 through the Safety21 UTC. We thank N. Dinesh Reddy, Khiem Vuong, Shefali Srivastava, Neha Boloor, Tiffany Ma for insightful discussions.
Dataset License. ROADWork dataset images collected by us and all the annotations are licensed under the Open Data Commons Attribution License v1.0.
References
- [1] Google DeepMind AlphaCode Team. Alphacode 2 technical report. https://storage.googleapis.com/deepmind-media/AlphaCode2/AlphaCode2_Tech_Report.pdf, 2023.
- [2] Peter Anderson, Basura Fernando, Mark Johnson, and Stephen Gould. Spice: Semantic propositional image caption evaluation. In ECCV, 2016.
- [3] Satanjeev Banerjee and Alon Lavie. Meteor: An automatic metric for mt evaluation with improved correlation with human judgments. In ACL Workshop on intrinsic and extrinsic evaluation measures for machine translation and/or summarization, 2005.
- [4] Mario Bijelic, Tobias Gruber, Fahim Mannan, Florian Kraus, Werner Ritter, Klaus Dietmayer, and Felix Heide. Seeing through fog without seeing fog: Deep multimodal sensor fusion in unseen adverse weather. In CVPR, 2020.
- [5] Keenan Burnett, David J Yoon, Yuchen Wu, Andrew Z Li, Haowei Zhang, Shichen Lu, Jingxing Qian, Wei-Kang Tseng, Andrew Lambert, Keith YK Leung, et al. Boreas: A multi-season autonomous driving dataset. IJRR, 2023.
- [6] Holger Caesar, Varun Bankiti, Alex H Lang, Sourabh Vora, Venice Erin Liong, Qiang Xu, Anush Krishnan, Yu Pan, Giancarlo Baldan, and Oscar Beijbom. nuscenes: A multimodal dataset for autonomous driving. In CVPR, 2020.
- [7] Ming-Fang Chang, John Lambert, Patsorn Sangkloy, Jagjeet Singh, Slawomir Bak, Andrew Hartnett, De Wang, Peter Carr, Simon Lucey, Deva Ramanan, et al. Argoverse: 3d tracking and forecasting with rich maps. In CVPR, 2019.
- [8] Kai Chen, Jiaqi Wang, Jiangmiao Pang, Yuhang Cao, Yu Xiong, Xiaoxiao Li, Shuyang Sun, Wansen Feng, Ziwei Liu, Jiarui Xu, Zheng Zhang, Dazhi Cheng, Chenchen Zhu, Tianheng Cheng, Qijie Zhao, Buyu Li, Xin Lu, Rui Zhu, Yue Wu, Jifeng Dai, Jingdong Wang, Jianping Shi, Wanli Ouyang, Chen Change Loy, and Dahua Lin. MMDetection: Open mmlab detection toolbox and benchmark. arXiv preprint arXiv:1906.07155, 2019.
- [9] Bowen Cheng, Ishan Misra, Alexander G Schwing, Alexander Kirillov, and Rohit Girdhar. Masked-attention mask transformer for universal image segmentation. In CVPR, 2022.
- [10] Bowen Cheng, Omkar Parkhi, and Alexander Kirillov. Pointly-supervised instance segmentation. In CVPR, 2022.
- [11] Ting-Wu Chin, Ruizhou Ding, and Diana Marculescu. Adascale: Towards real-time video object detection using adaptive scaling. MLSys, 2019.
- [12] Chee Kheng Chng, Yuliang Liu, Yipeng Sun, Chun Chet Ng, Canjie Luo, Zihan Ni, ChuanMing Fang, Shuaitao Zhang, Junyu Han, Errui Ding, et al. Icdar2019 robust reading challenge on arbitrary-shaped text-rrc-art. In ICDAR, 2019.
- [13] Laurene Claussmann, Marc Revilloud, Dominique Gruyer, and Sébastien Glaser. A review of motion planning for highway autonomous driving. T-ITS, 2019.
- [14] Marius Cordts, Mohamed Omran, Sebastian Ramos, Timo Rehfeld, Markus Enzweiler, Rodrigo Benenson, Uwe Franke, Stefan Roth, and Bernt Schiele. The cityscapes dataset for semantic urban scene understanding. In CVPR, 2016.
- [15] Daniel Dauner, Marcel Hallgarten, Andreas Geiger, and Kashyap Chitta. Parting with misconceptions about learning-based vehicle motion planning. In CoRL, 2023.
- [16] Vinayak Dixit, Sai Chand, and Divya Nair. Autonomous vehicles: Disengagements, accidents and reaction times. PLOS ONE, 2016.
- [17] Scott Ettinger, Shuyang Cheng, Benjamin Caine, Chenxi Liu, Hang Zhao, Sabeek Pradhan, Yuning Chai, Ben Sapp, Charles R. Qi, Yin Zhou, Zoey Yang, Aur’elien Chouard, Pei Sun, Jiquan Ngiam, Vijay Vasudevan, Alexander McCauley, Jonathon Shlens, and Dragomir Anguelov. Large scale interactive motion forecasting for autonomous driving: The waymo open motion dataset. In ICCV, 2021.
- [18] Dave Ferguson, Thomas M Howard, and Maxim Likhachev. Motion planning in urban environments. Journal of Field Robotics, 2008.
- [19] David I Ferguson and Donald Jason Burnette. Mapping active and inactive construction zones for autonomous driving, 2015. US Patent 9,141,107.
- [20] David Ian Ferguson, Dirk Haehnel, and Ian Mahon. Construction zone object detection using light detection and ranging, 2015. US Patent 9,199,641.
- [21] Andreas Geiger, Philip Lenz, and Raquel Urtasun. Are we ready for autonomous driving? the kitti vision benchmark suite. In CVPR, 2012.
- [22] Golnaz Ghiasi, Yin Cui, Aravind Srinivas, Rui Qian, Tsung-Yi Lin, Ekin D Cubuk, Quoc V Le, and Barret Zoph. Simple copy-paste is a strong data augmentation method for instance segmentation. In CVPR, 2021.
- [23] Anurag Ghosh, Vaibhav Balloli, Akshay Nambi, Aditya Singh, and Tanuja Ganu. Chanakya: Learning runtime decisions for adaptive real-time perception. NeurIPS, 2023.
- [24] Anurag Ghosh, N Dinesh Reddy, Christoph Mertz, and Srinivasa G Narasimhan. Learned two-plane perspective prior based image resampling for efficient object detection. In CVPR, 2023.
- [25] Regine Graf, Andreas Wimmer, and Klaus CJ Dietmayer. Probabilistic estimation of temporary lanes at road work zones. In ITSC, 2012.
- [26] Thomas Gumpp, Dennis Nienhuser, Rebecca Liebig, and J Marius Zollner. Recognition and tracking of temporary lanes in motorway construction sites. In Intelligent Vehicles Symposium, 2009.
- [27] Agrim Gupta, Justin Johnson, Li Fei-Fei, Silvio Savarese, and Alexandre Alahi. Social gan: Socially acceptable trajectories with generative adversarial networks. In CVPR, 2018.
- [28] Kaiming He, Georgia Gkioxari, Piotr Dollár, and Ross Girshick. Mask r-cnn. In ICCV, 2017.
- [29] Derek Hoiem, Alexei A Efros, and Martial Hebert. Putting objects in perspective. IJCV, 2008.
- [30] Lukas Hoyer, Dengxin Dai, and Luc Van Gool. Daformer: Improving network architectures and training strategies for domain-adaptive semantic segmentation. In CVPR, 2022.
- [31] Edward J Hu, Phillip Wallis, Zeyuan Allen-Zhu, Yuanzhi Li, Shean Wang, Lu Wang, Weizhu Chen, et al. Lora: Low-rank adaptation of large language models. In ICLR, 2022.
- [32] Yihan Hu, Jiazhi Yang, Li Chen, Keyu Li, Chonghao Sima, Xizhou Zhu, Siqi Chai, Senyao Du, Tianwei Lin, Wenhai Wang, Lewei Lu, Xiaosong Jia, Qiang Liu, Jifeng Dai, Yu Qiao, and Hongyang Li. Planning-oriented autonomous driving. In CVPR, 2023.
- [33] Michelin Mobility Intelligence. Roadbotics open data set. https://www.roadbotics.com/2021/03/15/roadbotics-open-data-set/, 2021.
- [34] Tarun Kalluri, Wangdong Xu, and Manmohan Chandraker. Geonet: Benchmarking unsupervised adaptation across geographies. In CVPR, 2023.
- [35] Mikhail Kennerley, Jian-Gang Wang, Bharadwaj Veeravalli, and Robby T Tan. 2pcnet: Two-phase consistency training for day-to-night unsupervised domain adaptive object detection. In CVPR, 2023.
- [36] Jinkyu Kim, Anna Rohrbach, Trevor Darrell, John Canny, and Zeynep Akata. Textual explanations for self-driving vehicles. In ECCV, 2018.
- [37] Alexander Kirillov, Eric Mintun, Nikhila Ravi, Hanzi Mao, Chloe Rolland, Laura Gustafson, Tete Xiao, Spencer Whitehead, Alexander C. Berg, Wan-Yen Lo, Piotr Dollár, and Ross Girshick. Segment anything. arXiv:2304.02643, 2023.
- [38] Michael Levenson. Driverless car gets stuck in wet concrete in san francisco. https://www.nytimes.com/2023/08/17/us/driverless-car-accident-sf.html, 2023.
- [39] Patrick Lewis, Ethan Perez, Aleksandra Piktus, Fabio Petroni, Vladimir Karpukhin, Naman Goyal, Heinrich Küttler, Mike Lewis, Wen-tau Yih, Tim Rocktäschel, et al. Retrieval-augmented generation for knowledge-intensive nlp tasks. NeurIPS, 2020.
- [40] Boyi Li, Yue Wang, Jiageng Mao, Boris Ivanovic, Sushant Veer, Karen Leung, and Marco Pavone. Driving everywhere with large language model policy adaptation. arXiv preprint arXiv:2402.05932, 2024.
- [41] Boyi Li, Yue Wang, Jiageng Mao, Boris Ivanovic, Sushant Veer, Karen Leung, and Marco Pavone. Driving everywhere with large language model policy adaptation. In CVPR, 2024.
- [42] Junnan Li, Dongxu Li, Caiming Xiong, and Steven Hoi. Blip: Bootstrapping language-image pre-training for unified vision-language understanding and generation. In ICML, 2022.
- [43] Junwei Liang, Lu Jiang, Kevin Murphy, Ting Yu, and Alexander Hauptmann. The garden of forking paths: Towards multi-future trajectory prediction. In CVPR, 2020.
- [44] Chin-Yew Lin. Rouge: A package for automatic evaluation of summaries. In ACL Workshop: Text summarization branches out, 2004.
- [45] Tsung-Yi Lin, Michael Maire, Serge Belongie, James Hays, Pietro Perona, Deva Ramanan, Piotr Dollár, and C Lawrence Zitnick. Microsoft coco: Common objects in context. In ECCV, 2014.
- [46] Haotian Liu, Chunyuan Li, Qingyang Wu, and Yong Jae Lee. Visual instruction tuning. In NeurIPS, 2023.
- [47] David V Lu, Dave Hershberger, and William D Smart. Layered costmaps for context-sensitive navigation. In IROS, 2014.
- [48] Karttikeya Mangalam, Yang An, Harshayu Girase, and Jitendra Malik. From goals, waypoints & paths to long term human trajectory forecasting. In ICCV, 2021.
- [49] Jiageng Mao, Yuxi Qian, Hang Zhao, and Yue Wang. Gpt-driver: Learning to drive with gpt. arXiv preprint arXiv:2310.01415, 2023.
- [50] Aarian Marshall. An autonomous car blocked a fire truck responding to an emergency. https://www.wired.com/story/cruise-fire-truck-block-san-francisco-autonomous-vehicles/, 2022.
- [51] Marshall, Aarian. Why Self-Driving Cars ‘Can’t Even’ With Construction Zones, Visited on March 1, 2024.
- [52] Bonolo Mathibela, Michael A Osborne, Ingmar Posner, and Paul Newman. Can priors be trusted? learning to anticipate roadworks. In ITSC, 2012.
- [53] Bonolo Mathibela, Ingmar Posner, and Paul Newman. A roadwork scene signature based on the opponent colour model. In IROS, 2013.
- [54] Matt McFarland. Traffic cones confused a waymo self-driving car. then things got worse. https://www.cnn.com/2021/05/17/tech/waymo-arizona-confused/, 2021.
- [55] Matthew McNaughton, Chris Urmson, John M Dolan, and Jin-Woo Lee. Motion planning for autonomous driving with a conformal spatiotemporal lattice. In ICRA, 2011.
- [56] J.F. Morgan, A.R. Duley, and P.A. Hancock. Driver responses to differing urban work zone configurations. Accident Analysis & Prevention, 2010.
- [57] Power Nation TV. Robotaxi causes traffic jam after attempting to drive through construction site; elon musk responds. https://www.powernationtv.com/post/robotaxi-traffic-elon-musk-responds, 2023.
- [58] National Safety Council Injury Facts. Motor Vehicle Safety Issues, Visited on March 1, 2024.
- [59] United Nations. The world’s cities in 2018. https://www.un.org/en/development/desa/population/publications/pdf/urbanization/the_worlds_cities_in_2018_data_booklet.pdf, 2018.
- [60] Gerhard Neuhold, Tobias Ollmann, Samuel Rota Bulo, and Peter Kontschieder. The mapillary vistas dataset for semantic understanding of street scenes. In ICCV, 2017.
- [61] David Pannen, Martin Liebner, Wolfgang Hempel, and Wolfram Burgard. How to keep hd maps for automated driving up to date. In ICRA, 2020.
- [62] Kishore Papineni, Salim Roukos, Todd Ward, and Wei-Jing Zhu. Bleu: a method for automatic evaluation of machine translation. In ACL, 2002.
- [63] Alec Radford, Jong Wook Kim, Chris Hallacy, Aditya Ramesh, Gabriel Goh, Sandhini Agarwal, Girish Sastry, Amanda Askell, Pamela Mishkin, Jack Clark, et al. Learning transferable visual models from natural language supervision. In ICML, 2021.
- [64] Katrin Renz, Kashyap Chitta, Otniel-Bogdan Mercea, A Koepke, Zeynep Akata, and Andreas Geiger. Plant: Explainable planning transformers via object-level representations. CoRL, 2022.
- [65] Roi Ronen, Shahar Tsiper, Oron Anschel, Inbal Lavi, Amir Markovitz, and R Manmatha. Glass: Global to local attention for scene-text spotting. In ECCV, 2022.
- [66] Christos Sakaridis, Dengxin Dai, and Luc Van Gool. Guided curriculum model adaptation and uncertainty-aware evaluation for semantic nighttime image segmentation. In ICCV, 2019.
- [67] Christos Sakaridis, Dengxin Dai, and Luc Van Gool. Acdc: The adverse conditions dataset with correspondences for semantic driving scene understanding. In ICCV, 2021.
- [68] Tim Salzmann, Boris Ivanovic, Punarjay Chakravarty, and Marco Pavone. Trajectron++: Dynamically-feasible trajectory forecasting with heterogeneous data. In ECCV, 2020.
- [69] Ayush Sarkar, Hanlin Mai, Amitabh Mahapatra, Svetlana Lazebnik, David A Forsyth, and Anand Bhattad. Shadows don’t lie and lines can’t bend! generative models don’t know projective geometry… for now. arXiv preprint arXiv:2311.17138, 2023.
- [70] Johannes Lutz Schönberger and Jan-Michael Frahm. Structure-from-motion revisited. In CVPR, 2016.
- [71] Weijing Shi and Ragunathan Raj Rajkumar. Work zone detection for autonomous vehicles. In ITSC, 2021.
- [72] Amanpreet Singh, Guan Pang, Mandy Toh, Jing Huang, Wojciech Galuba, and Tal Hassner. Textocr: Towards large-scale end-to-end reasoning for arbitrary-shaped scene text. In CVPR, 2021.
- [73] Li Su, Howard Bowman, and Philip Barnard. Glancing and then looking: on the role of body, affect, and meaning in cognitive control. Frontiers in psychology, 2011.
- [74] Pei Sun, Henrik Kretzschmar, Xerxes Dotiwalla, Aurelien Chouard, Vijaysai Patnaik, Paul Tsui, James Guo, Yin Zhou, Yuning Chai, Benjamin Caine, Vijay Vasudevan, Wei Han, Jiquan Ngiam, Hang Zhao, Aleksei Timofeev, Scott Ettinger, Maxim Krivokon, Amy Gao, Aditya Joshi, Yu Zhang, Jonathon Shlens, Zhifeng Chen, and Dragomir Anguelov. Scalability in perception for autonomous driving: Waymo open dataset. In CVPR, 2020.
- [75] Siyu Teng, Xuemin Hu, Peng Deng, Bai Li, Yuchen Li, Yunfeng Ai, Dongsheng Yang, Lingxi Li, Zhe Xuanyuan, Fenghua Zhu, et al. Motion planning for autonomous driving: The state of the art and future perspectives. T-IV, 2023.
- [76] Diwas Thapa, Sabyasachee Mishra, Asad Khattak, and Muhammad Adeel. Assessing driver behavior in work zones: A discretized duration approach to predict speeding. Accident Analysis & Prevention, 2024.
- [77] Chittesh Thavamani, Mengtian Li, Nicolas Cebron, and Deva Ramanan. Fovea: Foveated image magnification for autonomous navigation. In ICCV, 2021.
- [78] Chittesh Thavamani, Mengtian Li, Francesco Ferroni, and Deva Ramanan. Learning to zoom and unzoom. In CVPR, 2023.
- [79] Xiaoyu Tian, Junru Gu, Bailin Li, Yicheng Liu, Chenxu Hu, Yang Wang, Kun Zhan, Peng Jia, Xianpeng Lang, and Hang Zhao. Drivevlm: The convergence of autonomous driving and large vision-language models. arXiv preprint arXiv:2402.12289, 2024.
- [80] U.S. Department of Transportation, National Highway Traffic Safety Administration. FARS Data: People Killed in Construction or Maintenance Zones, Visited on March 1, 2024.
- [81] Girish Varma, Anbumani Subramanian, Anoop Namboodiri, Manmohan Chandraker, and CV Jawahar. Idd: A dataset for exploring problems of autonomous navigation in unconstrained environments. In WACV, 2019.
- [82] Ramakrishna Vedantam, C Lawrence Zitnick, and Devi Parikh. Cider: Consensus-based image description evaluation. In CVPR, 2015.
- [83] Maheswari Visvalingam and James D Whyatt. Line generalization by repeated elimination of points. In Landmarks in Mapping. 2017.
- [84] Matt Vitelli, Yan Chang, Yawei Ye, Ana Ferreira, Maciej Wołczyk, Błażej Osiński, Moritz Niendorf, Hugo Grimmett, Qiangui Huang, Ashesh Jain, et al. Safetynet: Safe planning for real-world self-driving vehicles using machine-learned policies. In ICRA, 2022.
- [85] Jun Wang, Warren E. Hughes, Forrest M. Council, and Jeffrey F. Paniati. Investigation of highway work zone crashes: What we know and what we don’t know. Transportation Research Record, 1996.
- [86] Tsun-Hsuan Wang, Alaa Maalouf, Wei Xiao, Yutong Ban, Alexander Amini, Guy Rosman, Sertac Karaman, and Daniela Rus. Drive anywhere: Generalizable end-to-end autonomous driving with multi-modal foundation models. arXiv preprint arXiv:2310.17642, 2023.
- [87] Yan Wang, Xiangyu Chen, Yurong You, Li Erran Li, Bharath Hariharan, Mark Campbell, Kilian Q Weinberger, and Wei-Lun Chao. Train in germany, test in the usa: Making 3d object detectors generalize. In CVPR, 2020.
- [88] Benjamin Wilson, William Qi, Tanmay Agarwal, John Lambert, Jagjeet Singh, Siddhesh Khandelwal, Bowen Pan, Ratnesh Kumar, Andrew Hartnett, Jhony Kaesemodel Pontes, et al. Argoverse 2: Next generation datasets for self-driving perception and forecasting. arXiv preprint arXiv:2301.00493, 2023.
- [89] Andreas Wimmer, Thorsten Weiss, Francesco Flogel, and Klaus Dietmayer. Automatic detection and classification of safety barriers in road construction sites using a laser scanner. In Intelligent Vehicles Symposium, 2009.
- [90] Jiarui Xu, Sifei Liu, Arash Vahdat, Wonmin Byeon, Xiaolong Wang, and Shalini De Mello. Open-vocabulary panoptic segmentation with text-to-image diffusion models. In CVPR, 2023.
- [91] Yiran Xu, Xiaoyin Yang, Lihang Gong, Hsuan-Chu Lin, Tz-Ying Wu, Yunsheng Li, and Nuno Vasconcelos. Explainable object-induced action decision for autonomous vehicles. In CVPR, 2020.
- [92] Fisher Yu, Haofeng Chen, Xin Wang, Wenqi Xian, Yingying Chen, Fangchen Liu, Vashisht Madhavan, and Trevor Darrell. Bdd100k: A diverse driving dataset for heterogeneous multitask learning. In CVPR, 2020.
- [93] Matei Zaharia, Omar Khattab, Lingjiao Chen, Jared Quincy Davis, Heather Miller, Chris Potts, James Zou, Michael Carbin, Jonathan Frankle, Naveen Rao, and Ali Ghodsi. The shift from models to compound ai systems. https://bair.berkeley.edu/blog/2024/02/18/compound-ai-systems/, 2024.
- [94] Hao Zhang, Feng Li, Xueyan Zou, Shilong Liu, Chunyuan Li, Jianwei Yang, and Lei Zhang. A simple framework for open-vocabulary segmentation and detection. In ICCV, 2023.
- [95] Shen Zheng, Anurag Ghosh, and Srinivasa G Narasimhan. Addressing source scale bias via image warping for domain adaptation. arXiv preprint arXiv:2403.12712, 2024.
- [96] Xingyi Zhou, Rohit Girdhar, Armand Joulin, Philipp Krähenbühl, and Ishan Misra. Detecting twenty-thousand classes using image-level supervision. In ECCV, 2022.
- [97] Julie Zigoris. Driverless waymo car almost digs itself into hole—literally. https://sfstandard.com/2023/01/15/driverless-waymo-car-digs-itself-into-hole-literally/, 2023.
- [98] David Zipper. San francisco has a problem with robotaxis. https://www.theatlantic.com/ideas/archive/2023/08/robotaxis-san-francisco-self-driving-car/674956/, 2023.
| Method | Overall | Low Curvature | Medium Curvature | High Curvature | ||||
| ADE | FDE | ADE | FDE | ADE | FDE | ADE | FDE | |
| YNet [48] w/ Pretrained Segm. [14] | 31.28 | 102.7 | 28.28 | 95.92 | 29.84 | 102.39 | 40.76 | 113.38 |
| YNet [48] w/ ROADWork Segm. | 22.68 | 80.78 | 22.41 | 75.33 | 21.82 | 83.28 | 30.21 | 84.58 |
Appendix A Implementation Details
Detecting Work Zone Objects. We employ the pre-trained open vocabulary models [90, 96] as is and follow their custom vocabulary protocol. For training Mask R-CNN [28], we use the mmdetection [8] library initialized with COCO [45] weights. We use the default model zoo parameters with the 1x schedule. We employ the simple copy-paste implementation from mmdetection [8] and use the default parameters.
Adapting to New Geographies We follow the same pre-train and adaptation protocol described in 2PCNet [35].
Generating Work Zone Descriptions. We employ rank and alpha while performing LORA finetuning on LLaVA-7B [46] for 4 epochs. We keep rest of the parameters as is, following LLaVA’s training schedule.
Appendix B Additional Results
Pathway Prediction Results with Pixel Level metrics. [48] presents results on pixel level metrics like Average Displacement Error (ADE) and Final Displacement Error (FDE), we also report those metrics. However, we believe measures model performance more fairly in autonomous driving situations. Table 9 shows goal and pathway results, Final Displacement Error (FDE) is the pixel error between the predicted goal and the actual goal while Average Displacement Error (ADE) is the error between predicted pathway and actual pathway. We observe that ROADWork improves both FDE (-21.3%) and ADE (-27.5%). We also bin the pathways in terms of curvature, and observe that paths with higher curvature are difficult to predict, however, model trained on ROADWork dataset improves FDE (-25.4%) and ADE (-25.9%) in those cases.
Appendix C ROADWork Dataset: More Details
We describe all the categories we annotated in Table C. We alse present the distribution of each class that we annotated divided across all cities in Table 11.
| Object Name | Description | Examples |
|---|---|---|
| Cone | A cone shaped marker. Usually orange in color, but may be yellow, lime green, blue, red, pink or white. One or more white or retro-reflective collars around the top. May have four flat sides instead of a cone shape. |
![[Uncaptioned image]](/html/2406.07661/assets/figs/objects/traffic_cones.png)
|
| Vertical Panel | Rectangular shaped marker. Orange or white with alternating orange and white retro-reflective stripes sloping at an angle. May have text over downward sloping stripes or text and graphics instead of downward sloping stripes. May have light on top. |
![[Uncaptioned image]](/html/2406.07661/assets/figs/objects/vertical_panels.png)
|
| Tubular Marker | Long and round tube shaped markers. Predominately orange in color. Typically white or green when used for protected bike lanes. Top may have white or retro-reflective bands on top. Top may become flattened or a loop. |
![[Uncaptioned image]](/html/2406.07661/assets/figs/objects/tubular_markers.png)
|
| Work Vehicle | Heavy duty and light duty vehicles that are driven and operated in order to perform roadwork related functions. Also includes traffic control vehicles and passengers vehicles that may be modified for use on the road and in work zones. |
![[Uncaptioned image]](/html/2406.07661/assets/figs/objects/work_vehicles.png)
|
| TTC Sign | Placed temporarily in and around work zones to increase motorist and pedestrian awareness and provide information about work zones. Usually orange, but can also be white or yellow. |
![[Uncaptioned image]](/html/2406.07661/assets/figs/objects/ttc_signs.png)
|
| Drum | Bright orange cylindrical object with horizontal retro-reflective orange and white stripes around the circumference. May have a warning light or a temporary traffic control sign mounted on top. |
![[Uncaptioned image]](/html/2406.07661/assets/figs/objects/drums.png)
|
| Table continued on following page. |
| Object Name | Description | Examples |
|---|---|---|
| Barricade | Marker often used to indicate road or sidewalk closer or used as a channeling device. Consists of one to three horizontal boards with alternating orange and white retro-reflective stripes sloping at an angle. Single board barricades, commonly referred to as saw horse or roadblock horse, are often painted in a single color when used by local municipalities and police departments. May have a mounted warning light and/or temporary traffic control sign. |
![[Uncaptioned image]](/html/2406.07661/assets/figs/objects/barricades2.png)
|
| Barrier | Longitudinal channeling device used as a temporary traffic control device for merging traffic, closing roads, and to provide guidance and warning. Also used to protect workers in a work zone. Made of concrete, plastic, or metal. May be solid (e.g., concrete barriers on highway median) or have open vertical space. |
![[Uncaptioned image]](/html/2406.07661/assets/figs/objects/barriers2.png)
|
| Worker | People that performing duties related to their job in the road environment. Workers may be within a confined roadwork zone or in the area outside of a work zone. Workers may be operating or inside of a vehicle. Usually identifiable by a high visibility vest and hard hat. |
![[Uncaptioned image]](/html/2406.07661/assets/figs/objects/road_workers.png)
|
| Fence | Temporary structure used around a work zone. Usually a temporary chain link fence or safety fence (usually orange). Chain link fence may have privacy screen and mounted on top of a barrier. |
![[Uncaptioned image]](/html/2406.07661/assets/figs/objects/fences.png)
|
| Work Equipment | Broadly encapsulates equipment (not including work vehicles) commonly found in roadwork zones. Includes manual and power equipment whether. May be actively in use by worker. |
![[Uncaptioned image]](/html/2406.07661/assets/figs/objects/work_equipment.png)
|
| Table continued on following page. |
| Object Name | Description | Examples |
|---|---|---|
| Arrow Board | Digital sign with a matrix of elements capable of displaying static, sequential, or flashing arrows used for providing warning and directional information to assist with merging and directing road users through or around roadwork zone. Usually on a dedicated trailer or may be mounted on a vehicle. |
|
| TTC Message Board | Digital sign with the flexibility of displaying static, sequential, or flashing messages and symbols. Primarily used to advise road users of unexpected situations, displaying real-time information, and providing information to assist in decision making. Usually on a dedicated trailer or may be mounted on a vehicle. |
![[Uncaptioned image]](/html/2406.07661/assets/figs/objects/ttc_message_board.png)
|
| Police Vehicle | A vehicle used by police and law enforcement to respond to service calls. Usually a sedan, sports utility vehicle, or pick-up truck fitted with a light bar. Paint color and markings vary between states and municipalities. |
|
| Police Officer | Uniformed officers are often in the area of work zones to help manage traffic around work sites. May be wearing high visibility vest or safety sash belt. |
![[Uncaptioned image]](/html/2406.07661/assets/figs/objects/police_officers.png)
|
| Bike Lane | Other Roadwork Objects | Police Officer | Police Vehicle | TTC Message Board | Arrow Board | Work Equipment | Fence | Worker | Total | |
| Boston, MA | 16 | 27 | 27 | 21 | 18 | 15 | 108 | 268 | 263 | 763 |
| Charlotte, NC | 0 | 0 | 9 | 12 | 10 | 11 | 29 | 113 | 210 | 394 |
| Chicago, IL | 0 | 0 | 3 | 3 | 12 | 26 | 16 | 22 | 106 | 188 |
| Columbus, OH | 0 | 0 | 3 | 6 | 5 | 15 | 19 | 77 | 79 | 204 |
| Denver, CO | 40 | 13 | 5 | 3 | 9 | 105 | 29 | 223 | 157 | 584 |
| Detroit, MI | 0 | 0 | 1 | 2 | 9 | 95 | 38 | 381 | 113 | 639 |
| Houston, TX | 0 | 0 | 0 | 3 | 11 | 23 | 12 | 38 | 63 | 150 |
| Indianapolis, IN | 0 | 0 | 0 | 6 | 7 | 16 | 37 | 64 | 57 | 187 |
| Jacksonville, FL | 0 | 0 | 0 | 1 | 0 | 3 | 6 | 10 | 36 | 56 |
| Los Angeles, CA | 0 | 0 | 6 | 8 | 19 | 96 | 26 | 203 | 433 | 791 |
| Minneapolis, MN | 0 | 0 | 2 | 2 | 2 | 0 | 20 | 69 | 38 | 133 |
| New York City, NY | 0 | 0 | 7 | 3 | 1 | 6 | 116 | 59 | 126 | 318 |
| Philadelphia, PA | 0 | 0 | 3 | 12 | 4 | 12 | 38 | 117 | 155 | 341 |
| Phoenix, AZ | 0 | 0 | 1 | 0 | 0 | 6 | 10 | 39 | 57 | 113 |
| Pittsburgh, PA | 0 | 14 | 3 | 0 | 29 | 75 | 59 | 392 | 458 | 1030 |
| Pittsburgh, PA (Ours) | 40 | 49 | 22 | 22 | 83 | 220 | 308 | 707 | 930 | 2381 |
| San Antonio, TX | 2 | 3 | 42 | 24 | 7 | 10 | 7 | 174 | 350 | 619 |
| San Francisco, CA | 0 | 0 | 3 | 2 | 6 | 39 | 23 | 79 | 251 | 403 |
| Washington, DC | 0 | 0 | 6 | 20 | 34 | 58 | 72 | 136 | 178 | 504 |
| Total | 98 | 106 | 143 | 150 | 266 | 831 | 973 | 3171 | 4060 | 9798 |
| Barrier | Barricade | Drum | TTC Sign | Work Vehicle | Tubular Marker | Vertical Panel | Cone | Total | |
| Boston, MA | 568 | 169 | 594 | 225 | 845 | 3591 | 13 | 1565 | 7570 |
| Charlotte, NC | 98 | 117 | 448 | 155 | 334 | 714 | 0 | 757 | 2623 |
| Chicago, IL | 35 | 178 | 194 | 44 | 172 | 40 | 0 | 386 | 1049 |
| Columbus, OH | 65 | 106 | 430 | 193 | 131 | 256 | 68 | 314 | 1563 |
| Denver, CO | 149 | 186 | 183 | 429 | 355 | 487 | 1004 | 1663 | 4456 |
| Detroit, MI | 317 | 227 | 1042 | 206 | 564 | 304 | 1 | 231 | 2892 |
| Houston, TX | 78 | 95 | 598 | 169 | 126 | 57 | 19 | 111 | 1253 |
| Indianapolis, IN | 58 | 19 | 194 | 52 | 120 | 43 | 1 | 344 | 831 |
| Jacksonville, FL | 10 | 29 | 15 | 31 | 57 | 3 | 0 | 175 | 320 |
| Los Angeles, CA | 237 | 768 | 23 | 703 | 864 | 128 | 11 | 584 | 3318 |
| Minneapolis, MN | 118 | 214 | 364 | 248 | 108 | 409 | 1 | 195 | 1657 |
| New York City, NY | 119 | 60 | 115 | 71 | 190 | 49 | 10 | 448 | 1062 |
| Philadelphia, PA | 184 | 136 | 396 | 187 | 299 | 21 | 0 | 695 | 1918 |
| Phoenix, AZ | 48 | 75 | 0 | 95 | 58 | 3 | 245 | 81 | 605 |
| Pittsburgh, PA | 341 | 550 | 42 | 540 | 703 | 675 | 2224 | 2420 | 7495 |
| Pittsburgh, PA (Ours) | 1214 | 1857 | 471 | 4071 | 2265 | 1328 | 6906 | 6332 | 24444 |
| San Antonio, TX | 77 | 224 | 915 | 485 | 400 | 491 | 218 | 1202 | 4012 |
| San Francisco, CA | 171 | 133 | 2 | 124 | 419 | 211 | 0 | 1326 | 2386 |
| Washington, DC | 250 | 24 | 606 | 214 | 248 | 49 | 4 | 1432 | 2827 |
| Total | 4137 | 5167 | 6632 | 8242 | 8258 | 8859 | 10725 | 20261 | 72281 |