Capacity Credit Evaluation of Generalized Energy
Storage Considering Endogenous Uncertainty
Abstract
Generalized energy storage (GES), encompassing both physical and virtual energy storage, can provide remarkable but uncertain adequacy flexibility. When assessing GES’s contribution to resource adequacy, the literature typically considers exogenous uncertainties (e.g., failures and stochastic response) but overlooks endogenous uncertainties, such as self-scheduling in liberal markets and decision-dependent uncertainty (DDU). In this regard, this paper proposes a novel capacity credit evaluation framework to accurately quantify GES’s contribution to resource adequacy, where a sequential coordinated dispatch method is proposed to capture realistic GES operations by coordinating self-scheduling in the day-ahead energy market and real-time adequacy-oriented dispatch in the capacity market. To incorporate DDU of GES (i.e., responsiveness affected by dispatch decisions and prices in capacity market), we present a chance-constrained optimization approach and tractable solution methodologies for real-time dispatch. We propose a practical adequacy assessment method to quantify the impact of DDU on capacity credit by evaluating the consequence of ignoring DDU. Additionally, a novel capacity credit index called equivalent storage capacity substitution is introduced to quantify the equivalent deterministic storage capacity of the uncertain virtual energy storage. Simulations show that the proposed method yields reliable and accurate capacity credit values by accounting for self-scheduling of GES and managing the risk from DDU. Finally, key impact factors of GES’s capacity credit are thoroughly discussed, offering valuable insights for the decision-making of capacity market operators.
Index Terms:
Capacity credit, generalized energy storage, self-scheduling, decision-dependent uncertainty, capacity marketI Introduction
As an emerging concept, generalized energy storage (GES) involves both physical energy storage (ES) and virtual energy storage (VES) offered by demand response (DR) [1]. GES can represent an individual unit or a portfolio of heterogeneous units uniformly, which simplifies the integration and coordination of massive and fragmented flexible resources. With the increasing adoption of GES [2], accurately assessing GES’s contribution to resource adequacy turns out to be significant. One such assessment method is capacity credit (CC) evaluation, which quantifies the ability of incremental resources (e.g., renewable energy sources (RES) and GES) to displace conventional generators without reducing system reliability [3, 4, 5]. However, the inaccuracy in the existing CC evaluation approaches has resulted in over 15% response unavailability of GES during the peak events in CAISO [6], contributing to substantial cost on real-time reserve and load curtailment. Hence, it is crucial for the system operator to develop a more accurate CC evaluation approach for GES.
Existing CC evaluation approaches for GES only consider decision-independent uncertainty (DIU), such as failures and exogenous stochastic response [7, 8]. Nevertheless, the availability of GES is practically affected by capacity degradation [9], responsiveness [1], etc. These uncertainties depend on dispatch decisions and market prices and are denoted as decision-dependent uncertainty (DDU), which are unknown before dispatch simulation in the CC evaluation. Moreover, the CC of GES is remarkably impacted by the dispatch method to simulate GES operations. In practice, GES prefers profit maximization across multiple service provisions when participating in markets. Therefore, the widely deployed adequacy-oriented dispatch in current CC evaluations may not accurately capture the realistic GES operating characteristic [10]. This necessitates a more reasonable dispatch model that balances the resource adequacy contribution and the profit of GES.
This paper presents a novel CC evaluation framework for GES, which concurrently incorporates the self-scheduling of GES and risk management of DDU. Specially, the main contributions are threefold:
(i) Availability modeling of GES: A novel availability model of GES is established for CC evaluation, which accounts for two types of DIUs in operational states and baseline consumption, as well as one type of DDU in responsiveness. Compared with the existing deterministic [5] or stochastic models with DIU [7, 8], the proposed model better captures the decision-dependent characteristics in the availability of GES, such as response unavailability and capacity degradation.
(ii) Dispatch method for CC evaluation of GES: A sequential coordinated dispatch method is proposed to accurately simulate profitable strategic operations of GES in the CC evaluation. Compared with fixed dispatch [5, 11] and optimistic dispatch [10] methods that only address the adequacy-oriented dispatch in the capacity market (CM), the proposed method further accounts for the self-scheduling of GES in the day-ahead (DA) energy market and can better balance the resource adequacy contribution and profit of GES. The proposed method extends the evaluation object from ES in [12] to GES and incorporates chance-constrained optimization to alleviate risk from DDU in the real-time (RT) dispatch, thereby enhancing the accuracy of CC evaluation.
(iii) CC evaluation of GES: We propose a practical adequacy assessment method to quantify the impact of DDU on CC by evaluating the consequence of overlooking DDU. Moreover, a new CC index is introduced to quantify the capability of VES to replace ES. The index is called equivalent storage capacity substitution (ESCS). Additionally, key factors impacting the CC of GES (e.g., SoC withholding, DDU distribution and parameters, etc.) are analyzed with extensive simulations. These findings provide valuable insights into the procurement and dispatch decision-making of the CM operator.
The remainder of the paper is organized as follows. Section II summarizes the previous works on CC evaluation of GES. Section III presents the sequential dispatch method of GES. Section IV presents the improved CC evaluation methodology of GES. Numerical studies and sensitivity analysis are proposed in Section V and VI for illustration. Finally, conclusions are summarized in Section VII.
II Literature Review
II-A Availability Modeling for CC Evaluation of GES
Previous works normally assume 100% capacity availability of GES in the CC evaluation. Nevertheless, the provision of multiple services and diverse GES occupant’s behavior make it impossible to guarantee a 100% available capacity for the CM. Hence, the available capacity of GES is considered to be endogenously stochastic in this paper due to (i) self-scheduling and (ii) DDU. On the one hand, self-scheduling for other service provision will reduce the available capacity of GES, e.g., frequency regulation [13] or satisfy local heating/cooling demands [14]. On the other hand, uncertainties are inevitably involved in the operation of GES due to the human behavior and reliability issues. For instance, failure and capacity degradation should be considered in the ES operations. While uncertainties affected by incentive and discomfort are mostly considered in VES operations, and Markov chain [7] and probabilistic distribution [8] are generally used to depict the operational state and available capacity of VES. However, most of the uncertainties mentioned above are DIUs and can be simulated independently of the dispatch strategy. While, some stochasticity is inherently DDU and generally simplified to be DIU with static and known distributions in the previous work. Recent works have admitted the significance of DDU modeling [15, 16, 17]. Failing to account for such decision-dependence is likely to result in an overestimation of CC [18], thereby impacting capacity market clearing and system adequacy [19].
II-B Dispatch Models for CC Evaluation of GES
Two dispatch methods are considered in the previous works, i.e., fixed dispatch and optimistic dispatch. Fixed dispatch is typically implemented during peak events, and the optimization problem is deterministic or even fixed for each simulation day. For instance, the ES strategy is simulated based on peak shaving optimization [5], which aims to reduce the peak load and expected energy not served (EENS) on the peak days. The adequacy support of VES is evaluated in the same way while using the average responsive load profiles as the negative load inputs [5, 11]. However, the operations of GES under fixed dispatch are determined prior to the system operation simulation, without accounting for state changes in generators and network due to real-time failures. This will result in an underestimated CC values. While, different from the fixed dispatch, optimistic dispatch is proposed in [10] that ES remains fully charged during normal system state and provide adequacy support only when the capacity deficiency occurs. It overlooks the potential for ES to provide other services, resulting in an optimistic utilization of capacity and overestimated CC values. Noticed by the limitation of the existing methods, a recent study proposes a real-time dispatch method to achieve the coordination between the DA price arbitrage and the RT adequacy contribution [12]. However, the inherent uncertainties of GES are overlooked which will lead to significant gap between practical performance and simulated (theoretical) performance.
II-C Existing Capacity Market Regulations for ES and DR
ES and DR resources have actively participated in PJM, ISO-NE and NYISO in the US through Reliability Pricing Mechanism or Forward Capacity Market [20]. CM establish regulations on obligation of participants (e.g., duration and frequency of response) and they are compensated based on the CC, and will get additional rewards for excess performance or get penalty for unavailability. However, consensus has not been reached on how to quantify the CC of ES or DR. For instance, NYISO proposes a derating CC factor method based on the discharge duration of ES. PJM suggests employing effective load carrying capability (ELCC) with ES dispatch and average historical performance of DR [21]. However, the self-scheduling and uncertainties of GES are not accounted for in the current market regulations. Significant effort is still required to improve the accuracy of CC evaluation and the design of CM mechanisms for GES.
III Sequential Coordinated Dispatch for GES
In this section, we present the problem formulation and solution methodology of the sequential coordinated dispath for GES, which accurately simulate the GES operations.
III-A Problem Formulation
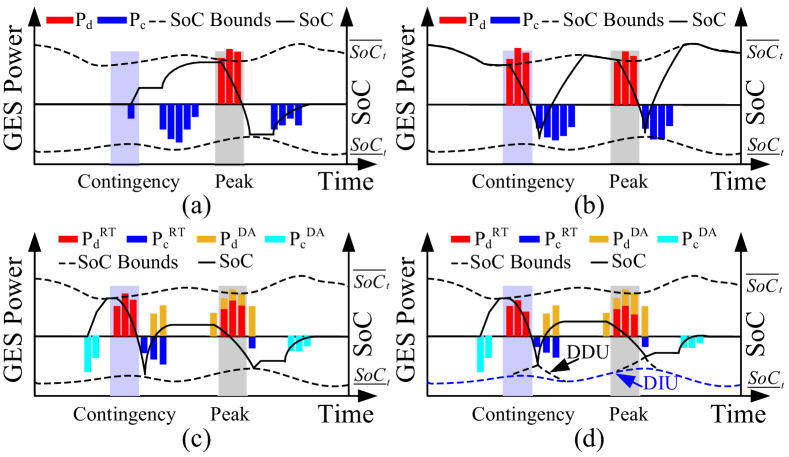
As depicted in Fig. 1, the fixed dispatch and optimistic dispatch methods adopt adequacy-oriented optimization, which only addresses the maximization of resource adequacy contribution. In the fixed dispatch method, GES discharges only during peak events, while in the optimistic dispatch method, GES discharges during all the capacity deficiency events (i.e., contingency and peak events). For the problem formulation of both methods, please see Appendix -A. However, both methods are oversimplified and unrealistic for simulating GES operations, as they overlook endogenous uncertainties, i.e., self-scheduling for other service provisions and the DDU of GES. Instead, we propose the sequential coordinated dispatch method inspired by the real-time dispatch method [12]. The proposed method coordinates the self-scheduling of GES for other service provisions with the adequacy-oriented dispatch in the CM, which balances the trade-off between resource adequacy contribution and the profit of GES. Compared with the real-time dispatch method, chance-constrained optimization is further introduced for risk management of DDU in the availability of GES. The proposed dispatch method is illustrated in Algorithm 1.
strategy of GES, i.e., .
The proposed dispatch method includes three sequential parts and is implemented within sequential Monte Carlo simulation (SMCS) [18]. The number of simulation samples is and the states transition will be checked by the system residual capacity () and the deviation between RT SoC and DA SoC ().
(i) Normal State: GES will adhere to DA self-scheduling strategy when the system capacity is sufficient, i.e., . We employ GES model from our recent work [1] as the homogeneous modeling and uncertainty description of both ES and VES. Without loss of generality, self-scheduling in the DA energy market is formulated in (1) for each simulation day from time 1 to time . The objective function in (1a) maximizes the DA energy market profit. Constraint (1b) defines the relationship between charge/discharge actions and state of charge (SoC). Constraint (1c) represents time-varying upper and lower bounds on SoC. Constraint (1d) ensures a sustainable SoC for GES over time. Constraints (1e)- (1f) limit the upper and lower charge/discharge power. and are decision variables of DA charge power, discharge power and SoC. Subscript and represent the bus number and simulation time, respectively. are the charge/discharge ratings, which are equal for ES but different for VES. We choose the discharge rating as the power capacity. and are the upper and lower SoC bounds, which are constant for ES but time-varying for VES. Parameters are the charge/discharge efficiency. Parameters and are the self-discharge rate and energy capacity. Compared to ES, VES has a higher self-discharge rate but can enhance its capacity through smart aggregation and coordination [22]. Please refer to [1] for detailed explanation of model transformation.
| (1a) | ||||
| s.t. | (1b) | |||
| (1c) | ||||
| (1d) | ||||
| (1e) | ||||
| (1f) | ||||
(ii) Emergency State: GES will discharge to response to CM calls111“call” refers to an action initiated by the system operator to request or signal capacity market participants to deliver their contracted capacity. when capacity deficiency events happen, i.e., . The problem is formulated as a multi-period chance-constrained optimization under DDU in (2). The objective function in (2a) minimizes the loss of load. Power output of conventional generator (CG) and renewable generator (RG) are limited by (2b-2c). Curtailed load power is limited within the total load power as (2d). Constraint (2e) defines the system power balance. Constraints for RT power and SoC of GES are defined as (2f-2h), chance-constraint (2i) ensures that the reliability of GES response falls within the confidence level (1-), thereby ensuring the accuracy of CC evaluation. Constraint (2g) defines that SoC remains consistent with the DA value at the start time . Curtailed and total load power are defined as and . The dispatched power and available power of generators are defined as and . The maximum curtailed rate of RG is .
The responsiveness of GES is an important uncertainty to be considered for the system operator, and RT SoC is limited by the chance-constraint (2i). The physical SoC bounds of GES are fixed to be , while the available SoC bounds are with DIU set by the baseline consumption. Moreover, the decisions and incentives of CM will also affect the distribution of SoC bounds, which come as a trade-off between inconvenience costs (i.e., discomfort sustained during CM calls) and the expected earnings (i.e., payment from CM). Hence, SoC bounds is a DDU and will either be expanded or contracted compared with baseline SoC bounds. Since only the discharge power is required for adequacy contribution, the DDU modeling of lower SoC bound is presented as (2j-2n). is the incentive effect function of CM price associated with incentive elasticity factor and follows a distribution . is the discomfort function of associated with discomfort-aversion factor and follows a distribution . is the quantile value of distribution , is the average baseline SoC. The GES discomfort is convexly modeled in (2n) as a weighted normalized function of response disutility and response discomfort. The first part represents the response frequency affected by the accumulated response discomfort prior to the call within one season. The second part represents the response intensity affecting disutility (e.g., linearized capacity degradation of ES). While the last part describes the absolute SoC deviation from average baseline SoC. The weight coefficient is defined as (). is the probability level of the chance-constraint (2i).
| (2a) | ||||
| s.t. | (2b) | |||
| (2c) | ||||
| (2d) | ||||
| (2e) | ||||
| (2f) | ||||
| (2g) | ||||
| (2h) | ||||
| (2i) | ||||
| (2j) | ||||
| (2k) | ||||
| (2l) | ||||
| (2m) | ||||
| (2n) | ||||
(iii) Recovery State: GES will recover SoC back to the DA level when the CM calls ends, i.e., & . This part of simulation is reasonable since the load recovery is commonly observed after DR, as GES prefers to sustain the DA SoC level. The charge or discharge power of GES is defined in (3) while guaranteeing the power and SoC limits of GES. defines the capacity allocation ratio of each GES based on its rated power capacity.
| (3a) | ||||
| (3b) | ||||
Remark 1 (Self-Scheduling)
We only consider the self-scheduling of GES in the DA energy market. However, GES may undertake multiple service provisions to maximize its profit. This falls under portfolio optimization problem, which is beyond the scope of this paper. To guarantee the resource adequacy contribution of GES, CM can regulate the minimum SoC withholding of GES, as detailed in Section VI.A.
Remark 2 (DDU Modeling)
We provide a rational and specific DDU structure in this paper. In practice, the system operator can utilize historical response performance and machine learning methods to estimate the structure and distribution of DDU [23]. The impact of DDU structure and risk-aversion will be detailed in Section VI.B.
Remark 3 (Network Limitation)
The transmission capacity limitation will lead to congestion that decreases the adequacy performance. However, adding network constraints make optimization computationally intractable for large-scale networks with complex uncertainties [24]. Hence, we first model the GES operations without power flow constraints, and then discuss the impact of network limitation in Section VI.C.
III-B Problem Reformulations and Solution Methodology
Chance constraint (2i)-(2n) admit a compact form (4a). are affine functions of decisions . defines DDU with mean and covariance . Deterministic reformulation of (2i) is shown in (4b). While, DDU causes the inverse cumulative distribution function to be coupled with decisions , making it hard to solve. Hence, we provide three effective approaches to address this issue based on the acquired information of DDU. Please refer to [25] for details.
| (4a) | |||
| (4b) | |||
(i) Robust Approximation. Given DDU with general but ambiguous distribution, robust approximation is introduced to obtain the maximum value of . For instance, if the DDU follows a unimodal distribution, the robust value of could be obtained by (5a) . Afterwards, the optimization under DDU is converted to be the optimization under DIU.
(ii) Iterative Optimization. Given DDU with known distribution, e.g., Log-normal distribution, an iterative algorithm is introduced in (5b) while using the robust approximation value as a starting point. And both the decisions and DDU will be updated iteratively.
(iii) Data-driven Approach. If DDU can be observed from the real-time operation, a data-driven reformulation is provided in (5c), is the radius of DDU set, is the auxiliary decision matrix. Constant and observed samples should guarantee: , .
| (5a) | |||
| (5b) | |||
| (5c) | |||
To unlock the impact of dispatch method and DDU on adequacy contribution, we next present the CC evaluation of GES.
IV CC Evaluation Methodology of GES
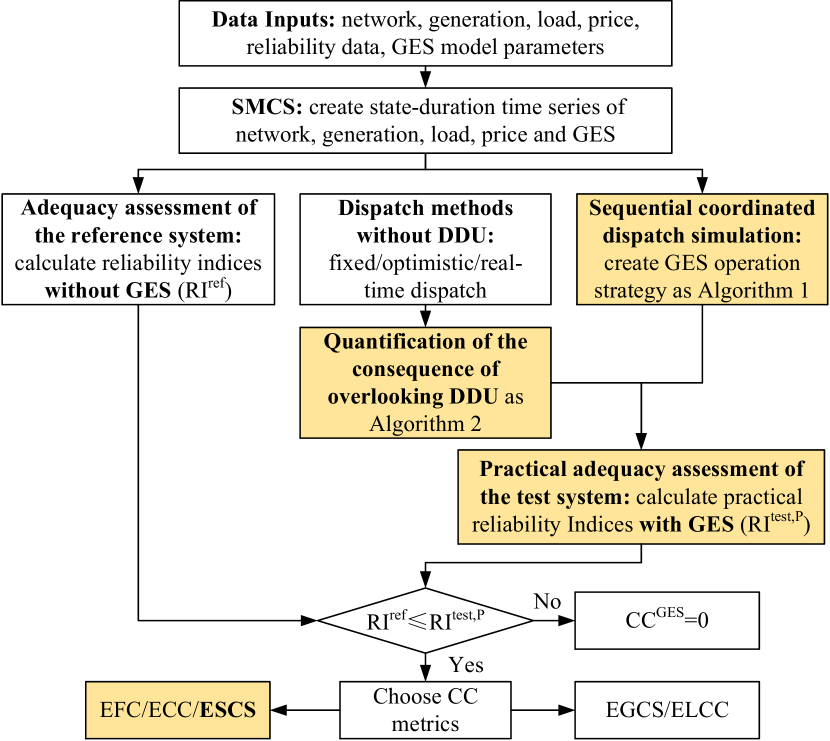
The general procedures for CC evaluation of GES are illustrated in Fig. 3. The novel contributions lie in the sequential coordinated dispatch, quantification of the consequences of overlooking DDU, practical adequacy assessment, and the introduction of the ESCS, which are highlighted in yellow in Fig. 2. The novel contributions will be presented in this section, while other steps of CC evaluation can refer to [18].
IV-A Availability Modeling and SMCS
Power system adequacy is primarily ensured by (a) CG, (b) RG, and (c) GES. While, uncertainties associated with the operational state and available capacity of these resources are inevitable. SMCS is employed as the uncertainty simulation tool as SMCS creates time-duration series in a chronological manner and maintain the inter-temporal information.
(a) CG and (b) RG: The uncertain operational state (i.e., normal state and fault state) is a DIU, and can be modeled as a Bernoulli distribution in (6). The state and state probability of generator are defined as and f. The failure rate and repair rate are defined as and . The available capacity of CG is dispatchable, while it is stochastic for RG. This DIU can be simulated by historical observations or generated samples. And the available power of a CG/RG can be expressed as (7).
| (6) |
| (7) |
(c) GES: The operational state of GES admits a Bernoulli distribution and modeled with the same form of (6). This DIU can be obtained by the forced outage rate for ES and on-state probability for VES. While, the available capacity of GES is affected by baseline consumption and responsiveness, which is modeled as (1-2) and simulated in Section III.A.
IV-B Quantification of Consequence of Overlooking DDU
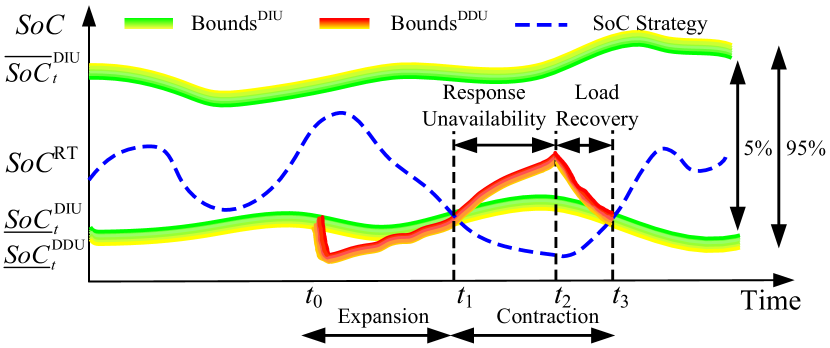
To address the significance of considering DDU, the consequence of overlooking DDU in previous dispatch methods is further presented. As shown in Fig. 3, the theoretical SoC bounds with DIUs or constant value are illustrated by green rainbow (darker for lower probability level), while the practical decision-dependent SoC bounds are illustrated by red rainbow. From the start of CM call ( to ), the SoC bounds under DDU expand compared with DIU bounds as the incentive effect dominates. From to the end of load recovery , the SoC bounds under DDU contract compared with DIU bounds as the discomfort effect dominates. The response unavailability of GES lies in the gap between SoC strategy and practical SoC bounds ( to ), and lower probability levels result in larger gaps and increased response unavailability. While, both the SoC and DDU bounds recover after response ( to ). The consequence of overlooking DDU can be quantified by following the steps outlined in Algorithm 2.
IV-C Practical Adequacy Assessment
Previous adequacy assessment aims to assess the reliability level of the system with DIUs from failures, RES and load outputs, etc., which is denoted as adequacy assessment under DIUs. And reliability indices, e.g., EENS, are commonly used to quantify the theoretical and decision-independent risk while overlooking the risk from DDUs. Hence, we proposed the practical adequacy assessment and calculate practical EENS in (8). Risks from DIUs and DDUs are defined as and . x and y are decisions and uncertainties. N is the number of buses. E is the expectation function.
| (8) |
IV-D Calculation of Novel Capacity Credit Index
Existing CC indices include ELCC, equivalent firm capability (EFC), equivalent generation capacity substituted (EGCS), etc. Different metrics respresent different resources to be substituted. EFC and ECC quantify the substitution of newly-constructed CG, while EFC assumes the perfect CG. EGCS and ELCC quantify the substitution of the retired conventional generation and load carrying/reduction, respectively.
Previous CC metrics aim to quantify the ability of incremental resources to displace conventional generator. However, to compare the capacity value of VES and ES, this paper introduces ESCS to quantify the adequacy contribution of VES in equivalence with physical storage. The calculation of ESCS is given by (9). and denote the reliability of the referenced and tested system. and are the replaced capacity value of physical ES and rated power capacity of VES. is the reliability function.
| (9a) | |||
| (9b) | |||
| (9c) | |||
V Numerical Studies
V-A Set-Up
The proposed method is tested in the modified IEEE RTS-79 benchmark system with winter peak load [26]. Compared with the original system, we further introduce the RG, ES, and VES into the system. The RG, accounting for a certain share of generators, are located at PV buses. FTM ES resources are located at PV buses, while behind of meter (BTM) ES resources are located at PQ buses. VES resources stem from load and are located at PQ buses. The grid reliability data are inherited from the original system. The historical data of RG, load, and DA price are collected from Belgium TSO. Sampling duration of SMCS is set to be 10 years, and parallel computing technique is adopted to accelerate the simulation. The optimization is coded in MATLAB with the YALMIP interface and solved by GUROBI 11.0 solver. The programming environment is Core i9-13900HX @ 2.20GHz with RAM 32 GB.
V-B Storage Operation and Adequacy Performance
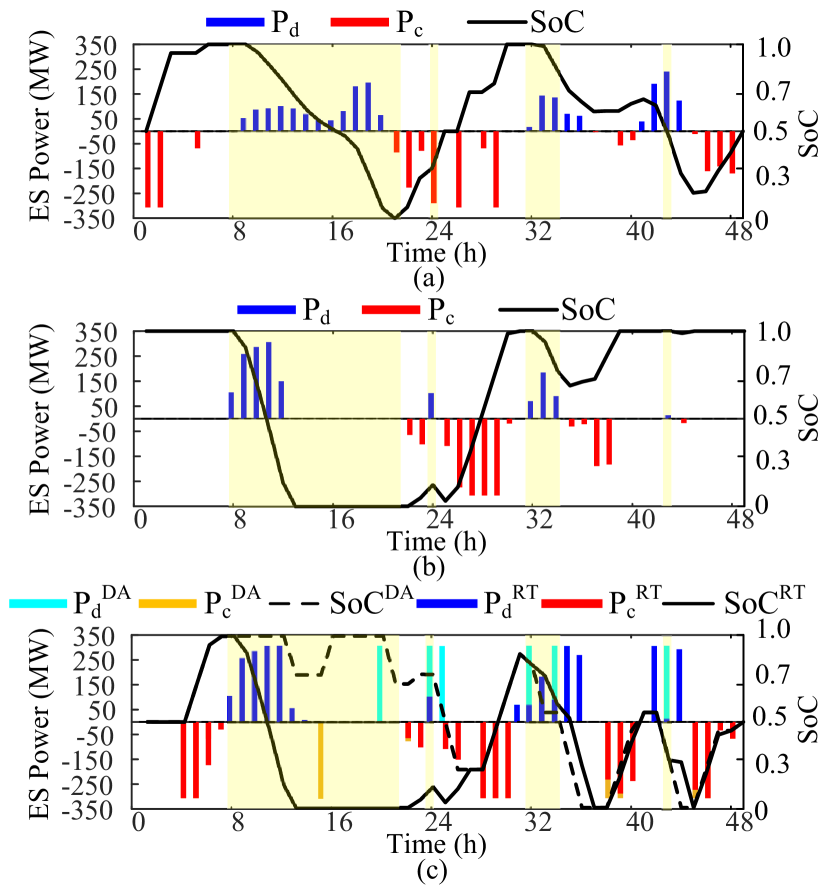
We first illustrate the great difference in the ES operation and the associated adequacy performance compared with three dispatch methods, i.e., fixed dispatch [5], optimistic dispatch [10] and coordinated dispatch. First, 4-hour FTM battery ES are tested, with the forced outage rate, MTTF, self-discharge rate, one-way charge/discharge efficiency and power rating of 5%, 24h, 5%/month, 90% and 30% of RG rated power respectively. The proportion of RG is 30%. It is observed from Fig. 4 that the fixed dispatch method only addresses the capacity deficiency due to peaks, but fails to consider the adjustment to the RT failures (outage of CG at 24h) nor uncertainties of ES (15% outage of ES at the first 16h), which results in the minimal flexibility utilization of ES and maximum EENS. While optimistic dispatch maintains the full capacity at the normal system state and ES is only discharged in response to all the “loss of load” events, ending with “0” SoC. Although it manages to deal with RT failures and outperforms other methods with respect to adequacy performance, it overlooks the baseline consumption and uncertainties of ES. By contrast, the coordinated dispatch is more rational and realistic, which involves both DA self-scheduling (light-blue and light-orange barplot) and RT adjustment (blue and red barplot). The adequacy performance is a little worse than optimistic dispatch since the available capacity of ES is reduced due to DIUs and DDUs. The difference in dispatch methods is the primary cause of the variations in adequacy contributions of ES. As is shown in Table I, the adequacy performance follow the order: optimistic dispatch coordinated dispatch fixed dispatch. By comparing the proposed method with the real-time dispatch method in [12], it is observed that DDU has a small impact on ES, which results in an 2% losses in theoretical EENS.
| Dispatch Method | Rated Power | (GWh) / | |||
| 4-h-ES | 4-h-VES | 12-h-ES | 12-h-VES | ||
| Fixed Dispatch | 30% | 163.5/0.62 | 171.7/1.00 | 149.0/0.61 | 162.2/4.73 |
| 50% | 159.9/0.49 | 165.4/2.46 | 147.3/0.35 | 157.9/2.80 | |
| Optimistic Dispatch | 30% | 112.4/2.19 | 138.1/20.7 | 72.6/5.57 | 132.2/27.1 |
| 50% | 92.3/3.17 | 131.6/24.8 | 54.0/8.43 | 127.4/29.1 | |
| Coordinated Dispatch | 30% | 123.8/3.90 | 143.0/9.82 | 81.1/7.60 | 132.8/10.6 |
| 50% | 104.4/5.99 | 134.5/9.96 | 63.4/11.4 | 127.8/8.24 | |
| Proposed Method | 30% | 126.2/0.05 | 149.2/0.23 | 84.2/0.11 | 137.2/0.40 |
| 50% | 107.5/0.06 | 140.1/0.31 | 67.1/0.12 | 131.6/0.53 | |
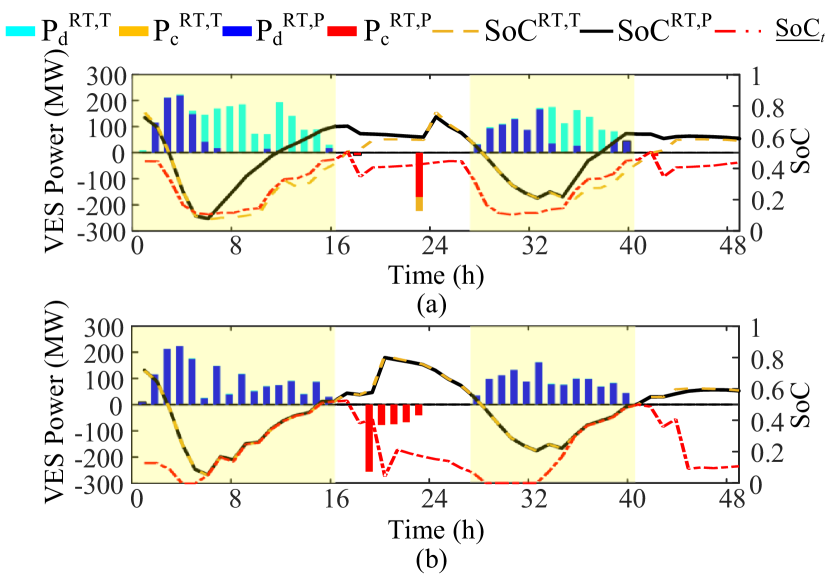
Furthermore, TCL-VES from cooling load is added for comparison. It is observed from Table I that ES outperforms VES with respect to due to the larger energy losses and lower on-state probability associated with VES. By comparing the results of the proposed method (with DDU) and real-time dispatch (without DDU), it is observed that considering DDU results in approximately 4% increase in . The reason behind it is the difference in available SoC bounds and is illustrated in Fig. 5 (without DA dispatch). Under the coordinated dispatch, at the onset of an capacity deficiency, all remaining capacity in the VES is discharged at high-power over a prolonged duration. This leads to significant response discomfort for occupants, resulting in extensive response unavailability (gap between theoretical and practical SoC) between 5h to 16h and 31h to 40h. Additionally, the high-power load recovery can easily cause the secondary peak shifting. On the contrary, considering DDU begets smarter strategy that low-power discharge strategy is adopted and VES obtains charging bonus interspersed within discharging to recover the response discomfort. This results in negligible response unavailability. Moreover, considering DDU, the available lower SoC bound contracts during discharge actions and expands during charge actions, which is consistent with the derivation from the DDU model. We also observe that EENS decreases with the increased power and energy capacity of GES. This effect is particularly sensitive under the optimistic dispatch, while it has minimal impact under the fixed dispatch. At first glance, the optimistic dispatch outperforms others in terms of theoretical adequacy performance, but it is not realistic in real-time operations, as will be demonstrated next.
V-C Benefit from Considering Endogenous Uncertainties
We further demonstrate the benefits of incorporating market strategic behavior and DDU in GES operations simulation through (i) practical adequacy performance, (ii) economic performance and (iii) capacity market decision-making.
(i) Practical Adequacy Performance. As is shown in Table I, the practical adequacy performance of the existing methods is worse than the theoretical ones since they overlook the response unavailability of GES. Furthermore, the additional practical EENS is increased with the increase in power and energy capacity of GES. It is observed that for 30% rated power 4-h FTM ES, the practical EENS are witnessed as 0.62%, 2.19% and 3.90% increase for fixed dispatch, optimistic dispatch and coordinated dispatch. Although 11.6% additional EENS is witnessed for 12-h ES under coordinated dispatch, DDU consequence is not significant since DDU in ES primarily lies in capacity degradation. While the situation will be much worse for VES and the highest additional EENS (27.1% and 29.1%) is found for 12-h VES under optimistic dispatch, primarily because the VES operation deviates significantly from the baseline consumption, leading to accumulated discomfort and response unavailability for long-duration VES. Furthermore, although coordinated dispatch can mitigate a certain of DDU consequences to by considering the self-consumption of GES, GES still incurs 10% additional EENS. While, the proposed method effectively controls the risk from DDU within the probability level and incurs little DDU consequence (less than 1%). The above analysis demonstrates the accuracy of the proposed method and how existing methods tend to overestimate the adequacy contribution of GES by overlooking DDU. Moreover, the increased capacity and DDU sensitivity of GES will worsen the DDU consequence and pose greater risks to the system operation.
(ii) Economic Performance. Adequacy performance is important for the system operator, but GES participants are more concerned about the profit. The profit or penalty of GES consists of three parts: (a) profit from DA energy market (DAM), (b) RT payment from CM and (c) RT penalty from response unavailability. We use value of lost load (VoLL) to estimate the profit (b), and VoLL=10000$/MWh [24]. The penalty cost is 50$/MWh. We compare the annual average profit composition of 4-h ES/VES with 30% rated power, as summarized in Table III. Except for fixed dispatch, GES can earn significant revenue in the CM (over 100 million$) as they are available for most of the real-time capacity deficiency. Additionally, only the real-time dispatch and the proposed method yields additional profit from DA self-scheduling, resulting in better economic performance compared to others. Furthermore, GES (especially for VES) incurs high penalties under optimistic and real-time dispatch without considering DDU. This could lead to dissatisfaction and diminish their willingness to respond in the future. Therefore, considering DDU not only enhances the response reliability but also guarantee the profit of GES.
| Dispatch Method | GES Type | GES Profit () | |||
| DAM Profit | CM Profit | CM Penalty | Net Profit | ||
| Fixed Dispatch | ES/VES | 0.0/0.0 | 32.0/14.1 | 0.0/0.1 | 32.0/14.0 |
| Optimistic Dispatch | ES/VES | 0.0/0.0 | 131.2/27.6 | 0.0/1.4 | 131.1/26.2 |
| Real-Time Dispatch | ES/VES | 17.0/10.5 | 103.6/46.8 | 0.1/0.7 | 120.6/56.6 |
| Proposed Method | ES/VES | 17.0/10.5 | 108.5/61.8 | 0.0/0.0 | 125.5/72.3 |
(iii) Capacity Market Decision-Making. Decision-makers with different risk preferences will choose different dispatch methods to calculate CC. Fixed dispatch methods generate the minimum (robust) adequacy contribution of GES, suitable for risk-averse decision-makers. On the contrary, optimistic dispatch corresponds to the maximum adequacy contribution, suitable for optimistic decision-makers, but normally will not be implemented in practice. Meanwhile, proposed coordinated dispatch begets the adequacy contribution with the highest probability and guaranteed reliability, which is the most acceptable for both GES and system operator. More importantly, the above analysis verifies that the system operator should not only calculate DDU consequence, but also adopt risk management strategy in the CM to mitigate the risk from DDU, hence enhancing the adequacy performance.
V-D Capacity Credit Evaluation of GES
In this section, we demonstrate how the dispatch simulation method and DDU consideration impact the CC value of GES.
(i) CC Variations across Metrics. We observed slight differences in CC values across metrics. For example, for a 30% rated power, 4-h FTM-ES under the proposed dispatch method, we have: EFC = 31.4%, EFC = 34.0%, ELCC = 26.5%, EGCS = 34.7%. However, the variation pattern remains consistent with different energy storage configurations and dispatch strategies. Hereby, we select a representative, i.e., EFC for the subsequent analysis.
(ii) Theoretical and Practical CC. Table III summarizes the theoretical and practical CC of FTM ES and TCL-VES (30% rated power, 4-h) under different dispatch methods. It is observed that the CC of ES ranges from 30% to 40% under most dispatch methods except for fixed dispatch, whereas CC of VES only ranges from 10% to 20%. Moreover, under the previous dispatch methods, DDU consequence on CC of ES only cause about 6%-10% decline in CC, while 28%-70% decline in CC is witnessed for VES. While the proposed method keeps the gap under 3% for both ES and VES. In addition, to evaluate the adequacy contribution equivalence of VES with ES, we found that ESCS is increased with the rated power of VES. Without uncertainty consideration, the VES is equivalent to 60%-95% of ES, while the various DIUs and DDU dramatically reduce this ability, resulting in 25%-60% ESCS in practice.
| GES Type | DDU Consequence | Dispatch Method | |||
| Fixed | Optimistic | Coordinated | Proposed | ||
| 4-h ES | Without/With | 9.1%/8.5% | 42.4%/40.5% | 34.0%/30.6% | 32.2%/32.1% |
| 4-h VES | Without/With | 4.6%/3.7% | 24.2%/7.3% | 20.0%/12.7% | 17.2%/17.1% |
(iii) CC Variations across Configurations. The power and energy capacity significantly affect the CC of GES. Under the 30% share of RES, the comparative results in Table IV demonstrate that CC of GES rises with energy capacity, yet falls with increased power capacity. This highlights the critical role of long-duration ES in preserving system adequacy (almost 90% for 12-hour ES), and also indicates that CC value diminishes as ES becomes less scarce. Hence, in the initial phase with low GES penetration, employing the marginal CC evaluation method is recommended. However, once GES penetration reaches a threshold where marginal CC nears zero, shifting to the average value method becomes advisable. Moreover, the CC of VES is not improved significantly by increasing energy capacity (22.8% for 4-h and 37.4% for 12-h) due to its inherent discomfort-aversion for long-duration dispatch.
| Energy Capacity | GES Type | Power Capacity | ||
| 10% | 30% | 50% | ||
| 4-h | ES/VES | 38.1%/22.8% | 32.3%/17.1% | 27.8%/13.6% |
| 8-h | ES/VES | 69.2%/32.5% | 55.5%/22.4% | 43.0%/16.1% |
| 12-h | ES/VES | 86.9%/37.4% | 67.5%/24.5% | 52.0%/16.8% |
VI Sensitivity Analysis
In this section, we further investigate the key impact factors of CC of GES, by using the proposed method.
VI-A SoC Withholding
CM can regulate the minimum SoC withholding for GES to ensure the sufficient capacity for the CM. The net profit and CC of ES are compared with different SoC withholdings in Table V. For short-duration ES, we observed that the increase in SoC withholding enhances both CC (10%) and net profit (7%). This is due to SoC withholding marginally impacting the DAM profits while notably boosting the CM profits. For long-duration ES, SoC withholding barely increases CC (1%) and net profit (0.5%) as the reduction in the DAM profit dominates. And the results are highly-dependent on the DAM and CM price, if the CM price decreases by 40% from the baseline, increasing SoC withholding will result in negative profit gains for long-duration ES. Hence, for short-duration ES, SoC withholding restriction should be implemented, whereas such regulations are not necessary for long-duration ES.
| SoC Withholding | Indices | Power and Energy Capacity | |||
| 10%-4h | 10%-12h | 30%-4h | 30%-12h | ||
| 0 | CC/Net Profit | 38.1%/25.6 | 86.9%/108 | 32.3%/126 | 67.5%/220 |
| 0.2 | CC/Net Profit | 39.9%/54.3 | 87.2%/109 | 33.6%/128 | 67.6%/220 |
| 0.4 | CC/Net Profit | 42.3%/56.4 | 88.0%/109 | 35.7%/132 | 68.2%/221 |
VI-B Distribution and Parameters of DDU
We further investigate how the distribution and parameters of DDU affect the CC of VES as shown in Table VI. It is observed that both the increase in the incentive effect and the decrease in the discomfort effect will benefit the performance of VES, while the results are more sensitive to the discomfort effect. Specially, CC is increased by 9%-28% with a half decrease in the discomfort effect. By contrast, CC has only increased by 1%-15% with a half increase in incentive effect. This suggests that procurement of VES resources with lower discomfort aversion is more profitable than increasing the CM price. And for long-duration VES, these DDU parameters have a relatively minor impact on its CC. Furthermore, with more information available on DDU, the CC of VES tends to be larger, as the deterministic reformulation in Equation (8) is less conservative. Moreover, the system operator can adjust in chance-constraints to achieve the trade-off between the available capacity and response unavailability of VES. We observe that increasing initially raises the CC as the increased flexibility of GES dominates, but the CC value begins to decline after reaching 0.35 as the increased DDU consequence dominates. And this indicates the best setting of .
| Distribution Type | Power & Energy Capacity | |||||
| 10%-4h | 30%-4h | 10%-12h | 30%-12h | |||
| Unimodal | 1.00 | 4.00 | 22.8% | 17.1% | 37.4% | 24.5% |
| 1.00 | 2.00 | 29.3% | 21.1% | 40.6% | 27.1% | |
| 0.50 | 2.00 | 25.5% | 19.1% | 42.6% | 26.7% | |
| Symmetric & Unimodal | 1.00 | 4.00 | 23.6% | 17.6% | 38.3% | 24.9% |
| 1.00 | 2.00 | 30.1% | 21.6% | 44.1% | 27.2% | |
| 0.50 | 2.00 | 26.3% | 19.6% | 43.1% | 26.9% | |
VI-C GES Locating and Network Limitation
The CC values of ES with different locations and transmission line capacity are summarized in Table VIII. It is observed that distributed ES has a slightly lower CC compared to centralized ES when there is no limitation in transmission capacity, which is due to the increased failure rates associated with distributed locating. CC declines with decreased line capacity, and FTM-ES is more sensitive compared to BTM-ES, demonstrated by the better performance with BTM-ES under lower line capacity. Moreover, the relatively larger CC reduction (20% CC reduction) is observed in the long-duration ES. The above analysis indicates the importance of considering network limitation and spatial variations for long-duration GES.
| Line Capacity | GES Type | Power & Energy Capacity | |||
| 10%-4h | 30%-4h | 10%-12h | 30%-12h | ||
| 100% | FTM/BTM | 38.1%/38.1% | 32.3%/32.2% | 86.9%/86.8% | 67.5%/67.3% |
| 70% | FTM/BTM | 36.4%/36.4% | 30.3%/31.0% | 82.9%/82.9% | 62.7%/63.4% |
| 50% | FTM/BTM | 31.3%/33.0% | 27.1%/27.6% | 73.0%/74.9% | 53.9%/55.5% |
VI-D Load Factor and Correlation Coefficient
Given that VES is derived from load, it is crucial to address the load factor of VES and correlation coefficient between load and VES. We compare the CC of different VES among: TCL- (cooling at summer), TCL- (heating at winter), TCL- (cooling at summer & heating at winter) and TCL- (heating all the year). As seen in Table VII, for the same load factor, a positive correlation coefficient corresponds to higher capacity values, whereas the capacity value tends to be lower with a negative correlation coefficient. Furthermore, as the load factor increases, the CC exhibits a significant rise (12-h TCL- even reaches 100% CC). Hence, it is more economically efficient to procure VES with a higher load factor and positive correlation with the load. The above analysis motivates the importance of temporal CC evaluation of GES.
| GES Type | Load Factor | Correlation Factor | Power & Energy Capacity | |||
| 10%-4h | 30%-4h | 10%-12h | 30%-12h | |||
| TCL- | 0.54 | -0.34 | 22.8% | 17.1% | 37.4% | 24.5% |
| TCL- | 0.54 | 0.38 | 44.0% | 36.9% | 73.8% | 60.0% |
| TCL- | 0.92 | 0.21 | 62.6% | 54.8% | 100% | 94.6% |
| TCL- | 1.00 | 0.11 | 65.1% | 57.3% | 100% | 99.9% |
VI-E Penetration of RES
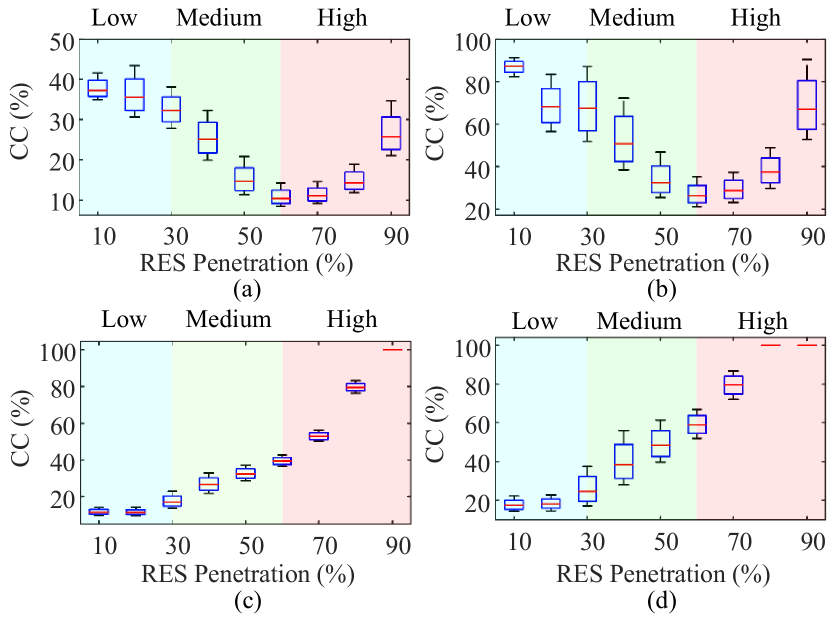
We further investigate the CC of GES under different RES penetration. As is shown in Fig. 6, as the RES penetration increases, CC of ES experiences a slight decrease at low RES penetration (10%-30%), then undergoes a sharp decline at medium RES penetration (30%-60%), bottoming out at 10%-20%. Finally it exhibits gradual growth at high RES penetration (70%-100%). It indicates that the generation substitution ability is decreased with increasing penetration of RES. However, as RES becomes sufficiently scarce, the capacity value of ES increases. Furthermore, VES exhibits distinctly different patterns, with its CC increasing as RES penetration rises. This is because in our case study setup, VES capacity expands with RES penetration and fixed load capacity declines. This enables a higher share of load flexibility, contributing to the increase in the CC of VES. It is also observed that long-duration GES outperforms the others and even achieve 60%-100% CC in the high RES penetration stage, which is a promising solution for the future decarbonized power system.
VI-F Energy Losses Factors
Comparative results in Table IX demonstrate the CC of GES affected by charge/discharge efficiency () of ES or self-discharge rate () of VES. It is observed that ES with higher efficiency tends to have a higher CC value. And the efficiency has relatively lower impact on short-duration ES (15% changes in CC) compared with long-duration ES (30% changes in CC). This highlights the greater importance of improving the efficiency of long-duration ES (e.g., hydrogen, pumped hydro storage) for enhanced adequacy performance. While, variations in the self-discharge rate are akin to changes in indoor temperature ranges for VES. The findings indicate that higher self-discharge rates are associated with wider indoor temperature ranges (increased flexibility), which in turn leads to higher CC values. Moreover, the impact of self-discharge rate is relatively minor on CC of VES with higher power capacity.
| GES Type | / | Power & Energy Capacity | |||
| 10%-4h | 30%-4h | 10%-12h | 30%-12h | ||
| FTM-ES | 0.7 | 25.1% | 20.7% | 56.2% | 44.2% |
| 0.8 | 34.3% | 28.3% | 71.4% | 55.9% | |
| 0.9 | 38.1% | 32.3% | 86.9% | 67.5% | |
| TCL- | 0.4 | 22.8% | 17.0% | 37.4% | 24.5% |
| 0.6 | 29.1% | 20.9% | 42.0% | 26.1% | |
| 0.8 | 34.3% | 23.5% | 43.1% | 26.4% | |
VII Conclusion
In this paper, a novel CC evaluation framework is proposed for GES, which fully incorporates endogenous uncertainties in the self-scheduling and DDU of GES. Within this framework, the sequential coordinated dispatch achieves the trade-off between resource adequacy contribution and the profit of GES. Meanwhile, we introduce chance-constrained optimization along with three tractable solution methods for managing the risk associated with DDU. Additionally, we propose the practical adequacy assessment method based on the quantification of the consequence of overlooking DDU. As illustrated with extensive case studies, the proposed framework obtains more reliable and accurate CC values thanks to the consideration of endogenous uncertainties. Moreover, the inaccuracies in CC values by previous methods highlight the significance of regulating SoC withholding for CM and collecting accurate DDU information from GES participants. Sensitivity analysis shows that the CC of GES is primarily impacted by seven factors, such as power and energy ratings, DDU structure, etc. The results of the ESCS show that VES is less than 60% equivalent to ES. These regular findings provide valuable insights into procurement and dispatch decision-making of CM operators.
Future work will extend the CC evaluation framework with network constraints and spatial-temporal availability of GES. Also, we will design an effective capacity market pricing mechanism for GES based on the proposed CC evaluation.
-A Formulation of Fixed Dispatch and Optimistic Dispatch
The fixed dispatch is formulated in (10), which aims to minimize the peak load of each peak day. is the peak load.
| (10a) | ||||
| s.t. | (10b) | |||
| Constraints (1b-1g) | (10c) | |||
The optimistic dispatch is formulated in (11).
| (11a) | |||
| (11b) | |||
References
- [1] N. Qi, P. Pinson, M. R. Almassalkhi, et al., “Chance-constrained generic energy storage operations under decision-dependent uncertainty,” IEEE Trans. on Sustainable Energy, vol. 14, no. 4, pp. 2234–2248, 2023.
- [2] IEA, “Innovations in power system planning,” 2024. [Online]. Available: https://www.iea.org/articles/energy-transitions-require-innovation-in-power-system-planning
- [3] L. L. Garver, “Effective load carrying capability of generating units,” IEEE Trans. on Power apparatus and Systems, no. 8, pp. 910–919, 1966.
- [4] M. Amelin, “Comparison of capacity credit calculation methods for conventional power plants and wind power,” IEEE Trans. on Power Systems, vol. 24, no. 2, pp. 685–691, 2009.
- [5] Y. Zhou, P. Mancarella, and J. Mutale, “Framework for capacity credit assessment of electrical energy storage and demand response,” IET Gener. Transm. Distrib., vol. 10, no. 9, pp. 2267–2276, 2016.
- [6] CAISO, “Demand response issues and performance,” 2024. [Online]. Available: https://www.caiso.com/Documents/ReportonDemandResponseIssuesandPerformance-Feb252021.pdf
- [7] H.-G. Kwag and J.-O. Kim, “Reliability modeling of demand response considering uncertainty of customer behavior,” Applied Energy, vol. 122, pp. 24–33, 2014.
- [8] M. Nikzad and B. Mozafari, “Reliability assessment of incentive-and priced-based demand response programs in restructured power systems,” INT J ELEC POWER, vol. 56, pp. 83–96, 2014.
- [9] L. Cheng, Y. Wan, Y. Zhou, et al., “Operational reliability modeling and assessment of battery energy storage based on lithium-ion battery lifetime degradation,” Journal of Modern Power Systems and Clean Energy, vol. 10, no. 6, pp. 1738–1749, 2021.
- [10] M. P. Evans, S. H. Tindemans, and D. Angeli, “Minimizing unserved energy using heterogeneous storage units,” IEEE Trans. on Power Systems, vol. 34, no. 5, pp. 3647–3656, 2019.
- [11] A. Safdarian, M. Z. Degefa, M. Lehtonen, et al., “Distribution network reliability improvements in presence of demand response,” IET Generation, Transmission & Distribution, vol. 8, no. 12, pp. 2027–2035, 2014.
- [12] P. A. Dratsas, G. N. Psarros, and S. A. Papathanassiou, “A real-time redispatch method to evaluate the contribution of storage to capacity adequacy,” IEEE Trans. on Power Systems, 2023.
- [13] B. Cheng and W. B. Powell, “Co-optimizing battery storage for the frequency regulation and energy arbitrage using multi-scale dynamic programming,” IEEE Trans. on Smart Grid, vol. 9, no. 3, pp. 1997–2005, 2016.
- [14] M. Qin, Y. Yang, X. Zhao, et al., “Low-carbon economic multi-objective dispatch of integrated energy system considering the price fluctuation of natural gas and carbon emission accounting,” Protection and Control of Modern Power Systems, vol. 8, no. 4, pp. 1–18, 2023.
- [15] B. Hu, C. Pan, C. Shao, et al., “Decision-dependent uncertainty modeling in power system operational reliability evaluations,” IEEE Trans. on Power Systems, vol. 36, no. 6, pp. 5708–5721, 2021.
- [16] C. Pan, C. Shao, B. Hu, et al., “Modeling the reserve capacity of wind power and the inherent decision-dependent uncertainty in the power system economic dispatch,” IEEE Trans. on Power Systems, 2022.
- [17] N. Qi, L. Cheng, Y. Zhuang, et al., “Reliability assessment and improvement of distribution system with virtual energy storage under exogenous and endogenous uncertainty,” Journal of Energy Storage, vol. 56, p. 105993, 2022.
- [18] B. Zeng, X. Wei, and et al., “Hybrid probabilistic-possibilistic approach for capacity credit evaluation of demand response considering both exogenous and endogenous uncertainties,” Applied Energy, vol. 229, pp. 186–200, 2018.
- [19] T. Mertens, K. Bruninx, J. Duerinck, et al., “Capacity credit of storage in long-term planning models and capacity markets,” Electric Power Systems Research, vol. 194, p. 107070, 2021.
- [20] A. S. M. Khan, R. A. Verzijlbergh, O. C. Sakinci, et al., “How do demand response and electrical energy storage affect (the need for) a capacity market?” Applied Energy, vol. 214, pp. 39–62, 2018.
- [21] B. Vatani, B. Chowdhury, and J. Lin, “The role of demand response as an alternative transmission expansion solution in a capacity market,” IEEE Trans. on Industry Applications, vol. 54, no. 2, pp. 1039–1046, 2017.
- [22] N. Nazir and M. Almassalkhi, “Grid-aware aggregation and realtime disaggregation of distributed energy resources in radial networks,” IEEE Trans. on Power Systems, vol. 37, no. 3, pp. 1706–1717, 2021.
- [23] L. Marrero, D. Sbárbaro, and L. García-Santander, “Online demand response characterization based on variability in customer behavior,” Journal of Modern Power Systems and Clean Energy, 2024.
- [24] S. Wang, N. Zheng, C. D. Bothwell, et al., “Crediting variable renewable energy and energy storage in capacity markets: Effects of unit commitment and storage operation,” IEEE Trans. on Power Systems, vol. 37, no. 1, pp. 617–628, 2021.
- [25] N. Qi, “Proof for deterministic reformulation,” 2024. [Online]. Available: https://github.com/thuqining/Capacity˙Credit˙DDU
- [26] R. Xiao, Y. Xiang, L. Wang, et al., “Power system reliability evaluation incorporating dynamic thermal rating and network topology optimization,” IEEE Trans. on Power Systems, vol. 33, no. 6, pp. 6000–6012, 2018.