Nonlinear Interactions of Planetary-Scale Waves in Mesospheric Winds Observed at 52°N Latitude and Two Longitudes
Abstract
Nine years of mesospheric wind data from two meteor radars at 52°N latitude were analyzed to investigate planetary waves (PWs) and tides by estimating their zonal wavenumber through longitudinal phase differences. Our results reveal that PW normal modes (NMs) primarily drive multi-day oscillations, showing seasonal variability and statistical associations with Sudden Stratospheric Warming (SSW) events. Specifically, a significant 6-day NM emerges in April, followed by predominant 4- and 2-day NMs until June, with peaks of 2-, 4-, and 6-day NMs spanning July to October. Furthermore, our study provides the first observational verification of frequency and zonal wavenumber of over ten secondary waves from nonlinear interactions among planetary-scale waves. One notable finding is the prevalence of non-migrating components in winter 24-hour and summer 8-hour tides, attributed to these nonlinear interactions. Our findings underscore the diverse nonlinear dynamics of planetary-scale waves, triggering a variety of periodic oscillations.
Key Laboratory of Solar Activity and Space Weather, National Space Science Center, Chinese Academy of Sciences, Beijing, China Hainan National Field Science Observation and Research Observatory for Space Weather, National Space Science Center, Chinese Academy of Sciences, Beijing, China Ann & H. J. Smead Department of Aerospace Engineering Sciences, University of Colorado, Boulder, USA Institute of Applied Physics & Oeschger Center for Climate Change Research, Microwave Physics, University of Bern, Bern, Switzerland Institute for Meteorology, Leipzig University, Leipzig, Germany Beijing national observatory of space environment, Institute of Geology and Geophysics, Chinese Academy of Sciences, Beijing, China College of Earth and Planetary Sciences, University of Chinese Academy of Sciences, Beijing, China Heilongjiang Mohe National Observatory of Geophysics, Beijing, China
Maosheng Hehemaosheng@nssc.ac.cn
Planetary wave normal modes drive multi-day oscillations, showing April-October seasonality and statistical SSW associations (not one-to-one)
First evidence of frequency and zonal wavenumber matching for over 10 secondary waves of nonlinear interactions among planetary-scale waves
Non-migrating components dominate the winter 24-h tide and summer 8-h tide, attributed to the nonlinear interactions
Plain Language Summary
We analyzed nine years of mid-latitude middle atmospheric wind data at two longitudes. By examining longitudinal phase differences, we identified planetary-scale waves and their sources. Most multi-day oscillations are linked to planetary wave normal modes, influenced by atmospheric mechanical properties. Certain normal modes were prominent from April to October, while others correlated with winter’s sudden stratospheric warming events. These modes, along with tides and stationary planetary waves, interact nonlinearly, generating secondary waves of non-normal mode multi-day oscillations and sun-asynchronous tides. Our two-station method reveals for the first time secondary waves of stationary planetary waves, which share the same frequencies as their parent waves, making them indistinguishable in single-station spectral analyses. This phenomenon might explain the prevalence of sun-asynchronous components in the 24-hour winter and 8-hour summer tides, which are exceptions to the typically dominant sun-synchronous tides. Additionally, we report for the first time the interactions of normal modes with non-migrating and 8-hour tides. Our findings highlight the extensive and varied nonlinear behaviors of planetary-scale waves, resulting in a broad spectrum of oscillations.
1 Introduction
Extratropical planetary waves (PWs), also referred to as Rossby waves, play a significant role in the dynamics of rotating fluids, where the meridional gradient of the Coriolis force acts as the restoring force Zaqarashvili \BOthers. (\APACyear2021); Holton \BBA Hakim (\APACyear2012). In Earth’s atmosphere, PWs exhibit exceptional behavior in the form of normal modes (NMs), intricately linked to the resonant properties of the medium. Constrained predominantly within westerly winds due to Earth’s rotation, PWs manifest a westward phase velocity relative to their carrying fluids, a consequence of the conservation of absolute vorticity. These principles are illustrated in Figure 1 of \citeAHe2022NC. The temporal spectrum of PW NMs spans discretely scales from a few days to several weeks, with periods of 2, 4, 5–6, 10, 16, and 25–28 days.
Ground-based observations have proven pivotal in delineating the seasonality of PWs <e.g.,¿[]hocking2011a, Jacobi2008,Jiang2008, sridharan2006, gong2018a, yu2019a. However, most of these studies relied on single-station analyses, lacking the capacity to measure horizontal scales. Space-based observations, on the other hand, have contributed to investigating the climatology of PWs with constraints on zonal wavenumber <e.g.,¿[ respectively]Gu2013, yamazaki2021, Forbes2017a, Forbes2015, McDonald2011 for waves with periods of 2, 4, 6, 10, and 16 days. Nevertheless, these observations, mostly collected in quasi-sun-synchronous orbits and using single-satellite analyses, and are thus susceptible to ambiguities from aliasing, as discussed by \citeAForbes2017a. Distinguishing NMs from secondary waves resulting from interactions between NMs and migrating tides is challenging, as elaborated in Section 1 of \citeAHe2021g.
Recently, using mesospheric wind data observed from two meteor radars at 52°N latitude, \citeAHe2022NC demonstrated that the dominant 2–32-day fluctuations during the 2019 New Year sudden stratospheric warming event (SSW) can be attributed to either PW NMs or their nonlinear behaviors. This analysis determines frequency and zonal wavenumber directly from observations, unlike satellite-based climatological interpretations that often fit individual waves using predetermined frequencies and wavenumbers. Here, we extend this event study to a 9-year window, elucidating PWs’ seasonal variations and statistical occurrences during SSWs. The association between NMs and SSWs remains debated. While some studies affirm this association Pancheva \BOthers. (\APACyear2008); Yamazaki \BBA Matthias (\APACyear2019), while others challenge it Sassi \BOthers. (\APACyear2012). In additional, our zonal wavenumber estimations facilitate identifying the secondary waves of stationary PW (sPW) interactions with migrating tides and NMs which are indistinguishable in single-station spectral analyses as they have the same frequencies as the parent tides and NMs.
2 Data Analysis
The data utilized in this study are comprise of observations of mesosphere winds spanning from 2012 to 2020, obtained from two meteor radars situated at comparable latitudes but seperated in longitude by 109∘. One station is positioned in Mohe at coordinates 122∘E, 53.5∘N Y. Yu \BOthers. (\APACyear2013), while the second is situated in Collm, coordinates 13.0∘E, 51.3∘N Jacobi (\APACyear2012); Stober \BOthers. (\APACyear2021, \APACyear2022). Employing the methodology delineated by Hocking \BOthers. (\APACyear2001); Holdsworth \BOthers. (\APACyear2004) for the SKiYMET and ATRAD meteor radars, respectively, zonal and meridional wind components ( and ) are computed on an hourly basis within an altitude range spanning from 80.5 km to 95.5 km.
2.1 Estimation of Zonal Wavenumber
Following the methodology employed in Figure 2 of \citeAHe2022NC, the cross spectra between Mohe and Collm are computed for horizontal winds, as illustrated in Figure 1. This procedure involves computing cross-wavelet spectra of the zonal () and meridional () wind components separately at each altitude level, followed by summing these spectra and subsequently averaging the resultant sum across all altitudes. The cross spectrum enables the estimation of the zonal wavenumber () associated with the underlying wave, employing the phase difference technique (PDT).
Similar to other discrete spectral analyses, the PDT involves several assumptions, including adherence to the Nyquist sampling theorem. This principle dictates that the sampling frequency in both temporal and spatial domains must exceed twice the maximum frequency and wavenumber inherent in the signal. However, validating these assumptions through models is intrinsically insufficient, as sufficient validation necessitates complete knowledge of the signal, particularly its components at frequencies and wavenumbers surpassing the Nyquist rates, which often pose significant modeling challenges. In the PDT framework, prior knowledge allows a partial relaxation of the assumption regarding the Nyquist rate in space, as discussed in the context of the ”long-wave assumption” by \citeAHe2020GRLb. Notably, this assumption’s relaxation varies across scenarios, often guided by a predefined set of potential . The current study uses the relaxations defined in \citeAHe2022NC and \citeAHe2024 in dealing with the inter- and intra-diurnal spectra, respectively. These relaxations primarily aim to identify the simplest explanation among potential aliasing candidates beyond the Nyquist rate.
Another crucial assumption concerns the constraints of linear systems, where solving for a given number of unknowns necessitates an equal number of equations. Sampling from locations enables the estimation of wave amplitudes for up to different predefined wavenumbers within a specified time-frequency grid. In existing literature, the prevailing approach to studying the upper mesosphere involves = 1 analyses, conducted via single-station or -satellite spectral methods. These analyses operate under the single-wave assumption, presuming the presence of only one predominant wave within each discernible time-frequency grid. Consequently, in = 1 analyses, estimating wavenumber in the detector’s intrinsic coordinate system is infeasible, and wavenumber explanation is based on prior knowledge. Observations from an additional location allow for verifying the applicability of the single-wave assumption, for example, by comparing the phase difference between the locations with its expectation associated with the expected wavenumber. In practical applications in the PDT, this verification does not rely on the wavenumber expectation. Since different wave modes typically exhibit distinct evolutions in the time and frequency domains, the superposition of different wave modes is accompanied by phase differences that vary with time and frequency. This characteristic can be used to identify breaches in the single-wave assumption, as illustrated in Section 4.2. Conversely, a stable phase difference over time and frequency indicates that the single-wave assumption is being met. This phase difference is a function of the wavenumber and the separation between locations, thereby allowing for wavenumber estimation. Readers are referred to \citeAHe2023 for a review of the PDT approach implemented in a series of works involving both case and statistical studies, including PDT cross-validations using independently paired stations and consistent comparisons with estimations from three- or four-station analyses He, Forbes\BCBL \BOthers. (\APACyear2020); He, Chau\BCBL \BOthers. (\APACyear2021).
2.2 Composite Analysis
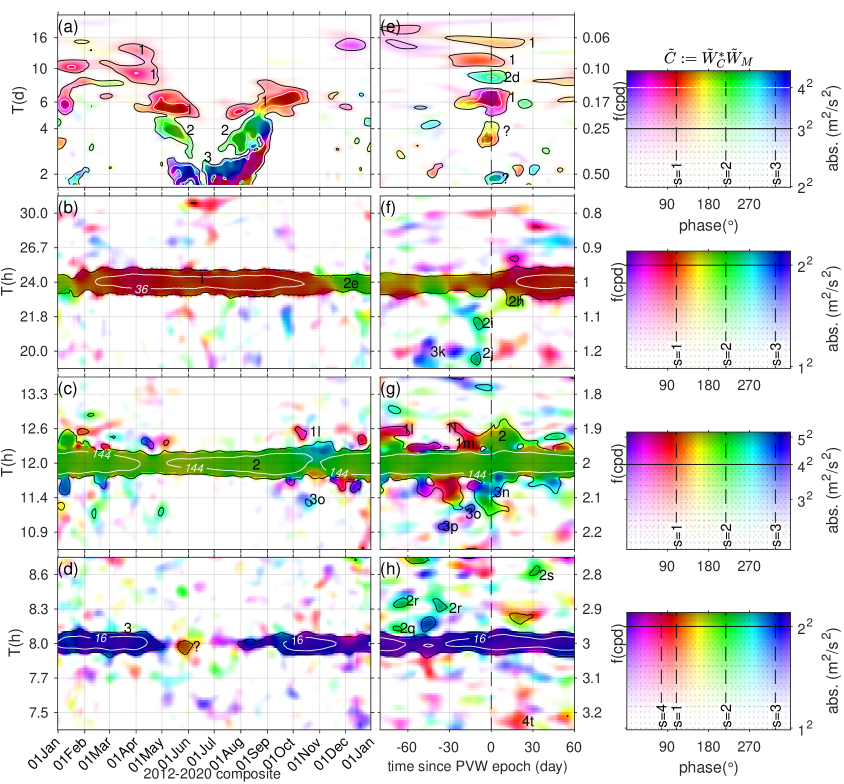
The spectra illustrated in Figure 1 are composited with regard to the day of year and to the central days of SSWs are delineated in Figures 2a–2d and 2e–2h, respectively. The identified central days, marked by vertical dashed lines in Figure 1, are as follows: 17-01-2012, 11-01-2013, 05-01-2015, 06-03-2016, 02-02-2017, 14-02-2018, and 31-12-2018. These reference days are determined based on the occurrences of polar vortex weakening events (PVWs), discerned through the analysis of eastward wind variation at 48 km altitude and 70∘N latitude, utilizing MERRA reanalysis data Zhang \BBA Forbes (\APACyear2014).
3 Results
Figure 1a presents the cross-wavelet spectrum for periods h–d from 2012 to 2020, in which the color intensity denotes the amplitudes, while hue indicates the phase difference between the Mohe and Collm radars, aiding in the estimation of the zonal wavenumber for dominant waves. Red, green, and blue hues correspond to wavenumbers , 2, and 3, respectively. The estimated , labeled at some dominant peaks as Arabic numerals ”1” and ”2” for and 2, shows dependence on the period , with most red peaks occurring at periods d, while green peaks predominate at d. For d, spectral peaks vary in color and predominantly appear in summer.
3.1 Seasonal Composite of Multi-day Spectra
Seasonal variations are detailed in the composite analyses in Figure 2a, where the most intense spectral peaks emerge in the summer half-year (from April to October), mostly at periods d. The summer spectral peaks manifest a distinct V-shaped distribution. From March to June, the predominant peaks exhibit monotonically decreasing periods (from days sequentially decreasing to 4, then 2 days), while the wavenumber sequentially increases from to 2, then 3. Subsequently, from July to October, the predominant peaks show an opposite trend: the period monotonically increases while the wavenumber decreases. This period-wavenumber elucidation of PW seasonality, covering periods greater than 3 days, is reported here for the first time.
Figure 2a furthermore unveils a magenta peak in July–August, at a period d. This peak may involve multiple quasi-two-day waves, as discussed in He, Forbes\BCBL \BOthers. (\APACyear2021), to which readers are referred for a comprehensive understanding of year-to-year and seasonal variability in the spectral segment with d. We will not reiterate these aspects here.
3.2 SSW Composite of Multi-day Spectra
Unlike summer, when the spectrum exhibits significant seasonality, the winter half-year (from November to February) manifests sporadic spectral peaks with diminished amplitudes. Notably, a conspicuous pattern is not readily discernible in Figure 2a during the winter half-year. Instead, the winter spectrum prominently reveals a dependence on SSWs, as evidenced, for instance, in Figure 1a for the early months of 2013, early 2018, and late 2018, where the spectra exhibit pronounced multi-peaks. The SSW composite spectrum manifests peaks at , 10, 8, 6, 4, and 2 days, as indicated by the digits or symbols ’1’, ’1’, ’2’, ’1’, ’?’ and ’?’ in Figure 2e, respectively. The first four digits identify the wavenumber diagnosed through the PDT, while the question symbols ”?” denote failures of wavenumber diagnosis. These failures are attributed to the mixing of waves with different wavenumbers, a discussion of which is provided in Section 4.
3.3 Near-24-, 12-, and 8-hour Spectra and Their Composites
Figures 1b–1d depict spectra similar to Figure 1a but spanning the frequency ranges cycles per day (cpd), cpd, and cpd, respectively. The composites of these spectra are illustrated in Figures 2b–2d and 2f–2h, with respect to the calendar month and the SSW reference days, respectively. In these representations and for most years, the 24-, 12-, and 8-hour spectra predominantly appear in red, green, and blue, indicating modes , , and , respectively. These modes correspond to the diurnal, semidiurnal, and terdiurnal migrating tides.
Diverging from these migrating tidal signatures and as indicated by the string ’2e’ in Figure 2b, the 24-hour spectrum exhibits a prevalence of green hues in November–December, suggesting , which is a signature of a non-migrating tide. Similarly, a non-migrating signature appears also at the period h. As indicated by the question symbol ”?” in Figure 2d, the 8-hour peak is not in blue colors in May–August but rather exhibits a complex color attributed in Section 4 to mixing of waves with different wavenumbers.
In Figure 2g, following the vertical dashed line at h, a green peak emerges, indicating , and implying a migrating semidiurnal lunar tide Forbes \BBA Zhang (\APACyear2012); He \BBA Chau (\APACyear2019) , though alternative explanations were also argued van Caspel \BOthers. (\APACyear2023); Fuller-Rowell \BOthers. (\APACyear2016).
Additionally, flanking the 24-, 12-, and 8-hour migrating tidal signatures in Figures 1 and 2 are scattered off-24-, 12-, and 8-hour spectral peaks, which will be further discussed in the subsequent section.
4 Discussions
Section 3 illustrated temporal variations of oscillations at the periods of multiple days, and near-24, -12, and -8 hours. The spectra are composted to highlight the seasonal variations and the statistical associations with SSW, and PDT is used to diagnose the zonal wavenumbers of underlying waves. The current section discusses the associated dynamics. Hereafter, we employ a pair of numbers enclosed in square brackets to denote waves, , where identifies the frequency in cpd, and signifies the zonal wavenumber.
4.1 Normal Modes
Most of the multi-day spectral peaks mentioned above can be attributed to the 16-, 10-, 6-, 4-, and 2-day PW NMs or Rossby gravity NMs, , and <for details, see¿[respectively]Forbes1995a,Forbes1995b,Forbes1995b,yamazaki2021,He2021g. Note that these frequencies represent the NMs in average observations, which differs from the intrinsic frequencies anticipated by classical theory due to the Doppler shift associated with the background wind.
Hence, observations of these waves are often prefaced with ”quasi-”, such as quasi-16-day and quasi-6-day waves. For instance, the mode can be anticipated in the range days based on \citeASalby1981, providing an explanation for all spectral peaks with wavenumber within this period range in Figure 1a. The enhancements of the quasi-6-, 4-, and 2-day NMs in the summer-half year have been investigated individually in various datasets <e.g.,¿[respectively]Talaat2001, yamazaki2021, He2021g. Here, Figure 2a reveals the seasonal variation of NMs with a single dataset in a single analysis. Apart from these NMs, Figure 1a also displays signatures of other NMs. For example, the red spectral peak () near d in February 2018 and the green spectral peak () near d in February 2019 can be attributed to the 28-day Zhao \BOthers. (\APACyear2019) and 7-day NMs Pogoreltsev \BOthers. (\APACyear2002), respectively.
In Figures 1a and 2a, a distinct winter-summer contrast emerges in the frequency distribution of NMs. Short-period NMs ( days) predominantly manifest during summer, while longer-period NMs ( days) are more prevalent in winter. This seasonal contrast can be qualitatively explained in terms of the longitudinal average of the zonal wind () and its influence on the PW phase velocity () as encapsulated by the inequalities Charney \BBA Drazin (\APACyear1961). The first inequality dictates westward propagation of PWs with respect to the background flow, determined by Earth’s rotation and the associated north-south gradient of relative vorticity Rossby (\APACyear1939); Andrews \BOthers. (\APACyear1987); He \BBA Forbes (\APACyear2022). The second inequality, defining a threshold (the critical velocity ) of , ensures a reversible distortion of potential vorticity contours. Beyond this threshold, the distortion becomes pronounced and irreversible, impeding PW propagation and leading to breaking. In the middle atmosphere at middle latitudes, the difference in between winter and summer primarily manifests as , with westerly during winter and easterly during summer Jacobi \BOthers. (\APACyear2009). Combining both and , it is reasonable to anticipate , implying that the winter atmosphere allows NMs with larger compared to those permitted in summer. Note that since is predominantly negative, larger during winter than summer indicates that waves in winter travel at a slower absolute velocity than in summer. In Figures 1a and 2a, the NMs prevalent in the winter half-year include, for instance, the 28-, 16-, and 10-day NMs associated with –9.7, –17.0, and –27.2 m/s, respectively, which are larger (namely slower) than the –45.4, –34.0, and –45.4 m/s of the 6-, 4-, and 2-day NMs predominantly observed in the summer half-year. It is noteworthy that the phase velocity is defined in the Earth-fixed frame as , where km defines the Earth’s radius, represents the latitude, and the negative symbol preceding indicates that a positive or denotes eastward motion, opposite to the positive direction. Also note that for the qualitative discussion above, we disregarded the dependence of on NMs’ horizontal wavelength.
During SSWs, undergoes a rapid transition from westerly to easterly within a short span of time. This reversal isn’t uniform; may stall at certain values for a while, resembling potentially winter- or summer-like conditions. Moreover, the progression of reversal varies across events, facilitating potentially the occurrence of winter- or summer-preferred NMs, as evidenced in Figure 2e. While sPWs are known to play a critical role in initiating SSWs Matsuno (\APACyear1971), the involvement of NMs in SSWs remains contentious. Some studies support the link between NMs and SSWs Pancheva \BOthers. (\APACyear2008); Yamazaki \BBA Matthias (\APACyear2019); He, Yamazaki\BCBL \BOthers. (\APACyear2020), while others do not Sassi \BOthers. (\APACyear2012). The results presented in our Figures 1 and 2 demonstrate a clear association from a statistical perspective rather than a one-to-one correspondence. Figure 1a shows that not every SSW is associated with NMs, and not all winter PWs are accompanied by SSWs. Our study contributes to resolving the debate over the association between NMs and SSWs.
While NMs effectively account for the majority of significant spectral peaks observed in Figures 2a and 2e, a limited number of exceptions occur. The first two exceptions are the near-2-day spectral peaks, in magenta and cyan in Figures 2a and 2e, respectively, both of which are denoted by the question marks ”?” in the Figures. Each of these peaks may comprise multiple wave components. Specifically, the magenta peak may consist of waves with wavenumber and –2, while the cyan peak may involve and 2 <for details see¿[respectively]He2021g,He2021gb. A third exception is discerned in the peak at days in Figure 2e, which may also entangle multiple spectral signatures, e.g., the red and green spectral peaks around SSWs 2012/2013 and 2018/2019 in Figure 1a, respectively. The green color suggests and is attributable to the NM , whereas the red color might result from the contamination of the NM . This speculation of contamination is founded on Figure 1a, where, during the 2012/2013 SSW, a singular spectral peak of almost uniform color spans from day to day, encompassing phase signals of both 6- and 4-day waves in principle. The last exception is the green peak at days in Figure 2e which will be detailed in Section 4.2.
4.2 Nonlinear interactions
Non-NM multi-day spectral peaks
In addition to the previously mentioned NMs, Figure 1a contains spectral peaks with that cannot be explained solely in terms of NMs but rather through secondary nonlinear interactions between different PWs. For an in-depth understanding of secondary non-linearity, readers are referred to \citeAHe2022NC. Through such interactions, two waves may generate two new waves, denoted as: . Here, ’1’ and ’2’ index the parent waves, while ’+’ and ’–’ denote secondary waves, known as upper sideband (USB) and lower sideband (LSB), respectively. In Figure 1a, the green peaks indicated by ’2a+’, ’2b+’, and’2c+’ are associated with estimation and could be explained as the USB of interactions between NMs , , and with sPWs as specified in Lines (a+), (b+), and (c+) in Table 1, respectively. Here, a potential aliasing for the estimation is , differing by only 33∘ in the color phase on the color map in Figure 1a. These aliases should not be neglected as they could be explained as the LSB of the nonlinear interactions of the previous NMs with the sPW as specified in Lines (a–), (b–), and (c–) in Table 1. Both [0,1] and [0,2] are frequently observed, though the [0,1] amplitude is statistically significantly stronger than the [0,2] Shi \BOthers. (\APACyear2021); Smith (\APACyear1997). Superposition between the green LSB- or SBU-like SWs ( or 2) with the red NM peaks () could further explain the spectral peaks arrowed in Figure 1a in 2015. These peaks exhibit complex colors, a combination of red, green, and yellow, which could be attributed to the overlapping of a red and a green peak with distinct evolution in the time and frequency domains. Such superposition between the SW-like wave and the NMs was reported in satellite data Ma \BOthers. (\APACyear2024).
In addition, the green peak labeled as ’2d’ at days in Figure 2e could be attributed to secondary harmonic generation of an NM as reported by \citeAHe2022NC and specified in Line (d) in Table 1. Figure 1a might also incorporate signatures of more nonlinear interactions, and our intention is to discuss the most typical ones rather than to provide an exhaustive list.
Non-migrating tidal signatures
Section 3.3 illustrated that while the 24-, 12-, and 8-hour spectra are dominated by migrating components [1,1], [2,2], and [3,3], there are also signatures of non-migrating tides. Specifically, the 24-hour green peak in December in Figure 2b can be explained in term of the interaction between the diurnal migrating tide and a sPW, [0,1], as specified in Line (e) Table 1. Similarly, the 8-hour green and red peaks in June 2020 and May 2015, indicated by the strings ’2g’ and ’4f’ in Figure 1d, can be explained as the LSB and USB of the interactions between the tide [3,3] and the sPW [0,1], as specified in Lines (f, g) in Table 1, respectively. The superposition of these secondary waves could account for the non-migrating tidal signature in Figure 2d that is indicated by the question symbol (?).
Tidal sidebands
In Figures 2b–2d, sporadic isolated spectral peaks are observed at off-12-hour periods. These peaks are commonly interpreted as secondary waves of interactions between tides and NMs. In Figure 2g, the red peaks, labeled ’1m’ and ’1l’ and associated with , signify the LSBs of interactions between the 12-hour migrating tide and NMs as specified in Lines (m,l) of Table 1. In contrast, the blue peaks, labeled ’3n’, ’3o’, and ’3p’ and associated with , represent the corresponding USBs specified in Lines (n–p) of Table 1. Similarly, the green peaks labeled ’2h’, ’2i’, and ’2j’ in Figure 2f, and the green and red peaks labeled ’2q’, ’2r’, ’2s’, and ’4t’ in Figure 2h, signify the nonlinear sidebands of diurnal and terdiurnal tides, as specified in Lines (h–k) and (q–t) of Table 1, respectively. Additionally, these ’3k’ and ’4t’ signatures in Figures 2f and 2h are attributable to non-migrating tidal sidebands of the interactions specified in Lines (f) and (h) of Table 1, respectively.
In existing literature using ground observations, the existence of tidal sidebands is primarily inferred from frequency matching. Here, we demonstrate the existence of sidebands based on both frequency and zonal wavenumber matching. Compared to the more commonly reported off-12-hour tidal sidebands, off-24-hour and off-8-hour sidebands are rarely, if ever, observed in the midlatitude mesosphere. Specifically, we present observational evidence for the NM nonlinear interactions with non-migrating tides and 8-hour tides for the first time. The novelty of these findings is highlighted in Table 1.
5 Conclusion
Utilizing meteor radar observations spanning nine years at two longitudes and 52°N latitude, this study investigates planetary-scale waves in mesospheric winds. By examining zonal wavenumbers across various time scales (multi-day, near-24-hour, -12-hour, and -8-hour), we distinguished NMs from other PWs, identified migrating and non-migrating tides, and diagnosed a variety of novel nonlinear interactions. Our statistical analysis revealed that PWs were primarily linked to NMs, which exhibit a specific period/wavenumber seasonality during the summer half-year and a winter association with SSWs. Notably, April showcased a prominent 6-day NM (with ), followed by a prevalence of 4- and 2-day NMs (with and , respectively) extending through June. Subsequent peaks in 2-, 4-, and 6-day NMs (with , , and , respectively) were observed from July to October. Our insights into seasonal variations are derived from observational determinations of frequency and zonal wavenumber, contrasting with satellite observations that often rely on fitting individual waves using predetermined frequencies and wavenumbers. Our findings on the statistical association between NMs and SSWs significantly contribute to resolving the ongoing debate on this topic. Additionally, for the first time, we identified evidence of frequency and zonal wavenumber matching for more than ten secondary waves resulting from nonlinear interactions among NMs (16-, 10-, and 6-day), tides (diurnal, semidiurnal, and terdiurnal; migrating and non-migrating), and sPWs These interactions represent three novel categories involving parent waves of sPWs, terdiurnal tides, and non-migrating tides. The sPW interactions could explain our finding that non-migrating tidal amplitudes surpass the corresponding migrating tides observed in the winter diurnal tide and summer terdiurnal tide. These non-migrating signatures are notable exceptions, as migrating components generally dominate diurnal, semidiurnal, and terdiurnal tides for most months.
Open Research
The hourly wind data from Mohe is provided by the Data Center for Geophysics, National Earth System Science Data Sharing Infrastructure at Beijing National Observatory of Space Environment, Institute of Geology and Geophysics, Chinese Academy of Sciences). The hourly wind data at Mohe and Collm are available in the World Data Center He (\APACyear2020) for Geophysics, Beijing, and Harvard Dataverse He \BOthers. (\APACyear2023) .
Acknowledgements.
This work is supported by the Chinese Meridian Project and the Specialized Research Fund for State Key Laboratory in China. Christoph Jacobi is supported by Deutsche Forschungsgemeinschaft grants JA 863/47-1. Gunter Stober is a member of the Oeschger Center for Climate Change Research. The authors declare that they have no competing financial interests.References
- Andrews \BOthers. (\APACyear1987) \APACinsertmetastarandrews1987{APACrefauthors}Andrews, D\BPBIG., Holton, J\BPBIR.\BCBL \BBA Leovy, C\BPBIB. \APACrefYear1987. \APACrefbtitleMiddle Atmosphere Dynamics Middle Atmosphere Dynamics. \APACaddressPublisherAcademic Press. \APACrefnoteGoogle-Books-ID: N1oNurYZefAC \PrintBackRefs\CurrentBib
- Charney \BBA Drazin (\APACyear1961) \APACinsertmetastarcharney1961{APACrefauthors}Charney, J\BPBIG.\BCBT \BBA Drazin, P\BPBIG. \APACrefYearMonthDay1961. \BBOQ\APACrefatitlePropagation of planetary-scale disturbances from the lower into the upper atmosphere Propagation of planetary-scale disturbances from the lower into the upper atmosphere.\BBCQ \APACjournalVolNumPagesJournal of Geophysical Research (1896-1977)66183-109. {APACrefURL} https://agupubs.onlinelibrary.wiley.com/doi/abs/10.1029/JZ066i001p00083 {APACrefDOI} https://doi.org/10.1029/JZ066i001p00083 \PrintBackRefs\CurrentBib
- Forbes (\APACyear1995) \APACinsertmetastarForbes1995b{APACrefauthors}Forbes, J\BPBIM. \APACrefYearMonthDay1995. \BBOQ\APACrefatitleTidal and planetary waves Tidal and planetary waves.\BBCQ \APACjournalVolNumPagesGeophysical Monograph Series8767–87. {APACrefURL} http://www.agu.org/books/gm/v087/GM087p0067/GM087p0067.shtml {APACrefDOI} 10.1029/GM087p0067 \PrintBackRefs\CurrentBib
- Forbes \BOthers. (\APACyear1995) \APACinsertmetastarForbes1995a{APACrefauthors}Forbes, J\BPBIM., Hagan, M\BPBIE., Miyahara, S., Vial, F., Manson, A\BPBIH., Meek, C\BPBIE.\BCBL \BBA Portnyagin, Y\BPBII. \APACrefYearMonthDay1995. \BBOQ\APACrefatitleQuasi 16-day oscillation in the mesosphere and lower thermosphere Quasi 16-day oscillation in the mesosphere and lower thermosphere.\BBCQ \APACjournalVolNumPagesJournal of Geophysical Research100D59149. {APACrefURL} http://doi.wiley.com/10.1029/94JD02157 {APACrefDOI} 10.1029/94JD02157 \PrintBackRefs\CurrentBib
- Forbes \BBA Zhang (\APACyear2012) \APACinsertmetastarForbes2012{APACrefauthors}Forbes, J\BPBIM.\BCBT \BBA Zhang, X. \APACrefYearMonthDay2012. \BBOQ\APACrefatitleLunar tide amplification during the January 2009 stratosphere warming event: Observations and theory Lunar tide amplification during the January 2009 stratosphere warming event: Observations and theory.\BBCQ \APACjournalVolNumPagesJournal of Geophysical Research: Space Physics117121–13. {APACrefDOI} 10.1029/2012JA017963 \PrintBackRefs\CurrentBib
- Forbes \BBA Zhang (\APACyear2015) \APACinsertmetastarForbes2015{APACrefauthors}Forbes, J\BPBIM.\BCBT \BBA Zhang, X. \APACrefYearMonthDay2015. \BBOQ\APACrefatitleQuasi-10-day wave in the atmosphere Quasi-10-day wave in the atmosphere.\BBCQ \APACjournalVolNumPagesJournal of Geophysical Research1202111,079–11,089. {APACrefDOI} 10.1002/2015JD023327 \PrintBackRefs\CurrentBib
- Forbes \BBA Zhang (\APACyear2017) \APACinsertmetastarForbes2017a{APACrefauthors}Forbes, J\BPBIM.\BCBT \BBA Zhang, X. \APACrefYearMonthDay2017. \BBOQ\APACrefatitleThe quasi-6 day wave and its interactions with solar tides The quasi-6 day wave and its interactions with solar tides.\BBCQ \APACjournalVolNumPagesJournal of Geophysical Research: Space Physics12244764–4776. {APACrefURL} http://doi.wiley.com/10.1002/2017JA023954 {APACrefDOI} 10.1002/2017JA023954 \PrintBackRefs\CurrentBib
- Fuller-Rowell \BOthers. (\APACyear2016) \APACinsertmetastarfuller-rowell2016{APACrefauthors}Fuller-Rowell, T\BPBIJ., Fang, T\BHBIW., Wang, H., Matthias, V., Hoffmann, P., Hocke, K.\BCBL \BBA Studer, S. \APACrefYearMonthDay2016. \BBOQ\APACrefatitleImpact of Migrating Tides on Electrodynamics During the January 2009 Sudden Stratospheric Warming Impact of Migrating Tides on Electrodynamics During the January 2009 Sudden Stratospheric Warming.\BBCQ \BIn \APACrefbtitleIonospheric Space Weather Ionospheric Space Weather (\BPGS 163–174). \APACaddressPublisherAmerican Geophysical Union (AGU). {APACrefURL} [2024-02-04]https://onlinelibrary.wiley.com/doi/abs/10.1002/9781118929216.ch14 \APACrefnoteSection: 14 _eprint: https://onlinelibrary.wiley.com/doi/pdf/10.1002/9781118929216.ch14 {APACrefDOI} 10.1002/9781118929216.ch14 \PrintBackRefs\CurrentBib
- Gong \BOthers. (\APACyear2018) \APACinsertmetastargong2018a{APACrefauthors}Gong, Y., Li, C., Ma, Z., Zhang, S., Zhou, Q., Huang, C.\BDBLNing, B. \APACrefYearMonthDay2018. \BBOQ\APACrefatitleStudy of the Quasi-5-Day Wave in the MLT Region by a Meteor Radar Chain Study of the Quasi-5-Day Wave in the MLT Region by a Meteor Radar Chain.\BBCQ \APACjournalVolNumPagesJournal of Geophysical Research: Atmospheres123179474–9487. {APACrefURL} [2024-02-09]https://onlinelibrary.wiley.com/doi/abs/10.1029/2018JD029355 \APACrefnote_eprint: https://onlinelibrary.wiley.com/doi/pdf/10.1029/2018JD029355 {APACrefDOI} 10.1029/2018JD029355 \PrintBackRefs\CurrentBib
- Gu \BOthers. (\APACyear2013) \APACinsertmetastarGu2013{APACrefauthors}Gu, S\BPBIY., Li, T., Dou, X., Wu, Q., Mlynczak, M\BPBIG.\BCBL \BBA Russell, J\BPBIM. \APACrefYearMonthDay2013. \BBOQ\APACrefatitleObservations of Quasi-Two-Day wave by TIMED/SABER and TIMED/TIDI Observations of Quasi-Two-Day wave by TIMED/SABER and TIMED/TIDI.\BBCQ \APACjournalVolNumPagesJournal of Geophysical Research Atmospheres11841624–1639. {APACrefDOI} 10.1002/jgrd.50191 \PrintBackRefs\CurrentBib
- He (\APACyear2020) \APACinsertmetastarHe2020Data1{APACrefauthors}He, M. \APACrefYearMonthDay2020. \APACrefbtitleThe hourly mesospheric winds over Mohe between 2012 and 2019. The hourly mesospheric winds over mohe between 2012 and 2019. \APACaddressPublisherWDC for Geophysics, Beijing. {APACrefDOI} 10.12197/2020GA016 \PrintBackRefs\CurrentBib
- He (\APACyear2023) \APACinsertmetastarHe2023{APACrefauthors}He, M. \APACrefYearMonthDay2023\APACmonth04. \BBOQ\APACrefatitlePlanetary-scale MLT waves diagnosed through multi-station methods: a review Planetary-scale MLT waves diagnosed through multi-station methods: a review.\BBCQ \APACjournalVolNumPagesEarth, Planets and Space75163. {APACrefURL} [2023-07-11]https://doi.org/10.1186/s40623-023-01808-5 {APACrefDOI} 10.1186/s40623-023-01808-5 \PrintBackRefs\CurrentBib
- He \BBA Chau (\APACyear2019) \APACinsertmetastarHe2019{APACrefauthors}He, M.\BCBT \BBA Chau, J\BPBIL. \APACrefYearMonthDay2019. \BBOQ\APACrefatitleMesospheric semidiurnal tides and near-12 h waves through jointly analyzing observations of five specular meteor radars from three longitudinal sectors at boreal midlatitudes Mesospheric semidiurnal tides and near-12 h waves through jointly analyzing observations of five specular meteor radars from three longitudinal sectors at boreal midlatitudes.\BBCQ \APACjournalVolNumPagesAtmospheric Chemistry and Physics1995993–6006. {APACrefURL} https://doi.org/10.5194/acp-19-5993-2019 {APACrefDOI} 10.5194/acp-19-5993-2019 \PrintBackRefs\CurrentBib
- He, Chau\BCBL \BOthers. (\APACyear2020) \APACinsertmetastarHe2020GRLb{APACrefauthors}He, M., Chau, J\BPBIL., Forbes, J\BPBIM., Thorsen, D., Li, G., Siddiqui, T\BPBIA.\BDBLHocking, W\BPBIK. \APACrefYearMonthDay2020. \BBOQ\APACrefatitleQuasi-10-Day Wave and Semidiurnal Tide Nonlinear Interactions During the Southern Hemispheric SSW 2019 Observed in the Northern Hemispheric Mesosphere Quasi-10-Day Wave and Semidiurnal Tide Nonlinear Interactions During the Southern Hemispheric SSW 2019 Observed in the Northern Hemispheric Mesosphere.\BBCQ \APACjournalVolNumPagesGeophysical Research Letters4723e2020GL091453. {APACrefURL} https://doi.org/10.1029/2020GL091453 {APACrefDOI} 10.1029/2020GL091453 \PrintBackRefs\CurrentBib
- He, Chau\BCBL \BOthers. (\APACyear2021) \APACinsertmetastarHe2021gb{APACrefauthors}He, M., Chau, J\BPBIL., Forbes, J\BPBIM., Zhang, X., Englert, C\BPBIR., Harding, B\BPBIJ.\BDBLMakela, J\BPBIJ. \APACrefYearMonthDay2021. \BBOQ\APACrefatitleQuasi-2-Day Wave in Low-Latitude Atmospheric Winds as Viewed From the Ground and Space During January–March, 2020 Quasi-2-Day Wave in Low-Latitude Atmospheric Winds as Viewed From the Ground and Space During January–March, 2020.\BBCQ \APACjournalVolNumPagesGeophysical Research Letters4813. {APACrefURL} https://doi.org/10.1029/2021GL093466 {APACrefDOI} 10.1029/2021GL093466 \PrintBackRefs\CurrentBib
- He, Chau, Hall\BCBL \BOthers. (\APACyear2018) \APACinsertmetastarHe2018g{APACrefauthors}He, M., Chau, J\BPBIL., Hall, C\BPBIM., Tsutsumi, M., Meek, C.\BCBL \BBA Hoffmann, P. \APACrefYearMonthDay2018. \BBOQ\APACrefatitleThe 16-Day Planetary Wave Triggers the SW1-Tidal-Like Signatures During 2009 Sudden Stratospheric Warming The 16-Day Planetary Wave Triggers the SW1-Tidal-Like Signatures During 2009 Sudden Stratospheric Warming.\BBCQ \APACjournalVolNumPagesGeophysical Research Letters452212,631–12,638. {APACrefURL} https://doi.org/10.1029/2018GL079798 {APACrefDOI} 10.1029/2018GL079798 \PrintBackRefs\CurrentBib
- He, Chau, Stober\BCBL \BOthers. (\APACyear2018) \APACinsertmetastarHe2018j{APACrefauthors}He, M., Chau, J\BPBIL., Stober, G., Li, G., Ning, B.\BCBL \BBA Hoffmann, P. \APACrefYearMonthDay2018. \BBOQ\APACrefatitleRelations Between Semidiurnal Tidal Variants Through Diagnosing the Zonal Wavenumber Using a Phase Differencing Technique Based on Two Ground-Based Detectors Relations Between Semidiurnal Tidal Variants Through Diagnosing the Zonal Wavenumber Using a Phase Differencing Technique Based on Two Ground-Based Detectors.\BBCQ \APACjournalVolNumPagesJournal of Geophysical Research: Atmospheres12384015–4026. {APACrefURL} https://doi.org/10.1002/2018JD028400 {APACrefDOI} 10.1002/2018JD028400 \PrintBackRefs\CurrentBib
- He \BBA Forbes (\APACyear2022) \APACinsertmetastarHe2022NC{APACrefauthors}He, M.\BCBT \BBA Forbes, J\BPBIM. \APACrefYearMonthDay2022\APACmonth12. \BBOQ\APACrefatitleRossby Wave Second Harmonic Generation Observed in the Middle Atmosphere Rossby wave second harmonic generation observed in the middle atmosphere.\BBCQ \APACjournalVolNumPagesNature Communications1317544. {APACrefDOI} 10.1038/s41467-022-35142-3 \PrintBackRefs\CurrentBib
- He, Forbes\BCBL \BOthers. (\APACyear2020) \APACinsertmetastarHe2020{APACrefauthors}He, M., Forbes, J\BPBIM., Chau, J\BPBIL., Li, G., Wan, W.\BCBL \BBA Korotyshkin, D\BPBIV. \APACrefYearMonthDay2020mar. \BBOQ\APACrefatitleHigh-Order Solar Migrating Tides Quench at SSW Onsets High-Order Solar Migrating Tides Quench at SSW Onsets.\BBCQ \APACjournalVolNumPagesGeophysical Research Letters4761–8. {APACrefURL} https://doi.org/10.1029/2019GL086778 {APACrefDOI} 10.1029/2019GL086778 \PrintBackRefs\CurrentBib
- He \BOthers. (\APACyear2024) \APACinsertmetastarHe2024{APACrefauthors}He, M., Forbes, J\BPBIM., Jacobi, C., Li, G., Liu, L., Stober, G.\BCBL \BBA Wang, C. \APACrefYearMonthDay2024. \BBOQ\APACrefatitleObservational Verification of High-Order Solar Tidal Harmonics in the Earth’s Atmosphere Observational Verification of High-Order Solar Tidal Harmonics in the Earth’s Atmosphere.\BBCQ \APACjournalVolNumPagesGeophysical Research Letters518e2024GL108439. {APACrefURL} [2024-04-24]https://onlinelibrary.wiley.com/doi/abs/10.1029/2024GL108439 \APACrefnote_eprint: https://onlinelibrary.wiley.com/doi/pdf/10.1029/2024GL108439 {APACrefDOI} 10.1029/2024GL108439 \PrintBackRefs\CurrentBib
- He, Forbes\BCBL \BOthers. (\APACyear2021) \APACinsertmetastarHe2021g{APACrefauthors}He, M., Forbes, J\BPBIM., Li, G., Jacobi, C.\BCBL \BBA Hoffmann, P. \APACrefYearMonthDay2021. \BBOQ\APACrefatitleMesospheric Q2DW Interactions With Four Migrating Tides at 53°N Latitude: Zonal Wavenumber Identification Through Dual-Station Approaches Mesospheric Q2DW Interactions With Four Migrating Tides at 53°N Latitude: Zonal Wavenumber Identification Through Dual-Station Approaches.\BBCQ \APACjournalVolNumPagesGeophysical Research Letters488e2020GL092237. {APACrefURL} https://doi.org/10.1029/2020GL092237 {APACrefDOI} 10.1029/2020GL092237 \PrintBackRefs\CurrentBib
- He \BOthers. (\APACyear2023) \APACinsertmetastarHe2023Data{APACrefauthors}He, M., Stober, G.\BCBL \BBA Jacobi, C. \APACrefYearMonthDay2023. \APACrefbtitleHourly mesospheric winds over Collm between 2012 and 2020. Hourly mesospheric winds over Collm between 2012 and 2020. \APACaddressPublisherHarvard Dataverse. {APACrefURL} {https://dataverse.harvard.edu/privateurl.xhtml?token=ba62bd31-d010-48af-b1d3-85bd8001b1d4} \PrintBackRefs\CurrentBib
- He, Yamazaki\BCBL \BOthers. (\APACyear2020) \APACinsertmetastarHe2020jd{APACrefauthors}He, M., Yamazaki, Y., Hoffmann, P., Hall, C\BPBIM., Tsutsumi, M., Li, G.\BCBL \BBA Chau, J\BPBIL. \APACrefYearMonthDay2020. \BBOQ\APACrefatitleZonal Wave Number Diagnosis of Rossby Wave-Like Oscillations Using Paired Ground-Based Radars Zonal Wave Number Diagnosis of Rossby Wave-Like Oscillations Using Paired Ground-Based Radars.\BBCQ \APACjournalVolNumPagesJournal of Geophysical Research: Atmospheres12512. {APACrefURL} https://doi.org/10.1029/2019JD031599 {APACrefDOI} 10.1029/2019JD031599 \PrintBackRefs\CurrentBib
- Hocking \BOthers. (\APACyear2001) \APACinsertmetastarHocking2001{APACrefauthors}Hocking, W\BPBIK., Fuller, B.\BCBL \BBA Vandepeer, B. \APACrefYearMonthDay2001. \BBOQ\APACrefatitleReal-time determination of meteor-related parameters utilizing modern digital technology Real-time determination of meteor-related parameters utilizing modern digital technology.\BBCQ \APACjournalVolNumPagesJournal of Atmospheric and Solar-Terrestrial Physics632155–169. {APACrefURL} https://doi.org/10.1016/S1364-6826(00)00138-3 {APACrefDOI} 10.1016/S1364-6826(00)00138-3 \PrintBackRefs\CurrentBib
- Hocking \BBA Kishore Kumar (\APACyear2011) \APACinsertmetastarhocking2011a{APACrefauthors}Hocking, W\BPBIK.\BCBT \BBA Kishore Kumar, G. \APACrefYearMonthDay2011\APACmonth08. \BBOQ\APACrefatitleLong term behaviour of the MLT quasi-7-day wave at two radar-sites at northern polar latitudes Long term behaviour of the MLT quasi-7-day wave at two radar-sites at northern polar latitudes.\BBCQ \APACjournalVolNumPagesJournal of Atmospheric and Solar-Terrestrial Physics73131616–1628. {APACrefURL} [2024-02-09]https://www.sciencedirect.com/science/article/pii/S1364682611000393 {APACrefDOI} 10.1016/j.jastp.2011.02.004 \PrintBackRefs\CurrentBib
- Holdsworth \BOthers. (\APACyear2004) \APACinsertmetastarHoldsworth:2004{APACrefauthors}Holdsworth, D\BPBIA., Reid, I\BPBIM.\BCBL \BBA Cervera, M\BPBIA. \APACrefYearMonthDay2004. \BBOQ\APACrefatitleBuckland Park all-sky interferometric meteor radar Buckland park all-sky interferometric meteor radar.\BBCQ \APACjournalVolNumPagesRadio Science395n/a–n/a. {APACrefURL} http://dx.doi.org/10.1029/2003RS003014 \APACrefnoteRS5009 {APACrefDOI} 10.1029/2003RS003014 \PrintBackRefs\CurrentBib
- Holton \BBA Hakim (\APACyear2012) \APACinsertmetastarHolton2013{APACrefauthors}Holton, J\BPBIR.\BCBT \BBA Hakim, G\BPBIJ. \APACrefYear2012. \APACrefbtitlean Introduction To Dynamic Meteorology an Introduction To Dynamic Meteorology (\BVOL 41) (\BNUM 5). \PrintBackRefs\CurrentBib
- Huang \BOthers. (\APACyear2013) \APACinsertmetastarhuang2013a{APACrefauthors}Huang, K\BPBIM., Liu, A\BPBIZ., Zhang, S\BPBID., Yi, F., Huang, C\BPBIM., Gan, Q.\BDBLZhang, Y\BPBIH. \APACrefYearMonthDay2013\APACmonth11. \BBOQ\APACrefatitleA nonlinear interaction event between a 16-day wave and a diurnal tide from meteor radar observations A nonlinear interaction event between a 16-day wave and a diurnal tide from meteor radar observations.\BBCQ \APACjournalVolNumPagesAnnales Geophysicae31112039–2048. {APACrefURL} [2024-04-24]https://angeo.copernicus.org/articles/31/2039/2013/ {APACrefDOI} 10.5194/angeo-31-2039-2013 \PrintBackRefs\CurrentBib
- Jacobi (\APACyear2012) \APACinsertmetastarJacobi2012{APACrefauthors}Jacobi, C. \APACrefYearMonthDay2012. \BBOQ\APACrefatitle6 year mean prevailing winds and tides measured by VHF meteor radar over Collm (51.3N, 13.0E) 6 year mean prevailing winds and tides measured by VHF meteor radar over Collm (51.3N, 13.0E).\BBCQ \APACjournalVolNumPagesJournal of Atmospheric and Solar-Terrestrial Physics78-798–18. {APACrefURL} http://www.sciencedirect.com/science/article/pii/S1364682611001210 {APACrefDOI} https://doi.org/10.1016/j.jastp.2011.04.010 \PrintBackRefs\CurrentBib
- Jacobi \BOthers. (\APACyear2009) \APACinsertmetastarjacobi2009b{APACrefauthors}Jacobi, C., Fröhlich, K., Portnyagin, Y., Merzlyakov, E., Solovjova, T., Makarov, N.\BDBLKürschner, D. \APACrefYearMonthDay2009. \BBOQ\APACrefatitleSemi-empirical model of middle atmosphere wind from the ground to the lower thermosphere Semi-empirical model of middle atmosphere wind from the ground to the lower thermosphere.\BBCQ \APACjournalVolNumPagesAdv. Space Res.43239-246. {APACrefDOI} 10.1016/j.asr.2008.05.011 \PrintBackRefs\CurrentBib
- Jacobi \BOthers. (\APACyear2008) \APACinsertmetastarJacobi2008{APACrefauthors}Jacobi, C., Hoffmann, P.\BCBL \BBA Kürschner, D. \APACrefYearMonthDay2008. \BBOQ\APACrefatitleTrends in MLT region winds and planetary waves, Collm (52∘N, 15∘E) Trends in mlt region winds and planetary waves, collm (52∘n, 15∘e).\BBCQ \APACjournalVolNumPagesAnn. Geophys.2651221–1232. {APACrefDOI} 10.5194/angeo-26-1221-2008 \PrintBackRefs\CurrentBib
- Jiang \BOthers. (\APACyear2008) \APACinsertmetastarJiang2008{APACrefauthors}Jiang, G., Xu, J., Xiong, J., Ma, R., Ning, B., Murayama, Y.\BDBLFranke, S\BPBIJ. \APACrefYearMonthDay2008. \BBOQ\APACrefatitleA case study of the mesospheric 6.5-day wave observed by radar systems A case study of the mesospheric 6.5-day wave observed by radar systems.\BBCQ \APACjournalVolNumPagesJournal of Geophysical Research Atmospheres113161–12. {APACrefDOI} 10.1029/2008JD009907 \PrintBackRefs\CurrentBib
- Ma \BOthers. (\APACyear2024) \APACinsertmetastarMa2024{APACrefauthors}Ma, Z., Gong, Y., Zhang, S., Xiao, Q., Huang, C.\BCBL \BBA Huang, K. \APACrefYearMonthDay2024. \BBOQ\APACrefatitleQuasi-5-Day Oscillations During Arctic Major Sudden Stratospheric Warmings From 2005 to 2021 Quasi-5-Day Oscillations During Arctic Major Sudden Stratospheric Warmings From 2005 to 2021.\BBCQ \APACjournalVolNumPagesJournal of Geophysical Research: Space Physics1294e2023JA032292. {APACrefURL} [2024-04-26]https://onlinelibrary.wiley.com/doi/abs/10.1029/2023JA032292 \APACrefnote_eprint: https://onlinelibrary.wiley.com/doi/pdf/10.1029/2023JA032292 {APACrefDOI} 10.1029/2023JA032292 \PrintBackRefs\CurrentBib
- Matsuno (\APACyear1971) \APACinsertmetastarMatsuno1971{APACrefauthors}Matsuno, T. \APACrefYearMonthDay1971nov. \BBOQ\APACrefatitleA Dynamical Model of the Stratospheric Sudden Warming A Dynamical Model of the Stratospheric Sudden Warming.\BBCQ \APACjournalVolNumPagesJournal of the Atmospheric Sciences2881479–1494. {APACrefURL} http://journals.ametsoc.org/doi/abs/10.1175/1520-0469{\%}281971{\%}29028{\%}3C1479{\%}3AADMOTS{\%}3E2.0.CO{\%}3B2 {APACrefDOI} 10.1175/1520-0469(1971)028¡1479:ADMOTS¿2.0.CO;2 \PrintBackRefs\CurrentBib
- McDonald \BOthers. (\APACyear2011) \APACinsertmetastarMcDonald2011{APACrefauthors}McDonald, A\BPBIJ., Hibbins, R\BPBIE.\BCBL \BBA Jarvis, M\BPBIJ. \APACrefYearMonthDay2011. \BBOQ\APACrefatitleProperties of the quasi 16 day wave derived from EOS MLS observations Properties of the quasi 16 day wave derived from EOS MLS observations.\BBCQ \APACjournalVolNumPagesJournal of Geophysical Research Atmospheres11661–16. {APACrefDOI} 10.1029/2010JD014719 \PrintBackRefs\CurrentBib
- Pancheva (\APACyear2001) \APACinsertmetastarPancheva2001{APACrefauthors}Pancheva, D. \APACrefYearMonthDay2001. \BBOQ\APACrefatitleNon-linear interaction of tides and planetary waves in the mesosphere and lower thermosphere: Observations over Europe Non-linear interaction of tides and planetary waves in the mesosphere and lower thermosphere: Observations over Europe.\BBCQ \APACjournalVolNumPagesPhysics and Chemistry of the Earth, Part C: Solar, Terrestrial and Planetary Science266411–418. {APACrefDOI} 10.1016/S1464-1917(01)00022-8 \PrintBackRefs\CurrentBib
- Pancheva \BBA Mitchell (\APACyear2004) \APACinsertmetastarPancheva2004{APACrefauthors}Pancheva, D.\BCBT \BBA Mitchell, N\BPBIJ. \APACrefYearMonthDay2004. \BBOQ\APACrefatitlePlanetary waves and variability of the semidiurnal tide in the mesosphere and lower thermosphere over Esrange (68??N, 21??E) during winter Planetary waves and variability of the semidiurnal tide in the mesosphere and lower thermosphere over Esrange (68??N, 21??E) during winter.\BBCQ \APACjournalVolNumPagesJournal of Geophysical Research: Space Physics109A8. {APACrefDOI} 10.1029/2004JA010433 \PrintBackRefs\CurrentBib
- Pancheva \BOthers. (\APACyear2008) \APACinsertmetastarPancheva2008jgr{APACrefauthors}Pancheva, D., Mukhtarov, P., Mitchell, N\BPBIJ., Merzlyakov, E., Smith, A\BPBIK., Andonov, B.\BDBLMurayama, Y. \APACrefYearMonthDay2008. \BBOQ\APACrefatitlePlanetary waves in coupling the stratosphere and mesosphere during the major stratospheric warming in 2003/2004 Planetary waves in coupling the stratosphere and mesosphere during the major stratospheric warming in 2003/2004.\BBCQ \APACjournalVolNumPagesJournal of Geophysical Research Atmospheres113121–22. {APACrefURL} http://dx.doi.org/10.1029/2007JD009011 {APACrefDOI} 10.1029/2007JD009011 \PrintBackRefs\CurrentBib
- Pogoreltsev \BOthers. (\APACyear2002) \APACinsertmetastarPogoreltsev2002a{APACrefauthors}Pogoreltsev, A\BPBII., Fedulina, I\BPBIN., Mitchell, N\BPBIJ., Muller, H\BPBIG., Luo, Y., Meek, C\BPBIE.\BCBL \BBA Manson, A\BPBIH. \APACrefYearMonthDay2002. \BBOQ\APACrefatitleGlobal free oscillations of the atmosphere and secondary planetary waves in the mesosphere and lower thermosphere region during August/September time conditions Global free oscillations of the atmosphere and secondary planetary waves in the mesosphere and lower thermosphere region during August/September time conditions.\BBCQ \APACjournalVolNumPagesJournal of Geophysical Research Atmospheres10724ACL 24–1–ACL 24–12. {APACrefURL} https://doi.org/10.1029/2001JD001535 {APACrefDOI} 10.1029/2001JD001535 \PrintBackRefs\CurrentBib
- Riggin \BOthers. (\APACyear2006) \APACinsertmetastarTalaat2001{APACrefauthors}Riggin, D\BPBIM., Liu, H\BPBIL., Lieberman, R\BPBIS., Roble, R\BPBIG., Russell, J\BPBIM., Mertens, C\BPBIJ.\BDBLVincent, R\BPBIA. \APACrefYearMonthDay2006. \BBOQ\APACrefatitleObservations of the 5-day wave in the mesosphere and lower thermosphere Observations of the 5-day wave in the mesosphere and lower thermosphere.\BBCQ \APACjournalVolNumPagesJournal of Atmospheric and Solar-Terrestrial Physics683-5323–339. {APACrefDOI} 10.1016/j.jastp.2005.05.010 \PrintBackRefs\CurrentBib
- Rossby (\APACyear1939) \APACinsertmetastarRossby1939{APACrefauthors}Rossby, C\BHBIG. \APACrefYearMonthDay1939. \BBOQ\APACrefatitleRelation between variations in the intensity of the zonal circulation of the atmosphere and the displacements of the semi-permanent centers of action Relation between variations in the intensity of the zonal circulation of the atmosphere and the displacements of the semi-permanent centers of action.\BBCQ \APACjournalVolNumPagesJournal of Marine Research2138–55. {APACrefDOI} 10.1357/002224039806649023 \PrintBackRefs\CurrentBib
- Salby (\APACyear1981) \APACinsertmetastarSalby1981{APACrefauthors}Salby, M\BPBIL. \APACrefYearMonthDay1981. \BBOQ\APACrefatitleRossby normal modes in nonuniform background configurations. Part II: Equinox and solstice conditions. Rossby normal modes in nonuniform background configurations. Part II: Equinox and solstice conditions.\BBCQ \APACjournalVolNumPagesJournal of the Atmospheric Sciences3891827–1840. {APACrefDOI} 10.1175/1520-0469(1981)038¡1827:RNMINB¿2.0.CO;2 \PrintBackRefs\CurrentBib
- Sassi \BOthers. (\APACyear2012) \APACinsertmetastarSassi2012{APACrefauthors}Sassi, F., Garcia, R\BPBIR.\BCBL \BBA Hoppel, K\BPBIW. \APACrefYearMonthDay2012. \BBOQ\APACrefatitleLarge-Scale Rossby Normal Modes during Some Recent Northern Hemisphere Winters Large-Scale Rossby Normal Modes during Some Recent Northern Hemisphere Winters.\BBCQ \APACjournalVolNumPagesJournal of the Atmospheric Sciences693820–839. {APACrefDOI} 10.1175/jas-d-11-0103.1 \PrintBackRefs\CurrentBib
- Shi \BOthers. (\APACyear2021) \APACinsertmetastarshi2021{APACrefauthors}Shi, Y., Evtushevsky, O., Shulga, V., Milinevsky, G., Klekociuk, A., Andrienko, Y.\BCBL \BBA Han, W. \APACrefYearMonthDay2021\APACmonth01. \BBOQ\APACrefatitleMid-Latitude Mesospheric Zonal Wave 1 and Wave 2 in Recent Boreal Winters Mid-Latitude Mesospheric Zonal Wave 1 and Wave 2 in Recent Boreal Winters.\BBCQ \APACjournalVolNumPagesRemote Sensing13183749. {APACrefURL} [2024-05-30]https://www.mdpi.com/2072-4292/13/18/3749 \APACrefnoteNumber: 18 Publisher: Multidisciplinary Digital Publishing Institute {APACrefDOI} 10.3390/rs13183749 \PrintBackRefs\CurrentBib
- Smith (\APACyear1997) \APACinsertmetastarsmith1997{APACrefauthors}Smith, A\BPBIK. \APACrefYearMonthDay1997\APACmonth08. \BBOQ\APACrefatitleStationary Planetary Waves in Upper Mesospheric Winds Stationary Planetary Waves in Upper Mesospheric Winds.\BBCQ \APACjournalVolNumPagesJournal of the Atmospheric Sciences54162129–2145. {APACrefURL} [2024-05-13]https://journals.ametsoc.org/view/journals/atsc/54/16/1520-0469_1997_054_2129_spwium_2.0.co_2.xml \APACrefnotePublisher: American Meteorological Society Section: Journal of the Atmospheric Sciences {APACrefDOI} 10.1175/1520-0469(1997)054¡2129:SPWIUM¿2.0.CO;2 \PrintBackRefs\CurrentBib
- Sridharan \BOthers. (\APACyear2006) \APACinsertmetastarsridharan2006{APACrefauthors}Sridharan, S., Tsuda, T., Nakamura, T., Vincent, R\BPBIA.\BCBL \BBA Effendy. \APACrefYearMonthDay2006. \BBOQ\APACrefatitleA Report on Radar Observations of 5-8-day Waves in the Equatorial MLT Region A Report on Radar Observations of 5-8-day Waves in the Equatorial MLT Region.\BBCQ \APACjournalVolNumPagesJournal of the Meteorological Society of Japan. Ser. II84A295–304. {APACrefDOI} 10.2151/jmsj.84A.295 \PrintBackRefs\CurrentBib
- Stober \BOthers. (\APACyear2021) \APACinsertmetastarStober2021{APACrefauthors}Stober, G., Kuchar, A., Pokhotelov, D., Liu, H., Liu, H\BHBIL., Schmidt, H.\BDBLMitchell, N. \APACrefYearMonthDay2021. \BBOQ\APACrefatitleInterhemispheric differences of mesosphere–lower thermosphere winds and tides investigated from three whole-atmosphere models and meteor radar observations Interhemispheric differences of mesosphere–lower thermosphere winds and tides investigated from three whole-atmosphere models and meteor radar observations.\BBCQ \APACjournalVolNumPagesAtmospheric Chemistry and Physics211813855–13902. {APACrefURL} https://acp.copernicus.org/articles/21/13855/2021/ {APACrefDOI} 10.5194/acp-21-13855-2021 \PrintBackRefs\CurrentBib
- Stober \BOthers. (\APACyear2022) \APACinsertmetastarStober_2022_3DVAR+DIV{APACrefauthors}Stober, G., Liu, A., Kozlovsky, A., Qiao, Z., Kuchar, A., Jacobi, C.\BDBLMitchell, N. \APACrefYearMonthDay2022. \BBOQ\APACrefatitleMeteor radar vertical wind observation biases and mathematical debiasing strategies including the 3DVAR+DIV algorithm Meteor radar vertical wind observation biases and mathematical debiasing strategies including the 3dvar+div algorithm.\BBCQ \APACjournalVolNumPagesAtmospheric Measurement Techniques15195769–5792. {APACrefURL} https://amt.copernicus.org/articles/15/5769/2022/ {APACrefDOI} 10.5194/amt-15-5769-2022 \PrintBackRefs\CurrentBib
- Teitelbaum \BBA Vial (\APACyear1991) \APACinsertmetastarTeitelbaum1991{APACrefauthors}Teitelbaum, H.\BCBT \BBA Vial, F. \APACrefYearMonthDay1991aug. \BBOQ\APACrefatitleOn tidal variability induced by nonlinear interaction with planetary waves On tidal variability induced by nonlinear interaction with planetary waves.\BBCQ \APACjournalVolNumPagesJournal of Geophysical Research: Space Physics96A814169–14178. {APACrefURL} http://doi.wiley.com/10.1029/91JA01019 {APACrefDOI} 10.1029/91ja01019 \PrintBackRefs\CurrentBib
- van Caspel \BOthers. (\APACyear2023) \APACinsertmetastarCaspel_2023_NAVGEM_tides{APACrefauthors}van Caspel, W\BPBIE., Espy, P., Hibbins, R., Stober, G., Brown, P., Jacobi, C.\BCBL \BBA Kero, J. \APACrefYearMonthDay2023. \BBOQ\APACrefatitleA Case Study of the Solar and Lunar Semidiurnal Tide Response to the 2013 Sudden Stratospheric Warming A case study of the solar and lunar semidiurnal tide response to the 2013 sudden stratospheric warming.\BBCQ \APACjournalVolNumPagesJournal of Geophysical Research: Space Physics1289e2023JA031680. {APACrefURL} https://agupubs.onlinelibrary.wiley.com/doi/abs/10.1029/2023JA031680 \APACrefnotee2023JA031680 2023JA031680 {APACrefDOI} https://doi.org/10.1029/2023JA031680 \PrintBackRefs\CurrentBib
- Yamazaki \BBA Matthias (\APACyear2019) \APACinsertmetastarYamazaki2019{APACrefauthors}Yamazaki, Y.\BCBT \BBA Matthias, V. \APACrefYearMonthDay2019. \BBOQ\APACrefatitleLarge Amplitude Quasi-10-day Waves in the Middle Atmosphere during Final Warmings Large Amplitude Quasi-10-day Waves in the Middle Atmosphere during Final Warmings.\BBCQ \APACjournalVolNumPagesJ.Geophys. Res.1–19. {APACrefDOI} 10.1029/2019JD030634 \PrintBackRefs\CurrentBib
- Yamazaki \BOthers. (\APACyear2021) \APACinsertmetastaryamazaki2021{APACrefauthors}Yamazaki, Y., Matthias, V.\BCBL \BBA Miyoshi, Y. \APACrefYearMonthDay2021. \BBOQ\APACrefatitleQuasi-4-Day Wave: Atmospheric Manifestation of the First Symmetric Rossby Normal Mode of Zonal Wavenumber 2 Quasi-4-Day Wave: Atmospheric Manifestation of the First Symmetric Rossby Normal Mode of Zonal Wavenumber 2.\BBCQ \APACjournalVolNumPagesJournal of Geophysical Research: Atmospheres12613e2021JD034855. {APACrefDOI} 10.1029/2021JD034855 \PrintBackRefs\CurrentBib
- F\BPBIR. Yu \BOthers. (\APACyear2019) \APACinsertmetastaryu2019a{APACrefauthors}Yu, F\BPBIR., Huang, K\BPBIM., Zhang, S\BPBID., Huang, C\BPBIM., Yi, F., Gong, Y.\BDBLNing, B. \APACrefYearMonthDay2019. \BBOQ\APACrefatitleQuasi 10- and 16-Day Wave Activities Observed Through Meteor Radar and MST Radar During Stratospheric Final Warming in 2015 Spring Quasi 10- and 16-Day Wave Activities Observed Through Meteor Radar and MST Radar During Stratospheric Final Warming in 2015 Spring.\BBCQ \APACjournalVolNumPagesJournal of Geophysical Research: Atmospheres124126040–6056. {APACrefURL} [2024-02-09]https://onlinelibrary.wiley.com/doi/abs/10.1029/2019JD030630 \APACrefnote_eprint: https://onlinelibrary.wiley.com/doi/pdf/10.1029/2019JD030630 {APACrefDOI} 10.1029/2019JD030630 \PrintBackRefs\CurrentBib
- Y. Yu \BOthers. (\APACyear2013) \APACinsertmetastarYu2013{APACrefauthors}Yu, Y., Wan, W., Ning, B., Liu, L., Wang, Z., Hu, L.\BCBL \BBA Ren, Z. \APACrefYearMonthDay2013. \BBOQ\APACrefatitleTidal wind mapping from observations of a meteor radar chain in December 2011 Tidal wind mapping from observations of a meteor radar chain in December 2011.\BBCQ \APACjournalVolNumPagesJournal of Geophysical Research: Space Physics11852321–2332. {APACrefURL} https://agupubs.onlinelibrary.wiley.com/doi/abs/10.1029/2012JA017976 {APACrefDOI} 10.1029/2012JA017976 \PrintBackRefs\CurrentBib
- Zaqarashvili \BOthers. (\APACyear2021) \APACinsertmetastarZaqarashvili2021{APACrefauthors}Zaqarashvili, T\BPBIV., Albekioni, M., Ballester, J\BPBIL., Bekki, Y., Biancofiore, L., Birch, A\BPBIC.\BDBLYellin-Bergovoy, R. \APACrefYearMonthDay2021. \BBOQ\APACrefatitleRossby Waves in Astrophysics Rossby Waves in Astrophysics.\BBCQ \APACjournalVolNumPagesSpace Science Reviews217115. {APACrefURL} https://doi.org/10.1007/s11214-021-00790-2 {APACrefDOI} 10.1007/s11214-021-00790-2 \PrintBackRefs\CurrentBib
- Zhang \BBA Forbes (\APACyear2014) \APACinsertmetastarZhang2014a{APACrefauthors}Zhang, X.\BCBT \BBA Forbes, J\BPBIM. \APACrefYearMonthDay2014dec. \BBOQ\APACrefatitleLunar tide in the thermosphere and weakening of the northern polar vortex Lunar tide in the thermosphere and weakening of the northern polar vortex.\BBCQ \APACjournalVolNumPagesGeophysical Research Letters41238201–8207. {APACrefURL} http://doi.wiley.com/10.1002/2014GL062103 {APACrefDOI} 10.1002/2014GL062103 \PrintBackRefs\CurrentBib
- Zhao \BOthers. (\APACyear2019) \APACinsertmetastarZhao2019{APACrefauthors}Zhao, Y., Taylor, M\BPBIJ., Pautet, P\BHBID., Moffat-Griffin, T., Hervig, M\BPBIE., Murphy, D\BPBIJ.\BDBLRussell III, J\BPBIM. \APACrefYearMonthDay2019. \BBOQ\APACrefatitleInvestigating an Unusually Large 28-Day Oscillation in Mesospheric Temperature Over Antarctica Using Ground-Based and Satellite Measurements Investigating an Unusually Large 28-Day Oscillation in Mesospheric Temperature Over Antarctica Using Ground-Based and Satellite Measurements.\BBCQ \APACjournalVolNumPagesJournal of Geophysical Research: Atmospheres124158576–8593. {APACrefURL} https://agupubs.onlinelibrary.wiley.com/doi/abs/10.1029/2019JD030286 {APACrefDOI} 10.1029/2019JD030286 \PrintBackRefs\CurrentBib

| Index |
|
|
|
|
|
||||||||||
| (a) | |||||||||||||||
| (a) | Meaningless | First-time disclosure | |||||||||||||
| (b) | |||||||||||||||
| (b) | Meaningless | First-time disclosure | |||||||||||||
| (c) | \citeAHe2020 | ||||||||||||||
| (c) | Meaningless | First-time proposed | |||||||||||||
| (d) | \citeAHe2022NC | \citeAHe2022NC | |||||||||||||
| (e) | Meaningless | First-time disclosure | |||||||||||||
| (f) | Meaningless | First-time disclosure | |||||||||||||
| (g) | Meaningless | First-time disclosure | |||||||||||||
| (h) | \citeAhuang2013a | First-time disclosure | |||||||||||||
| (i) | First-time disclosure | ||||||||||||||
| (j) | First-time disclosure | ||||||||||||||
| (k) | \citeATeitelbaum1991∗ | First-time disclosure | |||||||||||||
| (l) | \citeAPancheva2004 | \citeAHe2018g | |||||||||||||
| (m) | \citeAPancheva2004 | \citeAHe2020GRLb | |||||||||||||
| (n) | \citeAPancheva2001 | \citeAHe2018j | |||||||||||||
| (o) | \citeAPancheva2001 | \citeAHe2020GRLb | |||||||||||||
| (p) | \citeAPancheva2001 | First-time disclosure | |||||||||||||
| (q) | First-time disclosure | First-time disclosure | |||||||||||||
| (r) | First-time disclosure | First-time disclosure | |||||||||||||
| (s) | First-time disclosure | First-time disclosure | |||||||||||||
| (t) | First-time disclosure | First-time disclosure |
*The spectral analysis in \citeATeitelbaum1991 did not discern between these interactions (i), (j) and (k), even only in the frequency domain. By integrating zonal wavenumber diagnosis and ensuring proper frequency resolution, our current work distinguishes between these interactions.