PSBD: Prediction Shift Uncertainty Unlocks
Backdoor Detection
Abstract
Deep neural networks are susceptible to backdoor attacks, where adversaries manipulate model predictions by inserting malicious samples into the training data. Currently, there is still a lack of direct filtering methods for identifying suspicious training data to unveil potential backdoor samples. In this paper, we propose a novel method, Prediction Shift Backdoor Detection (PSBD), leveraging an uncertainty-based approach requiring minimal unlabeled clean validation data. PSBD is motivated by an intriguing Prediction Shift (PS) phenomenon, where poisoned models’ predictions on clean data often shift away from true labels towards certain other labels with dropout applied during inference, while backdoor samples exhibit less PS. We hypothesize PS results from neuron bias effect, making neurons favor features of certain classes. PSBD identifies backdoor training samples by computing the Prediction Shift Uncertainty (PSU), the variance in probability values when dropout layers are toggled on and off during model inference. Extensive experiments have been conducted to verify the effectiveness and efficiency of PSBD, which achieves state-of-the-art results among mainstream detection methods. Codes are available at https://github.com/WL-619/PSBD.
1 Introduction
The proliferation of Deep Neural Networks (DNNs) has heralded a new era in artificial intelligence, driving progress across diverse sectors, including autonomous driving and healthcare personalization [1, 2]. Yet, as their application scope broadens, DNNs have become increasingly vulnerable, particularly from a security standpoint. One of the most notable threats in this arena is the rise of backdoor attacks [3, 4, 5, 6]. These attacks involve the surreptitious insertion of altered samples into training data, enabling attackers to subtly manipulate a DNN’s output, leading to incorrect predictions under certain triggers. The implications of such vulnerabilities are especially severe in contexts demanding high security or safety, as they can lead to catastrophic outcomes [7, 8].
Notwithstanding an increased recognition of these risks, there are many different type of defense strategies currently, such as backdoor model reconstruction [9, 10, 11, 12], backdoor model detection [13, 14, 15, 16], and poison suppression [17]. However, the majority of these methods primarily focus on determining whether trained models contain backdoors or on mitigating the impact of such vulnerabilities. In contrast, there is a noticeable shortage of advanced and efficient approaches that can proactively identify backdoor training samples at the initial stages. Current research in identifying backdoor training data often suffers from either a low true positive rate - indicating a low detection rate of backdoor training data, or a high false positive rate - indicating a high error rate in identifying clean training data [18, 19, 20, 21], as detailed in Table 1. This issue is largely attributed to the focus of most existing research on data-level operations without utilizing the inherent properties of the models themselves.

To address this identified gap, we offer a new perspective - the model predictive uncertainty and propose a novel backdoor data detection approach named Prediction Shift Backdoor Detection (PSBD), which is inspired by an intriguing Prediction Shift (PS) phenomenon. The PS phenomenon is observed when the predictions made by a poisoned model on clean data tend to deviate from the correct labels, moving towards other certain labels, especially when dropout is used during inference. Conversely, the predictions on backdoor data generated by both classical and advanced attacks remain relatively stable. This observation of PS led us to hypothesize the existence of a weights-neuron bias in DNN models, which we called the “neuron bias” effect, where some certain paths in the network become predisposed towards the specific class after training, and the backdoor samples have different paths compared with clean data. Driven by these insights, Prediction Shift Uncertainty (PSU) is designed to measure the strength of PS that computes the variability in prediction confidences when a model evaluates a sample with both enabled and disabled dropout. A lower PSU value indicates a higher likelihood of the sample being malicious. By calculating PSU, we can effectively segregate backdoor data from clean data using a small set of label-free clean validation data, thus laying the groundwork for the PSBD approach. Figure 1 provides an overview of the PSBD framework. Our approach represents a significant stride in backdoor data detection. Unlike existing methods, it focuses on the inherent uncertainty within the model, analyzing how dropout influences prediction probabilities of clean and backdoor samples.
To summarize, our main contributions are four-fold:
-
•
We reveal the PS phenomenon, showing that poisoned model predictions on clean data tend to deviate from ground true labels towards specific other labels when dropout is applied during inference, while backdoor data exhibits less PS.
-
•
We present a novel insight into the vulnerability of DNNs to backdoor attacks, linking it to the model’s inherent predictive uncertainty. Our analysis delves into the impact of dropout on PS and introduces the concept of“neuron bias” within DNN models.
-
•
We propose the PSBD method, a simple yet powerful uncertainty-based approach for detecting backdoor training data, marking a significant advancement in the field.
-
•
We conduct extensive experiments across multiple benchmark datasets, rigorously evaluating our method under diverse attack scenarios and comparing it with a variety of defenses, thereby demonstrating its effectiveness and robustness.
2 Related Work
In this section, we explore the existing literature on backdoor attacks in neural networks and the defense strategies developed to counter them.
Backdoor Attacks
Backdoor attacks are particularly dangerous, injecting triggers into a target model that cause it to misclassify inputs containing these triggers while operating normally on unaltered samples [3, 22, 23]. Initial approaches to backdoor attacks, such as BadNets [3] and Blend attacks [23], involved embedding obvious trigger patterns like square patches into the input data. These methods evolved into more covert techniques, like clean-label attacks [24], which subtly poison samples of the target class using adversarial methods without obvious label changes, enhancing their stealthiness. Recent advancements have led to even more refined attacks, like WaNet [5], which introduces triggers that are specific to individual samples and less noticeable.
Backdoor Defenses
In response to backdoor attacks, a multitude of defense strategies has been developed by researchers. These include efforts for backdoor trigger recovery [25, 26, 27, 28, 29], which focus on identifying and reverse-engineering the attacker’s trigger, and strategies for backdoor model reconstruction [10, 11, 12], aimed at purging the backdoor model of its malicious elements. Methods for model detection [13, 14, 15, 16] are employed to ascertain whether a model has been tainted with backdoor samples. Despite the diversity and innovation in these defenses, they generally do not address the detection of backdoor data. Techniques targeting backdoor data detection primarily concentrate on altering input data [18, 19], uncovering input masks [20], or distinguishing the feature representations of backdoor and benign samples [21]. Nevertheless, these methods consider varying inputs and often experience low detection rates of backdoor training data or high error rates in identifying clean training data, as both clean and backdoor features can either remain intact or disappear when inputs are scaled. Our paper highlights the shortcomings of relying on input data variability and introduces a novel detection method that leverages model-level uncertainty, thereby surpassing the performance of methods based on input uncertainty.
3 Preliminaries
3.1 Backdoor Attacks and Our Objective
Backdoor attacks in machine learning involve embedding a covert behavior into a neural network during training. This is typically done by poisoning the training dataset with a set of malicious examples , such that the poisoned training dataset becomes , where represents the clean part of the training dataset. The objective function for training a model with a poisoned training dataset can be represented as , where denotes the model parameters and is the loss function. The model behaves normally on standard inputs but produces specific, attacker-chosen target label when a particular trigger is present. Such vulnerabilities pose a serious risk, especially in applications where model integrity is critical. Our objective is to maximize the detection of backdoor instances in while minimizing the instances in falsely identified as backdoor data.
3.2 Threat Model
In our framework, we consider distinct capabilities and objectives for the attacker and defender within a black-box context. These roles are outlined as follows:
Attacker’s Capabilities and Objectives.
The attacker has the ability to poison the training dataset but lacks insight into the training process itself. The primary objective is to manipulate the training data so that the model being trained exhibits erroneous behavior during testing when a specific trigger is present in the input, while maintaining standard performance on benign inputs.
Defender’s Capabilities and Objectives.
The primary goal of the defender is to ascertain which training data samples have been compromised by backdoor poisoning. In this scenario, the defender has full control over the training process. Given a suspicious poisoned dataset, the defender is allowed to freely use it to train the model, adopting any model architecture and training strategies. The defender lacks prior information regarding several key aspects: the existence of backdoor samples within the dataset, the proportion of these poisoned samples, the nature of the attack (including the trigger pattern and target label), and the specific class from which the backdoor samples originate. Additionally, we also assume that the defender possesses a limited set of extra label-free clean validation data, and it is also prevalent in many prior works that study backdoor defenses [22, 30, 31].
3.3 Dropout Layers in Neural Networks
Dropout is a regularization technique that mitigates overfitting in neural networks. It randomly deactivates a subset of neurons during training, which can be mathematically described as , where is the output vector of a layer, is a binary mask vector where each element is independently drawn from a Bernoulli distribution with probability (dubbed dropout rate), and denotes element-wise multiplication. During training, the expected output of a neuron is scaled by , as only a fraction of the neurons are active. In many practical implementations, all neurons are active during inference, but their outputs are scaled by to account for the larger active network, ensuring consistency between the training and inference phases. In our study, inference-phase dropout is implemented.
4 Method
In this section, we offer a new perspective on the inherent predictive uncertainty within the model for the vulnerability of DNNs to backdoor attacks. We begin with two pilot studies to explore the predictive uncertainty of the model on the clean data and backdoor data. Then, we present our detection method, Prediction Shift Backdoor Detection (PSBD).
4.1 A Spark of Inspiration: MC-Dropout Predictive Uncertainty
The model uncertainty is a metric that measures the extent to which the model’s predictions can be trusted, and can be understood as what a model does not know. One is mainly interested in the model uncertainty that is propagated onto a prediction, the so-called predictive uncertainty [32]. Previous work has indicated that backdoor data contains robust features and is potentially easier to learn compared to clean data [17, 14]. Therefore, we expect that the model should exhibit lower uncertainty towards backdoor data compared to clean data.
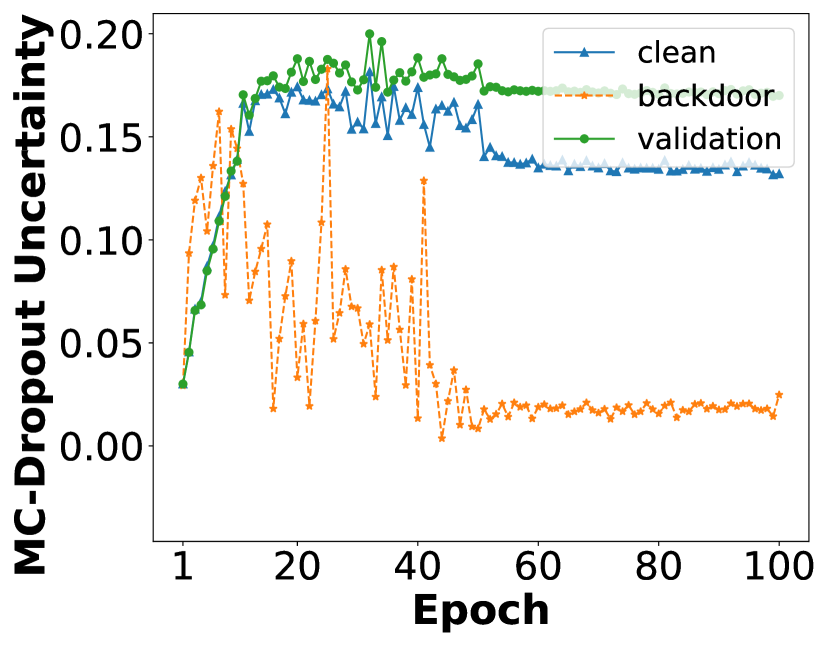
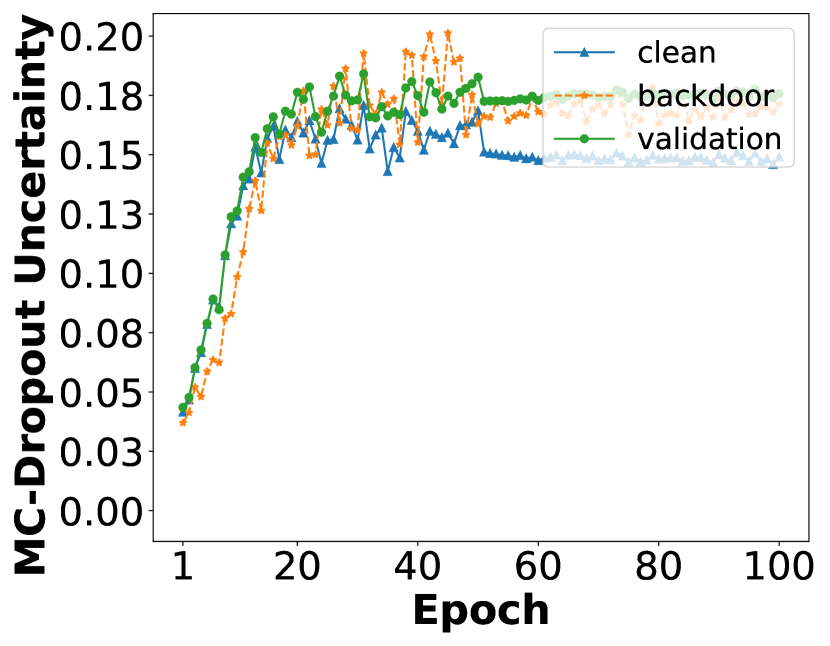
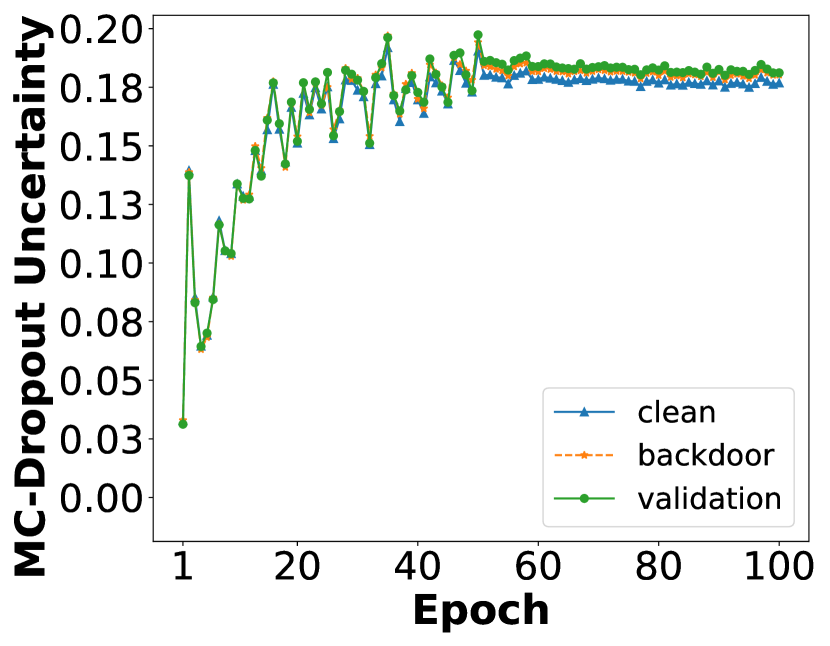
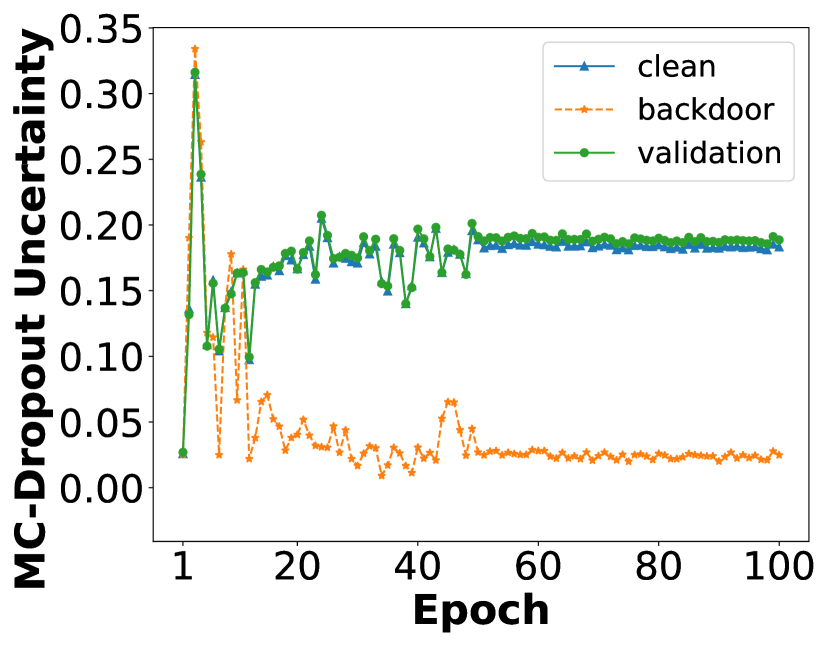
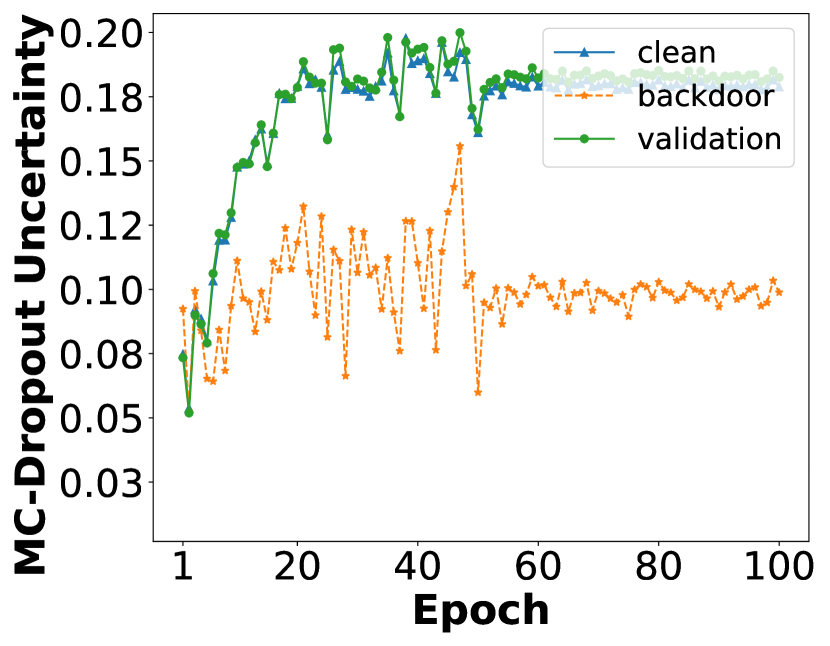
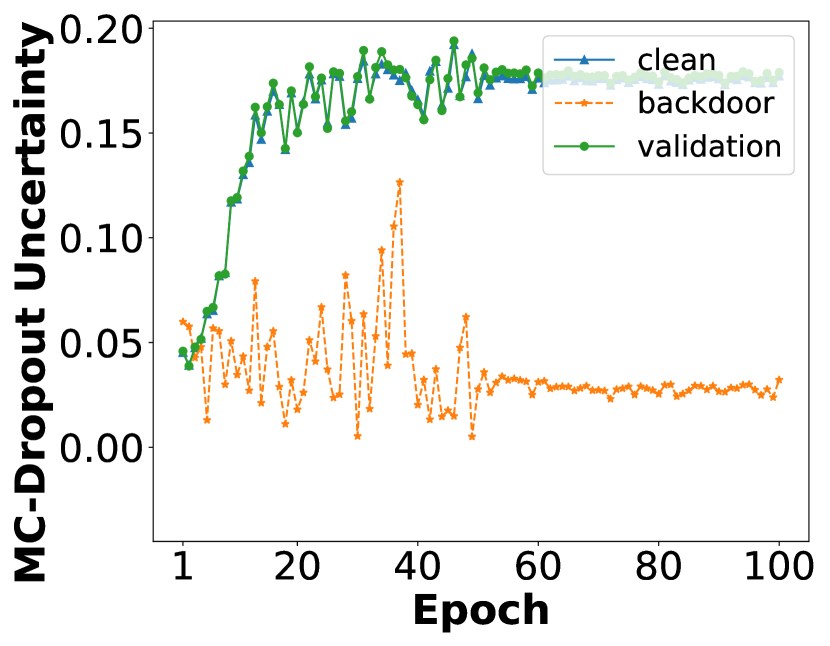
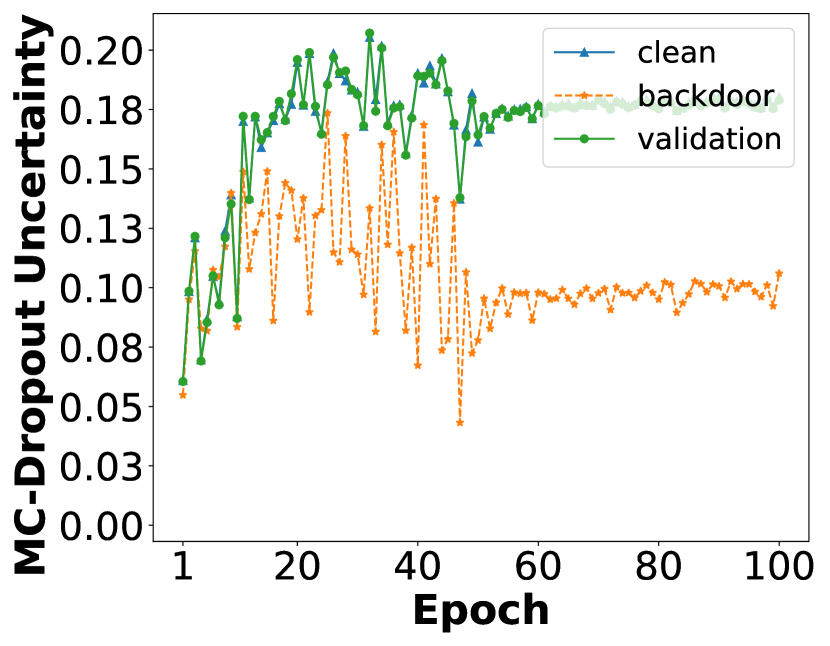
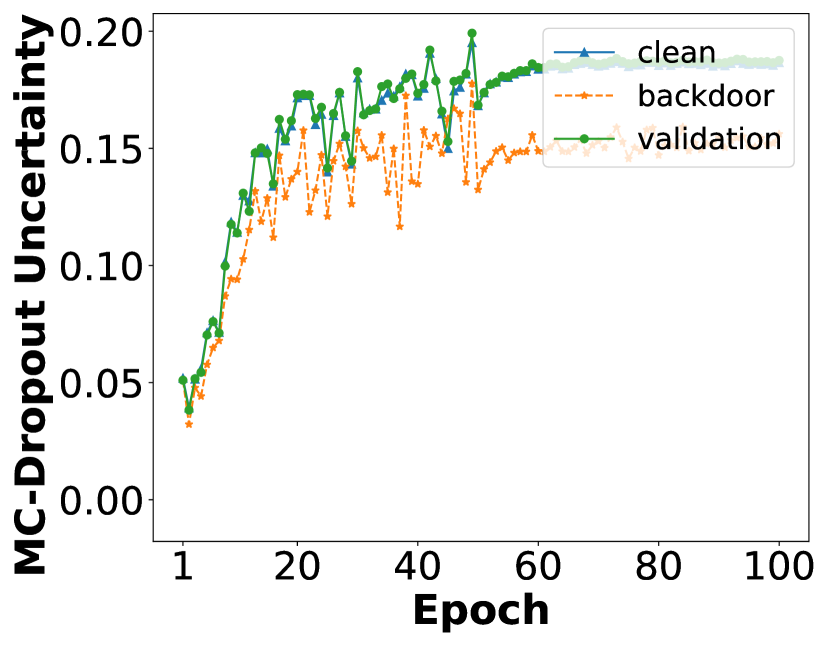
We use a widespread model predictive uncertainty approximation method - Monte Carlo Dropout (MC-Dropout) [33] to explore the model predictive uncertainty of the three types of data - the clean training data, the backdoor training data, and the clean validation data. MC-Dropout opens dropout during the inference phase, allowing the model to undergo multiple forward passes. The average of the predicted confidences generated during this process is considered the final predicted confidence of the model, while the standard deviation of the highest predicted confidence serves as the predictive uncertainty for the corresponding data.
Applying MC-Dropout to measure uncertainty, the expected result is that the clean validation data exhibits the highest uncertainty because it is not seen during the model’s training process. The uncertainty of the clean training data follows that of the clean validation data, but the gap between them should be narrower than the gap between the clean training data and the backdoor training data. This is because enabling dropout slightly impairs the image features, despite the model generally fitting the training data better than the testing data. The backdoor training data uncertainty should be the lowest because backdoor data is easier for the model to learn or remember compared to clean data. If we obtain these ideal results, based on uncertainty, we can then view the backdoor training data as outliers and use some outlier detection methods to identify the backdoor training data.
Settings.
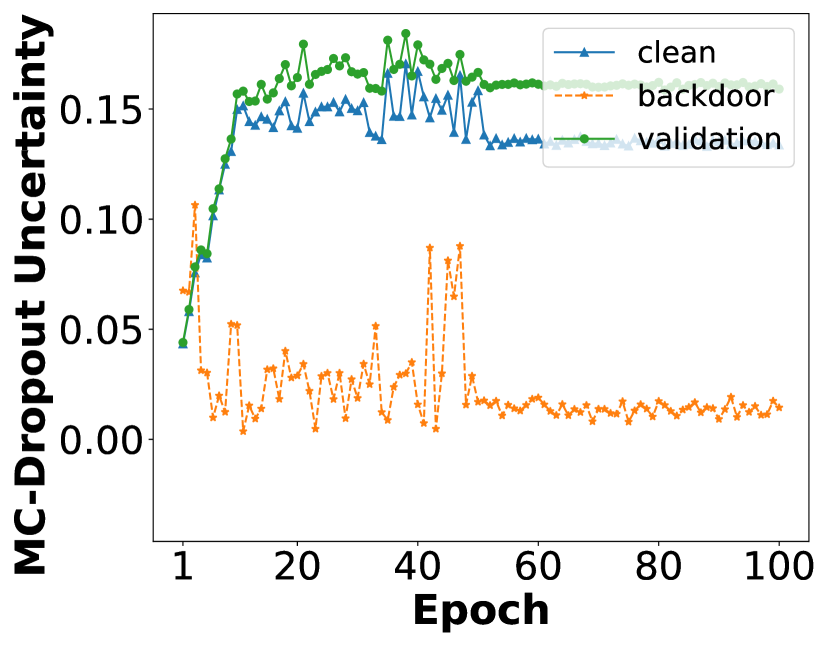
We adopt BadNets [3] and WaNet [5] as examples for our discussion, representing visible and non-visible backdoor attacks, respectively. We conduct experiments on the CIFAR-10 dataset [34] and ResNet-18 [35], trained for 100 epochs. For both attacks, we set the poisoning ratio to 10%, i.e. replaced 10% of total training data with malicious backdoor training data. We randomly select the clean validation dataset from the original CIFAR-10 test set, and its size is 5% of the total size of the training set (including both clean training data and poisoned training data). We calculate the average MC-Dropout uncertainty of three types of data with models obtained from all 100 epochs to compare the difference in their uncertainty. To retain the setting consistent with the MC-Dropout, we place the dropout layer after each convolutional layer of every basic block in ResNet. Without sacrificing generality, the target class of backdoor data is class 0 in our all examples.
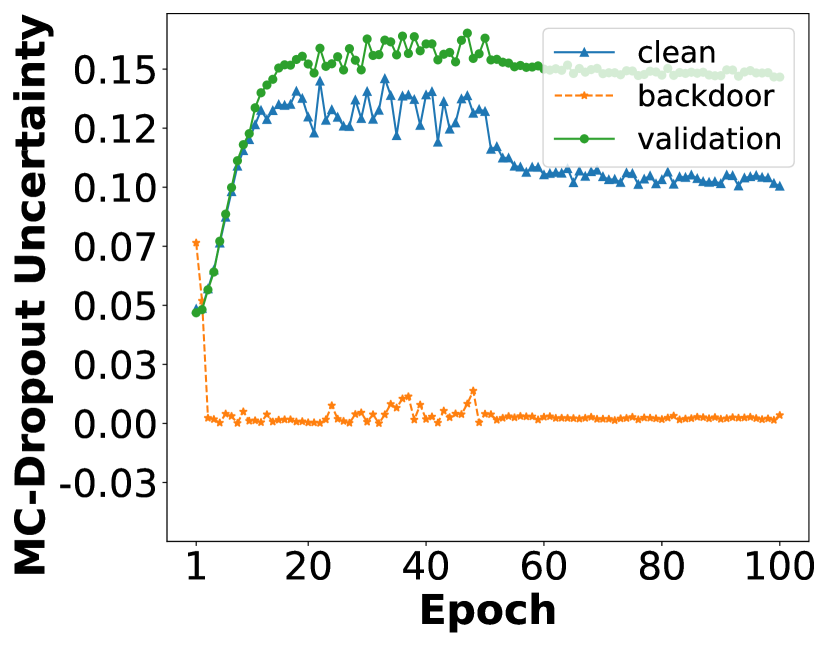
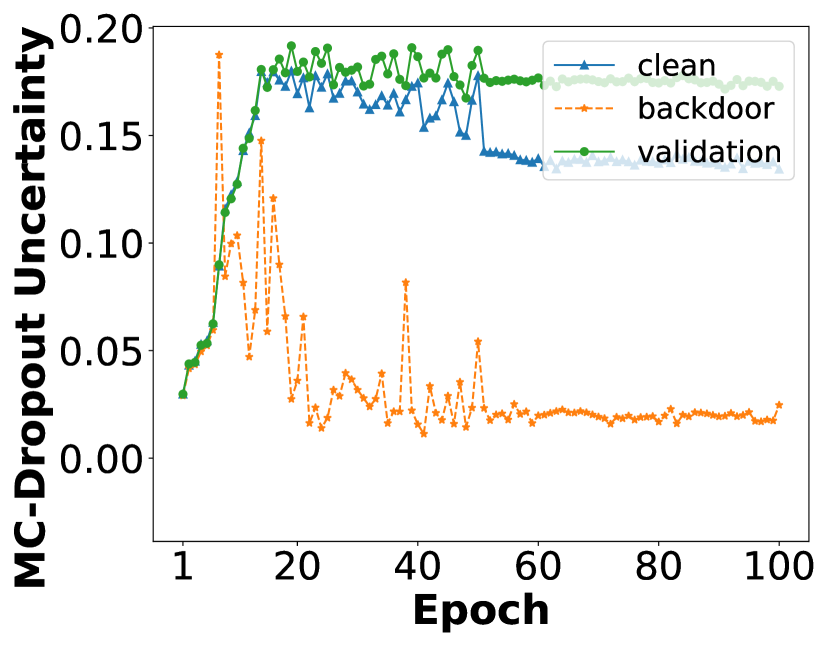
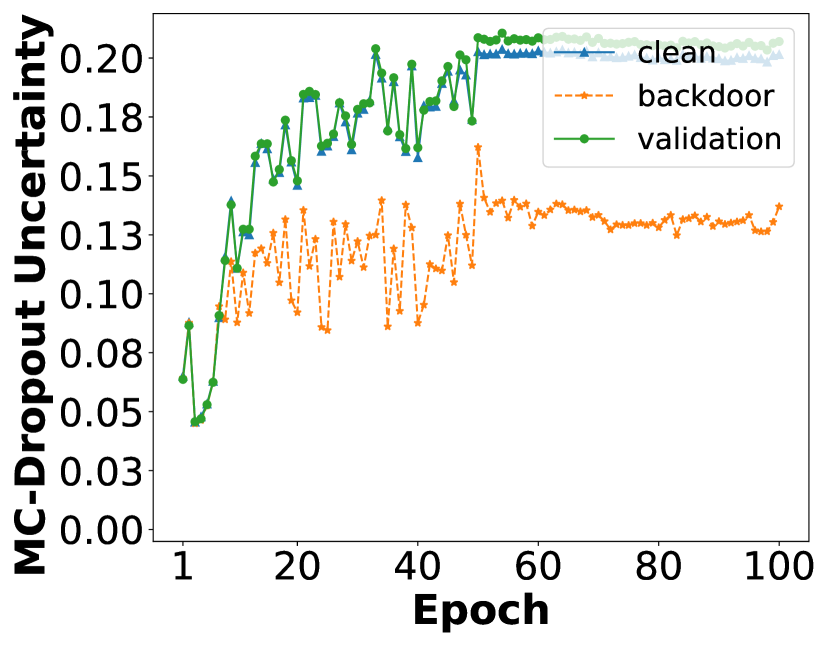
Results.
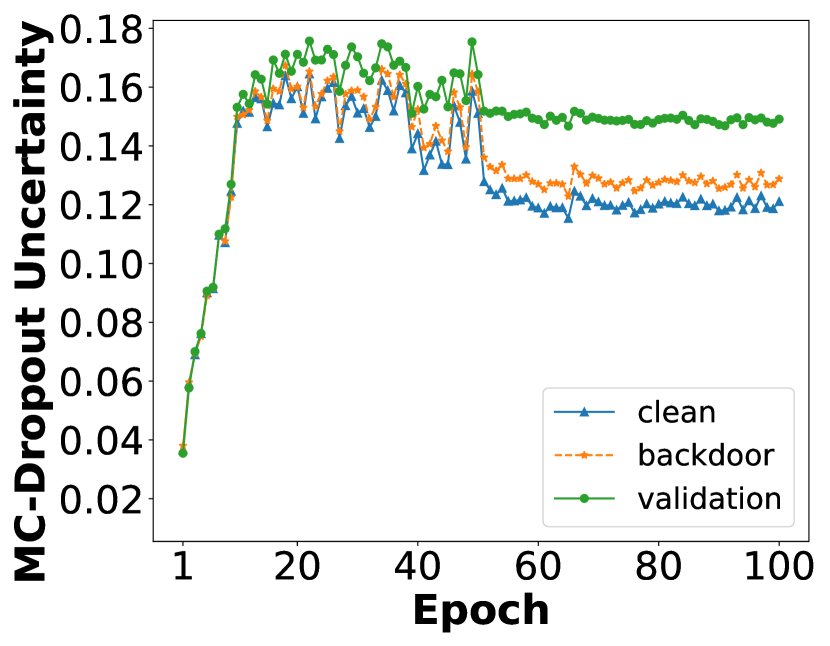
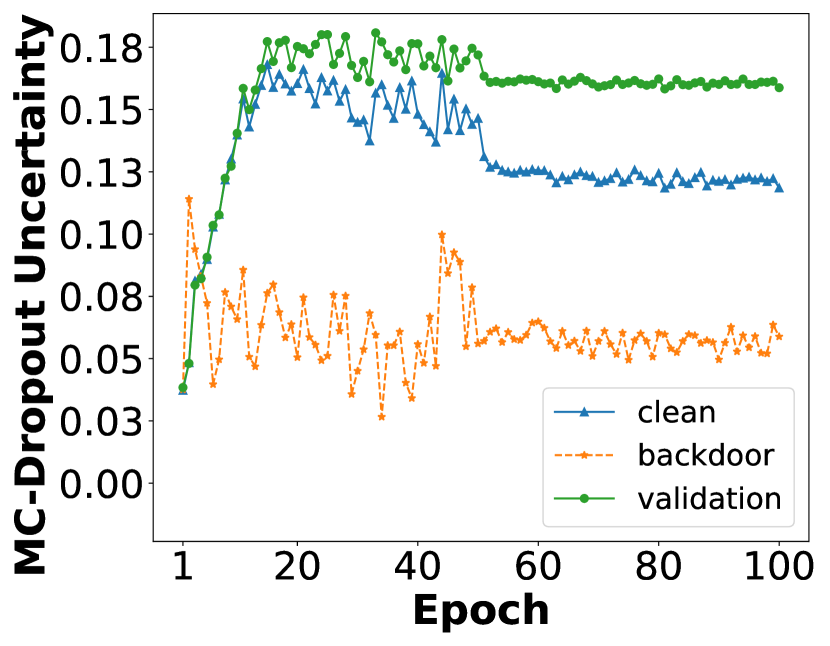
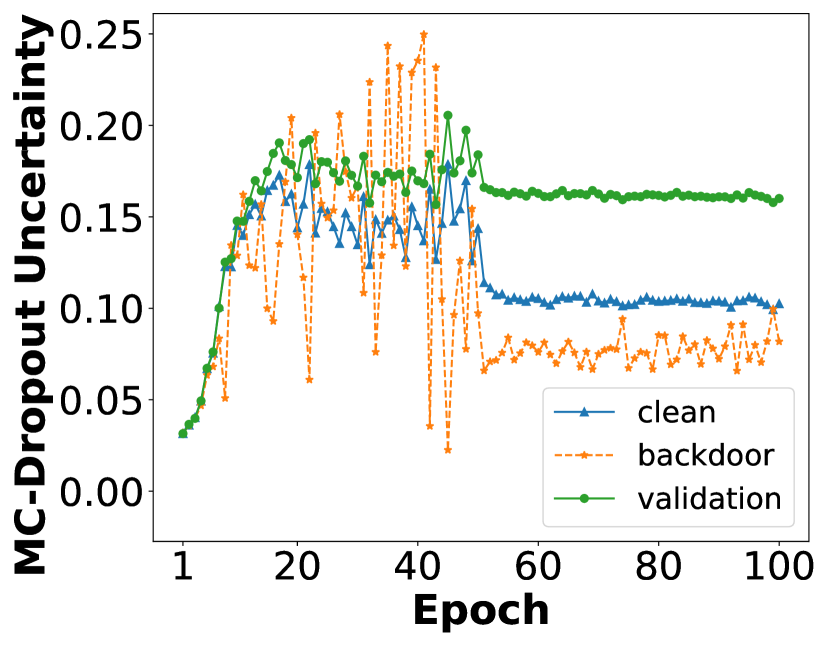
As shown in Figure 2(a), under the benign model, the average MC-Dropout uncertainty of backdoor training data is slightly higher than that of clean training data, both lower than clean validation data. This indicates that the benign model treats backdoor data as a product of clean data with a certain perturbation, and this perturbation does not significantly impact the benign model’s decision-making behavior. From Figure 2(b) it can be observed that, across 100 epochs, the average uncertainty of backdoor training data is significantly smaller than that of clean training data and clean validation data under BadNets, and this difference tends to stabilize in the later stages of model training. The observations align with the part of our ideal condition in the sense that backdoor examples indeed have smaller uncertainty, while clean training and clean validation data exhibit larger uncertainty. However, in Figure 2(c), one can observe that the uncertainty of backdoor training data under WaNet is not necessarily smaller than clean training data and clean validation data. The clean training data uncertainty is still lower than the clean validation data uncertainty, but the backdoor training data uncertainty is very close to or even exceeds them at some epochs. This suggests that using uncertainty defined by standard deviation alone may not be sufficient to detect backdoor data in various attack scenarios. In addition, the dropout rate is a parameter that is difficult to ascertain when we have a lack of knowledge about backdoor attacks. Other poisoned model results can be found in the Appendix A.1. We attempted a combined method with SCALE-UP (SCP) [18], which achieves better results in most scenarios. However, it still fails in some specific cases. For detailed results, please refer to Appendix A.2.
4.2 The Enlightening Eureka Moment: Prediction Shift Phenomenon
Contrary to the indications from pilot study, relying solely on the simple MC-Dropout predictive uncertainty proves insufficient for distinguishing between clean and backdoor data. Although frustrating, we can still observe that the model’s mapping from trigger to target label in backdoor data is more salient and robust compared to general image features. Informed by these preliminary findings, we delved further into the impact of employing dropout during the model inference phase on the model’s behavior.
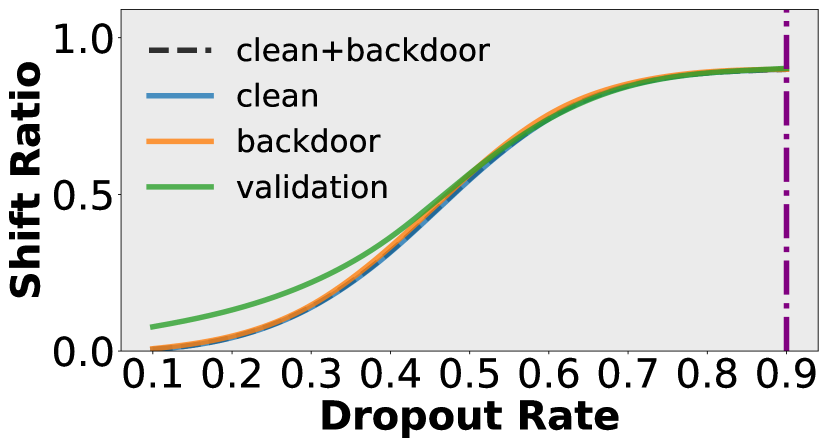
Prediction Shift.
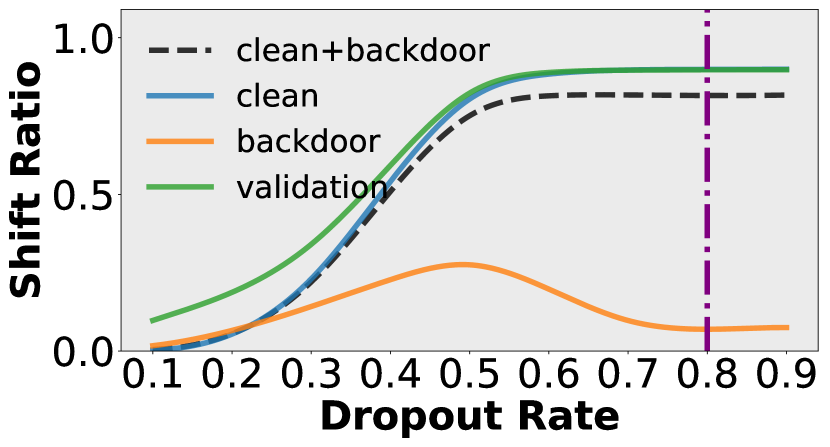
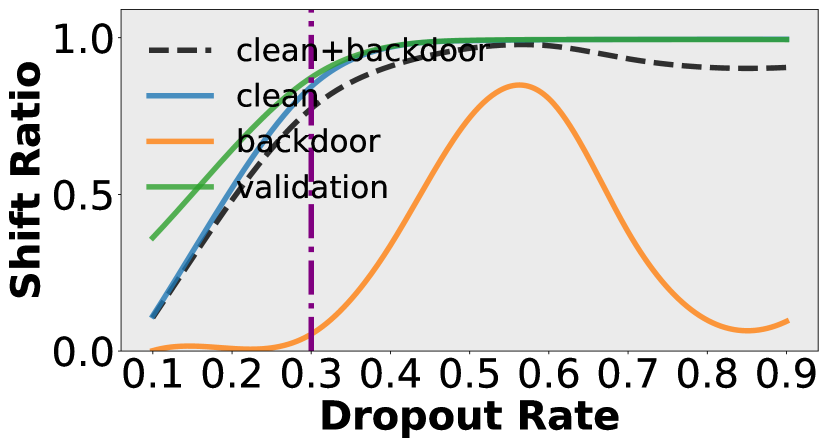
To delve deeper into how dropout affects the predictive uncertainty of the model, we examined how enabling dropout during the model’s forward process alters the classifications and the model’s prediction confidence. We define Prediction Shift (PS) as the phenomenon where the class predicted by the model changes before and after dropout is enabled, for samples in the dataset . The shift ratio represents the frequency of PS occurring in all forward inferences with dropout activated across the entire dataset , i.e.,
| (1) | ||||
where represents an arbitrary dataset, which could encompass the entire training set or a specific subset, such as one class of data or a poisoned/clean training set; represents the predicted class of the model without dropout for input and corresponds to the predicted class of model with dropout in forward inference stage; denotes the PS function; denotes the number of forward iterations performed with dropout.
Settings.
Firstly, the model is trained on the poisoned training set following the standard training procedure, which excludes the use of dropout, data augmentation, and data normalization. After that, we apply dropout without using data augmentation and data normalization during model inference. This allows us to completely control the model’s ability to extract data features, thereby influencing the uncertainty of its predictions by adjusting the dropout rate . We perform forward inference times and record the value of PS in the three types of data. Specifically, dropout layers are applied after each residual connection in the residual basic block, before the activation function, as this can significantly influence the model’s predictions with the dropout.
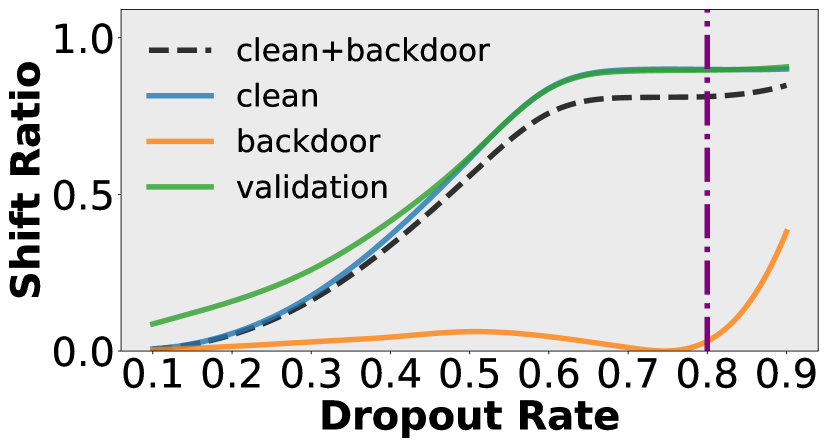
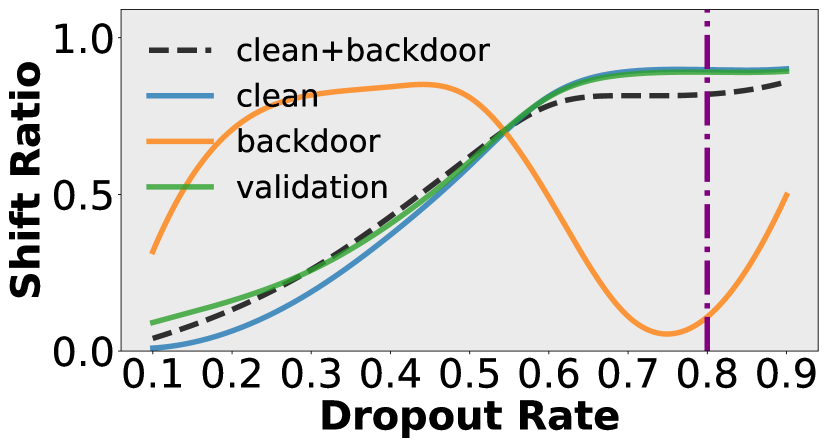
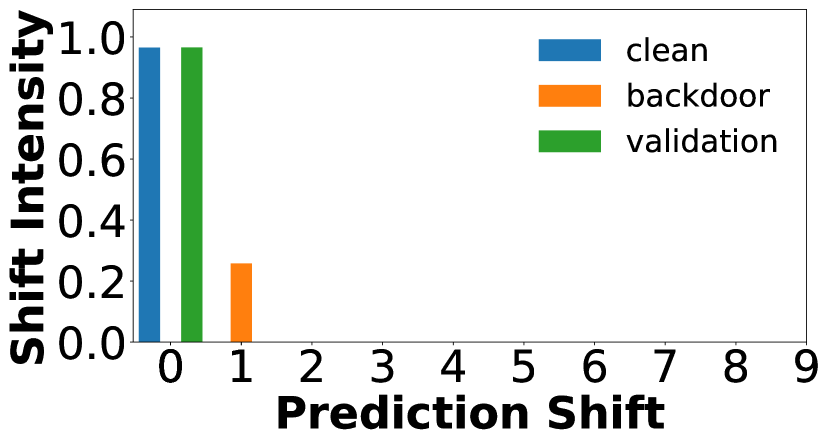
Results.
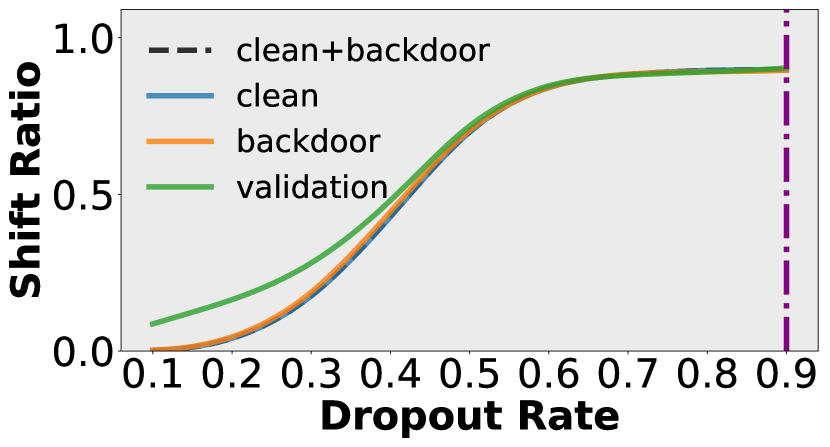
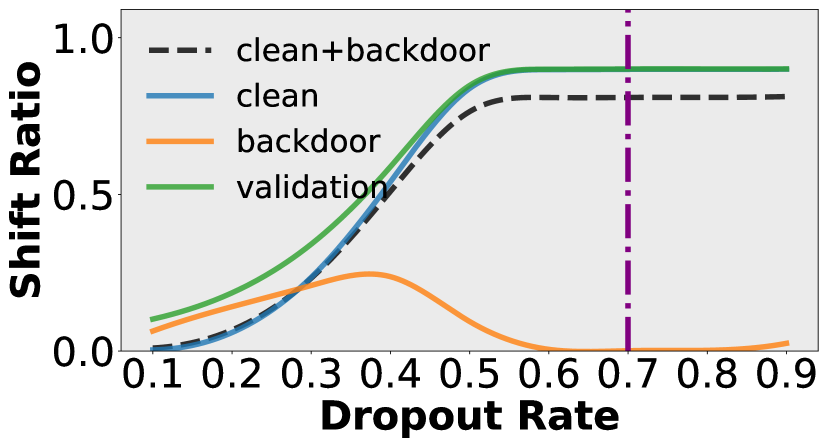
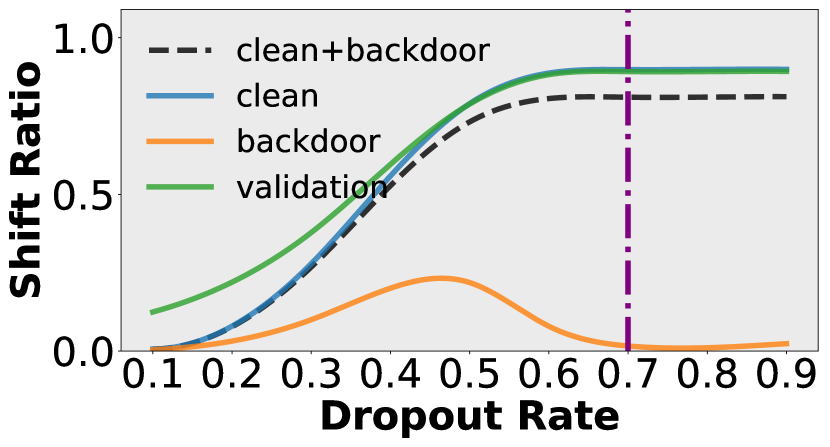
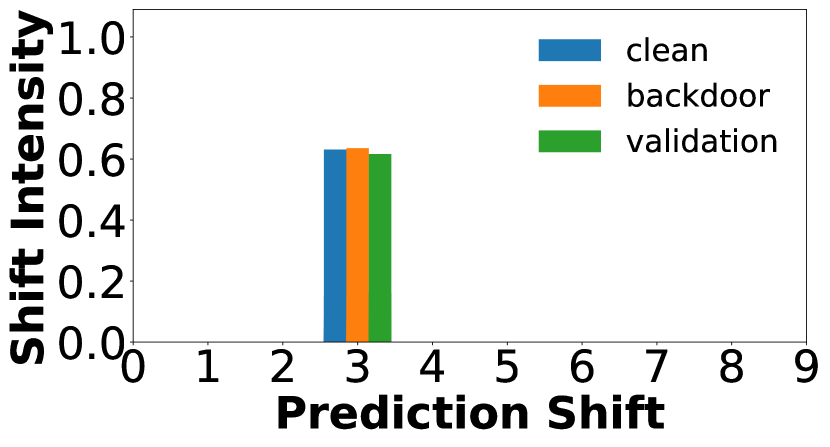
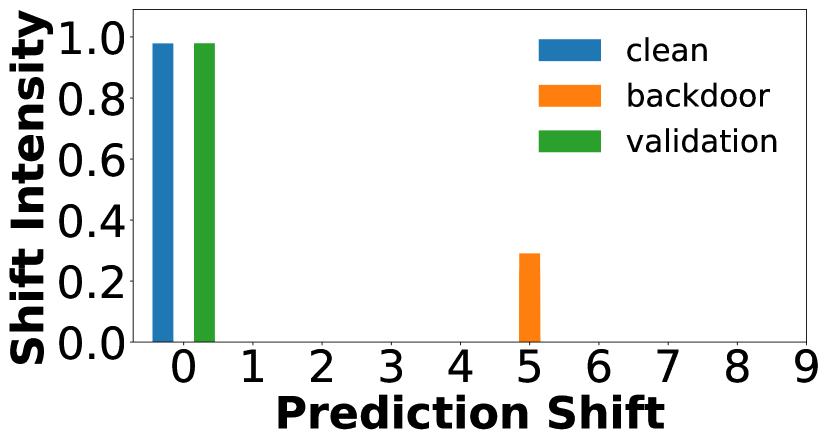
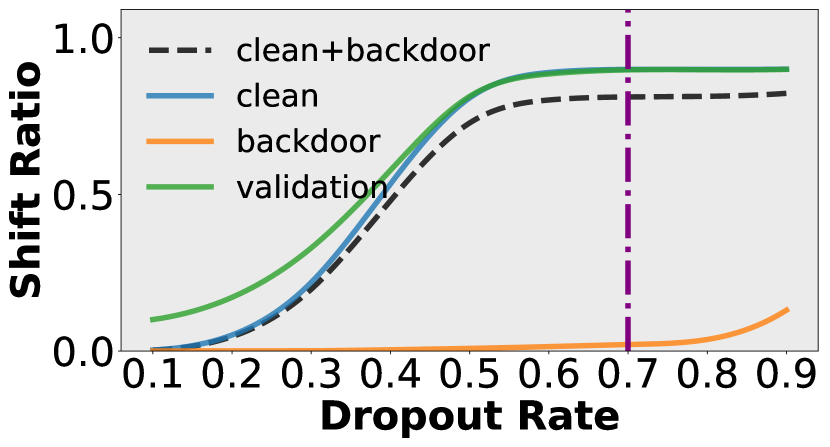
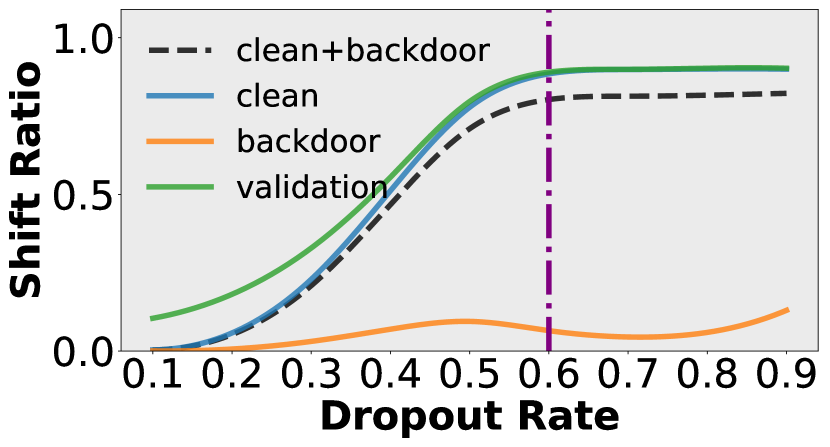
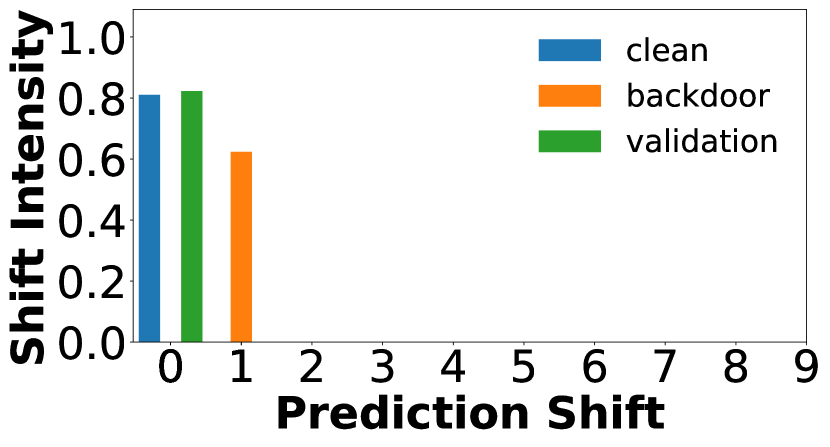
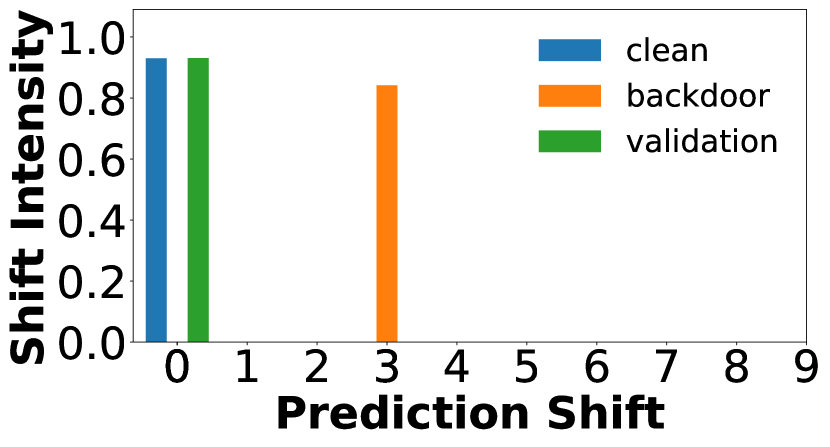
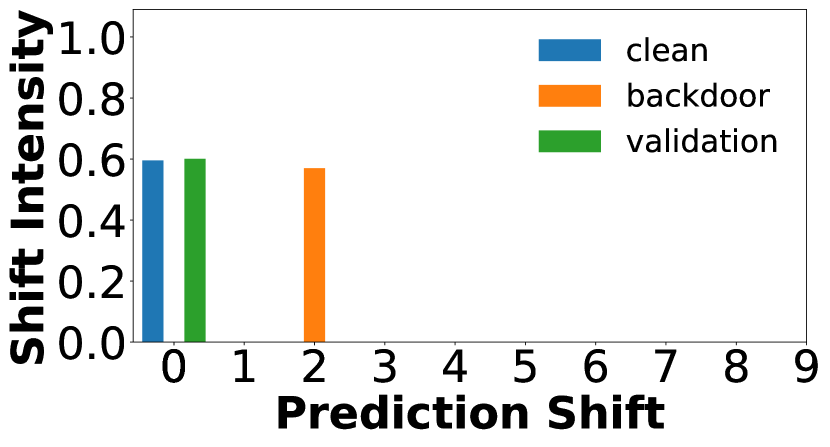
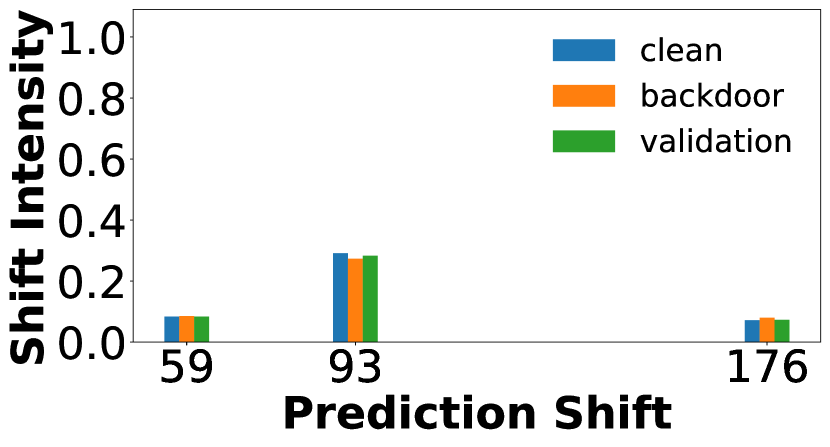
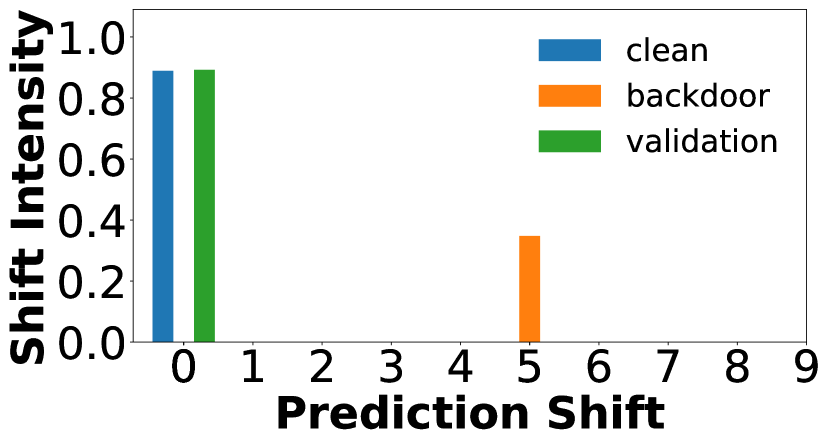
From the below row of Figure 3(a), among all the clean training data where PS occurs, approximately 60% of them shift from the ground truth to class 3 under the benign model. The x-axis represents the shifted labels of samples that experienced a prediction shift after applying dropout. The same pattern is observed in the backdoor training and clean validation data. We observe the presence of PS even in the benign model, indicating that the PS is generated by the model during training and is a universally existing internal characteristic of the DNNs. From the above row of Figure 3(a), both clean training data and backdoor training data exhibit nearly identical shift ratio trends. This result aligns with the conclusion in the Section 4.1, i.e, the benign model treats backdoor data as a product of clean data with a certain perturbation, and classifies them mainly based on the extracted natural image features rather than the perturbation.
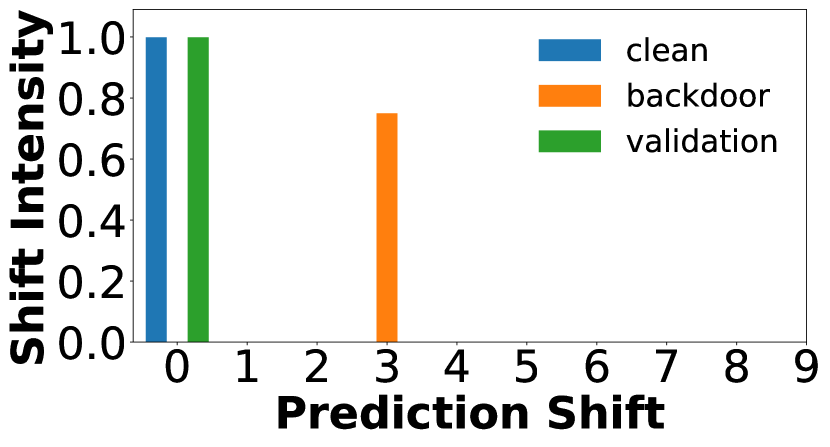
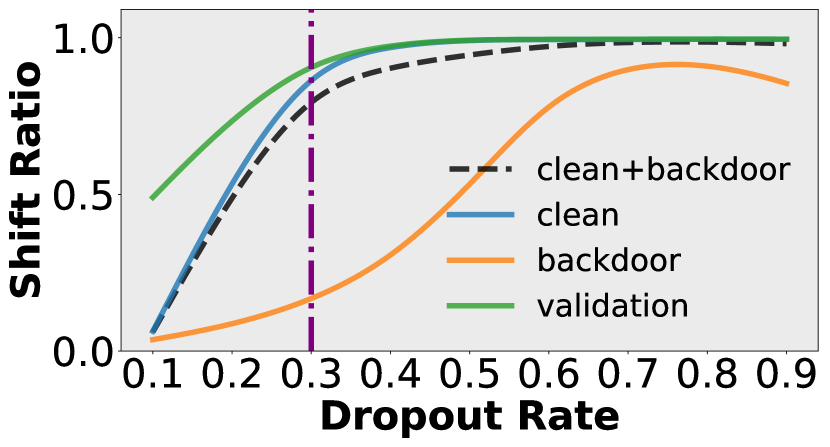
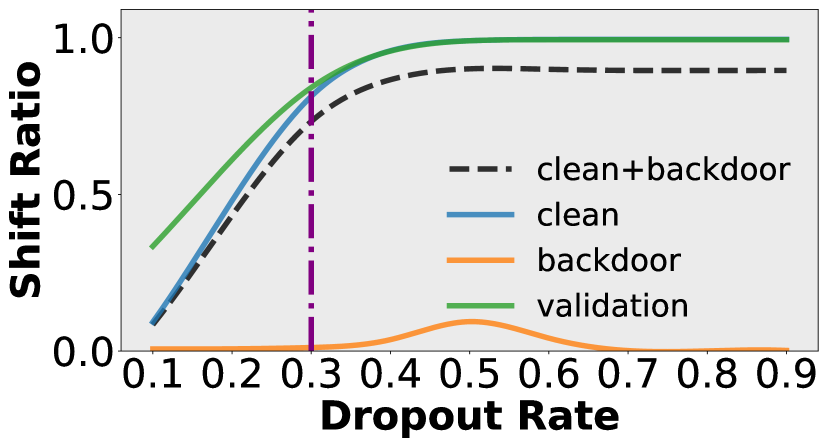
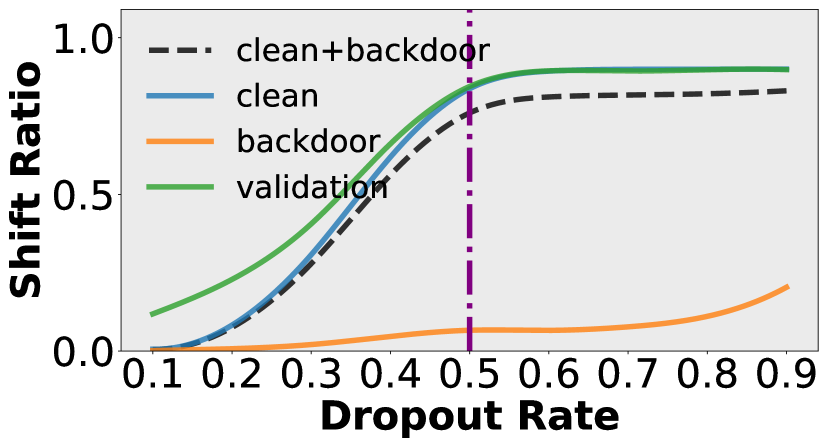
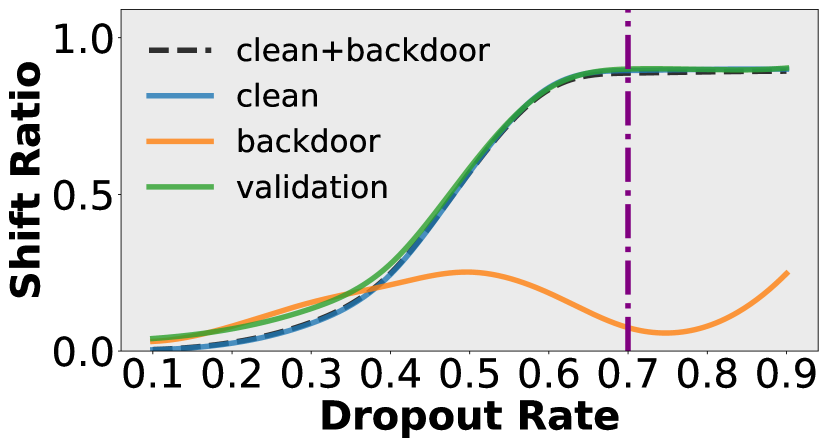
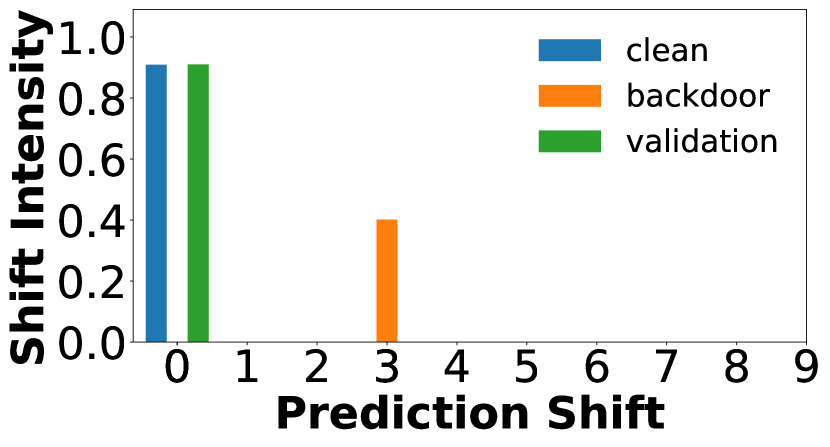
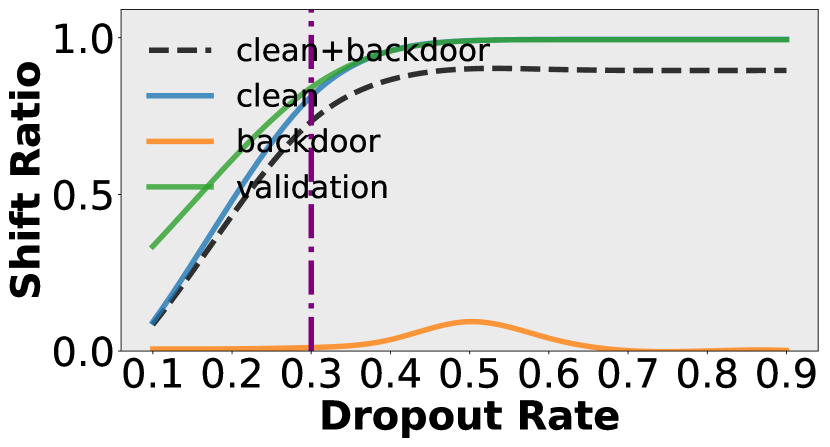
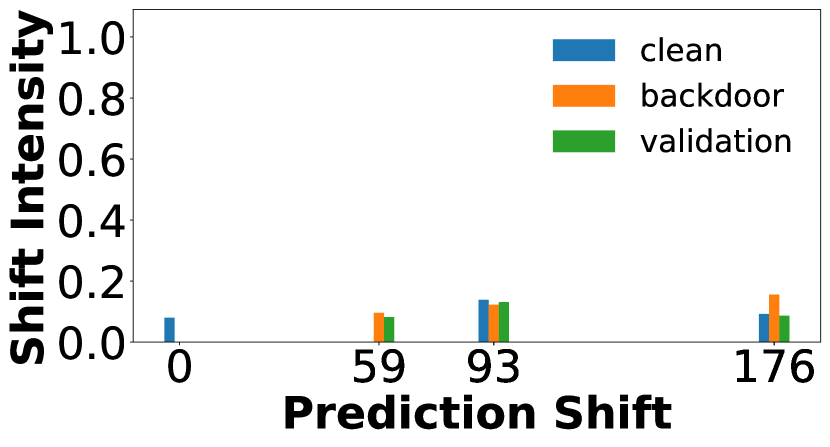
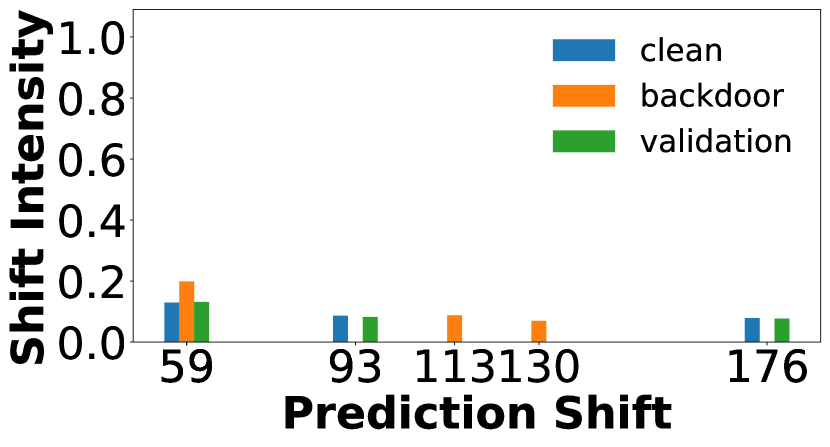
As illustrated in Figure 3(b) and 3(c), in the BadNets and WaNet scenarios, we observe that the shift ratio curve for clean data still follows an increasing trend as increases, eventually stabilizing. However, when reaches a certain special value, the for backdoor data approaches 0, while the for clean data reaches a relatively high value (around 0.8). The most important thing is, among the samples experiencing PS, almost all clean data shifts to the target class (class 0 in our experiments). The same phenomenon has been observed in other attack scenarios on CIFAR-10 as well. This indicates that training with backdoor samples enhances the PS phenomenon of clean data while suppresses that of backdoor data. This is likely due to significant differences in the internal behavior of the model towards clean data and backdoor data under appropriate dropout . Other poisoned model’s shift ratio curve and shift intensity can be found in the Appendix B.1.
In addition, we continued to observe similar patterns on the expanded and intricate Tiny ImageNet dataset. However, the shift classes of the clean training data and the clean validation data exhibit a predominant inclination towards a certain class rather than the target class. Nevertheless, there is still a certain proportion that exhibits a bias towards the target class. Despite assuming that the defender can freely choose the model architecture, we also conducted experiments using the VGG to demonstrate that our method is not dependent on any specific model architecture. For all results, please refer to the Appendix B.2 and B.3.
Neuron Bias.
We posit that the PS phenomenon arises due to the “neuron bias” effect in the network during training with data, where neurons become predisposed towards features highly representative of the certain class implicitly. This bias intensifies as the network forms a strong association between the data features and this certain class, especially between the backdoor pattern and the target class. Once this association is established, the bias persists independently of the trigger pattern, essentially creating durable pathways to the target class. In the absence of dropout, models usually predict the actual class for clean data as the features corresponding to their ground truth classes outweigh the influence of these robust pathways. However, under dropout conditions, these distinguishing features of clean data are diminished, leaving a part of the robust pathways unchallenged and leading to predictions favoring the certain class, especially the target class when the model has good generalization ability as these pathways can be established with greater stability. Therefore, even with clean data input, the network tends to favor the target class.
4.3 From Insight to Innovation: Prediction Shift Backdoor Detection
Even with dropout enabled, the predicted labels for some clean data remain unchanged before and after applying dropout, although their prediction confidence changes significantly, leading to the potential misclassification of this clean data as backdoor data. To quantify the change in prediction confidence rather than the change in labels as defined in Equation (1), we introduce a new and more fine-grained measure of predictive uncertainty, Prediction Shift Uncertainty (PSU). PSU computes the difference between the predicted class confidence without dropout and the average predicted class confidence across dropout inferences to quantify the intensity of PS:
| (2) | ||||
where represents the class with the highest predicted confidence for data without dropout during the inference stage; represents the predicted confidence of class by the model without using dropout for input , and corresponds to the confidence with dropout at the th forward pass; represents the origin model parameters; represents the th dropout model parameters across all inferences. Here is the dropout rate.
Similar to pilot studies, the appropriate dropout rate is a crucial factor in the dropout-based uncertainty method and is challenging to determine without knowledge of backdoor attacks. A reasonable is selected when the PS of clean data (both clean training data and clean validation data) achieves a relatively strong intensity, and that of backdoor data remains relatively weak. However, due to a lack of backdoor knowledge, we cannot directly compute the PS of backdoor data. Therefore, based on the definition of provided in Equation (1), we propose an adaptive selection strategy for . Specifically, we identify the where the of clean validation data approach to a high value (0.8 in our experiments), while the difference between the of the entire training data and that of the clean validation data reaches its maximum.
Prediction Shift Backdoor Detection.
As we mentioned above, clean data always shift from the origin prediction class to another specific class, while backdoor data often remain static. Consequently, the PSU of clean training data and clean validation data will be close and high, whereas the PSU of backdoor data will be small under an appropriate . For suspicious data , it can be determined as malicious based on a defender-specified threshold . If , it is classified as a backdoor sample. We set based on the close proximity of PSU values between clean training data and extra clean validation data. In other words, in the absence of knowledge regarding the backdoor attack, can be roughly regarded as the tolerable loss rate for clean training data. In all our experiments, is set to the 25th percentile PSU value of the whole clean validation data. Furthermore, we found that using data augmentation in model training significantly outperforms the non-augmented training approach on Tiny ImageNet. As shown in Figure 4, we observe that with data augmentation under Tiny ImageNet, there is a significant decrease of for backdoor data. It indicates that the use of data augmentation can intensify neuron bias, especially when the model has a lack of generalization ability to recognize the more sophisticated features. Hence, we incorporate data augmentation during model training when the model’s generality is lacking. The specific workflow of the prediction shift backdoor detection (PSBD) method is given as follows:
-
•
First, we train the model using a standard supervised learning algorithm on the suspicious training dataset, employing common data augmentation techniques when the model lacks generalization ability (in our experiments, we select the most commonly used random flipping and random cropping).
-
•
Next, we select the dropout rate based on the adaptive selection strategy. Then, we select a late-stage model to calculate the PSU values for the suspicious training data and clean validation data, due to its enhanced data fitting capability and robust neuron bias paths. We use the model from the 95th epoch. In fact, we find that any model from the 90th epoch onward performs equally well.
-
•
Finally, is set to the 25th percentile value of the PSU of clean validation data. For suspicious data , we can determine it is malicious based on defender-specified threshold . If , we view it as a backdoor sample.
5 Experiments
5.1 Experiment Settings
Dataset and DNN Model.
We conduct all experiments on the CIFAR-10 [34] and Tiny ImageNet [36] datasets using the ResNet-18 [35] architecture (Note that a defender is free to choose any model). We randomly select 5% of the total quantity of whole poisoned training dataset from the original test sets as our extra clean validation data. Further details can be found in the Appendix C.1.
Backdoor Attack Settings.
We evaluate our PSBD method against seven representative backdoor attacks, namely BadNets [3], Blend [23], TrojanNN[22], Label-Consistent [24], WaNet [5], ISSBA [37] and Adaptive-Blend [38]. Data augmentation during the model training was employed exclusively for Adaptive-Blend on CIFAR-10 and all experiments on Tiny ImageNet to achieve an attack success rate exceeding 85%. Without sacrificing generality, in our all experiments the target class of backdoor data is class 0. More detailed settings are presented in Appendix C.2.
Backdoor Detection Baseline.
We compare our method with five classic and state-of-the-art backdoor data detection methods, namely Spectral Signature [39], Strip[19], Spectre[40], SCAN [41], and SCP [18]. All five detection methods were implemented and evaluated on the CIFAR-10 dataset. For the Tiny ImageNet dataset, SCAN was excluded due to its computationally intensive matrix eigenvalue computations, which significantly increased processing time. We run three trials for each experiment of all methods and report the average results across all cases as the final result. Please refer to the Appendix C.4 for the implementation details.
| Defenses | PSBD (Ours) | Spectral Signature | Strip | Spectre | SCAN | SCP |
| Attacks | ||||||
| CIFAR-10 (All standard deviation values should be multiplied by ) | ||||||
| Badnet | 1.000(0.0)/0.104(0.3) | 0.389(2.7)/0.512(0.3) | 1.000(0.0)/0.113(0.6) | 0.953(0.0)/0.450(0.0) | 1.000(0.0)/0.009(1.5) | 1.000(0.0)/0.205(0.5) |
| Blend | 1.000(0.0)/0.135(2.5) | 0.438(0.5)/0.507(0.1) | 0.993(0.2)/0.118(0.4) | 0.953(0.0)/0.450(0.0) | 0.991(0.3)/0.000(0.0) | 0.939(8.3)/0.244(6.8) |
| TrojanNN | 0.983(1.6)/0.171(4.5) | 0.302(20)/0.509(0.1) | 0.996(0.4)/0.112(0.3) | 0.950(0.0)/0.450(0.0) | 1.000(0.0)/0.000(0.0) | 0.921(7.8)/0.227(3.8) |
| Label-Consistent | 0.992(1.4)/0.130(3.4) | 0.447(0.3)/0.506(0.0) | 0.994(0.2)/0.117(1.1) | 0.953(0.0)/0.450(0.0) | 0.979(0.2)/0.014(1.2) | 0.889(5.7)/0.237(5.4) |
| WaNet | 1.000(0.0)/0.116(1.8) | 0.456(0.3)/0.505(0.0) | 0.050(1.4)/0.101(0.5) | 0.951(0.2)/0.450(0.0) | 0.891(1.4)/0.034(2.2) | 0.869(8.4)/0.251(4.7) |
| ISSBA | 1.000(0.1)/0.113(1.9) | 0.436(0.5)/0.507(0.1) | 0.774(6.9)/0.120(0.7) | 0.950(0.0)/0.450(0.0) | 0.963(0.6)/0.011(1.9) | 0.939(4.1)/0.290(2.9) |
| Adaptive-Blend | 0.982(2.6)/0.184(3.6) | 0.608(19)/0.145(0.2) | 0.014(0.5)/0.069(0.4) | 0.753(8.3)/0.144(0.1) | 0.000(0.0)/0.023(4.0) | 0.779(10)/0.246(5.9) |
| Average | 0.994(0.8)/0.136(2.6) | 0.439(6.2)/0.456(0.1) | 0.689(1.4)/0.107(0.6) | 0.923(1.2)/0.406(0.0) | 0.832(0.4)/0.013(1.5) | 0.905(6.3)/0.243(4.3) |
| Tiny ImageNet (All standard deviation values should be multiplied by ) | ||||||
| Badnet | 0.989(1.0)/0.088(0.3) | 0.480(0.1)/0.502(0.0) | 0.841(3.8)/0.108(1.9) | 0.522(0.0)/0.497(0.0) | / | 0.999(0.0)/0.271(0.5) |
| Blend | 0.919(3.8)/0.108(0.7) | 0.478(0.0)/0.502(0.0) | 0.249(3.2)/0.086(1.1) | 0.522(0.0)/0.496(0.1) | / | 0.551(1.2)/0.260(0.7) |
| TrojanNN | 0.961(0.6)/0.222(0.1) | 0.478(0.0)/0.502(0.0) | 0.963(1.0)/0.104(1.0) | 0.522(0.0)/0.497(0.0) | / | 0.972(1.1)/0.301(2.8) |
| Label-Consistent | 0.839(5.0)/0.039(1.5) | 0.478(0.0)/0.502(0.0) | 0.460(16)/0.088(0.9) | 0.522(0.0)/0.497(0.0) | / | 0.741(3.8)/0.187(1.0) |
| WaNet | 0.959(2.5)/0.086(1.8) | 0.478(0.0)/0.502(0.0) | 0.087(3.4)/0.082(0.2) | 0.522(0.0)/0.497(0.0) | / | 0.446(5.4)/0.254(1.0) |
| ISSBA | 0.886(2.6)/0.209(1.0) | 0.478(0.0)/0.502(0.0) | 0.954(3.6)/0.097(0.5) | 0.522(0.0)/0.497(0.0) | / | 0.691(3.8)/0.297(1.3) |
| Adaptive-Blend | 0.949(2.9)/0.095(3.7) | 0.392(0.1)/0.502(0.0) | 0.210(16)/0.099(0.6) | 0.621(0.0)/0.497(0.0) | / | 0.505(13)/0.218(1.2) |
| Average | 0.929(2.6)/0.121(1.3) | 0.466(0.0)/0.502(0.0) | 0.538(6.6)/0.095(0.9) | 0.536(0.0)/0.497(0.0) | / | 0.701(4.0)/0.255(1.2) |
Metric.
To directly assess the effectiveness of detection methods, we employ common binary classification metrics: True Positive Rate (TPR) and False Positive Rate (FPR). Our evaluation prioritizes achieving a high TPR to ensure effective identification of backdoor samples, while simultaneously maintaining a low FPR to minimize erroneous deletion of clean samples. Values inside brackets represent standard deviations (SD).
5.2 Experiment Results
Effectiveness and Efficiency of PSBD.
As shown in Table 1, PSBD demonstrates excellent backdoor detection performance across a wide range of attack scenarios, while effectively preserving a substantial amount of clean data. The results also demonstrate that PSBD achieves a substantial improvement in detection performance compared to the defense baselines. In contrast, all baseline methods fail in some evaluation attacks. Specifically, on the CIFAR-10 dataset, the Spectral Signature method failed to detect backdoor data under all attack scenarios, while simultaneously misclassifying a substantial amount of clean data as backdoor data. This suggests that when the trigger pattern is relatively large or complex, the spectral signature property may be difficult to capture. The Spectre method demonstrated relatively effective detection capabilities across most attack scenarios, but it also has a high FPR. This is not desirable in practice as it filters out a significant amount of clean training data, which can lead to issues like overfitting due to insufficient training data. Although the SCAN, Strip, and SCP methods exhibited relatively acceptable performance across most attack scenarios, achieving a relatively high TPR and a low FPR, their effectiveness deteriorated somewhat when confronted with attacks employing confusion strategy such as WaNet. This confusion strategy aims to disrupt the model by retaining an equal or greater proportion of confounding samples that contain the trigger pattern but are correctly labeled. This weakens the mapping strength between the trigger pattern and the target label. Building upon this strategy, the Adaptive-Blend attack employs a more intricate incomplete trigger, significantly diminishing the detection performance of all baseline methods. Furthermore, owing to the extensive matrix eigenvalue computations involved, SCAN suffered from substantial computational inefficiency.
On the more challenging Tiny ImageNet, all baseline methods failed in most attack scenarios. This failure is likely due to the increased complexity of image features, which weakened their ability to capture the mapping between trigger pattern and target label. Encouragingly, our PSBD method maintained its effectiveness, ranking in the top two for all attacks except for TrojanNN (where it still achieved a TPR of 0.961). 5% poisoning ratio results can be found in Table A4. By employing dropout to diminish the prominence of most image features and utilizing robust neuron bias paths, PSBD effectively discerned the mapping from trigger pattern to target label.
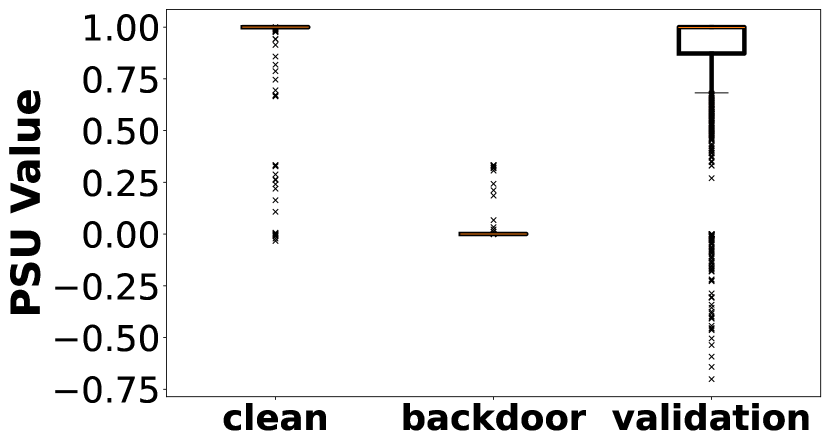
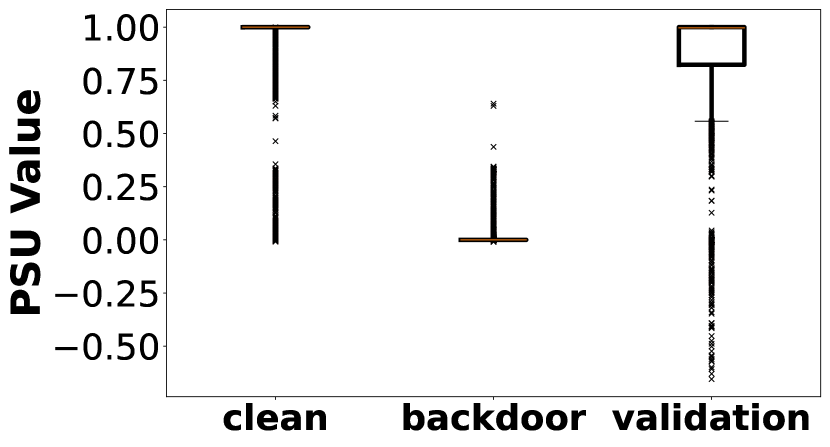
The Strong Discriminative Capability of PSBD.
PSBD excels in its critical ability to effectively differentiate between clean and backdoor training data. By leveraging the PSU values, we have developed some informative box plots that clearly and vividly demonstrate the remarkable discriminative power of our approach. As shown in Figure 5, provide a visual representation of how PSBD separates clean data from backdoor data. In these plots, it is prominently visible that backdoor data is characterized by lower PSU values, distinguishing it from clean training and validation data, which generally exhibit higher PSU values. This distinction is crucial for effective backdoor detection, as it highlights the different behavioral patterns of the model when exposed to clean versus poisoned data. The lower PSU values in backdoor data indicate the model’s ability to maintain confident predictions, a direct consequence of the embedded trigger in these samples with neuron bias effect.
PSBD Is More Robust.
Despite the ostensible randomness introduced by dropout, our PSBD method paradoxically exhibits low variance due to the robustness of the PS phenomena and neuron bias effect for clean and backdoor data under the appropriate dropout . In real-world scenarios, where defenders often lack specific information about the poisoned data and target labels used by attackers, the robustness of a defense mechanism is crucial.
6 Conclusion
In our study, we developed PSBD, a simple and effective method to detect backdoor attacks in neural networks by focusing on Prediction Shift under dropout conditions, leading to the concept of neuron bias. By analyzing changes in prediction confidence with dropout, PSBD effectively distinguishes between clean and backdoor data across multiple datasets and attack types. This research contributes a practical and effective solution to the challenge of backdoor attacks in DNNs, marking a notable advancement in the field of neural network security. Future efforts could explore extending the PSBD method to a broader range of domains, such as natural language processing or time-series analysis.
7 Acknowledgement
Ren Wang is supported by the NSF under Grants 2246157 and 2319243, and the ORAU Ralph E. Powe Junior Faculty Enhancement Award.
References
- [1] K. Muhammad, A. Ullah, J. Lloret, J. Del Ser, and V. H. C. de Albuquerque, “Deep learning for safe autonomous driving: Current challenges and future directions,” IEEE Transactions on Intelligent Transportation Systems, vol. 22, no. 7, pp. 4316–4336, 2020.
- [2] B. Subramanian, J. Kim, M. Maray, and A. Paul, “Digital twin model: A real-time emotion recognition system for personalized healthcare,” IEEE Access, vol. 10, pp. 81155–81165, 2022.
- [3] T. Gu, B. Dolan-Gavitt, and S. Garg, “Badnets: Identifying vulnerabilities in the machine learning model supply chain,” arXiv preprint arXiv:1708.06733, 2017.
- [4] L. Gan, J. Li, T. Zhang, X. Li, Y. Meng, F. Wu, Y. Yang, S. Guo, and C. Fan, “Triggerless backdoor attack for nlp tasks with clean labels,” in Proceedings of the 2022 Conference of the North American Chapter of the Association for Computational Linguistics: Human Language Technologies, pp. 2942–2952, 2022.
- [5] T. A. Nguyen and A. T. Tran, “Wanet-imperceptible warping-based backdoor attack,” in International Conference on Learning Representations, 2021.
- [6] S.-Y. Chou, P.-Y. Chen, and T.-Y. Ho, “How to backdoor diffusion models?,” in Proceedings of the IEEE/CVF Conference on Computer Vision and Pattern Recognition, pp. 4015–4024, 2023.
- [7] J. Bai, R. Wang, and Z. Li, “Physics-constrained backdoor attacks on power system fault localization,” in 2023 IEEE Power & Energy Society General Meeting (PESGM), pp. 1–5, IEEE, 2023.
- [8] P.-Y. Chen and C.-J. Hsieh, Adversarial robustness for machine learning. Academic Press, 2022.
- [9] P. Zhao, P.-Y. Chen, P. Das, K. N. Ramamurthy, and X. Lin, “Bridging mode connectivity in loss landscapes and adversarial robustness,” arXiv preprint arXiv:2005.00060, 2020.
- [10] E. Borgnia, V. Cherepanova, L. Fowl, A. Ghiasi, J. Geiping, M. Goldblum, T. Goldstein, and A. Gupta, “Strong data augmentation sanitizes poisoning and backdoor attacks without an accuracy tradeoff,” in ICASSP 2021-2021 IEEE International Conference on Acoustics, Speech and Signal Processing (ICASSP), pp. 3855–3859, IEEE, 2021.
- [11] K. Huang, Y. Li, B. Wu, Z. Qin, and K. Ren, “Backdoor defense via decoupling the training process,” arXiv preprint arXiv:2202.03423, 2022.
- [12] S. Pal, R. Wang, Y. Yao, and S. Liu, “Towards understanding how self-training tolerates data backdoor poisoning,” arXiv preprint arXiv:2301.08751, 2023.
- [13] S. Kolouri, A. Saha, H. Pirsiavash, and H. Hoffmann, “Universal litmus patterns: Revealing backdoor attacks in cnns,” in Proceedings of the IEEE/CVF Conference on Computer Vision and Pattern Recognition, pp. 301–310, 2020.
- [14] R. Wang, G. Zhang, S. Liu, P.-Y. Chen, J. Xiong, and M. Wang, “Practical detection of trojan neural networks: Data-limited and data-free cases,” in Computer Vision–ECCV 2020: 16th European Conference, Glasgow, UK, August 23–28, 2020, Proceedings, Part XXIII 16, pp. 222–238, Springer, 2020.
- [15] G. Shen, Y. Liu, G. Tao, S. An, Q. Xu, S. Cheng, S. Ma, and X. Zhang, “Backdoor scanning for deep neural networks through k-arm optimization,” in International Conference on Machine Learning, pp. 9525–9536, PMLR, 2021.
- [16] X. Xu, Q. Wang, H. Li, N. Borisov, C. A. Gunter, and B. Li, “Detecting ai trojans using meta neural analysis,” in 2021 IEEE Symposium on Security and Privacy (SP), pp. 103–120, IEEE, 2021.
- [17] Y. Li, X. Lyu, N. Koren, L. Lyu, B. Li, and X. Ma, “Anti-backdoor learning: Training clean models on poisoned data,” Advances in Neural Information Processing Systems, vol. 34, pp. 14900–14912, 2021.
- [18] J. Guo, Y. Li, X. Chen, H. Guo, L. Sun, and C. Liu, “Scale-up: An efficient black-box input-level backdoor detection via analyzing scaled prediction consistency,” arXiv preprint arXiv:2302.03251, 2023.
- [19] Y. Gao, C. Xu, D. Wang, S. Chen, D. C. Ranasinghe, and S. Nepal, “Strip: A defence against trojan attacks on deep neural networks,” in Proceedings of the 35th Annual Computer Security Applications Conference, pp. 113–125, 2019.
- [20] H. Huang, X. Ma, S. Erfani, and J. Bailey, “Distilling cognitive backdoor patterns within an image,” arXiv preprint arXiv:2301.10908, 2023.
- [21] B. Chen, W. Carvalho, N. Baracaldo, H. Ludwig, B. Edwards, T. Lee, I. Molloy, and B. Srivastava, “Detecting backdoor attacks on deep neural networks by activation clustering,” arXiv preprint arXiv:1811.03728, 2018.
- [22] Y. Liu, S. Ma, Y. Aafer, W.-C. Lee, J. Zhai, W. Wang, and X. Zhang, “Trojaning attack on neural networks,” in 25th Annual Network And Distributed System Security Symposium (NDSS 2018), Internet Soc, 2018.
- [23] X. Chen, C. Liu, B. Li, K. Lu, and D. Song, “Targeted backdoor attacks on deep learning systems using data poisoning,” arXiv preprint arXiv:1712.05526, 2017.
- [24] A. Turner, D. Tsipras, and A. Madry, “Label-consistent backdoor attacks,” arXiv preprint arXiv:1912.02771, 2019.
- [25] B. Wang, Y. Yao, S. Shan, H. Li, B. Viswanath, H. Zheng, and B. Y. Zhao, “Neural cleanse: Identifying and mitigating backdoor attacks in neural networks,” in 2019 IEEE Symposium on Security and Privacy (SP), pp. 707–723, IEEE, 2019.
- [26] W. Guo, L. Wang, X. Xing, M. Du, and D. Song, “Tabor: A highly accurate approach to inspecting and restoring trojan backdoors in ai systems,” arXiv preprint arXiv:1908.01763, 2019.
- [27] Y. Liu, G. Shen, G. Tao, Z. Wang, S. Ma, and X. Zhang, “Complex backdoor detection by symmetric feature differencing,” in Proceedings of the IEEE/CVF Conference on Computer Vision and Pattern Recognition, pp. 15003–15013, 2022.
- [28] Z. Xiang, D. J. Miller, and G. Kesidis, “Post-training detection of backdoor attacks for two-class and multi-attack scenarios,” arXiv preprint arXiv:2201.08474, 2022.
- [29] X. Hu, X. Lin, M. Cogswell, Y. Yao, S. Jha, and C. Chen, “Trigger hunting with a topological prior for trojan detection,” arXiv preprint arXiv:2110.08335, 2021.
- [30] K. Liu, B. Dolan-Gavitt, and S. Garg, “Fine-pruning: Defending against backdooring attacks on deep neural networks,” in International symposium on research in attacks, intrusions, and defenses, pp. 273–294, Springer, 2018.
- [31] Y. Li, X. Lyu, N. Koren, L. Lyu, B. Li, and X. Ma, “Neural attention distillation: Erasing backdoor triggers from deep neural networks,” arXiv preprint arXiv:2101.05930, 2021.
- [32] J. Gawlikowski, C. R. N. Tassi, M. Ali, J. Lee, M. Humt, J. Feng, A. Kruspe, R. Triebel, P. Jung, R. Roscher, et al., “A survey of uncertainty in deep neural networks,” arXiv preprint arXiv:2107.03342, 2021.
- [33] Y. Gal and Z. Ghahramani, “Dropout as a bayesian approximation: Representing model uncertainty in deep learning,” in international conference on machine learning, pp. 1050–1059, PMLR, 2016.
- [34] A. Krizhevsky and G. Hinton, “Learning multiple layers of features from tiny images,” Technical Report TR-2009, 2009.
- [35] K. He, X. Zhang, S. Ren, and J. Sun, “Deep residual learning for image recognition,” in Proceedings of the IEEE Conference on Computer Vision and Pattern Recognition (CVPR), June 2016.
- [36] O. Russakovsky, J. Deng, H. Su, J. Krause, S. Satheesh, S. Ma, Z. Huang, A. Karpathy, A. Khosla, M. Bernstein, et al., “Imagenet large scale visual recognition challenge,” International journal of computer vision, vol. 115, pp. 211–252, 2015.
- [37] Y. Li, Y. Li, B. Wu, L. Li, R. He, and S. Lyu, “Invisible backdoor attack with sample-specific triggers,” in Proceedings of the IEEE/CVF International Conference on Computer Vision, pp. 16463–16472, 2021.
- [38] X. Qi, T. Xie, Y. Li, S. Mahloujifar, and P. Mittal, “Revisiting the assumption of latent separability for backdoor defenses,” in The eleventh international conference on learning representations, 2022.
- [39] B. Tran, J. Li, and A. Madry, “Spectral signatures in backdoor attacks,” arXiv preprint arXiv:1811.00636, 2018.
- [40] J. Hayase, W. Kong, R. Somani, and S. Oh, “Spectre: Defending against backdoor attacks using robust statistics,” in International Conference on Machine Learning, pp. 4129–4139, PMLR, 2021.
- [41] D. Tang, X. Wang, H. Tang, and K. Zhang, “Demon in the variant: Statistical analysis of DNNs for robust backdoor contamination detection,” in 30th USENIX Security Symposium (USENIX Security 21), pp. 1541–1558, 2021.
Appendix
Appendix A Pilot studies on More Attacks
In this section, we will show the more results of our pilot study in Section 4.1 and a combined method between MC-Dropout and SCP. We maintain the same experimental setup with pilot study that conduct experiments on the CIFAR-10 dataset with ResNet-18 trained 100 epochs. Apart from Adaptive-Blend attack, which has a poisoning ratio of 1%, all other attacks maintain a poisoning ratio of 10%.
A.1 Pilot Study: MC-Dropout Predictive Uncertainty.
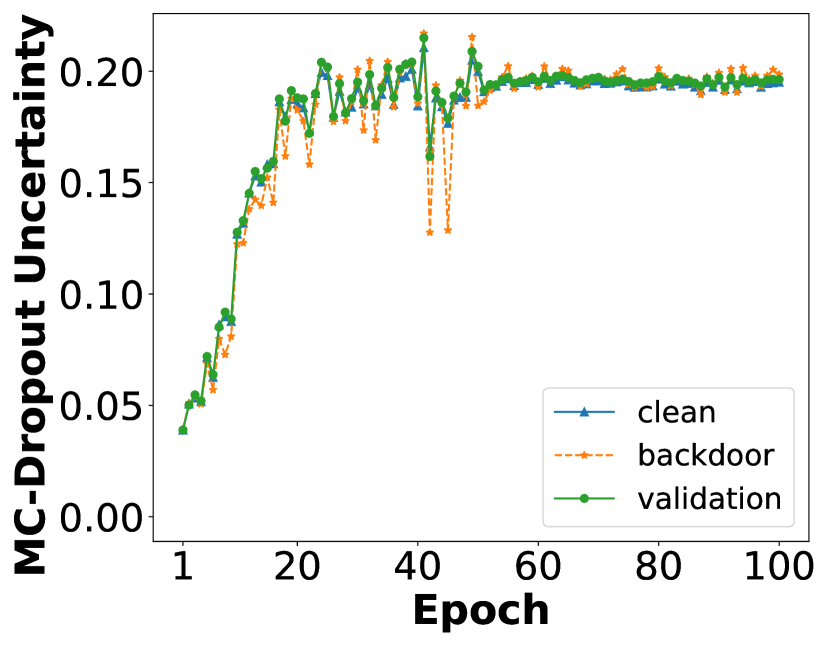
As shown in Figure A1, under most attacks, the average MC-Dropout uncertainty of backdoor training data is significantly smaller than that of clean data, both lower than clean training data and clean validation data, and this difference tends to stabilize in the later stages of model training. However, under Adaptive-Blend attack, we can observe that the uncertainty of backdoor training data is even slightly higher than clean training data. The observations align with the part of our first pilot study in the main paper Section 4.1, which suggests that using uncertainty defined by standard deviation alone may not be sufficient to detect backdoor data in general attack scenarios.
A.2 Exploring the Potential Synergy: MC-Dropout and SCP in Combination.
In the Section 4.1 of our main paper, we can observe that the model’s mapping from trigger to target label in backdoor data is more salient and robust compared to general image features. In light of this observation, we hypothesize the potential factor of the proximity between backdoor training data uncertainty and clean training data under WaNet attack can be attributed to the absence of sufficient sabotage on the image features. We expect that the model’s ability to extract feature patterns from clean data will be significantly affected, while that from backdoor data will be minimally impacted. Consequently, we can enlarge the uncertainty gap between clean data and backdoor data. One direct method is to increase the dropout rate . However, due to our inability to ascertain the presence or quantity of backdoor data within the suspicious training dataset, we encounter difficulty in determining an optimal value for . Thus, we incorporate elements of SCP approach to introduce a more controllable uncertainty with MC-Dropout uncertainty. SCP can be considered as an instance of input-level uncertainty. It amplifies the pixel values of input images by multiple times, aiming to disrupt the feature patterns in the image. Therefore, we conduct further experiments to see if adding input-level uncertainty further disrupts the general feature patterns in the image.
Settings.
We only incorporate controllable input-level uncertainty in our experiments. Specifically, we first amplify the pixel values of input images by a factor of three following SCP. Then we compute the MC-Dropout uncertainty of these scaled input images in three data types. Our goal is that controllably increase the uncertainty of the input data, and deeply disrupt the feature patterns in the image. As an expected result, the uncertainty of the clean training data becomes closer to that of the clean validation data, whereas the backdoor training data uncertainty becomes markedly distant from them.
Results.
As illustrated in Figure A2, under most attack scenarios, we observe an increase in average uncertainty for both clean training data and clean validation data, with their uncertainties nearly overlapping. This will enable us to better utilize the uncertainty of validation data to approximate the uncertainty of clean training data. From Figure 2(a), we can observe that the average uncertainty of benign model on the three data types is significantly increasing after scaling pixel values. This indicates that the introduction of input-level uncertainty indeed enhances the model predictive uncertainty further, and its strength can be easily controlled by adjusting the multiplicative factor of SCP.
However, under WaNet scenario, one can see from Figure 2(f) that although the uncertainty of the clean training data becomes closer to that of the clean validation data after scaling, the uncertainty gap between clean training and backdoor training data further reduces. Furthermore, as shown in Figure 2(e) and Figure 2(h), under the Label-Consistence and the Adaptive-Blend attack scenarios, the backdoor training data exhibits only slightly smaller uncertainty than that of clean training data, which poses significant challenges for their differentiation.
Backdoor training data exhibits the same uncertainty as both clean training data and clean validation data, indicating a failure in the combination of MC-Dropout uncertainty and input-level uncertainty. In addition, the scaling factor is a parameter that is difficult to ascertain when we have a lack of the knowledge about backdoor attack. Therefore, we cannot directly utilize this method.
Appendix B Prediction Shift Phenomenon on More Scenarios
In this section, we will show the more results of PS phenomenon on the more poisoned models, more architectures, and more dataset. It demonstrates the broad applicability of our approach in diverse real-world scenarios. We maintain the same experimental setup with Section 4.2.
B.1 PS Phenomenon on More Poisoned Models.
As shown in Figure A3, the shift ratio curve of clean data maintains consistency across diverse attack scenarios, i.e., the shift ratio increases with the growth of dropout rate and eventually stabilizes. Similarly, the shift ratio curve of backdoor data also exhibits certain consistency across various attack scenarios, always presenting a relatively lower at a specific . This suggests that the PS phenomenon and neuron bias effect do not depend on the specific type of backdoor attack, but rather are intrinsic properties of the model. Furthermore, different attack scenarios lead to distinct shift ratio curves of backdoor data.
Except for the ISSBA attack, the shift intensity of clean data is not pronounced. In other attacks, the shift intensity of clean data is extremely strong. More importantly, in all attack scenarios, clean data exhibits a bias towards the target class (class 0 in our experiments). This further indicates that when the model has good generalizability, the neuron bias path established by the backdoor data in the model becomes more stable and specific. This property may be exploited in the future to detect the target class of backdoor attacks.
B.2 PS Phenomenon on Tiny ImageNet Dataset.

From the observation of Figure A4, we can find that the PS phenomenon and neuron bias effect persist even in the more complex Tiny ImageNet dataset.
The shift ratio curve trends for the three data types(clean training data, clean validation data, and backdoor training data) in the model trained on the Tiny ImageNet dataset remain consistent with the trends observed in the model trained on the CIFAR-10 dataset. Specifically, for the benign model, the shift ratio still increases with the dropout rate and eventually stabilizes. For the poisoned models, BadNet and WaNet, the shift ratio curve for the backdoor data always presents a relatively lower at a specific .
The key difference is that the PS phenomenon is less pronounced in the models trained on the Tiny ImageNet dataset, as evidenced by a significant reduction in the shift intensity. Additionally, the shift class in these models tends to be biased towards certain specific classes, rather than the target class (class 0 in our experiments).
As the more complex features and larger number of classes in the Tiny ImageNet dataset, the model’s generalization capacity may still be insufficient , despite the use of data augmentation techniques. We hypothesize that the inadequate generalization capability results in less stable and distinct neuron bias paths. This allows a relatively small to cause the neuron bias path to overweigh the normal feature path, resulting in the presence of PS phenomenon in clean data, but without a strong neuron bias towards the target class. Meanwhile, the backdoor data remains relatively stable and almost does not exhibit the PS phenomenon. Our method effectively leverages the key difference in the PS phenomenon between clean data and backdoor data to enable the effective detection of backdoor data.
B.3 PS Phenomenon on VGG Architecture.

Despite assuming that the defender can freely choose the model architecture, we also conducted experiments using the VGG16-bn model to show that our method is not dependent on any specific model architecture. The experiment was conducted as follows Section 4.2.
The results presented in Figure A5 demonstrate that the PS phenomenon is also evident within the VGG architecture, similar with the observations made in the main paper for the ResNet-18 model. Notably, a certain degree of PS is also present even in the benign model, affecting both the clean training data and the clean validation data. Consistent with the findings under the BadNet and WaNet attacks, there still exist specific dropout that can cause the clean data to exhibit a strong PS phenomenon while that of backdoor data is extremely weak.
The findings align with our conclusion that the PS phenomenon and neuron bias effect are widely prevalent in DNNs, rather than being specific to particular model architectures. While the variations in model architecture may result in different shift ratio curves and shift intensity, they do not impact the existence of the PS phenomenon and neuron bias effect.
Appendix C Experiments Details
C.1 Detailed Settings for Datasets and Training of Backdoored Models.
| Dataset | # Input size | Classes | Training images | Testing images | Validation images |
|---|---|---|---|---|---|
| CIFAR-10 | 33232 | 10 | 50,000 | 10,000 | 2,500 |
| Tiny ImageNet | 36464 | 200 | 100,000 | 10,000 | 5,000 |
| Dataset | Models | Optimizer | Epochs | Initial | Learning Rate | Learning Rate | Momentum | Weight |
|---|---|---|---|---|---|---|---|---|
| Learning Rate | Scheduler | Decay Epoch | Decay | |||||
| CIFAR-10 | ResNet-18 | SGD | 100 | 0.1 | MultiStep LR | 50,75 | 0.9 | 1e-4 |
| Tiny ImageNet | ResNet-18 | SGD | 100 | 0.1 | MultiStep LR | 50,75 | 0.9 | 1e-4 |
The details of datasets and training procedures of DNN models in our experiments are summarized in Table A1 and Table A2. Note that clean validation data refers to the clean data we used to filter backdoor training data, which was 5% of the total quantity of whole training dataset randomly selected from the test set of CIFAR-10 and the validation set of Tiny ImageNet, respectively.
C.2 Implements of Backdoor Attacks.
BadNets, TrojanNN, and Blend correspond to typical all-to-one label-poisoned attacks with patch-like trigger, generated trigger, and blending trigger respectively. Label-Consistent is a representative clean label attack. WaNet is an image transformation-based invisible attack. ISSBA is an effective sample-specific invisible attack which generates sample-specific invisible additive noises as backdoor triggers. It generates sample-specific invisible additive noises as backdoor triggers by encoding an attacker-specified string into benign images through an encoder-decoder network. Adaptive-Blend is an adaptive poisoning strategy suggested that can suppress the latent separability characteristic.
In order to better reconstruct the different methods of obtaining backdoor data in practice, we have implemented a portion of the attacks using an open-source toolkit - “backdoor-toolbox”. 111https://github.com/vtu81/backdoor-toolbox We are able to control the relevant settings for this subset of attacks. For the other attacks, we directly utilize the backdoor data provided by an open-source repository - “BackdoorBench”, 222https://github.com/SCLBD/BackdoorBench which is more common and important in practice, as we lack the corresponding knowledge about backdoor attacks. We show the examples of both triggers and the corresponding poisoned samples in Figure A6.
54.92479pt
Benign
pt
BadNet
pt
Blend
pt
TrojanNN
pt
Label-Consistent
pt
WaNet
pt
ISSBA
pt
Adaptive-Blend
pt
Poisoned Samples
pt
 pt
pt
 pt
pt
 pt
pt
 pt
pt
 pt
pt
 pt
pt
 pt
pt
 pt
Backdoor Trigger
pt
pt
Backdoor Trigger
pt
 pt
pt
 pt
pt
 pt
pt
 pt
pt
 pt
pt
 pt
pt
 pt
pt

BadNet.
We implemented this attack using the backdoor-toolbox. The trigger we used on CIFAR-10 is a 33 checkerboard placed in the bottom right corner of an image, and a 66 trigger placed in the same position on Tiny ImageNet.
Blend.
We implemented this attack using the backdoor-toolbox. Following the original paper [23], we choose “Hello Kitty” trigger. The blend ratio is set to 0.2.
TrojanNN.
We directly use the data provided by BackdoorBench.
Label-Consistent.
On CIFAR-10, we directly use the adversarial images provided by the original paper;333https://github.com/MadryLab/label-consistent-backdoor-code on Tiny ImageNet we use the adversarial images provided by BackdoorBench. It should be noted that the data provided by BackdoorBench does not have triggers added to the corners of the images, as described in the original paper. Therefore, we have added triggers to the original data to maintain consistency with the original paper [24]. The transparency of the triggers was set to 0.05.
WaNet.
We implemented this attack using the backdoor-toolbox. In line with the original paper [5], we maintained consistency by setting the cover ratio to twice the poisoning ratio. This means that for every poisoned data sample, there were two additional interference data samples. These interference data samples still carried the backdoor trigger but their labels were not modified to the target class.
ISSBA.
We directly use the data provided by BackdoorBench.
Adaptive-Blend.
We implemented this attack using the backdoor-toolbox. Following the original paper [38], we choose “Hello Kitty” trigger and set the the cover ratio equal to the poisoning ratio. Compared to the original paper [38], we only added the cover ratio and poisoning ratio to ensure that the attack success rate exceeds 85%. On CIFAR-10, we selected the “Hello Kitty” trigger, setting both the cover ratio and poisoning ratio to 0.01, and the blend ratio to 0.2. On Tiny ImageNet, we chose a random noise trigger, setting both the cover ratio and poisoning ratio to 0.02, and the blend ratio to 0.15.
C.3 Performance of the Benign and Poisoned Models.
Consistent with the methodology employed in previous backdoor attack studies, we utilize performance metrics to assess the effectiveness of the backdoor attacks: attack success rate (ASR) and clean accuracy (CA). ASR denotes the success rate in classifying the poisoned samples into the corresponding target classes. CA measures the accuracy of the backdoored model on the benign test dataset. ASR and CA for different backdoor attacks are included in Table A3.
| Dataset | Benign | BadNet | Blend | TrojanNN | Label-Consistence | WaNet | ISSBA | Adaptive-Blend |
|---|---|---|---|---|---|---|---|---|
| CA | ASR CA | ASR CA | ASR CA | ASR CA | ASR CA | ASR CA | ASR CA | |
| CIFAR-10 | 0.853 | 1.000 0.843 | 0.999 0.848 | 1.000 0.841 | 1.000 0.850 | 0.955 0.828 | 0.985 0.825 | 0.871 0.938 |
| Tiny ImageNet | 0.615 | 0.998 0.608 | 0.994 0.607 | 0.999 0.470 | 0.997 0.595 | 0.996 0.593 | 0.975 0.455 | 0.905 0.616 |
C.4 Implements of Baseline Defences.
C.5 Computational Environment
All experiments are conducted on a server with the Ubuntu 18.04.6 LTS operating system, a 2.10GHz CPU, 3 NVIDIA’s GeForce GTX3090 GPUs with 24G RAM.
Appendix D Detection Performance on Low Poisoning Ratio Scenario
We evaluate the performance of all detection methods under scenarios with low poisoning ratios. A small poisoning ratio prevents models from overfitting to triggers, thereby weakening the connection between triggers and target labels and presenting a significant challenge for backdoor data detection.
As shown in Table A4, PSBD demonstrated superior performance against various backdoor attacks under low poisoning scenarios, outperforming all other baseline methods on average. However, its performance exhibited a slight decline in certain attack settings. This degradation may be attributed to the reduced robustness of neuron bias paths within the model due to the limited amount of backdoor data, making it more susceptible to random fluctuations. The performance of other baseline methods deteriorated significantly, particularly on the more challenging Tiny ImageNet dataset. While Spectre achieved high TPR on CIFAR-10, its excessive FPR renders it impractical. SCAN, despite exhibiting favorable TPR and FPR, is computationally expensive and unsuitable for high-resolution image data, limiting its applicability.
| Defenses | PSBD (Ours) | Spectral Signature | Strip | Spectre | SCAN | SCP |
| Attacks | ||||||
| CIFAR-10 (All standard deviation values should be multiplied by ) | ||||||
| Badnet | 0.952(6.8)/0.167(0.9) | 0.977(1.5)/0.475(0.1) | 1.000(0.0)/0.115(0.2) | 1.000(0.0)/0.473(0.0) | 1.000(0.1)/0.090(1.5) | 1.000(0.0)/0.199(0.6) |
| Blend | 0.811(2.3)/0.163(0.0) | 0.892(0.5)/0.479(0.0) | 0.984(1.5)/0.114(0.3) | 1.000(0.1)/0.473(0.0) | 0.973(0.5)/0.015(2.6) | 0.979(1.1)/0.236(4.4) |
| TrojanNN | 0.951(1.4)/0.175(1.7) | 0.925(4.4)/0.478(0.2) | 1.000(0.0)/0.117(0.7) | 0.969(5.4)/0.475(0.3) | 0.998(0.1)/0.018(3.1) | 0.967(2.5)/0.201(0.6) |
| Label-Consistent | 1.000(0.0)/0.107(0.8) | 0.895(0.6)/0.479(0.0) | 0.977(1.0)/0.117(0.8) | 0.999(0.1)/0.473(0.0) | 0.970(0.8)/0.019(1.7) | 0.910(2.0)/0.201(0.4) |
| WaNet | 1.000(0.0)/0.113(0.4) | 0.820(0.4)/0.483(0.0) | 0.044(1.0)/0.107(0.6) | 0.985(1.1)/0.475(0.0) | 0.856(0.9)/0.036(2.0) | 0.861(6.2)/0.220(4.6) |
| ISSBA | 0.998(0.3)/0.153(4.4) | 0.877(1.3)/0.480(0.1) | 0.712(7.2)/0.120(0.3) | 0.999(0.1)/0.474(0.0) | 0.945(1.0)/0.008(1.4) | 0.937(3.9)/0.271(5.1) |
| Adaptive-Blend | 0.982(2.6)/0.184(3.6) | 0.608(19)/0.145(0.2) | 0.014(0.5)/0.069(0.4) | 0.753(8.3)/0.144(0.1) | 0.000(0.0)/0.023(4.0) | 0.779(10)/0.246(5.9) |
| Average | 0.962(1.7)/0.152(1.7) | 0.861(3.6)/0.431(0.1) | 0.714(1.5)/0.109(0.4) | 0.963(1.9)/0.427(0.1) | 0.839(0.5)/0.018(2.3) | 0.918(3.5)/0.225(3.1) |
| Tiny ImageNet (All standard deviation values should be multiplied by ) | ||||||
| Badnet | 0.996(0.2)/0.093(4.3) | 0.452(0.0)/0.502(0.0) | 0.878(4.7)/0.109(0.7) | 0.548(0.0)/0.497(0.0) | / | 0.998(0.0)/0.279(1.2) |
| Blend | 0.868(4.2)/0.076(3.8) | 0.453(0.0)/0.502(0.0) | 0.558(7.9)/0.097(0.4) | 0.548(0.0)/0.497(0.0) | / | 0.624(3.8)/0.269(0.8) |
| TrojanNN | 0.939(2.0)/0.203(0.3) | 0.453(0.0)/0.502(0.0) | 0.980(2.6)/0.107(0.7) | 0.547(0.0)/0.497(0.0) | / | 0.991(1.2)/0.279(4.3) |
| Label-Consistent | 0.894(15)/0.101(6.9) | 0.452(0.0)/0.502(0.0) | 0.518(9.1)/0.090(1.2) | 0.548(0.0)/0.497(0.0) | / | 0.978(2.9)/0.092(9.4) |
| WaNet | 0.944(5.2)/0.109(1.2) | 0.452(0.0)/0.502(0.0) | 0.107(5.1)/0.093(1.1) | 0.548(0.0)/0.497(0.0) | / | 0.314(2.7)/0.267(0.6) |
| ISSBA | 0.794(9.1)/0.217(0.1) | 0.452(0.0)/0.502(0.0) | 0.994(0.3)/0.104(1.1) | 0.547(0.0)/0.497(0.0) | / | 0.663(1.7)/0.320(0.4) |
| Adaptive-Blend | 0.949(2.9)/0.095(3.7) | 0.392(0.1)/0.502(0.0) | 0.210(16)/0.099(0.6) | 0.621(0.0)/0.497(0.0) | / | 0.505(13)/0.218(1.2) |
| Average | 0.931(3.7)/0.127(3.3) | 0.445(0.0)/0.502(0.0) | 0.595(6.8)/0.100(0.8) | 0.557(0.0)/0.497(0.0) | / | 0.684(3.2)/0.265(1.2) |
Appendix E Limitations
While this study introduces a promising approach to enhancing the security of DNNs through the Prediction Shift Backdoor Detection (PSBD) method, it primarily focuses on image classification tasks. Image classification represents only a subset of the diverse applications where DNNs are employed, and different data modalities may exhibit unique characteristics and vulnerabilities. Future studies could expand on the PSBD method to encompass a broader range of application domains, potentially adapting the underlying techniques to suit different kinds of neural network architectures and data inputs.
Appendix F Broader Impact
The development of the PSBD method for detecting backdoor attacks in DNNs holds significant potential for positive societal impacts. As DNNs continue to permeate various sectors, including healthcare, autonomous driving, and public safety, ensuring their security is paramount. By improving the reliability of DNNs used in critical infrastructure and safety-critical applications, PSBD helps to prevent potential catastrophic failures that could result from malicious manipulations. In addition, by addressing vulnerabilities in DNNs, this research can help build public trust in AI technologies, encouraging their adoption across more areas of daily life and industry.