Critical Phase Transition in a Large Language Model
Abstract
The performance of large language models (LLMs) strongly depends on the temperature parameter. Empirically, at very low temperatures, LLMs generate sentences with clear repetitive structures, while at very high temperatures, generated sentences are often incomprehensible. In this study, using GPT-2, we numerically demonstrate that the difference between the two regimes is not just a smooth change but a phase transition with singular, divergent statistical quantities. Our extensive analysis shows that critical behaviors, such as a power-law decay of correlation in a text, emerge in the LLM at the transition temperature as well as in a natural language dataset. We also discuss that several statistical quantities characterizing the criticality should be useful to evaluate the performance of LLMs.
1 Introduction
Large Language Models (LLMs) have demonstrated impressive performance in various tasks, including machine translation and code generation. To optimize their performance, tuning the hyperparameters is crucial. An example of such hyperparameters is the temperature . This parameter scales the logits of tokens to control the sharpness of distribution of the next tokens. Decreasing temperature makes the probability measures concentrate on the most likely token, while increasing temperature flattens the distribution. Empirically, at very low temperatures, generated sentences are less diverse with clear repetitive structures. Conversely, generated sentences are often disordered and incomprehensible at very high temperatures. These observations raise the question of whether this change induced by the temperature is quantitative or qualitative.
The problem of defining qualitative changes without subjectivity, such as arbitrary thresholds, is itself a major challenge. A well-defined strategy to address this question is found in the literature of phase transitions studied in statistical physics. Phase transitions are characterized by singularities in physical quantities. For example, in a ferromagnetic Ising model with a finite number of spins, the degree to which the spins are aligned, known as magnetization, decreases smoothly with increasing temperature. As the number of spins increases, this change becomes sharper and, in the infinite system size limit, it eventually becomes a strictly singular change at the phase transition temperature (Domb, 2000). This transition temperature separates the parameter space unambiguously into two phases, that is, the ordered and the disordered phases (see Fig. 1 (A)).
Phase transitions accompanying critical phenomena, e.g., power-law decays and diverging scales in the correlation functions, are said to be critical. This is in contrast with long- and short-range correlations, both of which rapidly decay to the limiting value with finite scales. At the critical point, the divergent scales of correlations allow for complex behaviors that are neither ordered nor disordered. Such behaviors have been discussed in various scientific disciplines, including computer science, biology, finance, and others (Bak et al., 1988; Langton, 1990; Munoz, 2018). Natural language is also a complex object in the sense that it is constrained by rules such as syntax and yet has infinite variety, colloquially referred to as a critical phenomenon due to a power-law correlation decay (Li, 1989; Ebeling and Pöschel, 1994; Ebeling and Neiman, 1995; Tanaka-Ishii and Bunde, 2016; Lin and Tegmark, 2017; Takahashi and Tanaka-Ishii, 2017; Shen, 2019; Takahashi and Tanaka-Ishii, 2019; Sainburg et al., 2019; Mikhaylovskiy and Churilov, 2023). However, this remains speculative and it is even unclear what kind of phase transition should be behind the putative criticality, as natural language does not have a controllable parameter such as temperature.
In this work, we use GPT-2 (Radford et al., 2019) as an effective model of natural language to systematically study the effects of the temperature parameter. In our analysis, we numerically calculate statistical properties of part-of-speech (POS) sequences generated by GPT-2. Throughout this paper, we interpret index as time and a POS sequence as a time series 111 We might also consider as a spatial position. Under this interpretation, the sequence can be regarded as a one-dimensional configuration of a Potts spin system with interacting spins (Wu, 1982). The integrated correlation in Sec. 3.1 corresponds to a static susceptibility, the power spectrum in Sec. 3.2 to the structure factor, and the vector in Sec. 3.3 to the magnetization of each spin. . Note that causality is broken in the step of POS tagging, since the POS tag assigned to a word can be affected by the subsequent context. Our extensive numerical analyses on the statistical quantities strongly suggest that a phase transition occurs at temperature as illustrated in Fig. 1 (B). Below , sequences have long-range correlation and repetitive structures. On the other hand, above , the correlation converges to zero, and repetitive structures disappear. We further demonstrate that sequences at the transition point are critical, with a critical decay in a correlation and dynamical slowing down. The observed behaviors exhibit several intriguing features that are not known in equilibrium statistical-mechanical systems. At high temperatures, we find that the system is not simply disordered even though the correlation decays faster than the one at the critical point. The low-temperature phase is ordered, with characteristic power spectra implying its chaotic nature. Finally, we measure the same statistical quantities for a natural language dataset, providing the interpretation that natural languages are associated with the critical point of GPT-2 (see Fig. 1 (C)).
Our major contributions are the following:
-
•
We systematically investigate statistical quantities of sequences generated by GPT-2 at various sampling temperatures to clearly characterize the effect of temperature and suggest the possibility of the use of statistical measures for evaluating LLMs.
-
•
Our work provides the first convincing numerical evidence that a practical LLM exhibits a phase transition. This finding introduces novel approaches to understanding the mechanism of LLMs from a perspective of critical phenomena studied in statistical physics.
-
•
We show that the criticality of GPT-2 is intriguing also from a statistical-mechanics perspective, which may be caused by the complex architecture of LLMs with vast numbers of parameters trained on large-scale corpora. We also discuss the peculiar temporal structures at high and low temperatures.
-
•
We conduct a numerical analysis of the statistical properties of a natural language dataset and discuss connections with the criticality of GPT-2.
1.1 Related Work
Investigation of the effect of temperature on LLMs: Previous research has studied how the sampling temperature affects the behavior of LLMs in inference. Renze and Guven (2024) studied the effect of temperature on the performance on problem-solving tasks. Xu et al. (2022); Pursnani et al. (2023); Zhu et al. (2024b), and Grandi et al. (2024) also evaluated the performance on tasks such as code generation, engineering exams, and material selection under different temperature settings. Fradkin et al. (2023) examined how narratives generated by GPT-2 change with temperature from a psychiatric perspective. In contrast to these studies, our work does not focus on the task-specific performance of GPT-2 at various temperatures but rather measures the statistical properties of generated texts to find the existence of phase transitions and critical behaviors.
Phase transitions in practical language models: The performance of LLMs sometimes improves in unexpected manners with increasing model scales (Brown et al., 2020; Srivastava et al., 2022; Ganguli et al., 2022). Wei et al. (2022) named “abilities that are not present in smaller-scale models but are present in large-scale models” emergent abilities, mentioning phase transitions, although Schaeffer et al. (2024) has argued that such emergent abilities may not be essentially qualitative changes. Grokking (Power et al., 2022) in neural networks, the emergence of generalization after overfitting with increasing learning steps, is also sometimes discussed in connection with phase transitions (Liu et al., 2022a; Thilak et al., 2022; Nanda et al., 2023; Varma et al., 2023). Liu et al. (2022b) and Zhu et al. (2024a) reproduced grokking with simple language models and tasks. However, emergent abilities and grokking in practical language models have not yet been formally characterized as phase transitions, as discussed in our study. It is also important to note that these phenomena are changes in performance induced by model scale or learning steps, contrary to the changes in generated sequences induced by sampling temperature on which we focus.
During the preparation of our manuscript, we noticed an independent work by Bahamondes (2023), which measured statistical quantities of sequences of tokens or embedding vectors generated by GPT-2 trained on OpenWebText dataset (Wolfram Research, 2019; Radford et al., ). This study claimed that a phase transition occurs at . However, they did not mention the dependence of correlation on distance or the asymptotic behavior in the limit of infinite sequence length. We should also note that the phase transition discussed in Bahamondes (2023) would be distinct from the one we study in this work, as the temperature scale is very different.
Theoretical analyses of phase transitions in language models: Some theoretical studies have examined phase transitions in mathematical models to explain phenomena such as emergent abilities (Chang, 2023) and grokking (Žunkovič and Ilievski, 2022; Rubin et al., 2024), although some of them are not necessarily limited to LLMs. Cui et al. (2024) demonstrated that a simple model with a self-attention mechanism exhibits a phase transition between phases corresponding to positional and semantic mechanisms. However, all of them have discussed different phenomena from a sampling-temperature-induced phase transition in generated sequences, which we discuss in this study.
Correlation in natural languages: Power-law decays in correlations and mutual information have been observed across different natural language datasets222 Note that the earlier studies often referred to correlations decaying in a power-law function as long-range correlations. In this study, by long-range correlations we mean correlations that converge to a non-zero value. (Li, 1989; Ebeling and Pöschel, 1994; Ebeling and Neiman, 1995; Tanaka-Ishii and Bunde, 2016; Lin and Tegmark, 2017; Takahashi and Tanaka-Ishii, 2017; Shen, 2019; Takahashi and Tanaka-Ishii, 2019; Sainburg et al., 2019; Mikhaylovskiy and Churilov, 2023). These studies, however, did not measure the correlation or mutual information between POS tags, which is our focus. Futrell and Levy (2017) and Futrell et al. (2019) have measured mutual information between POS tags, only to show that the mutual information decreases with distance.
Correlation in texts generated by language models: The analysis of correlation and other statistical quantities in texts generated by language models have been conducted numerically and theoretically by Takahashi and Tanaka-Ishii (2017); Shen (2019); Takahashi and Tanaka-Ishii (2019), and Mikhaylovskiy and Churilov (2023), which concluded that the presence of power-law decays in correlations can depend on models, methods, and setups. These studies have not examined how the correlations depend on parameters such as temperatures. Lippi et al. (2019) has found a power-law decay in a correlation in texts generated by language models with varying temperatures in comparison with natural language datasets. However, the existence of phase transitions was not discussed in their works.
2 Setup
We analyze sequences generated by GPT-2 (Radford et al., 2019) using Hugging Face transformers library (Wolf et al., 2020), with temperature sampling (Ackley et al., 1985). Each sequence starts with the single beginning-of-sentence token and ends once the end-of-sentence token appears or when its length reaches the default length limit of . The -th token is sampled according to the softmax distribution without top- (Fan et al., 2018) or top- (Holtzman et al., 2020) sampling strategies. is the logit of , while is the temperature parameter, although it does not necessarily coincide with physical temperature. We then tokenize each of the generated sequences using the GPT-2 tokenizer. To estimate statistical quantities precisely, it is useful to map each generated text into a sequence of variables that take a small number of states while preserving linguistic information. For this purpose, we employ POS tagging using the spaCy library (Montani et al., 2023) with en_core_web_sm pipeline. This process transforms the generated texts into POS sequences , where takes one of 18 different POS tags, that is, 17 Universal POS tags plus SPACE.
We sampled POS sequences at each temperature. Sampling at any given temperature took less than a day using a single NVIDIA A100. To study the POS sequences of length , we have used only samples that are longer than and extracted the first tags from the beginning. For example, a POS sequence of is used for but not for . The number of samples to compute statistical quantities is . We have confirmed that this sampling method does not qualitatively affect the results presented below (see App. A). Error bars in the figures represent an confidence interval estimated using the symmetric bootstrap- method (Hall, 1988).
3 Numerical results for GPT-2 sequences
In this section, we conduct a detailed statistical analysis of sequences generated by GPT-2 to understand the effect of temperature on their structure and dynamics. More specifically, we study the correlation between POS tags, the power spectra of these sequences, and the time evolution of POS tag distributions.
3.1 Correlation between Two Tags
First, we focus on the time correlation between two tags, and :
| (1) |
where and are POS such as NOUN and VERB, is the Kronecker delta, and stands for an average over the POS sequences at a fixed temperature . The dependence of the correlation function on the time interval indicates the structure of generated texts. If a text is completely random and disordered, the correlation function decays rapidly with . In contrast, a text with an order, such as a repetitive structure, exhibits a correlation that remains finite even at large . The POS tags yield distinct values for . Nevertheless, in the following, we will only discuss the correlation with both and being the proper noun, abbreviated PROPN, because it has the largest correlation among all others at any temperature (see App. B for more detail). Therefore, we simply refer to as . Unless otherwise specified, a similar notation is used for other quantities.
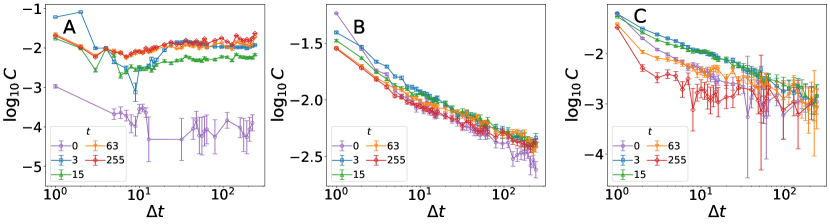
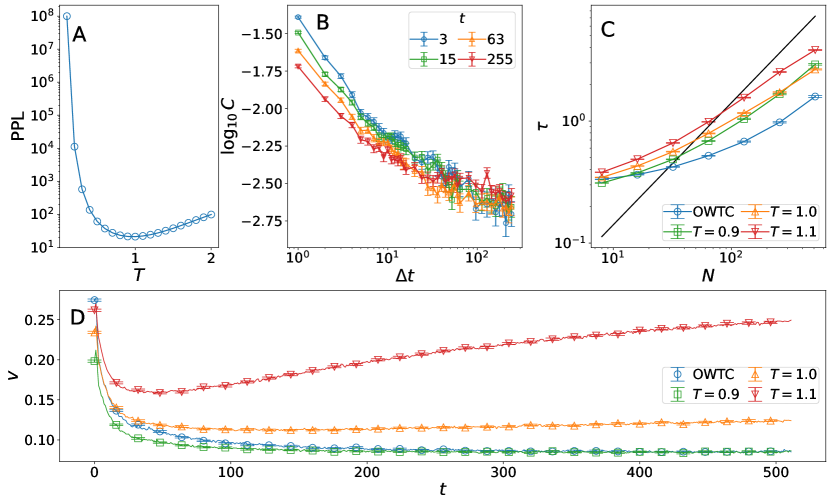
Figure 2 shows the correlation at , , and (see App. C for the results at other temperatures). At , the correlation converges to a positive value as the interval increases, whereas the plateau value increases with the position of the former tag. This is typical behavior when a given system has a long-range order. At the boundary temperature of between low and high temperatures, the correlation decays in a power-law function of with a constant prefactor. This is a critical decay with a divergent time scale. Apparently, the correlation at also follows a power law. At first sight, this seems to indicate the system is critical at even high temperatures. However, the prefactor for this decay becomes smaller with increasing , meaning that the decay is faster than the critical decay.
To better understand the dependence of the correlation function, we compute the integrated time correlation:
| (2) |
where is the proportion of POS in a sequence. When the correlation converges to a finite value or follows a critical decay, diverges at . Therefore, a finite in the limit means that the correlation decays qualitatively faster than a critical decay. This quantity allows us to clearly discriminate between the two distinct behaviors from the dependence of .
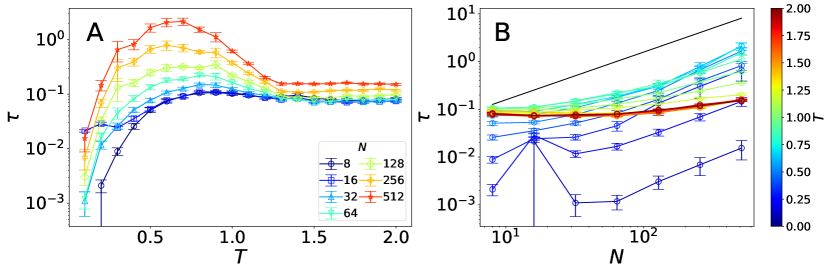
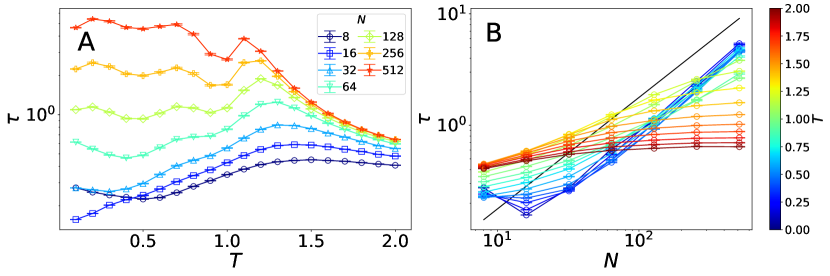
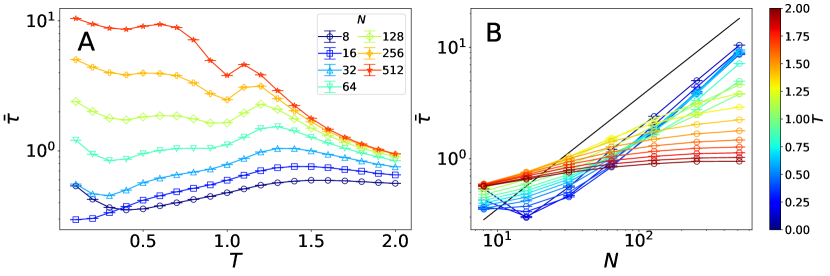
We show the integrated correlation as a function of in Fig. 3 (A). The integrated correlation increases with decreasing temperature, with a peak at , and then rises again towards lower temperatures. Notably, strongly depends on in the low-temperature regime, , while it converges to a finite value at high temperature for large , as more clearly seen in as a function of , see Fig. 3 (B). These observations strongly suggest the presence of a critical temperature below which is infinitely large at , meaning that, at low temperatures, the generated sequences are qualitatively different from those at high temperatures. In other words, a phase transition with divergent statistical quantities occurs at the temperature , as illustrated in Fig. 1 (B).
In equilibrium statistical mechanics, finite integrated correlations directly indicate asymptotic exponential decay in correlation functions and disordered structures of the system. Meanwhile, the correlation in the POS sequences at high temperatures does not have a simple exponential decay, whereas the integrated correlation converges to a finite value. This suggests that the high-temperature phase is not simply disordered.

3.2 Power spectra of POS sequences
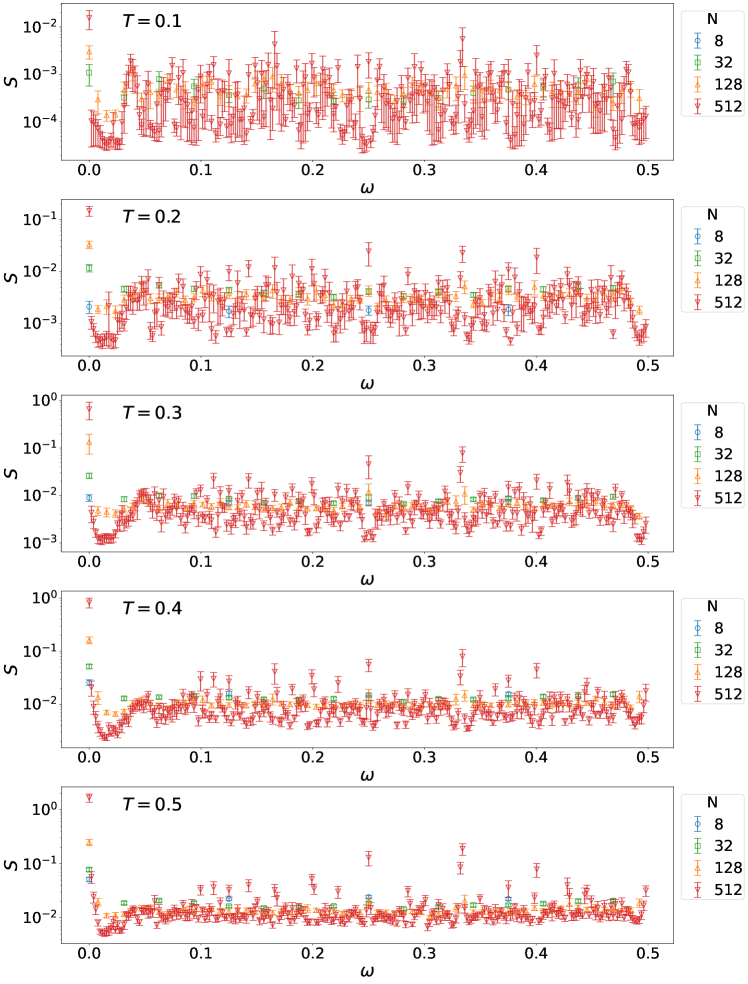
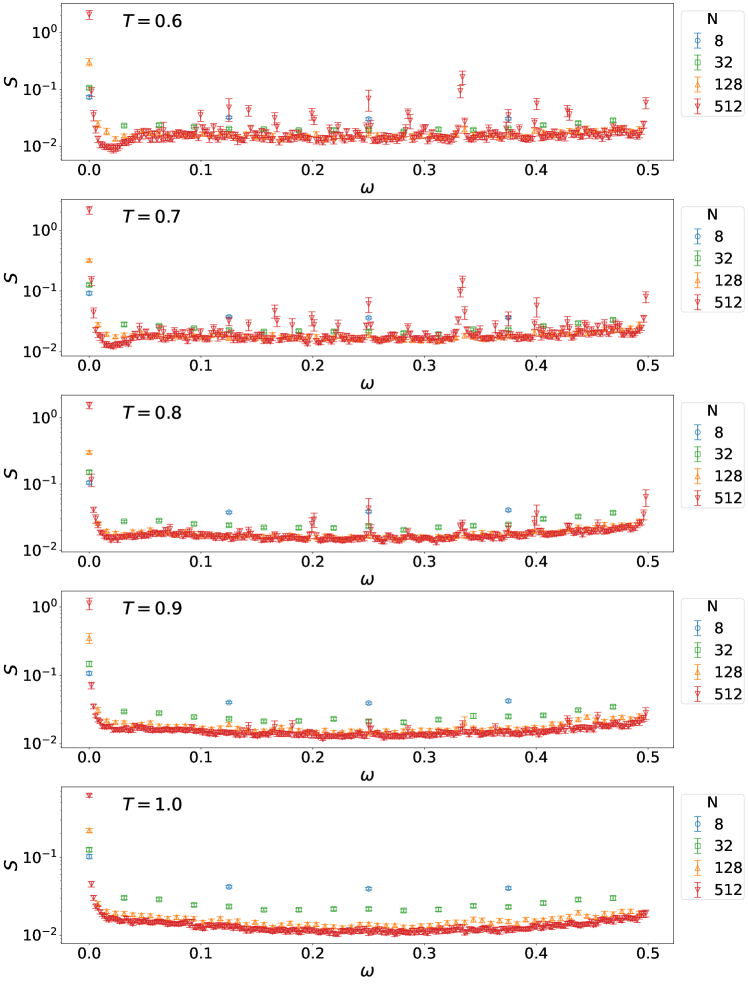
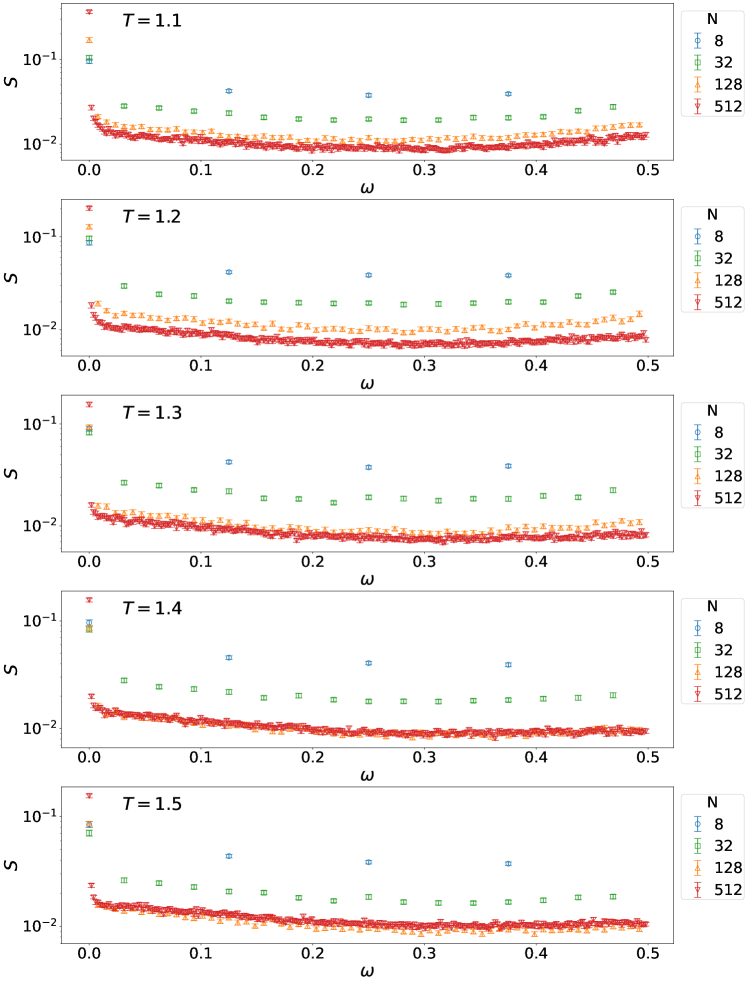
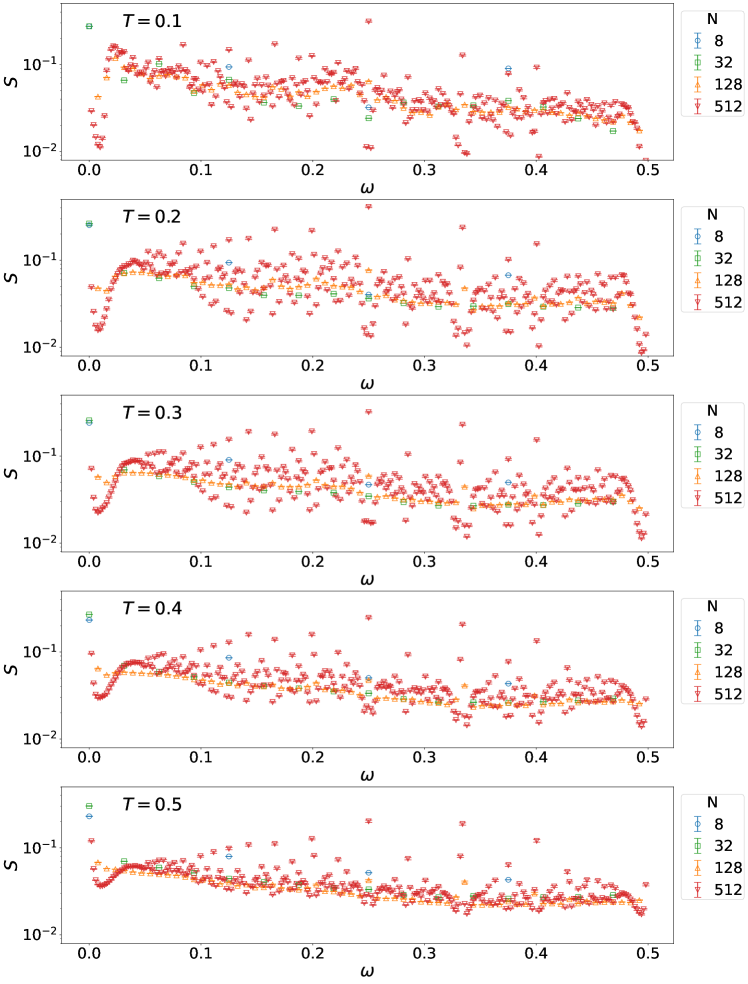
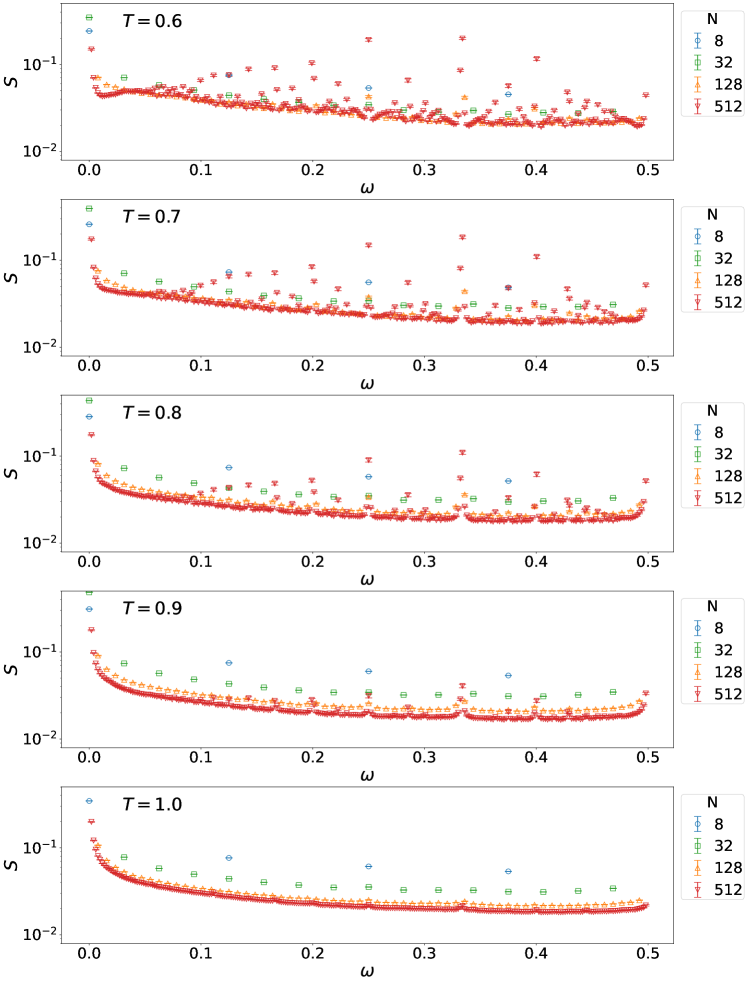
Our numerical results raise the question of what structures emerge in the sequences below . To answer this question, we compute the power spectrum, that is, the amplitudes of the Fourier modes of the sequences characterized by POS :
| (3) |
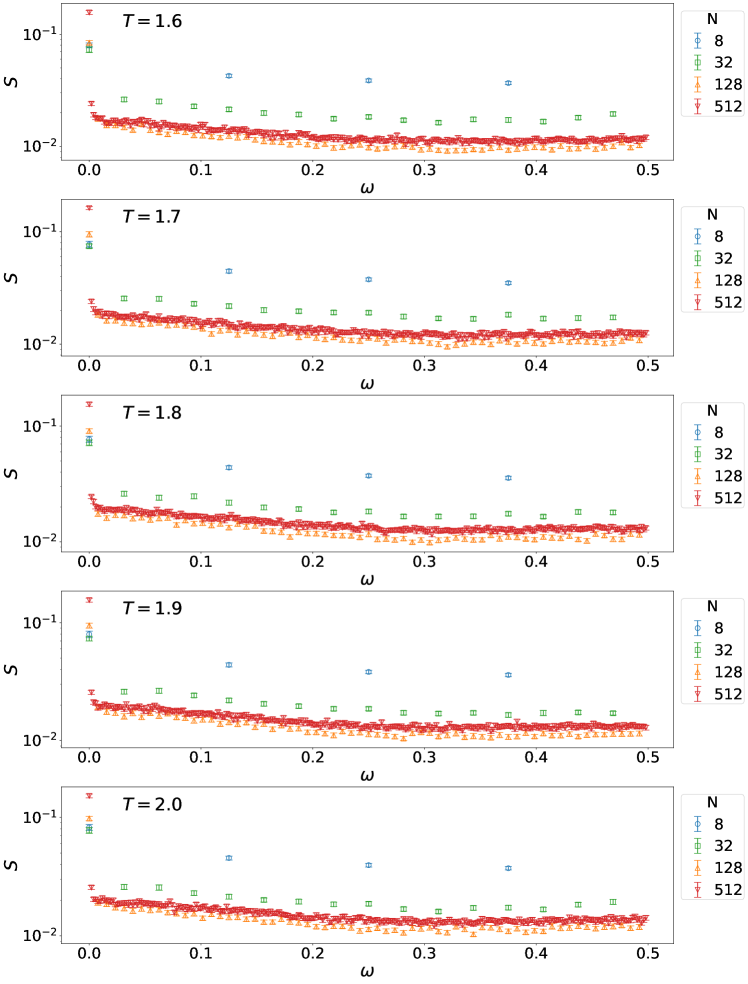
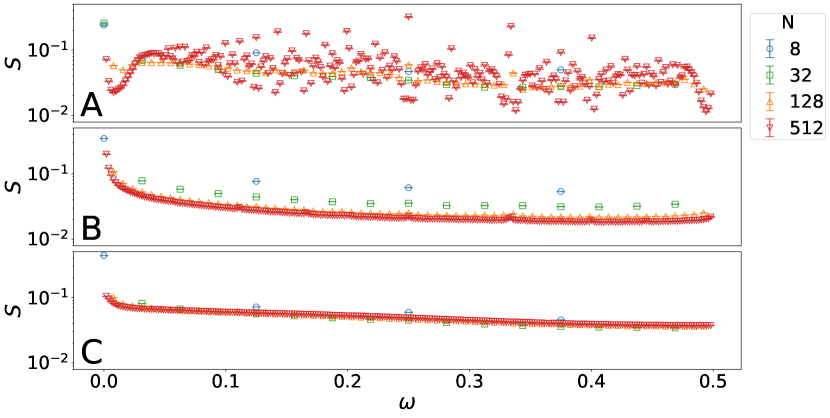
The results of at , , and are shown in Fig. 4 (see App. D for other temperatures). The spectrum at high temperatures is relatively featureless, with a single peak at . At , near , it has multiple small peaks besides the one at for , but those peaks do not diverge at . With further decreasing temperature, has many peaks that grow with , indicating the presence of long-range order. This spectral behavior clearly demonstrates that the well-known repetitive structures emerge only below the critical temperature. However, the analysis reveals a much richer structure than expected: The sequences indeed have repetitions but with many distinct Fourier modes. This characteristic power spectrum at low temperature is in contrast with simple periodic structures, which have only a few number of dominant Fourier modes.
3.3 Time evolution of POS sequences
Thus far, we have analyzed the statistical properties of the entire sequences of length from the beginning. The behavior of correlation has suggested that, on a short time scale, the distribution of the POS tags strongly depends on , and it gradually approaches its stationary state at large (see Fig. 2). This observation motivates further analysis of the sequences: How the POS tags evolve with time.
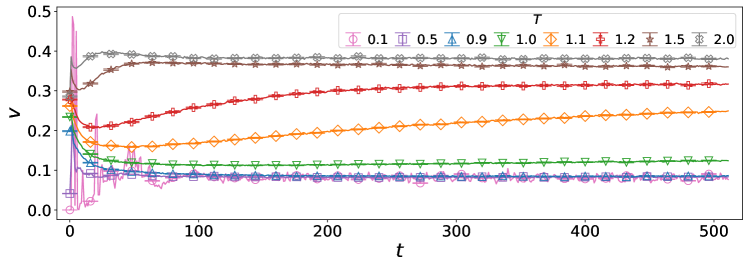
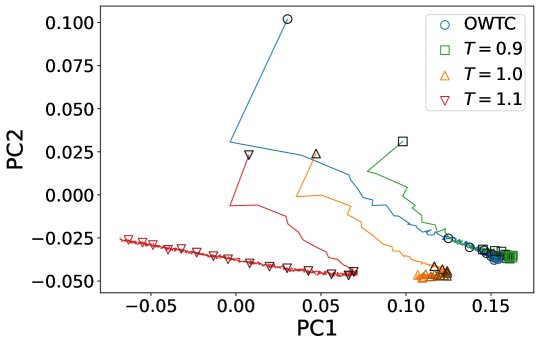
We calculate the probability of POS tag at time being , . Figure 5 shows as a function of time at several temperatures. This not only confirms the aforementioned observation but also reveals that the time scale to reach the stationary value greatly varies with . At temperatures far from , both higher and lower, reaches the limiting value rapidly; at low temperatures, it takes a small value, , while it is a larger one at high temperatures. This is in contrast to the fact that the correlation at high temperatures significantly depends on even at , see Fig. 2 (C). Near , on the other hand, the convergence of to its stationary state is much slower, indicating critical slowing down. Considering that GPT-2 generates long comprehensible texts around , we expect that texts are natural only during the transient time before reaching the stationary state and that texts become too repetitive or incomprehensible once reaches the stationary state. If this is indeed the case, then GPT-2 should work well even at lower temperatures if the required sequence length is shorter than the transient time. This view is consistent with the empirical fact that LLMs perform well for practical tasks even when the temperature is lower than (Renze and Guven, 2024). To reveal the underlying dynamics in the entire 18-dimensional space of , we employ principal component analysis (PCA). The result shows that dominates the first principal component (PC), meaning that makes an important contribution in the dynamics of . Similar critical behaviors are also observed in the two-dimensional PC space (these results are presented in App. E).
4 Criticality in Natural Language Corpora
We have shown that generated sequences by GPT-2 have critical properties at . Empirically, GPT-2 generates comprehensible texts around the same point. From these, it is reasonable to consider that natural languages have statistical properties similar to critical GPT-2. Indeed, earlier studies have found power-law decays in correlations across some natural language text and speech corpora (Li, 1989; Ebeling and Pöschel, 1994; Ebeling and Neiman, 1995; Tanaka-Ishii and Bunde, 2016; Lin and Tegmark, 2017; Takahashi and Tanaka-Ishii, 2017; Shen, 2019; Takahashi and Tanaka-Ishii, 2019; Sainburg et al., 2019; Mikhaylovskiy and Churilov, 2023).
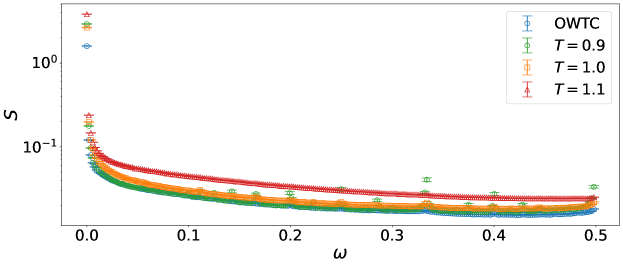
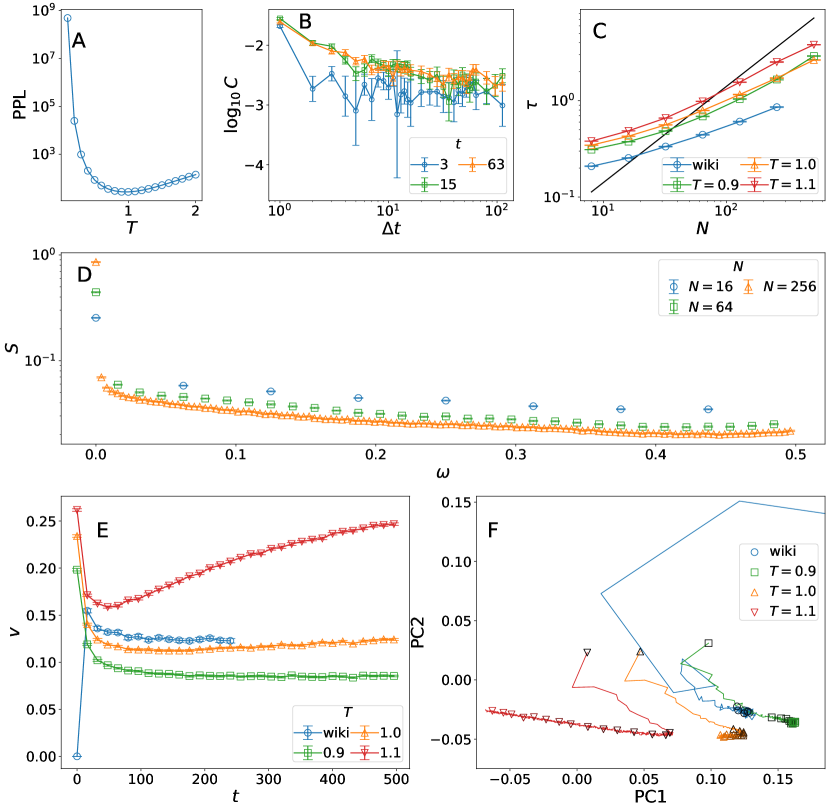
To test this idea, we first calculate the perplexity of GPT-2 at various on OpenWebTextCorpus (OWTC) (Gokaslan and Cohen, 2019), see Fig. 6 (A) 333The perplexity was calculated following the procedure mentioned in the documentation of Transformers (https://huggingface.co/docs/transformers/v4.40.2/en/perplexity).. It becomes minimum at around , supporting the above argument. We further compare the correlation function and the integrated correlation of the OWTC with those of the GPT-2 sequences. They all exhibit qualitatively similar behaviors with the GPT-2 sequences near ; a power-law decay of the correlation and the integrated correlation growing with , see Fig. 6 (B) and (C). The time dependence of for the OWTC is also very similar to that of GPT-2 at , see Fig. 6(D). Strikingly, both the OWTC and GPT-2 at follow almost the same trajectory in this plot over a long time scale, indicating quantitative agreement in their POS distributions. The power spectrum and the dynamics in the two-dimensional PC space also have similar properties (see App. F). Note that the WikiText dataset (Merity et al., 2016) displays statistical properties similar to those of critical GPT-2 as well (see App. G). We thus expect that the criticality observed here is common across different natural language datasets.
5 Discussion and Future Work
In summary, we have studied the effect of the temperature parameter on the GPT-2 sequences and shown that a critical phase transition occurs at . Our results provide a possible picture that, near , comprehensible sentences emerge only during the transient time regime before reaching the stationary state. We have further demonstrated that the criticality in some statistical quantities appears in natural language corpora as well. We now discuss some implications of our numerical results.
Statistical metrics for evaluating LLMs: If natural languages universally have the critical properties observed in our study, the performance of LLMs might be evaluated using statistical quantities such as the correlations. This simple statistical test needs only multiple sample sequences to see their dependence, regardless of tasks, corpus, or models. Note that, in practical tasks, it should be sufficient to find a temperature region in which the behavior of sequences is critical within the required sequence length, rather than the exact critical point, as we have argued in Sec. 3.3. Therefore, extensive sampling should not be needed practically. To establish this method, it is important to study the relation between criticality and performance in different tasks.
Critical phenomena and universality class of LLMs and natural languages: We have discussed the critical behaviors in sequences generated by GPT-2 at around and shown that GPT-2 and the natural language corpora have common critical behaviors. In the literature of statistical physics, critical phase transitions are classified into universality classes, each of which has a distinct set of critical exponents characterizing the criticality. We expect that the critical transition we have discussed also belongs to a certain universality class, which could be a unique one. Precisely estimating the set of critical exponents for the transition for GPT-2, other LLMs, and multiple natural language corpora is certainly an interesting direction for future work. It is noteworthy that japanese-gpt2-medium (Zhao and Sawada, ; Sawada et al., 2024) have statistical properties qualitatively similar to GPT-2 (see App. H).
Unique statistical properties at high and low temperatures: The statistical behavior in the high-temperature phase has a characteristic behavior that is not common in conventional equilibrium disordered phases: Whereas the integrated correlation is convergent, the decay of correlation is not simply exponential. This behavior is attributed to the decreasing prefactor, which needs to decay sufficiently fast to have a finite . Precisely following the dependence of with fixed is needed to address this point.
The low-temperature phase also exhibits an intriguing phenomenon: This phase is definitely ordered in the sense that a long-range time correlation exists. However, unlike conventional ordered phases in equilibrium statistical mechanics, the dynamics of the low-temperature GPT-2 is complex: Sequences have repetitive structures with many peaks in the power spectrum. Up to length , the number of peaks grows with , suggesting that the power spectrum would have continuous support of diverging components. If this observation is confirmed, it implies that the low-temperature sequences are chaotic in nature. The temperature dependence of the complex structure is also enigmatic. We have also noticed that, in the limit, GPT-2 performs top- sampling and is deterministic, and the correlation must be strictly zero. Therefore, another phase transition could exist at very low temperature between the repetitive and deterministic phases. We cannot identify this temperature scale because fluctuations are too small to precisely follow the dependence at this temperature regime. Even more extensive calculations are necessary to study this possible transition. We cannot conclude on the connection between this potential transition and the one argued in Bahamondes (2023).
Approaches to the mechanism of LLMs: As we have already pointed out, the correlation and the power spectrum are peculiar compared to equilibrium statistical-mechanical systems. Whereas we have not fully examined the potential effect of POS tagging at very high temperatures, where generated texts contain many incomprehensible words yet the tagger automatically assigns POS tags, we believe the peculiar phenomena should originate from the distinct features in GPT-2; nonreciprocal and infinite-range interactions implemented with attention mechanisms and highly non-uniform parameters trained on large-scale corpora. Thus, understanding which properties of LLMs cause these phenomena should help reveal the mechanism of LLMs. One possible research direction is an experimental investigation of GPT-2 and other LLMs to identify subnetworks closely related to the phenomena. Another direction is to find a simple mathematical model that reproduces the phenomena observed in this research. In statistical mechanics, mathematical models of machine learning have been studied extensively (Carleo et al., 2019). However, these models do not have critical phase transitions with complex structures at low temperature or apparent power-law decays of correlation at high temperature. This means that existing mathematical models do not capture the properties of LLMs associated with these phenomena.
6 Limitations
-
•
Our work is solely based on numerical analysis, and we have not provided any proof for the existence of the phase transition mathematically.
-
•
We only focus on POS sequences. Therefore, statistical quantities in this research do not capture semantic structures.
Acknowledgments and Disclosure of Funding
We thank Y. Ichikawa, H. Ikeda, J. Takahashi, and T. Takahashi for useful discussions and suggestions. This work was supported by JSPS KAKENHI Grant Nos. 22K13968, 23KJ0622, and 23H01095, JST Grant Number JPMJPF2221, and the World-Leading Innovative Graduate Study Program for Advanced Basic Science Course at the University of Tokyo.
References
- Ackley et al. [1985] David H Ackley, Geoffrey E Hinton, and Terrence J Sejnowski. A learning algorithm for boltzmann machines. Cognitive science, 9(1):147–169, 1985.
- Bahamondes [2023] Sebastián Bahamondes. Study of the possibility of phase transitions in llms, 2023. URL https://community.wolfram.com/groups/-/m/t/2958851.
- Bak et al. [1988] Per Bak, Chao Tang, and Kurt Wiesenfeld. Self-organized criticality. Physical review A, 38(1):364, 1988.
- Brown et al. [2020] Tom Brown, Benjamin Mann, Nick Ryder, Melanie Subbiah, Jared D Kaplan, Prafulla Dhariwal, Arvind Neelakantan, Pranav Shyam, Girish Sastry, Amanda Askell, et al. Language models are few-shot learners. Advances in neural information processing systems, 33:1877–1901, 2020.
- Carleo et al. [2019] Giuseppe Carleo, Ignacio Cirac, Kyle Cranmer, Laurent Daudet, Maria Schuld, Naftali Tishby, Leslie Vogt-Maranto, and Lenka Zdeborová. Machine learning and the physical sciences. Reviews of Modern Physics, 91(4):045002, 2019.
- Chang [2023] Cheng-Shang Chang. A simple explanation for the phase transition in large language models with list decoding. arXiv preprint arXiv:2303.13112, 2023.
- Cui et al. [2024] Hugo Cui, Freya Behrens, Florent Krzakala, and Lenka Zdeborová. A phase transition between positional and semantic learning in a solvable model of dot-product attention. arXiv preprint arXiv:2402.03902, 2024.
- Domb [2000] Cyril Domb. Phase transitions and critical phenomena. Elsevier, 2000.
- Ebeling and Neiman [1995] Werner Ebeling and Alexander Neiman. Long-range correlations between letters and sentences in texts. Physica A, 215(3):233–241, May 1995.
- Ebeling and Pöschel [1994] Werner Ebeling and Thorsten Pöschel. Entropy and Long-Range correlations in literary english. Europhysics Letters, 26(4):241, May 1994.
- Fan et al. [2018] Angela Fan, Mike Lewis, and Yann Dauphin. Hierarchical neural story generation. In Iryna Gurevych and Yusuke Miyao, editors, Proceedings of the 56th Annual Meeting of the Association for Computational Linguistics (Volume 1: Long Papers), pages 889–898, Melbourne, Australia, July 2018. Association for Computational Linguistics. doi: 10.18653/v1/P18-1082. URL https://aclanthology.org/P18-1082.
- Fradkin et al. [2023] Isaac Fradkin, Matthew M Nour, and Raymond J Dolan. Theory-driven analysis of natural language processing measures of thought disorder using generative language modeling. Biological Psychiatry: Cognitive Neuroscience and Neuroimaging, 8(10):1013–1023, 2023.
- Futrell and Levy [2017] Richard Futrell and Roger Levy. Noisy-context surprisal as a human sentence processing cost model. In Proceedings of the 15th Conference of the European Chapter of the Association for Computational Linguistics: Volume 1, Long Papers, Stroudsburg, PA, USA, 2017. Association for Computational Linguistics.
- Futrell et al. [2019] Richard Futrell, Peng Qian, Edward Gibson, Evelina Fedorenko, and Idan Blank. Syntactic dependencies correspond to word pairs with high mutual information. In Proceedings of the Fifth International Conference on Dependency Linguistics (Depling, SyntaxFest 2019), Stroudsburg, PA, USA, 2019. Association for Computational Linguistics.
- Ganguli et al. [2022] Deep Ganguli, Danny Hernandez, Liane Lovitt, Amanda Askell, Yuntao Bai, Anna Chen, Tom Conerly, Nova Dassarma, Dawn Drain, Nelson Elhage, et al. Predictability and surprise in large generative models. In Proceedings of the 2022 ACM Conference on Fairness, Accountability, and Transparency, pages 1747–1764, 2022.
- Gokaslan and Cohen [2019] Aaron Gokaslan and Vanya Cohen. Openwebtext corpus, 2019. URL http://Skylion007.github.io/OpenWebTextCorpus.
- Grandi et al. [2024] Daniele Grandi, Yash Patawari Jain, Allin Groom, Brandon Cramer, and Christopher McComb. Evaluating large language models for material selection. arXiv preprint arXiv:2405.03695, 2024.
- Hall [1988] Peter Hall. On symmetric bootstrap confidence intervals. Journal of the Royal Statistical Society Series B: Statistical Methodology, 50(1):35–45, 1988.
- Holtzman et al. [2020] Ari Holtzman, Jan Buys, Li Du, Maxwell Forbes, and Yejin Choi. The curious case of neural text degeneration. In International Conference on Learning Representations, 2020. URL https://openreview.net/forum?id=rygGQyrFvH.
- Langton [1990] Chris G Langton. Computation at the edge of chaos: Phase transitions and emergent computation. Physica D: nonlinear phenomena, 42(1-3):12–37, 1990.
- Li [1989] Wentian Li. Mutual information functions of natural language texts. Technical report, Santa Fe Institute, 1989.
- Lin and Tegmark [2017] Henry W Lin and Max Tegmark. Critical behavior in physics and probabilistic formal languages. Entropy, 19(7):299, June 2017.
- Lippi et al. [2019] Marco Lippi, Marcelo A Montemurro, Mirko Degli Esposti, and Giampaolo Cristadoro. Natural language statistical features of lstm-generated texts. IEEE Transactions on Neural Networks and Learning Systems, 30(11):3326–3337, 2019.
- Liu et al. [2022a] Ziming Liu, Ouail Kitouni, Niklas S Nolte, Eric Michaud, Max Tegmark, and Mike Williams. Towards understanding grokking: An effective theory of representation learning. Advances in Neural Information Processing Systems, 35:34651–34663, 2022a.
- Liu et al. [2022b] Ziming Liu, Eric J Michaud, and Max Tegmark. Omnigrok: Grokking beyond algorithmic data. In The Eleventh International Conference on Learning Representations, 2022b.
- Merity et al. [2016] Stephen Merity, Caiming Xiong, James Bradbury, and Richard Socher. Pointer sentinel mixture models. arXiv preprint arXiv:1609.07843, 2016.
- Mikhaylovskiy and Churilov [2023] Nikolay Mikhaylovskiy and Ilya Churilov. Autocorrelations decay in texts and applicability limits of language models. arXiv preprint arXiv:2305.06615, 2023.
- Montani et al. [2023] Ines Montani, Matthew Honnibal, Matthew Honnibal, Adriane Boyd, Sofie Van Landeghem, and Henning Peters. explosion/spaCy: v3.7.2: Fixes for APIs and requirements, October 2023. URL https://doi.org/10.5281/zenodo.10009823.
- Munoz [2018] Miguel A Munoz. Colloquium: Criticality and dynamical scaling in living systems. Reviews of Modern Physics, 90(3):031001, 2018.
- Nanda et al. [2023] Neel Nanda, Lawrence Chan, Tom Lieberum, Jess Smith, and Jacob Steinhardt. Progress measures for grokking via mechanistic interpretability. In The Eleventh International Conference on Learning Representations, 2023. URL https://openreview.net/forum?id=9XFSbDPmdW.
- Power et al. [2022] Alethea Power, Yuri Burda, Harri Edwards, Igor Babuschkin, and Vedant Misra. Grokking: Generalization beyond overfitting on small algorithmic datasets. arXiv preprint arXiv:2201.02177, 2022.
- Pursnani et al. [2023] Vinay Pursnani, Yusuf Sermet, Musa Kurt, and Ibrahim Demir. Performance of chatgpt on the us fundamentals of engineering exam: Comprehensive assessment of proficiency and potential implications for professional environmental engineering practice. Computers and Education: Artificial Intelligence, 5:100183, 2023.
- [33] Alec Radford, Jeff Wu, and Jong Wook Kim. openai/gpt-2-output-dataset. URL https://github.com/openai/gpt-2-output-dataset?tab=readme-ov-file.
- Radford et al. [2019] Alec Radford, Jeffrey Wu, Rewon Child, David Luan, Dario Amodei, Ilya Sutskever, et al. Language models are unsupervised multitask learners. OpenAI blog, 1(8):9, 2019.
- Renze and Guven [2024] Matthew Renze and Erhan Guven. The effect of sampling temperature on problem solving in large language models. arXiv preprint arXiv:2402.05201, 2024.
- Rubin et al. [2024] Noa Rubin, Inbar Seroussi, and Zohar Ringel. Grokking as a first order phase transition in two layer networks. In The Twelfth International Conference on Learning Representations, 2024. URL https://openreview.net/forum?id=3ROGsTX3IR.
- Sainburg et al. [2019] Tim Sainburg, Brad Theilman, Marvin Thielk, and Timothy Q Gentner. Parallels in the sequential organization of birdsong and human speech. Nature Communications, 10(1):3636, August 2019.
- Sawada et al. [2024] Kei Sawada, Tianyu Zhao, Makoto Shing, Kentaro Mitsui, Akio Kaga, Yukiya Hono, Toshiaki Wakatsuki, and Koh Mitsuda. Release of pre-trained models for the Japanese language. In Proceedings of the 2024 Joint International Conference on Computational Linguistics, Language Resources and Evaluation (LREC-COLING 2024), 5 2024. URL https://arxiv.org/abs/2404.01657.
- Schaeffer et al. [2024] Rylan Schaeffer, Brando Miranda, and Sanmi Koyejo. Are emergent abilities of large language models a mirage? Advances in Neural Information Processing Systems, 36, 2024.
- Shen [2019] Huitao Shen. Mutual information scaling and expressive power of sequence models. arXiv preprint arXiv:1905.04271, 2019.
- Srivastava et al. [2022] Aarohi Srivastava, Abhinav Rastogi, Abhishek Rao, Abu Awal Md Shoeb, Abubakar Abid, Adam Fisch, Adam R Brown, Adam Santoro, Aditya Gupta, Adrià Garriga-Alonso, et al. Beyond the imitation game: Quantifying and extrapolating the capabilities of language models. arXiv preprint arXiv:2206.04615, 2022.
- Takahashi and Tanaka-Ishii [2017] Shuntaro Takahashi and Kumiko Tanaka-Ishii. Do neural nets learn statistical laws behind natural language? PloS one, 12(12):e0189326, 2017.
- Takahashi and Tanaka-Ishii [2019] Shuntaro Takahashi and Kumiko Tanaka-Ishii. Evaluating computational language models with scaling properties of natural language. Computational Linguistics, 45(3):481–513, 2019.
- Tanaka-Ishii and Bunde [2016] Kumiko Tanaka-Ishii and Armin Bunde. Long-range memory in literary texts: On the universal clustering of the rare words. PLoS One, 11(11):e0164658, November 2016.
- Thilak et al. [2022] Vimal Thilak, Etai Littwin, Shuangfei Zhai, Omid Saremi, Roni Paiss, and Joshua Susskind. The slingshot mechanism: An empirical study of adaptive optimizers and the grokking phenomenon. arXiv preprint arXiv:2206.04817, 2022.
- Varma et al. [2023] Vikrant Varma, Rohin Shah, Zachary Kenton, János Kramár, and Ramana Kumar. Explaining grokking through circuit efficiency. arXiv preprint arXiv:2309.02390, 2023.
- Wei et al. [2022] Jason Wei, Yi Tay, Rishi Bommasani, Colin Raffel, Barret Zoph, Sebastian Borgeaud, Dani Yogatama, Maarten Bosma, Denny Zhou, Donald Metzler, et al. Emergent abilities of large language models. arXiv preprint arXiv:2206.07682, 2022.
- Wolf et al. [2020] Thomas Wolf, Lysandre Debut, Victor Sanh, Julien Chaumond, Clement Delangue, Anthony Moi, Pierric Cistac, Tim Rault, Remi Louf, Morgan Funtowicz, Joe Davison, Sam Shleifer, Patrick von Platen, Clara Ma, Yacine Jernite, Julien Plu, Canwen Xu, Teven Le Scao, Sylvain Gugger, Mariama Drame, Quentin Lhoest, and Alexander Rush. Transformers: State-of-the-art natural language processing. In Qun Liu and David Schlangen, editors, Proceedings of the 2020 Conference on Empirical Methods in Natural Language Processing: System Demonstrations, pages 38–45, Online, October 2020. Association for Computational Linguistics. doi: 10.18653/v1/2020.emnlp-demos.6. URL https://aclanthology.org/2020.emnlp-demos.6.
- Wolfram Research [2019] Wolfram Research. Gpt2 transformer trained on webtext data, 2019. URL https://resources.wolframcloud.com/NeuralNetRepository/resources/GPT2-Transformer-Trained-on-WebText-Data/.
- Wu [1982] Fa-Yueh Wu. The potts model. Reviews of modern physics, 54(1):235, 1982.
- Xu et al. [2022] Frank F Xu, Uri Alon, Graham Neubig, and Vincent Josua Hellendoorn. A systematic evaluation of large language models of code. In Proceedings of the 6th ACM SIGPLAN International Symposium on Machine Programming, pages 1–10, 2022.
- [52] Tianyu Zhao and Kei Sawada. rinna/japanese-gpt2-medium. URL https://huggingface.co/rinna/japanese-gpt2-medium.
- Zhu et al. [2024a] Xuekai Zhu, Yao Fu, Bowen Zhou, and Zhouhan Lin. Critical data size of language models from a grokking perspective. arXiv preprint arXiv:2401.10463, 2024a.
- Zhu et al. [2024b] Yuqi Zhu, Jia Li, Ge Li, YunFei Zhao, Zhi Jin, and Hong Mei. Hot or cold? adaptive temperature sampling for code generation with large language models. In Proceedings of the AAAI Conference on Artificial Intelligence, volume 38, pages 437–445, 2024b.
- Žunkovič and Ilievski [2022] Bojan Žunkovič and Enej Ilievski. Grokking phase transitions in learning local rules with gradient descent. arXiv preprint arXiv:2210.15435, 2022.
Appendix A Effect of Short Sequences
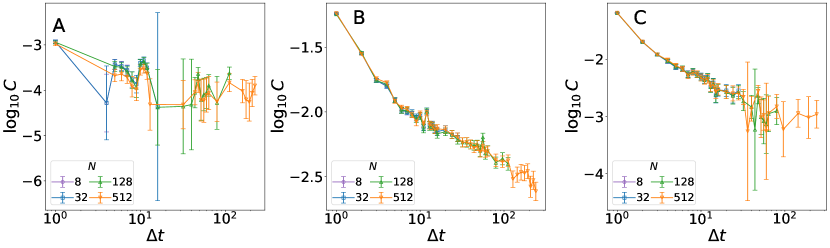
In our analysis, short sequences are used only when they are longer than . This does not affect our conclusion, as we mentioned in Sec. 2. Figure 7 shows the correlation between the -th tag and the -th tag for different . The dependence of correlation on is very small. We also calculate the integrated correlation in a slightly different setting, where only sequences longer than are used irrespective of . The results, shown in Fig. 8, are similar to those in our original setting. Therefore, we can conclude that the effect of short sequences is not significant.
Appendix B Integrated Correlations with the Largest Contributions
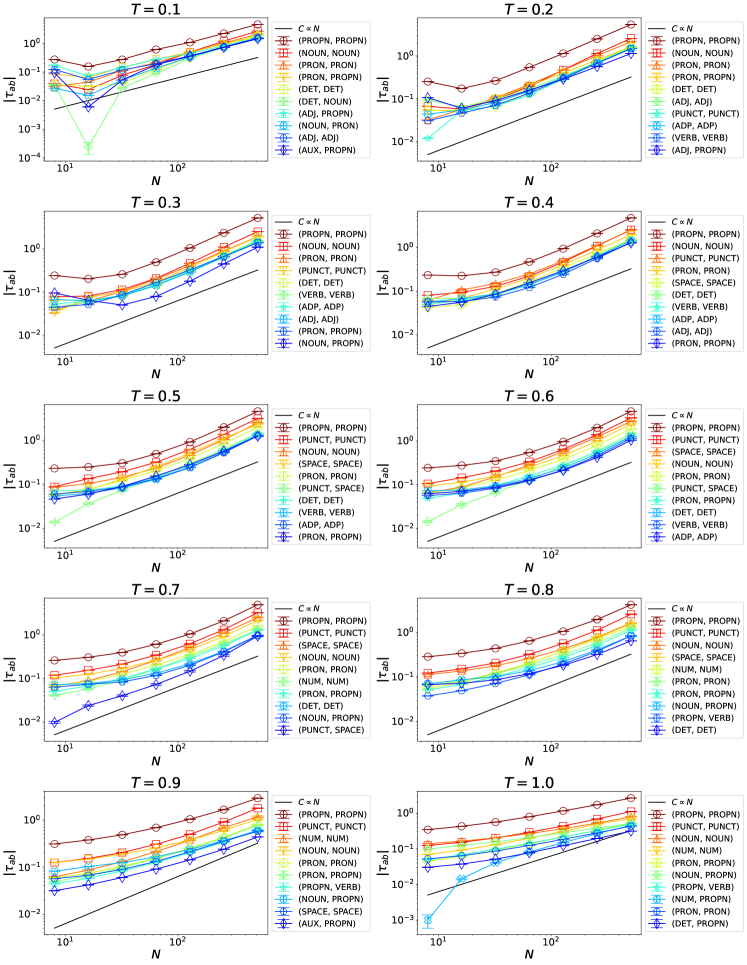
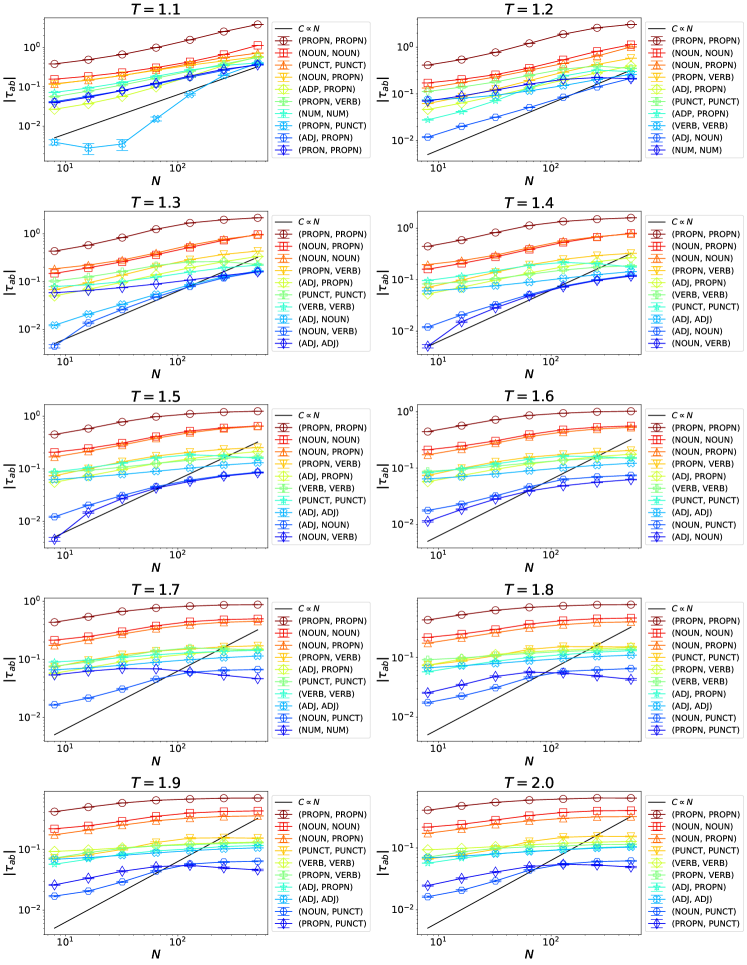
In Sec. 3.1, we noted that correlation has the largest contribution to the critical phenomena among correlations . To demonstrate it, we show the largest absolute values of integrated correlation for each as a function of in Fig. 9 and 10. Clearly, the contribution of is the largest for all temperatures.
To capture the behavior of all integrated correlations roughly, we introduce the square root of sum of squared integrated correlations, . Note that the simple sum is trivially zero, i.e., . As shown in Fig. 11, the temperature dependence of is similar to that of .
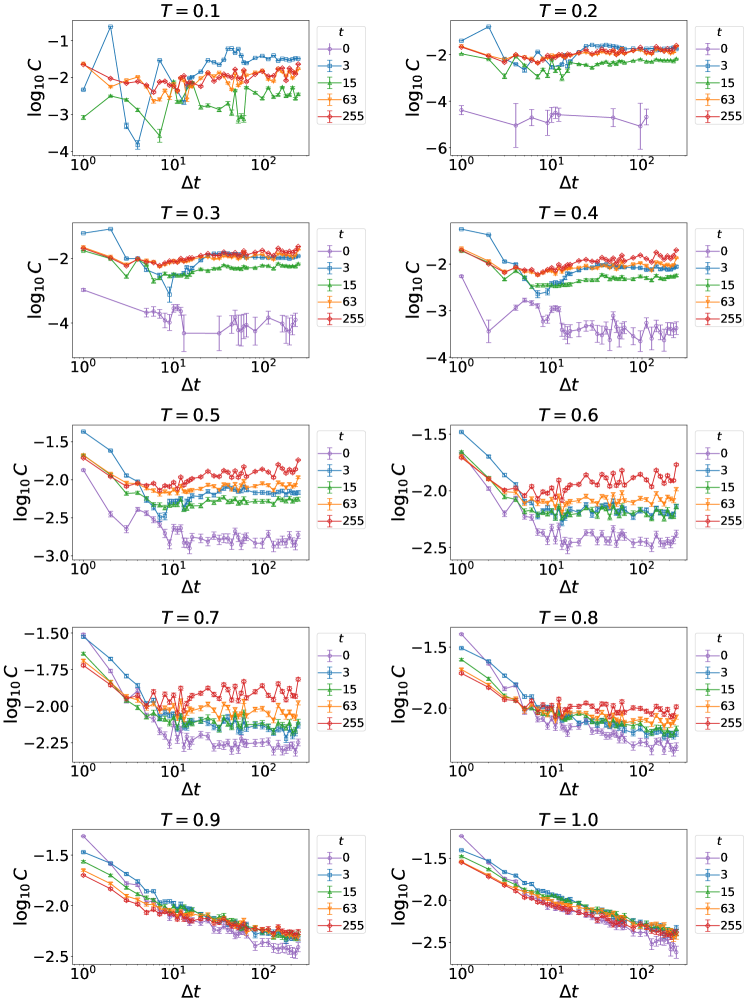
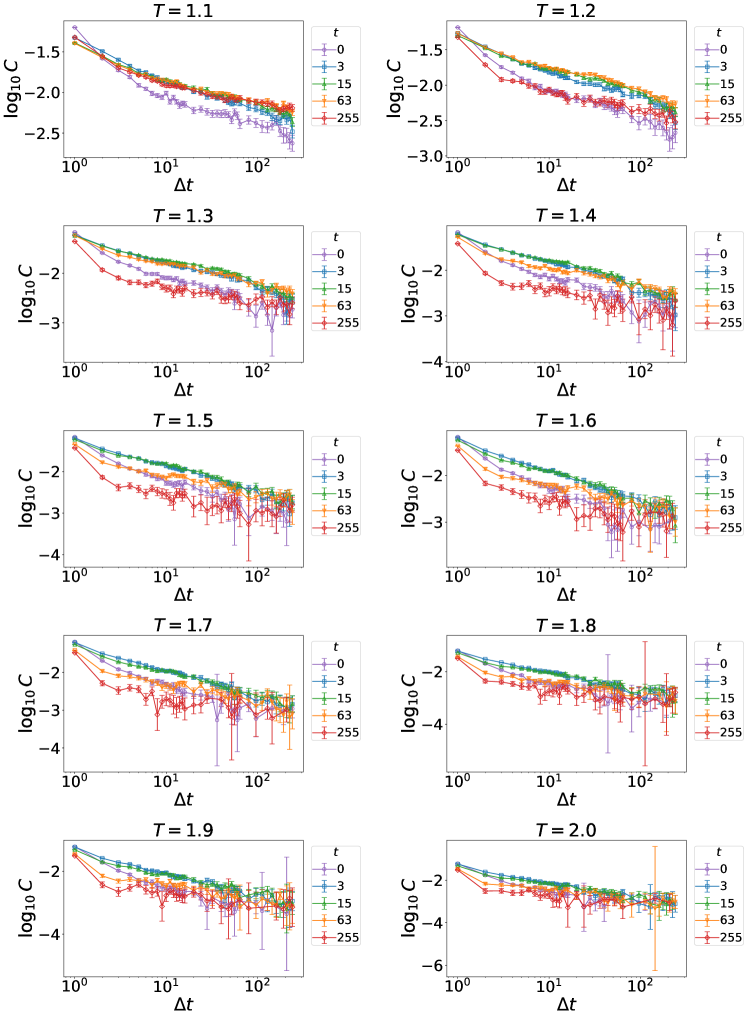
Appendix C Correlations
In Sec. 3.1, we have discussed the correlation. However, only results at , , and were presented in that section. In this appendix, we show the correlations at , see Figs. 12 and 13. The data supports the discussion we made in the main text. The correlation converges to a positive value and to zero at low and high temperatures, respectively. At between them, it follows a critical decay, which is a power-law decay with a constant prefactor.
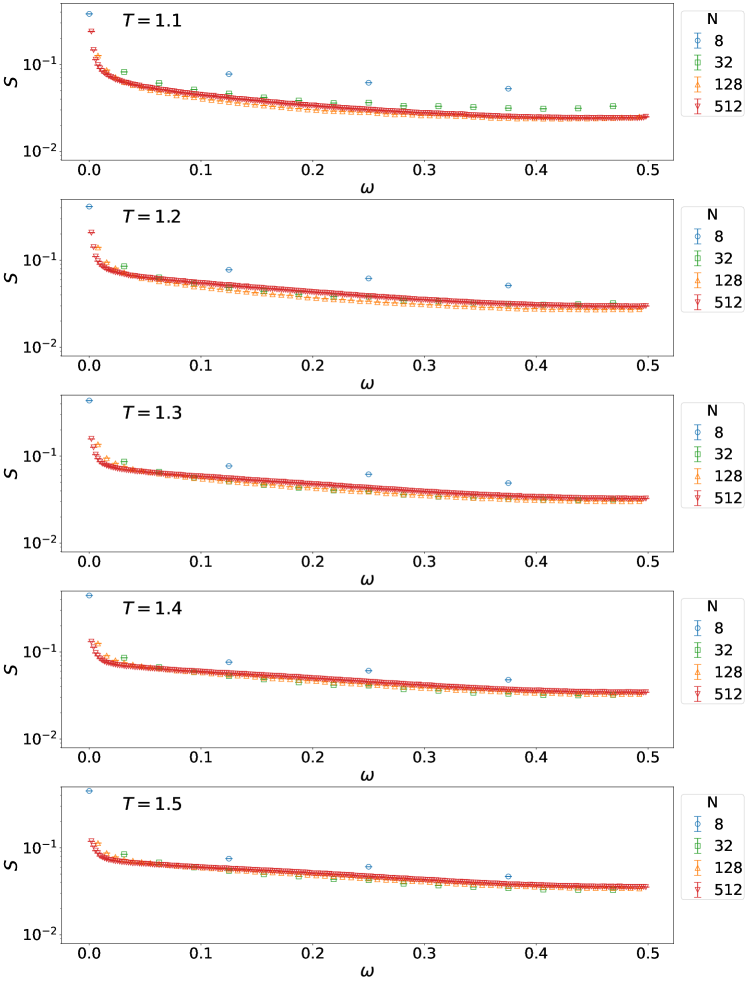
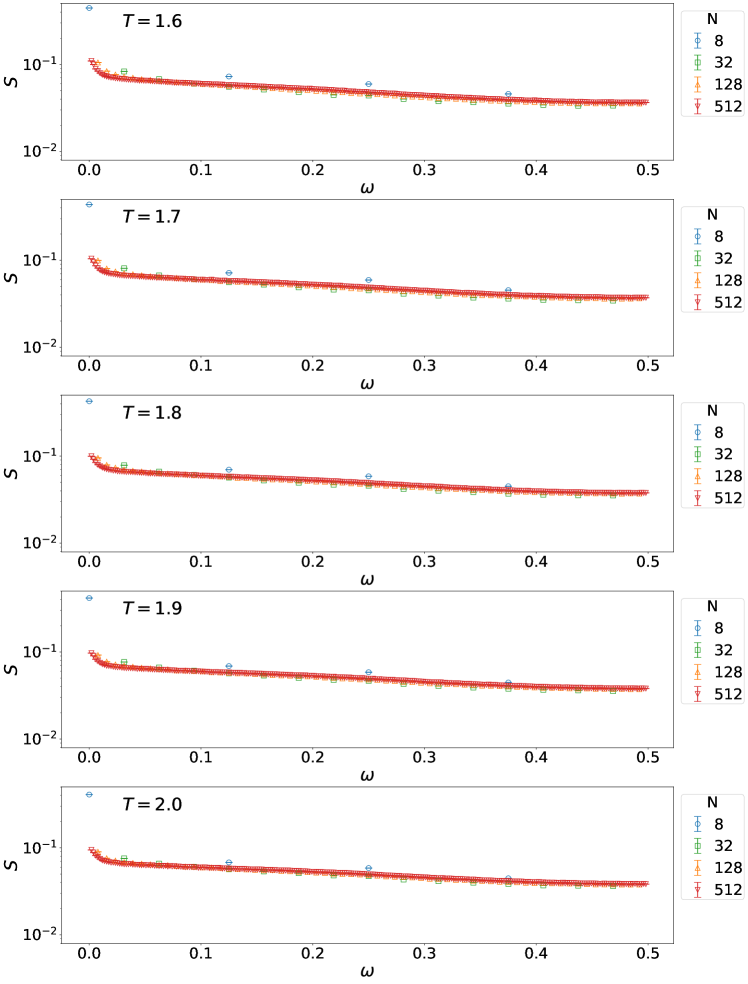
Appendix D Power Spectra
In Sec. 3.2, we have discussed the power spectra at , , and , and have demonstrated that many peaks growing with in the power spectra emerge only below the critical point . Here, we show the power spectra at in Figures. 14, 15, 16, and 17. These results support our discussions that the structures of sequences are qualitatively different between the high and low-temperature regimes: At any temperature above , the power spectrum has multiple peaks, whereas it has only one peak at at higher temperatures.
Appendix E Principal Component Analysis
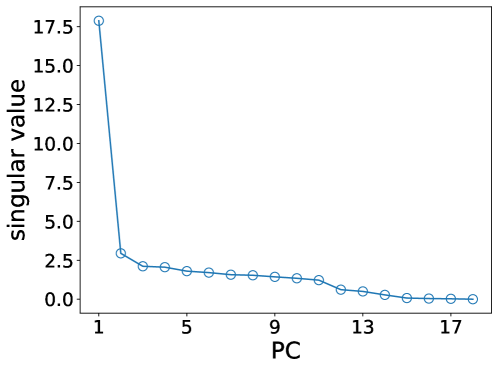
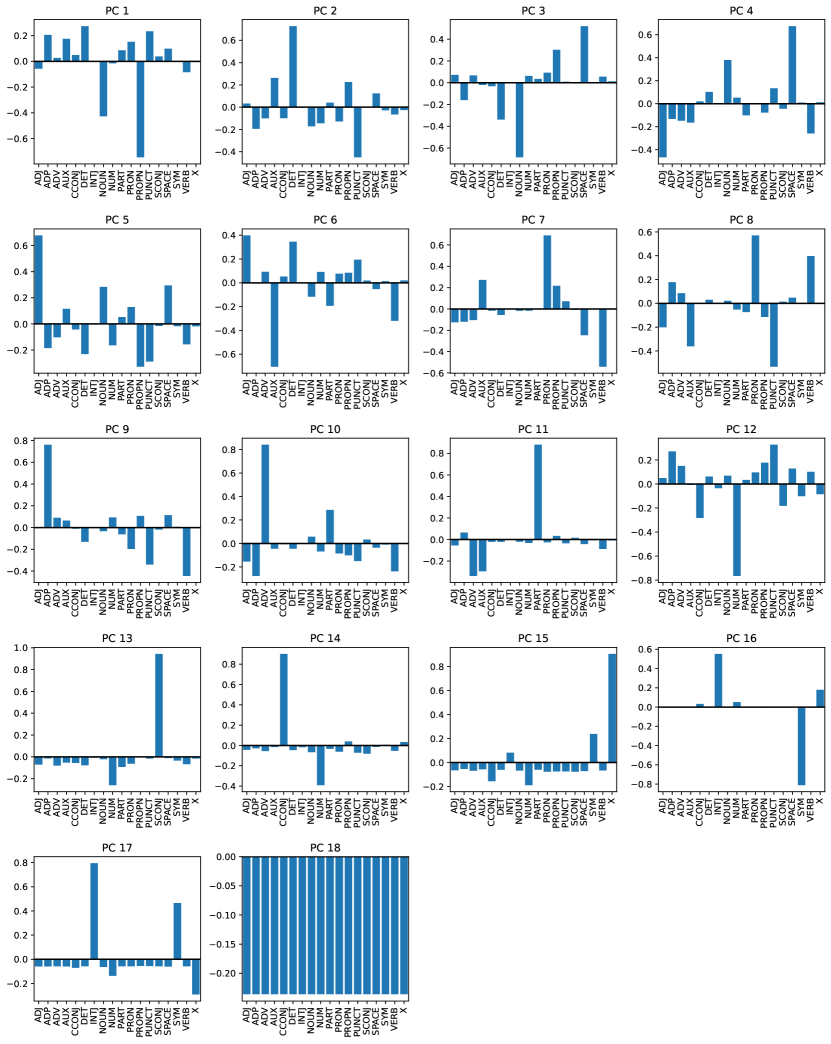
In Sec. 3.3, we have discussed the time evolution of the distribution of POS tags, only focusing on . To intuitively understand the -dimensional dynamics, we perform PCA. Specifically, we concatenate at 20 temperature points into data matrix and apply PCA to it. The singular values and elements of each principal component are shown in Figs. 18 and 19, respectively. The former suggests that the contributions of PC1 and PC2 are sufficiently large. In the latter, the elements corresponding to PROPN has the largest absolute value in PC1. This justifies that we mainly focus on the dynamics of .
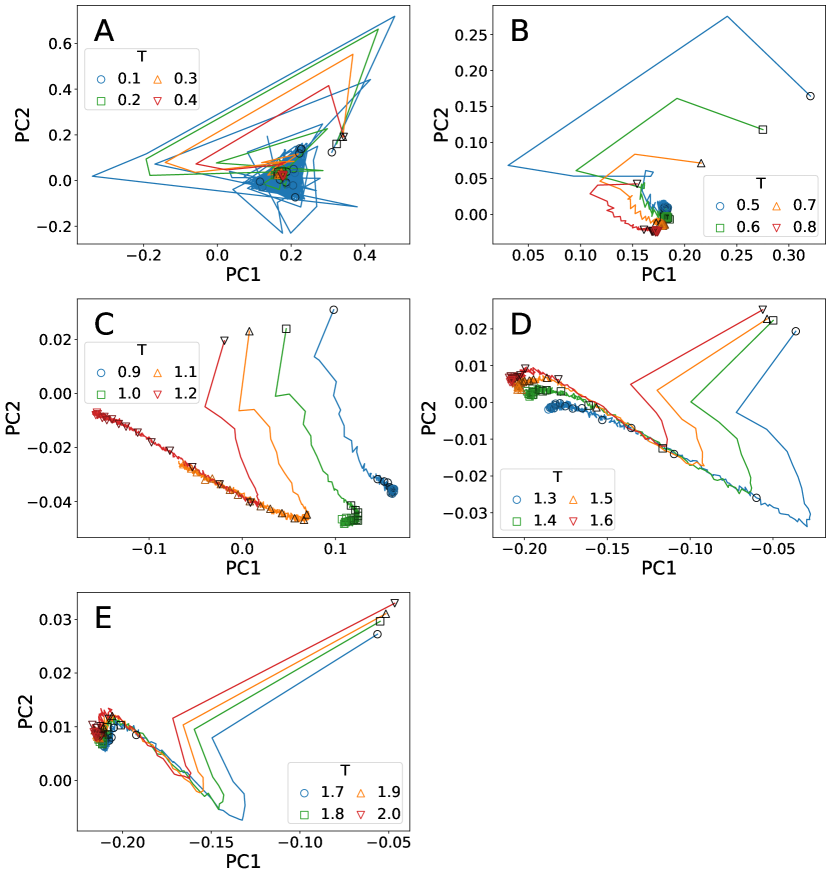
Figure 20 shows the dynamics in at projected onto the two-dimensional PC space. These imply that the stationary states that reaches at can be classified into two types. The dynamics above the critical point converges to one, while that below the point converges to the other. Around the critical point, the transient time is longer than that at higher or lower temperature. These observations are consistent with the discussion in Sec. 3.3. The dynamics also implies that the slowing down occurs when the two stable states potentially coexist.
Appendix F Power Spectra and Two-dimensional Dynamics in OpenWebTextCorpus
As we have discussed in Sec. 4, sequences from OWTC share similar properties with critical GPT-2 in correlation, integrated correlation, and the dynamics in . Here, we show the power spectrum and the dynamics in the two-dimensional PC space in OWTC, which are also similar to those in critical GPT-2.
Figure 21 shows the power spectrum in OWTC for . Those for GPT-2 at , , and are plotted at the same time. Again, the behavior of OWTC is close to that of GPT-2 at . However, several peaks exist in the power spectrum in the latter, suggesting the existence of repetitions that is absent in OWTC.
Figure 22 shows that the dynamics in in OWTC and sequences generated by GPT-2 at , , and , projected onto the same two-dimensional PC space as calculated in App. E. We can observe that the dynamics in OWTC follows the trajectory close to that of GPT-2 at for large , similarly to the dynamics in .
Appendix G Critical Properties of WikiText
In Sec. 4 and App. F, we have examined the statistical properties of OWTC, such as the perplexity of GPT-2, correlations, power spectra, and dynamics, showing that the corpus is statistically close to critical GPT-2. We perform the same set of analyses on another corpus, wikitext-103-raw-v1 [Merity et al., 2016]. The perplexity in Fig. 23 (A) shows that GPT-2 fits the corpus best at , similarly to the result for OWTC. In the results of statistical quantities presented in Figs. 23 (B–F), we can see all the critical properties observed in OWTC, such as power-law decay of correlation, divergent integrated correlation, and slow dynamics. This implies that these critical properties can be observed across different natural language datasets.
Appendix H Analysis of japanese-gpt2-medium
In the main text, we have investigated statistical properties of POS sequences generated by GPT-2 with varying temperature and have found the phase transition between repetitive sequences and incomprehensible ones. An interesting question is how universal this phase transition is. Here, we analyze japanese-gpt2-medium [Zhao and Sawada, , Sawada et al., 2024] using ja_core_news_sm pipeline from spaCy library [Montani et al., 2023]. For each and , sequences were sampled.
As shown in Fig. 24, the integrated correlation diverges at low temperatures, while it seems to converge to a finite value at high temperatures. This result implies the phase transition point, such that the decay of correlation is slow below it and rapid above it. The power spectrum is also shown in Figs. 25–28. From these, we can observe that repetitive structures with many distinct Fourier modes emerge only at low temperatures. These results suggest that this LLM exhibits a phase transition similar to that in GPT-2.