# \setstackgapL12pt
Polytomous Explanatory Item Response Models for Item Discrimination: Assessing Negative-Framing Effects in Social-Emotional Learning Surveys
Modeling item parameters as a function of item characteristics has a long history but has generally focused on models for item location. Explanatory item response models for item discrimination are available but rarely used. In this study, we extend existing approaches for modeling item discrimination from dichotomous to polytomous item responses. We illustrate our proposed approach with an application to four social-emotional learning surveys of preschool children to investigate how item discrimination depends on whether an item is positively or negatively framed. Negative framing predicts significantly lower item discrimination on two of the four surveys, and a plausibly causal estimate from a regression discontinuity analysis shows that negative framing reduces discrimination by about 30% on one survey. We conclude with a discussion of potential applications of explanatory models for item discrimination.
Keywords: item response theory, explanatory item response model, item discrimination, psychometrics, graded response model, item wording effects
Corresponding author: joshua_gilbert@g.harvard.edu
1 Introduction
Why are some items easier, harder, or more discriminating than others? This question has posed a longstanding challenge in psychometrics and Item Response Theory (IRT). From the linear logistic test model [150] to explanatory item response models [223, 141, 140], causal Rasch models [209], and contemporary machine learning approaches [210, 115, 193], various methods attempt to model item parameters as functions of item features. The appeal of such models lies in the potential that test makers can design more reliable and informative measures if they can understand why items function the way they do.
Extensive literature on modeling item parameters has focused on explaining differences in item location (i.e., difficulty, easiness, agreeability) as a function of item characteristics, but the attempt to explain differences in item discrimination is comparatively rare [134, 194, 148]. Understanding why some items are more discriminating than others could lead to more informative and efficient test design because more discriminating items provide more information about respondents whose latent trait values are near the item location parameters [217, 116]. Furthermore, systematic differences in item discrimination could also shed light on fundamental measurement issues such as scaling, differential item functioning, and the cognitive processes that underlie item responses [213, 168, 184, 172].
Early model developments for relating item discrimination to item characteristics mirror the linear logistic test model (LLTM) in that they assume that variation in item discrimination can be perfectly explained by item characteristics [148]. To relax this assumption, subsequent approaches include error terms that capture the variability in item discrimination that is not explained by the item characteristics and thus provide a more realistic modeling framework [134, 180]. However, despite their potential utility, empirical applications of these models appear to be quite rare due to the specialized software required for model estimation, with very few extant examples in the published literature (e.g. [226, 194, 186]).111Similarly, previous applications of random effects loading models in the factor analysis and SEM traditions have emphasized the use of random factor loadings to handle large numbers of items or multilevel structures, rather than explanatory models for the loadings themselves [188, 119].
In this study, we pursue two goals. First, we review the conventional explanatory item response model (EIRM) for item location and show how the model can be extended to allow for varying item discriminations and estimated with open-source software. Second, we extend previous work on explanatory models for item discrimination to accommodate polytomous item responses and a multiplicative structure for the item discriminations (e.g. [123]). We therefore build on existing models for dichotomous responses that assume an additive discrimination structure [134, 180]. Thus, we synthesize the approach of [134] with subsequent contributions to random effects explanatory IRT modeling for polytomous data [167, 176] to make explanatory models for item discrimination both more accessible and applicable to researchers in a variety of empirical settings such as education, psychology, and behavioral research.
We motivate and illustrate our proposed approach with an empirical application to four psychological survey scales measuring various dimensions of social-emotional learning (SEL) in preschool children. Our primary research question is to determine whether negatively-framed items (i.e., items that need to be reverse-coded because a higher score represents a lower level of the latent trait) are systematically less discriminating than positively-framed items. Understanding systematic differences in discrimination between positively- and negatively-framed items could provide useful information for the development of measures and has been the subject of considerable discussion in the measurement literature (e.g. [220, 218, 211, 221, 206, 160, 121, 174]). For example, if negatively-framed items provide consistently lower discrimination than positively-framed items due to, say, increased cognitive load, an argument could be made for using them more sparingly to maximize the efficiency of measurement. Our approach therefore complements other research that examines item wording and framing effects from the perspective of multidimensionality and bi-factor models in the structural equation modeling and factor analysis tradition [162, 212, 166]. Our results show that in two of the four surveys, the negatively-framed items were substantially less discriminating than the positively-framed items. Furthermore, a plausibly causal estimate from a regression discontinuity analysis in one survey suggests that negative framing reduces item discrimination by about 30%.
1.1 The Explanatory Item Response Model (EIRM)
Originally formalized by [141], the EIRM builds on previous work that synthesizes IRT and multilevel models into a unified framework [199, 114]. Consider the following model for dichotomous item responses with random effects for both persons and items [138, 165]:
| (1) | ||||
| (2) | ||||
| (3) | ||||
| (4) |
where is the observed item response to item by person , is latent person ability, and is item location, commonly denoted item easiness on a cognitive measure or agreeability on an affective survey. Item location is in turn a function of the mean and item-specific deviation . Without predictors in the model, Equation 1 is equivalent to a one-parameter logistic (1PL) or Rasch IRT model, but with random effects for the items instead of the more typical item fixed effects. Equation 1 is a “doubly descriptive” model in the typology of [223], because it estimates variances for persons and items with no predictors to explain mean differences in or as a function of person or item characteristics. The model becomes item explanatory, person explanatory, or doubly explanatory, when item, person, or both types of predictors are added to the model, respectively.
We can extend Equation 2 to include some covariate in the equation for to determine the relationship between and item location:
| (5) |
In our empirical application, indicates whether an item is negatively or positively framed in a psychological survey; estimates would determine whether there are systematic differences in item location based on item framing. The item location residuals allow for imperfect prediction, in contrast to more restrictive models such as the LLTM that assume that the item characteristics can perfectly explain the item location parameters. At the person level, we could similarly include some covariate in the equation for to estimate mean differences in latent ability as a function of . Interactions between person and item predictors can capture uniform differential item functioning (DIF; [139, 196]).
Given its flexibility, the EIRM has seen many applications in the psychometric, psychological, educational, and behavioral literature, including extensions such as longitudinal models, multidimensionality, descriptive comparisons of group performance, DIF analysis, causal inference, and treatment heterogeneity (e.g. [126, 156, 158, 153, 157, 142, 133, 177, 152, 159, 155]). Recent work has extended the EIRM to polytomous response models, such as the rating scale model and the partial credit model, with fixed items [128, 208] or random items [176, 154, 167], further extending its applicability to diverse research and assessment contexts.
One limitation of the traditional EIRM approach is that most applications have used 1PL or Rasch models that assume that the discriminating power of each item is equal with respect to . In part, this limitation is due to software constraints. Several widely cited papers demonstrate how to use the free and open-source multilevel modeling software lme4 to fit the EIRM in R [146, 139], but lme4 cannot accommodate varying discrimination parameters by item unless they are known in advance [201]. Although proprietary or specialized software such as Mplus [189], and Stata’s gllamm [195] can accommodate the 2PL EIRM with item random effects, empirical applications have been rare [194].
Recently, three open-source software programs in R use novel estimation methods that allow the estimation of item discrimination parameters in the EIRM, namely, PLmixed [201], galamm [207], and brms [130]. While PLmixed and galamm represent an advance in the flexibility of models that can be fit, they do not allow for random item discriminations or polytomous responses, thus limiting their utility when the goal is to explain differences in item discrimination as a function of covariates. In contrast, brms provides the most flexible approach that allows for a wide range of IRT models with fixed or random locations, discriminations, and link functions, providing the most attractive option for explanatory modeling of item discriminations under investigation in this study.222mirt [131] is dedicated to IRT modeling and allows for a wide variety of models to be fit, but does not support random effects for item discrimination parameters. Similarly, the SEM software lavaan [202] does not support random locations, random factor loadings, or the logistic link functions that are most common in IRT applications. flirt [171] supports 2PL EIRMs but does not provide standard errors for differences in item discrimination parameters [186]. PLmixed and galamm do not directly support polytomous responses, but ordinal data can be reformatted in such a way so that polytomous IRT models such as the rating scale model and the partial credit model can be estimated using the computational machinery of binary logistic regression [128, 154].
Given these advances, consider the addition of a discrimination parameter to the 2PL EIRM:
| (6) | ||||
| (7) | ||||
| (8) | ||||
| (9) | ||||
| (10) |
In contrast to the 1PL or Rasch model in Equation 1, which uses the unit loading identification, here, is constrained to 1 for model identification [130]. The item discrimination parameter represents the degree to which item discriminates between respondents along the latent trait . That is, a 1 standard deviation increase in causes an increase in the log-odds of a correct response for item . and may be correlated, represented by the covariance parameter .
An affordance of Equation 8 is that the are given a model in which is the discrimination of the average item and is the deviation of item from the average with SD . While previous models are linear in the term [134, 180], we follow [123] and use a multiplicative or logarithmic link function for . By modeling on the log scale, the are constrained to be positive, which provides benefits for the stability of model identification [130, p. 26], and the residuals are assumed to follow a log-normal distribution, a common assumption in 2PL IRT modeling [134, p. 88]. To our knowledge, applications of the model represented in Equation 6 and related approaches have thus far only considered dichotomous responses (e.g. [194, 226, 134]), thus limiting applicability in diverse assessment contexts where polytomous response data is common, such as educational, psychological, or behavioral research. We describe how to extend the model to polytomous responses in the context of our empirical application in Section 2.
While traditionally modeled as fixed effects in IRT, a key benefit of the random effects approach to the is that we can include covariates in a latent regression to explain differences in item discrimination as a function of item or person characteristics. For example, the motivating application of this study includes an indicator variable for whether an item is negatively framed to determine if there are systematic differences in item discrimination by item framing. Applying the EIRM to address differences in item discrimination can also answer many other substantively important questions in educational, psychological, or behavioral measurement, to which we return in the discussion.
2 Methods
To illustrate our proposed approach, we use publicly available item-level data from a study of social-emotional learning (SEL) among preschool children in the United States [120]. The data set includes four common SEL measures for young children rated by adults at two time points, measuring emotional regulation [205], learning behaviors [185], social competence [182], and social skills [161]. The measures are summarized in Table 1 and include example items from each measure. All items are rated on a Likert scale and have identical response options within each survey, although each survey has a different number of response options. For the purposes of this study, we focus on the baseline assessments. (We include a parallel analysis of the followup assessment as a cross-validation of our empirical results in Appendix C.) The student sample contains 1000 children, who range in age from 3 to 5 years and are 49% female.
Our empirical question is whether there are systematic differences in item discrimination between positively- and negatively-framed items. To illustrate, consider example items from the first measure, the Emotion Regulation Checklist (ERC). Here, a positively-framed item is “is able to delay gratification,” in that a higher score indicates greater emotional regulation. A negatively-framed item is “exhibits wide mood swings,” because a higher score indicates lower emotional regulation. After reviewing the codebook to identify negatively-framed items, we reverse-coded all item scores for the negatively-framed items so that a higher score indicates a greater degree of the latent trait.333A list of the negatively-framed items for each survey is available in the data cleaning code in our supplement.
| Measure | Rating Scale | Positive Items | Negative Items | ||
|---|---|---|---|---|---|
| Example | N | Example | N | ||
| Emotion Regulation Checklist (ERC) | Never, Sometimes, Often, Almost Always (1-4) | Is able to delay gratification | 9 | Exhibits wide mood swings | 14 |
| Preschool Learning Behaviors Scale (PLBS) | Does not apply, sometimes applies, most often applies (0-2) | Pays attention to what you say | 8 | Is reluctant to tackle a new activity | 21 |
| Social Competence and Behavior Evaluation (SCBE) | Never, sometimes, often, always (1-6) | Works easily in groups | 10 | Irritable, gets mad easily | 20 |
| Social Skills Improvement System (SSIS) | Never, seldom, often, almost always (0-3) | Says “please” | 46 | Bullies others | 30 |
Notes: The ERC typically contains 24 items, however, the replication materials from [120] indicate that question 7 was skipped in error. The SCBE contains six response categories but only four descriptive labels; i.e., “sometimes” could be rated as a 2 or 3. The data also included the Child Behavior Rating Scale, however, this 10-item measure contained no negatively-framed items so we exclude it from our analysis.
To motivate formal models for the item discrimination parameters, we begin with a descriptive analysis and fit separate frequentist graded response models (GRMs) with mirt [131] to each measure and collect the estimates, with the added constraint that the distances between the category thresholds are equal across items (i.e., the rating scale framework; [187]), to match the explanatory models that we fit using brms. brms does not yet support order-preserving random effects models that allow for unique distances between thresholds by item [130, p. 36], though the fact that all items share identical response options on each survey means that this constraint is less relevant compared to other cases with different rating scales by item. Furthermore, this constraint helps stabilize the estimates of category thresholds for item-category combinations with limited data.
To formally test differences in item discrimination by item framing we extend the dichotomous response model of Equation 6 to estimate the following explanatory GRM, where indicates that item was negatively-framed and therefore reverse-coded:
| (11) | ||||
| (12) | ||||
| (13) | ||||
| (14) | ||||
| (15) |
Here, we model the log-odds that person responds to item with a rating of less than or equal to , where , is the total number of categories, , and . are fixed intercepts for scoring at or below category for the average positively-framed item, is the latent trait, and is an item-specific residual shift representing item agreeability () plus the average difference in agreeability between positively- and negatively-framed items (). Thus, the distance between the intercepts is constant across items, but each item may be more or less agreeable than the average item. and are subtracted from so that higher values predict higher response categories, following the standard parameterization of ordered logistic regression in most software [122, 135, 200, 222]. The parameter of interest is , which captures differences in item discrimination between the item types on the log scale. A negative value of would suggest that the negatively-framed items are less discriminating, on average, than positively-framed items. We fit the model separately to each of the four survey measures and apply weakly informative priors for the random effects, following the tutorial provided by [130]. Appendix A shows example brms code to fit Equation 11 and associated models. Appendix B shows a directed acyclic graph (DAG) for Equation 11.
In addition to the descriptive analyses offered by Equation 11, the design of the Social Skills Improvement System (SSIS) measure allows for an additional causal analysis. Unlike the other measures, the SSIS includes all of the positively-framed items first and then switches to the negatively-framed items at item 47 out of 76. This design lends itself to a regression discontinuity (RD) analysis to estimate the causal effect of changing to negatively-framed items partway through the survey, a potentially more informative quantity than our other models that simply provide average differences in discrimination by item framing. We fit this model by extending Equation 13 as follows in a linear RD framework:
| (16) |
where is the position of item in the SSIS, centered at the boundary between the positive and negative items.
The identifying assumption supporting a causal interpretation of in Equation 16 is that the potential item discriminations are smooth at the boundary between positively-framed and negatively-framed items. That is, the position of an item in the SSIS can affect its discrimination, for example through fatigue effects [137], but we would expect such effects to be a smooth function of item position. In other words, in the absence of the switch to negative framing, average item discrimination would be a smooth function of its position in the survey. Under this assumption, any discontinuity in discrimination observed at the boundary represented by would provide evidence of a causal effect of the switch to negative framing on item discrimination partway through the SSIS [163, 117, 136].
3 Results
3.1 Descriptive Analyses
The distributions of the estimated parameters from the GRMs calculated in mirt (without covariates) are shown in Figure 1. Several facts merit attention. First, there appears to be a large range of in each survey, suggesting that the application of 1PL models is inappropriate. Second, all surveys except for the ERC show lower median discrimination parameters for negatively-framed items. Although descriptive analysis provides useful motivation, it suffers from important limitations. That is, it treats the as known when they are estimated with error, and, without a formal model, estimating the uncertainty or determining the significance of the apparent difference is challenging. While non-parametric approaches such as the bootstrap provide a reasonable alternative in the present case, bootstrapping methods would not be easily applicable to more complex models that consider combinations of person and item predictors.
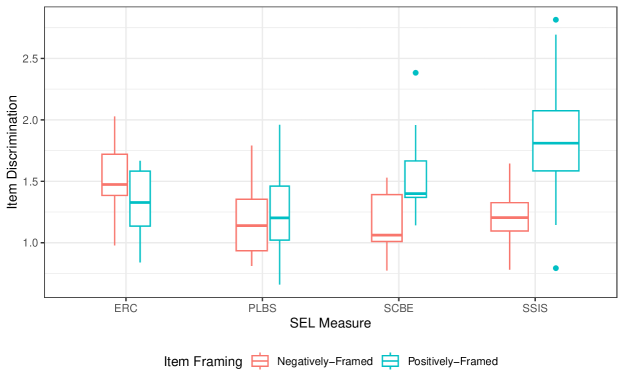
Notes: ERC = emotion regulation checklist; PLBS = preschool learning behavior scale; SCBE = social competence and behavior evaluation; SSIS = social skills improvement system. The width of each box is proportional to the number of items.
For the RD analysis, Figure 2 shows a scatter plot of on item position on the SSIS and shows an apparent discontinuity at the cutoff, suggesting that the switch to negatively-framed items may cause a decrease in item discrimination, a hypothesis we formally test with our RD model. Furthermore, the slope of item position appears linear on both sides of the cutoff, suggesting that a linear RD specification is appropriate. We provide additional descriptive analyses such as exploratory factor analysis scree plots, distributions of the latent trait estimates, and item characteristic curves for each survey in our supplement.
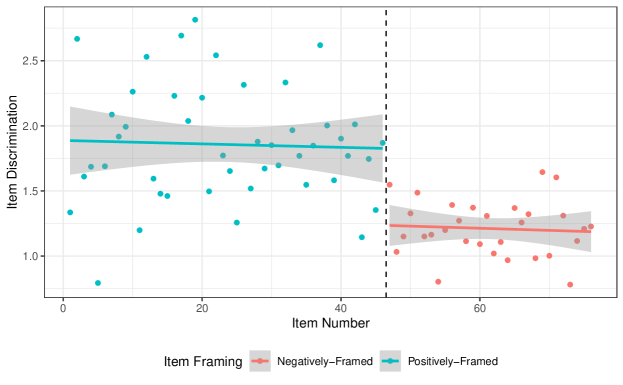
Notes: SSIS = social skills improvement system.
3.2 Models
Table 2 provides the results of the fitted models. The models confirm the substantial variability in observed in Figure 1, with residual SDs of ranging from .22 to .30 after accounting for differences in discrimination by negative framing. Across three of the four surveys, we observe a strong positive relationship between whether an item is negatively-framed and its location such that negatively-framed items tend to receive higher ratings, with on the logit scale for the ERC, SCBE, and SSIS. Because these items were reverse-coded, the large coefficient means that respondents tend to provide lower ratings on the original items. Simultaneously, negatively-framed items were substantially less discriminating than positively-framed items on two of the four surveys, with of -.28 (SE = .09) and -.40 (SE = .05) on the log scale for the SCBE and SSIS, respectively. These are large differences, representing a 25% and 33% decrease in discriminating power, or 1.3 SDs and 1.7 SDs when indexed to in a Cohen’s d-type metric. The effects of negative framing are less stark on the ERC and PLBS as the 95% credible intervals include 0. Figure 3 shows posterior predictions of the item discriminations with 95% credible intervals for each item.
| Estimate | ERC | PLBS | SCBE | SSIS | SSIS RD |
|---|---|---|---|---|---|
| 1 | -2.16 (0.19) | -1.86 (0.38) | -2.14 (0.23) | -2.22 (0.12) | -2.2 (0.12) |
| 2 | -0.61 (0.18) | 0.39 (0.37) | -1.02 (0.23) | -0.71 (0.11) | -0.69 (0.11) |
| 3 | 0.87 (0.19) | -0.28 (0.23) | 0.88 (0.11) | 0.9 (0.11) | |
| 4 | 0.53 (0.23) | ||||
| 5 | 1.63 (0.23) | ||||
| Mean ln(a) () | 0.25 (0.08) | 0.14 (0.11) | 0.42 (0.08) | 0.58 (0.04) | 0.59 (0.07) |
| b: Negatively-Framed () | 1.15 (0.23) | 0.68 (0.45) | 1.88 (0.28) | 1.4 (0.16) | 1.44 (0.16) |
| a: Negatively-Framed () | 0.16 (0.09) | -0.01 (0.13) | -0.28 (0.09) | -0.4 (0.05) | -0.38 (0.1) |
| 0.53 (0.09) | 1.07 (0.17) | 0.73 (0.1) | 0.68 (0.06) | 0.68 (0.06) | |
| 0.22 (0.04) | 0.3 (0.04) | 0.22 (0.03) | 0.23 (0.02) | 0.23 (0.02) | |
| 1 | 1 | 1 | 1 | 1 | |
| 0 (0.22) | 0.2 (0.18) | -0.34 (0.17) | 0.19 (0.12) | 0.2 (0.11) |
Notes: The table presents the results of the fitted EIRMs. ERC = emotion regulation checklist; PLBS = preschool learning behavior scale; SCBE = social competence and behavior evaluation; SSIS = social skills improvement system; RD = regression discontinuity. Standard errors are in parentheses. is constrained to 1 for model identification. Item discriminations are modeled on a log scale.
The RD model applied to the SSIS data shows that negative framing plausibly causes lower item discrimination (), although the estimate is less precise than in the model for the difference in means. A randomization test in which we randomly assign the estimated to an item position and rerun the RD model 1,000 times provides an approximate p-value of .007 for this effect. The coefficients for the position of the item in the measure (i.e., and in Equation 16; not displayed in the table) are essentially 0 for both positively- and negatively-framed items, suggesting that it is not simply survey fatigue that predicts lower discrimination for the later items, but the switch to negative framing that causes a reduction in item discrimination.
The identifying assumption of the RD model could be compromised if, in addition to the introduction of negative framing, another simultaneous change occurred starting at item 47. For example, if item wording also became more complex and confused participants, this could also reduce item discrimination and confound the causal effect of the negative framing [203]. We view this as unlikely because a qualitative examination of the item text reveals that the only apparent difference beginning at item 47 is the negative framing. We test this hypothesis explicitly by applying the Flesch-Kincaid text complexity index to the SSIS item text and show that there is no change in readability when the items switch to negative framing. In fact, the negatively-framed items in the sample are slightly easier in readability than positively-framed items at the cutoff (effect size grade levels, SE = 2.05, p = .51). A scatter plot of readability on item position is presented in Appendix D.
An alternative threat to identification is that careless respondents artificially increase the difference in discrimination between the positively- and negatively-framed items [216, 204, 175, 170, 225]. This could occur if, for example, some subset of respondents selected the same response category for each item in the survey. In our supplement, we test this possibility by excluding respondents with low values of intra-individual response variability (i.e., the within-person SD of item scores) as a proxy for careless responding [224, 147, 151], and find that the results of the analysis are unchanged. In sum, given that the effect is so large in magnitude and that alternative explanations appear implausible, we view the causal argument that the switch to negative framing is causing lower item discrimination as the most reasonable interpretation of the results.
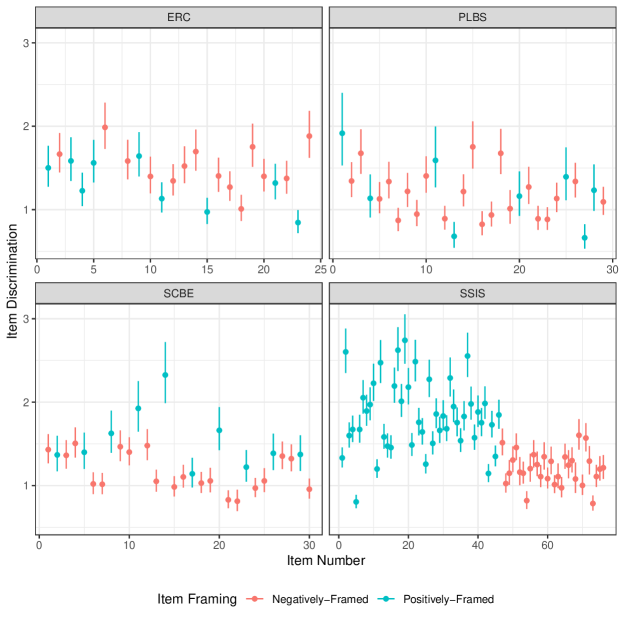
Notes: ERC = emotion regulation checklist; PLBS = preschool learning behavior scale; SCBE = social competence and behavior evaluation; SSIS = social skills improvement system. The bars show 95% credible intervals.
4 Discussion
Explaining item parameters as a function of item characteristics has a long history but has mainly focused on models for item location; models for item discrimination have remained mostly unexplored. In this study, we show how explanatory item response models (EIRM) that include random effects for item discrimination and allow for latent regressions for the discriminations can be extended to polytomous responses and can answer substantive research questions about how negative framing may affect an item’s discriminating power.
Results from four social-emotional learning surveys applied to 1000 preschool children show some evidence that negatively-framed items are systematically less discriminating, with two of the four surveys showing substantially lower discrimination for negatively-framed items. Furthermore, a plausibly causal estimate from the regression discontinuity analysis shows that the sudden change to negatively-framed items partway through the survey causes lower item discrimination in that survey. A replication of the descriptive analyses using the followup survey data in Appendix C shows nearly identical results to the main analysis, validating our findings.
Our analysis is illustrative of the type of insights we can gain from extending the EIRM to model item discriminations as a function of covariates. However, we emphasize that even a finding suggesting that some types of items may be more or less informative than others on average should not be the sole criterion for including or excluding them from a measure. Other considerations such as construct underrepresentation, addressing potential acquiescence or agreement bias, or leveraging reverse-coded items in mixture models to detect careless behavior may be highly relevant depending on the assessment context [173, 216, 118, 175].
While promising, several limitations temper the strength of our results. First, the Bayesian 2PL models explored here are considerably more computationally intensive than analogous frequentist 1PL models due to the MCMC estimation procedure, taking hours to fit rather than minutes or seconds, even with only 1000 respondents, and thus may present a challenge in large-scale data contexts. Second, brms does not yet support a fully random effects specification of the GRM, either allowing fixed effects for all item thresholds, which precludes the use of item predictors in the model for item location, or fixed effects for the average item thresholds and uniform random shifts for the individual items, as explored here [130, p. 36]. As a sensitivity check, we refit our models with fixed threshold parameters for each item-category combination (i.e., allowing category distances to vary across items) with random effects for discrimination to better match the traditional GRM parameterization and include the results in our supplement. Overall, the magnitude and direction of the coefficients for negative framing are unchanged for the SSIS and the ERC, effects remain non-significant for the PLBS, but the effect for SCBE is no longer significant. The standard deviation of , , is higher across all models. Thus, the results are somewhat sensitive to the choice of the IRT model.
Several extensions merit consideration as potential applications of the 2PL EIRM to evaluate differences in item discrimination:
-
1.
The model could easily be extended to include multiple variables for either richer description of how various features combine in predicting item discrimination, or non-uniform DIF analysis by including person covariates in the model for the discrimination parameter [132, 125, 192], such as how expert raters may provide more discriminating ratings than novices [168]. We show example brms code to fit such models in Appendix A.
-
2.
The application of causal inference methods to interventions designed to increase item discrimination, such as whether training raters increases the discrimination of their ratings, or how different wordings of the same item or different sets of distractors on multiple choice items can provide more discrimination in test design may lead to more informative and efficient measurement [197].
-
3.
Research on modality effects on discrimination may provide insight into whether, for example, self-report versus external ratings of the same items, or different types of response options are more discriminating, which may have implications for cost and scale of assessments [219].
- 4.
-
5.
Leveraging covariates that vary at the person-item level such as response times or other types of process data and investigating how these are related to item discrimination could provide new insights into respondent behavior; for example, the speed-accuracy trade-off or detecting disengagement [145, 183, 191, 123, 215, 214, 181]. For instance, aberrantly fast response times may stem from disengaged behavior and may be associated with discriminations of essentially zero. Likewise, some types of cognitive assessment items may no longer discriminate between low- and high-ability respondents when respondents spend sufficient time on solving them. So far, such research questions were only possible to address with specialized software [123].
-
6.
The models considered here use random intercepts for the item discrimination residuals; random slopes models that allow for the effects of person covariates on item discrimination to vary by item offer a promising extension for DIF analysis (or allowing the effects of item covariates to vary by person, see [198]), based on similar work in 1PL causal inference models that allow unique treatment effects on each item by including random slopes of person-level treatment in the model [156, 154, 158].
-
7.
Conceptual work on the relationship between our model and network psychometrics [169, 124, 149], such as how discrimination parameters are related to the strength of network structures offer an area of potential synthesis between the latent variable approach explored here and alternative psychometric models. For example, our analyses of the effects of negatively-framed items complement recent network psychometric findings illustrating that negatively-framed items function differently in psychometric network structures [127].
-
8.
Our approach can easily be integrated into factor analytic and SEM frameworks to facilitate applications to continuous response data. When used to study item wording effects, it may complement existing approaches such as bi-factor models [162] commonly used to this end.
In sum, extending the EIRM to 2PL settings, polytomous responses, and latent regression models of item discrimination parameters provides a useful opportunity to answer substantively interesting research questions that were difficult to explicitly address in prior frameworks. By applying these models, researchers in the psychological and behavioral sciences can gain important insights into why some items are more discriminating than others and can leverage this information to design more informative measures.
5 Declarations
Funding
This research was supported in part by the Jacobs Foundation.
Conflicts of Interest
The authors report no conflicts of interest.
Ethics approval
Not applicable.
Consent to participate
Not applicable.
Consent for publication
Not applicable.
Availability of Data and Materials
The original data set and survey questionnaires are publicly available at the following URL: https://ldbase.org/datasets/38d4a723-c167-4908-a250-2cf29a4ff49b.
Code Availability
Our code, analysis output, and supplemental materials are available at the following URL: https://researchbox.org/3008&PEER_REVIEW_passcode=TSPWAZ.
Author Contributions
Conceptualization: Author 1
Methodology: Author 1, Author 2, Author 4
Software: Author 1
Formal Analysis: Author 1
Writing—original draft preparation: Author 1
Writing—review and editing: Author 1, Author 2, Author 3, Author 4
References
- [1] Raymond J Adams, Mark Wilson and Wen-chung Wang “The multidimensional random coefficients multinomial logit model” In Applied Psychological Measurement 21.1 Sage Publications, 1997, pp. 1–23
- [2] Samah AlKhuzaey, Floriana Grasso, Terry R Payne and Valentina Tamma “Text-based Question Difficulty Prediction: A Systematic Review of Automatic Approaches” In International Journal of Artificial Intelligence in Education Springer, 2023, pp. 1–53
- [3] Xinming An and Yiu-Fai Yung “Item response theory: What it is and how you can use the IRT procedure to apply it” In SAS Institute Inc 10.4 Citeseer, 2014, pp. 364–2014
- [4] Joshua D Angrist and Jörn-Steffen Pischke “Mostly harmless econometrics: An empiricist’s companion” Princeton university press, 2009
- [5] Víctor B Arias et al. “Detecting non-content-based response styles in survey data: An application of mixture factor analysis” In Behavior Research Methods Springer, 2023, pp. 1–17
- [6] Tihomir Asparouhov and Bengt Muthén “General random effect latent variable modeling: Random subjects, items, contexts, and parameters” In annual meeting of the National Council on Measurement in Education, Vancouver, British Columbia, 2012
- [7] C.. Bailey et al. “Preschool Social and Emotional Development Study—Connecticut Dataset”, LDbase, 2023 URL: https://doi.org/10.33009/ldbase.1680213217.8ed0
- [8] Douglas Barker and Robert L Ebel “A comparison of difficulty and discrimination values of selected true-false item types” In Contemporary Educational Psychology 7.1 Elsevier, 1982, pp. 35–40
- [9] Christopher R Bilder and Thomas M Loughin “Analysis of categorical data with R” CRC Press, 2014
- [10] Maria Bolsinova, Paul De Boeck and Jesper Tijmstra “Modelling conditional dependence between response time and accuracy” In Psychometrika 82, 2017, pp. 1126–1148 DOI: 10.1007/s11336-016-9537-6
- [11] Denny Borsboom “Possible futures for network psychometrics” In Psychometrika 87.1 Springer, 2022, pp. 253–265
- [12] Hunter Breland and Yong-Won Lee “Investigating uniform and non-uniform gender DIF in computer-based ESL writing assessment” In Applied Measurement in Education 20.4 Taylor & Francis, 2007, pp. 377–403
- [13] Derek C Briggs “Using explanatory item response models to analyze group differences in science achievement” In Applied Measurement in Education 21.2 Taylor & Francis, 2008, pp. 89–118
- [14] H Cigdem Bulut, Okan Bulut and Ashley Clelland “A Psychometric Network Analysis Approach for Detecting Item Wording Effects in Self-report Measures across Subgroups” In Field Methods, 2024, pp. 1525822X241247444 DOI: 10.1177/1525822X241247444
- [15] Okan Bulut, Qi Quo and Mark J Gierl “A structural equation modeling approach for examining position effects in large-scale assessments” In Large-scale Assessments in Education 5 Springer, 2017, pp. 1–20
- [16] Okan Bulut, Guher Gorgun and Seyma Nur Yildirim-Erbasli “Estimating explanatory extensions of dichotomous and polytomous Rasch models: The eirm package in R” In Psych 3.3 MDPI, 2021, pp. 308–321
- [17] Paul-Christian Bürkner “Bayesian Item Response Modeling in R with brms and Stan” In Journal of Statistical Software 100.5, 2021, pp. 1–54 DOI: 10.18637/jss.v100.i05
- [18] R Philip Chalmers “mirt: A multidimensional item response theory package for the R environment” In Journal of statistical Software 48, 2012, pp. 1–29
- [19] R Philip Chalmers “Improving the crossing-SIBTEST statistic for detecting non-uniform DIF” In Psychometrika 83 Springer, 2018, pp. 376–386
- [20] Sun-Joo Cho, Michele Athay and Kristopher J Preacher “Measuring change for a multidimensional test using a generalized explanatory longitudinal item response model” In British Journal of Mathematical and Statistical Psychology 66.2 Wiley Online Library, 2013, pp. 353–381
- [21] Sun-Joo Cho, Paul De Boeck, Susan Embretson and Sophia Rabe-Hesketh “Additive multilevel item structure models with random residuals: Item modeling for explanation and item generation” In Psychometrika 79 Springer, 2014, pp. 84–104
- [22] Rune Haubo B Christensen “Analysis of ordinal data with cumulative link models—estimation with the R-package ordinal” In R-package version 28 Citeseer, 2015, pp. 406
- [23] Scott Cunningham “Causal inference: The mixtape” Yale university press, 2021
- [24] Jeff Davis and Abdullah Ferdous “Using item difficulty and item position to measure test fatigue”, 2005
- [25] Paul De Boeck “Random item IRT models” In Psychometrika 73 Springer, 2008, pp. 533–559
- [26] Paul De Boeck and Mark Wilson “Explanatory item response models: A generalized linear and nonlinear approach” Springer Science & Business Media, 2004
- [27] Paul De Boeck and Mark Wilson “Multidimensional explanatory item response modeling” In Handbook of Item Response Theory Modeling Routledge, 2014, pp. 252–271
- [28] Paul De Boeck et al. “The estimation of item response models with the lmer function from the lme4 package in R” In Journal of Statistical Software 39, 2011, pp. 1–28
- [29] Paul De Boeck, Sun-Joo Cho and Mark Wilson “Explanatory item response models” In The Wiley handbook of cognition and assessment: Frameworks, methodologies, and applications Wiley Online Library, 2016, pp. 247–266
- [30] Dries Debeer and Rianne Janssen “Modeling item-position effects within an IRT framework” In Journal of Educational Measurement 50.2 Wiley Online Library, 2013, pp. 164–185
- [31] Sinem Demirkol and Hülya Kelecioglu “Analyzing the interaction of item position effect and student characteristics within explanatory IRT models” In Journal of Measurement and Evaluation in Education and Psychology 13.4 Eğitimde ve Psikolojide Ölçme ve Değerlendirme Derneği, 2022, pp. 282–304
- [32] Benjamin W Domingue et al. “Speed–accuracy trade-off? Not so fast: Marginal changes in speed have inconsistent relationships with accuracy in real-world settings” In Journal of Educational and Behavioral Statistics 47.5 Sage Publications Sage CA: Los Angeles, CA, 2022, pp. 576–602
- [33] Harold Doran, Douglas Bates, Paul Bliese and Maritza Dowling “Estimating the multilevel Rasch model: With the lme4 package” In Journal of Statistical Software 20, 2007, pp. 1–18
- [34] Alexandra M Dunn, Eric D Heggestad, Linda R Shanock and Nels Theilgard “Intra-individual response variability as an indicator of insufficient effort responding: Comparison to other indicators and relationships with individual differences” In Journal of Business and Psychology 33 Springer, 2018, pp. 105–121
- [35] Susan E Embretson “Generating items during testing: Psychometric issues and models” In Psychometrika 64, 1999, pp. 407–433 DOI: 10.1007/BF02294564
- [36] Sacha Epskamp, Mijke Rhemtulla and Denny Borsboom “Generalized network psychometrics: Combining network and latent variable models” In Psychometrika 82 Springer, 2017, pp. 904–927
- [37] Gerhard H Fischer “The linear logistic test model as an instrument in educational research” In Acta Psychologica 37.6 Elsevier, 1973, pp. 359–374
- [38] Donald W Fiske and Laura Rice “Intra-individual response variability.” In Psychological Bulletin 52.3 American Psychological Association, 1955, pp. 217
- [39] Jennifer K Gilbert, Donald L Compton and Devin M Kearns “Word and person effects on decoding accuracy: A new look at an old question.” In Journal of Educational Psychology 103.2 American Psychological Association, 2011, pp. 489
- [40] Joshua B Gilbert “Estimating treatment effects with the explanatory item response model” In Journal of Research on Educational Effectiveness Taylor & Francis, 2024, pp. 1–19
- [41] Joshua B Gilbert, Fredrik Hieronymus, Elias Eriksson and Benjamin W Domingue “Item-Level Heterogeneous Treatment Effects of Selective Serotonin Reuptake Inhibitors (SSRIs) on Depression: Implications for Inference, Generalizability, and Identification” In arXiv preprint arXiv:2402.04487, 2024
- [42] Joshua B Gilbert et al. “Estimating Heterogeneous Treatment Effects with Item-Level Outcome Data: Insights from Item Response Theory” In arXiv preprint arXiv:2405.00161, 2024
- [43] Joshua B Gilbert, James S Kim and Luke W Miratrix “Leveraging item parameter drift to assess transfer effects in vocabulary learning” In Applied Measurement in Education Taylor & Francis, 2024
- [44] Joshua B Gilbert, Luke W Miratrix, Mridul Joshi and Benjamin W Domingue “Disentangling person-dependent and item-dependent causal effects: Applications of item response theory to the estimation of treatment effect heterogeneity” In Journal of Educational and Behavioral Statistics, 2024
- [45] Joshua B Gilbert, James S Kim and Luke W Miratrix “Modeling item-level heterogeneous treatment effects with the explanatory item response model: Leveraging large-scale online assessments to pinpoint the impact of educational interventions” In Journal of Educational and Behavioral Statistics SAGE Publications, 2023, pp. 889–913
- [46] Amanda P Goodwin, Jennifer K Gilbert and Sun-Joo Cho “Morphological contributions to adolescent word reading: An item response approach” In Reading Research Quarterly 48.1 Wiley Online Library, 2013, pp. 39–60
- [47] Ellen Greenberger, Chuansheng Chen, Julia Dmitrieva and Susan P Farruggia “Item-wording and the dimensionality of the Rosenberg Self-Esteem Scale: Do they matter?” In Personality and individual differences 35.6 Elsevier, 2003, pp. 1241–1254
- [48] Frank Gresham and Stephen N Elliott “Social skills improvement system (SSIS) rating scales” Bloomington, MN: Pearson Assessments, 2008
- [49] Honglei Gu, Zhonglin Wen and Xitao Fan “The impact of wording effect on reliability and validity of the Core Self-Evaluation Scale (CSES): A bi-factor perspective” In Personality and Individual Differences 83 Elsevier, 2015, pp. 142–147
- [50] Jinyong Hahn, Petra Todd and Wilbert Van der Klaauw “Identification and estimation of treatment effects with a regression-discontinuity design” In Econometrica 69.1 JSTOR, 2001, pp. 201–209
- [51] Kilian Hasselhorn, Charlotte Ottenstein, Thorsten Meiser and Tanja Lischetzke “The Effects of Questionnaire Length on the Relative Impact of Response Styles in Ambulatory Assessment” In Multivariate Behavioral Research Taylor & Francis, 2024, pp. 1–15
- [52] Paul W Holland “On the sampling theory roundations of item response theory models” In Psychometrika 55 Springer, 1990, pp. 577–601
- [53] Patrick M Horan, Christine DiStefano and Robert W Motl “Wording effects in self-esteem scales: Methodological artifact or response style?” In Structural Equation Modeling 10.3 Taylor & Francis, 2003, pp. 435–455
- [54] Sijia Huang, Jinwen Luo and Li Cai “An explanatory multidimensional random item effects rating scale model” In Educational and Psychological Measurement 83.6 Sage Publications Sage CA: Los Angeles, CA, 2023, pp. 1229–1248
- [55] Stephen M Humphry “The role of the unit in physics and psychometrics” In Measurement 9.1 Taylor & Francis, 2011, pp. 1–24
- [56] Adela-Maria Isvoranu, Sacha Epskamp, Lourens Waldorp and Denny Borsboom “Network psychometrics with R: A guide for behavioral and social scientists” Routledge, 2022
- [57] Brittany A Jaso, Noah I Kraus and Aaron S Heller “Identification of careless responding in ecological momentary assessment research: From posthoc analyses to real-time data monitoring.” In Psychological Methods 27.6 American Psychological Association, 2022, pp. 958
- [58] Minjeong Jeon and Frank Rijmen “A modular approach for item response theory modeling with the R package flirt” In Behavior Research Methods 48 Springer, 2016, pp. 742–755
- [59] Pascal Jordan and Martin Spiess “Rethinking the interpretation of item discrimination and factor loadings” In Educational and Psychological Measurement 79.6 SAGE Publications Sage CA: Los Angeles, CA, 2019, pp. 1103–1132
- [60] Krisztián Józsa and George A Morgan “Reversed items in Likert scales: Filtering out invalid responders” In Journal of Psychological and Educational Research 25.1 University of Oradea, Faculty of SocialHumanistic Sciences, 2017, pp. 7
- [61] Chester Chun Seng Kam “Why do we still have an impoverished understanding of the item wording effect? An empirical examination” In Sociological Methods & Research 47.3 Sage Publications Sage CA: Los Angeles, CA, 2018, pp. 574–597
- [62] Chester Chun Seng Kam and Shu Fai Cheung “A constrained factor mixture model for detecting careless responses that is simple to implement” In Organizational Research Methods SAGE Publications Sage CA: Los Angeles, CA, 2023, pp. 10944281231195298
- [63] Jinho Kim and Mark Wilson “Polytomous item explanatory IRT models with random item effects: Concepts and an application” In Measurement 151 Elsevier, 2020, pp. 107062
- [64] Young-Suk Grace Kim and Yaacov Petscher “Influences of individual, text, and assessment factors on text/discourse comprehension in oral language (listening comprehension)” In Annals of Dyslexia 71.2 Springer, 2021, pp. 218–237
- [65] Neal M Kingston and Neil J Dorans “The effect of the position of an item within a test on item responding behavior: An analysis based on item response theory” In ETS Research Report Series 1982.1 Wiley Online Library, 1982, pp. i–26
- [66] Neal M Kingston and Neil J Dorans “Item location effects and their implications for IRT equating and adaptive testing” In Applied Psychological Measurement 8.2 Sage Publications Sage CA: Thousand Oaks, CA, 1984, pp. 147–154
- [67] Rinke H Klein Entink, Jörg-Tobias Kuhn, Lutz F Hornke and Jean-Paul Fox “Evaluating cognitive theory: A joint modeling approach using responses and response times.” In Psychological Methods 14.1, 2009, pp. 54 DOI: 10.1037/a0014877
- [68] Christoph Koenig, Benjamin Becker and Esther Ulitzsch “Bayesian hierarchical response time modelling—A tutorial” In British Journal of Mathematical and Statistical Psychology 76.3, 2023, pp. 623–645 DOI: 10.1111/bmsp.12302
- [69] Peter J LaFreniere and Jean E Dumas “Social competence and behavior evaluation in children ages 3 to 6 years: the short form (SCBE-30).” In Psychological Assessment 8.4 American Psychological Association, 1996, pp. 369
- [70] Jing Lu, Chun Wang and Ningzhong Shi “A mixture response time process model for aberrant behaviors and item nonresponses” In Multivariate Behavioral Research 58.1 Taylor & Francis, 2023, pp. 71–89
- [71] Geofferey N Masters “Item discrimination: When more is worse” In Journal of Educational Measurement 25.1 Wiley Online Library, 1988, pp. 15–29
- [72] Paul A McDermott, Nanette M Leigh and Marlo A Perry “Development and validation of the preschool learning behaviors scale” In Psychology in the Schools 39.4 Wiley Online Library, 2002, pp. 353–365
- [73] Hanyi Min, Michael Zickar and Georgi Yankov “Understanding item parameters in personality scales: An explanatory item response modeling approach” In Personality and Individual Differences 128 Elsevier, 2018, pp. 1–6
- [74] Eiji Muraki “Fitting a polytomous item response model to Likert-type data” In Applied Psychological Measurement 14.1 Sage Publications Sage CA: Thousand Oaks, CA, 1990, pp. 59–71
- [75] Bengt Muthén and Tihomir Asparouhov “Recent methods for the study of measurement invariance with many groups: Alignment and random effects” In Sociological Methods & Research 47.4 Sage Publications Sage CA: Los Angeles, CA, 2018, pp. 637–664
- [76] Bengt Muthén and Linda Muthén “Mplus: A general latent variable modeling program” In Muthén & Muthén, 2019
- [77] Gabriel Nagy and Esther Ulitzsch “A multilevel mixture IRT framework for modeling response times as predictors or indicators of response engagement in IRT models” In Educational and Psychological Measurement 82.5 Sage Publications Sage CA: Los Angeles, CA, 2022, pp. 845–879
- [78] Gabriel Nagy et al. “Item position effects in a reading comprehension test: An IRT study of individual differences and individual correlates” In Psychological Test and Assessment Modeling 60.2 PABST Science Publishers, 2018, pp. 165–187
- [79] Pankaja Narayanon and Hariharan Swaminathan “Identification of items that show nonuniform DIF” In Applied Psychological Measurement 20.3 Sage Publications Sage CA: Thousand Oaks, CA, 1996, pp. 257–274
- [80] Irina Pandarova et al. “Predicting the difficulty of exercise items for dynamic difficulty adaptation in adaptive language tutoring” In International Journal of Artificial Intelligence in Education 29 Springer, 2019, pp. 342–367
- [81] Yaacov Petscher, Donald L Compton, Laura Steacy and Hannah Kinnon “Past perspectives and new opportunities for the explanatory item response model” In Annals of Dyslexia 70.2 Springer, 2020, pp. 160–179
- [82] Sophia Rabe-Hesketh, Anders Skrondal and Andrew Pickles “Maximum likelihood estimation of generalized linear models with covariate measurement error” In The Stata Journal 3.4 SAGE Publications Sage CA: Los Angeles, CA, 2003, pp. 386–411
- [83] Jennifer Randall, Yuk Fai Cheong and George Engelhard Jr “Using explanatory item response theory modeling to investigate context effects of differential item functioning for students with disabilities” In Educational and Psychological Measurement 71.1 SAGE Publications Sage CA: Los Angeles, CA, 2011, pp. 129–147
- [84] Bryce B Reeve et al. “Psychometric evaluation of the PROMIS® fatigue measure in an ethnically and racially diverse population-based sample of cancer patients” In Psychological Test and Assessment Modeling 58.1 PABST Science Publishers, 2016, pp. 119
- [85] Frank Rijmen, Paul De Boeck and KU Leuven “The random weights linear logistic test model” In Applied Psychological Measurement 26.3 Sage Publications Sage CA: Thousand Oaks, CA, 2002, pp. 271–285
- [86] Frank Rijmen, Francis Tuerlinckx, Paul De Boeck and Peter Kuppens “A nonlinear mixed model framework for item response theory” In Psychological Methods 8.2 American Psychological Association, 2003, pp. 185
- [87] Brian Ripley et al. “Package ‘mass”’ In Cran r 538, 2013, pp. 113–120
- [88] Nicholas J Rockwood and Minjeong Jeon “Estimating complex measurement and growth models using the R package PLmixed” In Multivariate Behavioral Research 54.2 Taylor & Francis, 2019, pp. 288–306
- [89] Yves Rosseel “lavaan: An R package for structural equation modeling” In Journal of statistical software 48, 2012, pp. 1–36
- [90] Bonnie R Rush, David C Rankin and Brad J White “The impact of item-writing flaws and item complexity on examination item difficulty and discrimination value” In BMC medical education 16 Springer, 2016, pp. 1–10
- [91] Ulrich Schroeders, Christoph Schmidt and Timo Gnambs “Detecting careless responding in survey data using stochastic gradient boosting” In Educational and psychological measurement 82.1 Sage Publications Sage CA: Los Angeles, CA, 2022, pp. 29–56
- [92] Ann Shields and Dante Cicchetti “Emotion regulation checklist” In Developmental Psychology, 1997
- [93] Katherine A Sliter and Michael J Zickar “An IRT examination of the psychometric functioning of negatively worded personality items” In Educational and Psychological Measurement 74.2 Sage Publications Sage CA: Los Angeles, CA, 2014, pp. 214–226
- [94] Øystein Sørensen “Multilevel semiparametric latent variable modeling in R with “galamm””, 2024
- [95] Luke Stanke and Okan Bulut “Explanatory item response models for polytomous item responses” In International Journal of Assessment Tools in Education 6.2 İzzet Kara, 2019, pp. 259–278
- [96] A Jackson Stenner, William P Fisher Jr, Mark H Stone and Donald S Burdick “Causal Rasch models” In Frontiers in psychology 4 Frontiers Media SA, 2013, pp. 536
- [97] Lubomír Štěpánek, Jana Dlouhá and Patrícia Martinková “Item difficulty prediction using item text features: Comparison of predictive performance across machine-learning algorithms” In Mathematics 11.19 MDPI, 2023, pp. 4104
- [98] Javier Suárez Álvarez et al. “Using reversed items in Likert scales: A questionable practice” In Psicothema 30, 2018
- [99] Changjiang Tang, Borui Yang and Hao Tian “Examination of the wording effect in the new ecological paradigm scale in China: a bi-factor modeling approach” In Current Psychology 43.7 Springer, 2024, pp. 5887–5900
- [100] Francis Tuerlinckx and Paul De Boeck “Two interpretations of the discrimination parameter” In Psychometrika 70 Springer, 2005, pp. 629–650
- [101] Esther Ulitzsch et al. “A response-time-based latent response mixture model for identifying and modeling careless and insufficient effort responding in survey data” In Psychometrika 87.2, 2022, pp. 593–619 DOI: 10.1007/s11336-021-09817-7
- [102] Esther Ulitzsch, Seyma Nur Yildirim-Erbasli, Guher Gorgun and Okan Bulut “An explanatory mixture IRT model for careless and insufficient effort responding in self-report measures” In British Journal of Mathematical and Statistical Psychology 75.3 Wiley Online Library, 2022, pp. 668–698
- [103] Esther Ulitzsch, Matthias Davier and Steffi Pohl “A hierarchical latent response model for inferences about examinee engagement in terms of guessing and item-level non-response” In British Journal of Mathematical and Statistical Psychology 73, 2020, pp. 83–112 DOI: 10.1111/bmsp.12188
- [104] Wim J Van der Linden “Handbook of Item Response Theory: Volume 1: Models” CRC press, 2017
- [105] Amanda Venta et al. “Reverse-coded items do not work in Spanish: Data from four samples using established measures” In Frontiers in Psychology 13 Frontiers Media SA, 2022, pp. 828037
- [106] Yue Wang and Hong Lu “Validating items of different modalities to assess the educational technology competency of pre-service teachers” In Computers & Education 162 Elsevier, 2021, pp. 104081
- [107] Gail H Weems and Anthony J Onwuegbuzie “The impact of midpoint responses and reverse coding on survey data” In Measurement and Evaluation in Counseling and Development 34.3 Taylor & Francis, 2001, pp. 166–176
- [108] Bert Weijters and Hans Baumgartner “Misresponse to reversed and negated items in surveys: A review” In Journal of Marketing Research 49.5 SAGE Publications Sage CA: Los Angeles, CA, 2012, pp. 737–747
- [109] Richard Williams “Generalized ordered logit/partial proportional odds models for ordinal dependent variables” In The stata journal 6.1 SAGE Publications Sage CA: Los Angeles, CA, 2006, pp. 58–82
- [110] Mark Wilson, Paul De Boeck and Claus H Carstensen “Explanatory item response models: A brief introduction” In Assessment of Competencies in Educational Contexts, 2008, pp. 91–120
- [111] Richard Dean Yentes “In search of best practices for the identification and removal of careless responders” North Carolina State University, 2020
- [112] Hongyun Liu Yue Liu and Xiaofeng You “The Impact of Non-Effortful Responding on Item and Person Parameters in Item-Pool Scaling Linking” In Applied Measurement in Education Routledge, 2024 DOI: 10.1080/08957347.2024.2345598
- [113] Samuel Zorowitz, Gabriele Chierchia, Sarah-Jayne Blakemore and Nathaniel D Daw “An item response theory analysis of the Matrix Reasoning Item Bank (MaRs-IB)” In Behavior Research Methods 56.3 Springer, 2024, pp. 1104–1122
References
- [114] Raymond J Adams, Mark Wilson and Wen-chung Wang “The multidimensional random coefficients multinomial logit model” In Applied Psychological Measurement 21.1 Sage Publications, 1997, pp. 1–23
- [115] Samah AlKhuzaey, Floriana Grasso, Terry R Payne and Valentina Tamma “Text-based Question Difficulty Prediction: A Systematic Review of Automatic Approaches” In International Journal of Artificial Intelligence in Education Springer, 2023, pp. 1–53
- [116] Xinming An and Yiu-Fai Yung “Item response theory: What it is and how you can use the IRT procedure to apply it” In SAS Institute Inc 10.4 Citeseer, 2014, pp. 364–2014
- [117] Joshua D Angrist and Jörn-Steffen Pischke “Mostly harmless econometrics: An empiricist’s companion” Princeton university press, 2009
- [118] Víctor B Arias et al. “Detecting non-content-based response styles in survey data: An application of mixture factor analysis” In Behavior Research Methods Springer, 2023, pp. 1–17
- [119] Tihomir Asparouhov and Bengt Muthén “General random effect latent variable modeling: Random subjects, items, contexts, and parameters” In annual meeting of the National Council on Measurement in Education, Vancouver, British Columbia, 2012
- [120] C.. Bailey et al. “Preschool Social and Emotional Development Study—Connecticut Dataset”, LDbase, 2023 URL: https://doi.org/10.33009/ldbase.1680213217.8ed0
- [121] Douglas Barker and Robert L Ebel “A comparison of difficulty and discrimination values of selected true-false item types” In Contemporary Educational Psychology 7.1 Elsevier, 1982, pp. 35–40
- [122] Christopher R Bilder and Thomas M Loughin “Analysis of categorical data with R” CRC Press, 2014
- [123] Maria Bolsinova, Paul De Boeck and Jesper Tijmstra “Modelling conditional dependence between response time and accuracy” In Psychometrika 82, 2017, pp. 1126–1148 DOI: 10.1007/s11336-016-9537-6
- [124] Denny Borsboom “Possible futures for network psychometrics” In Psychometrika 87.1 Springer, 2022, pp. 253–265
- [125] Hunter Breland and Yong-Won Lee “Investigating uniform and non-uniform gender DIF in computer-based ESL writing assessment” In Applied Measurement in Education 20.4 Taylor & Francis, 2007, pp. 377–403
- [126] Derek C Briggs “Using explanatory item response models to analyze group differences in science achievement” In Applied Measurement in Education 21.2 Taylor & Francis, 2008, pp. 89–118
- [127] H Cigdem Bulut, Okan Bulut and Ashley Clelland “A Psychometric Network Analysis Approach for Detecting Item Wording Effects in Self-report Measures across Subgroups” In Field Methods, 2024, pp. 1525822X241247444 DOI: 10.1177/1525822X241247444
- [128] Okan Bulut, Guher Gorgun and Seyma Nur Yildirim-Erbasli “Estimating explanatory extensions of dichotomous and polytomous Rasch models: The eirm package in R” In Psych 3.3 MDPI, 2021, pp. 308–321
- [129] Okan Bulut, Qi Quo and Mark J Gierl “A structural equation modeling approach for examining position effects in large-scale assessments” In Large-scale Assessments in Education 5 Springer, 2017, pp. 1–20
- [130] Paul-Christian Bürkner “Bayesian Item Response Modeling in R with brms and Stan” In Journal of Statistical Software 100.5, 2021, pp. 1–54 DOI: 10.18637/jss.v100.i05
- [131] R Philip Chalmers “mirt: A multidimensional item response theory package for the R environment” In Journal of statistical Software 48, 2012, pp. 1–29
- [132] R Philip Chalmers “Improving the crossing-SIBTEST statistic for detecting non-uniform DIF” In Psychometrika 83 Springer, 2018, pp. 376–386
- [133] Sun-Joo Cho, Michele Athay and Kristopher J Preacher “Measuring change for a multidimensional test using a generalized explanatory longitudinal item response model” In British Journal of Mathematical and Statistical Psychology 66.2 Wiley Online Library, 2013, pp. 353–381
- [134] Sun-Joo Cho, Paul De Boeck, Susan Embretson and Sophia Rabe-Hesketh “Additive multilevel item structure models with random residuals: Item modeling for explanation and item generation” In Psychometrika 79 Springer, 2014, pp. 84–104
- [135] Rune Haubo B Christensen “Analysis of ordinal data with cumulative link models—estimation with the R-package ordinal” In R-package version 28 Citeseer, 2015, pp. 406
- [136] Scott Cunningham “Causal inference: The mixtape” Yale university press, 2021
- [137] Jeff Davis and Abdullah Ferdous “Using item difficulty and item position to measure test fatigue”, 2005
- [138] Paul De Boeck “Random item IRT models” In Psychometrika 73 Springer, 2008, pp. 533–559
- [139] Paul De Boeck et al. “The estimation of item response models with the lmer function from the lme4 package in R” In Journal of Statistical Software 39, 2011, pp. 1–28
- [140] Paul De Boeck, Sun-Joo Cho and Mark Wilson “Explanatory item response models” In The Wiley handbook of cognition and assessment: Frameworks, methodologies, and applications Wiley Online Library, 2016, pp. 247–266
- [141] Paul De Boeck and Mark Wilson “Explanatory item response models: A generalized linear and nonlinear approach” Springer Science & Business Media, 2004
- [142] Paul De Boeck and Mark Wilson “Multidimensional explanatory item response modeling” In Handbook of Item Response Theory Modeling Routledge, 2014, pp. 252–271
- [143] Dries Debeer and Rianne Janssen “Modeling item-position effects within an IRT framework” In Journal of Educational Measurement 50.2 Wiley Online Library, 2013, pp. 164–185
- [144] Sinem Demirkol and Hülya Kelecioglu “Analyzing the interaction of item position effect and student characteristics within explanatory IRT models” In Journal of Measurement and Evaluation in Education and Psychology 13.4 Eğitimde ve Psikolojide Ölçme ve Değerlendirme Derneği, 2022, pp. 282–304
- [145] Benjamin W Domingue et al. “Speed–accuracy trade-off? Not so fast: Marginal changes in speed have inconsistent relationships with accuracy in real-world settings” In Journal of Educational and Behavioral Statistics 47.5 Sage Publications Sage CA: Los Angeles, CA, 2022, pp. 576–602
- [146] Harold Doran, Douglas Bates, Paul Bliese and Maritza Dowling “Estimating the multilevel Rasch model: With the lme4 package” In Journal of Statistical Software 20, 2007, pp. 1–18
- [147] Alexandra M Dunn, Eric D Heggestad, Linda R Shanock and Nels Theilgard “Intra-individual response variability as an indicator of insufficient effort responding: Comparison to other indicators and relationships with individual differences” In Journal of Business and Psychology 33 Springer, 2018, pp. 105–121
- [148] Susan E Embretson “Generating items during testing: Psychometric issues and models” In Psychometrika 64, 1999, pp. 407–433 DOI: 10.1007/BF02294564
- [149] Sacha Epskamp, Mijke Rhemtulla and Denny Borsboom “Generalized network psychometrics: Combining network and latent variable models” In Psychometrika 82 Springer, 2017, pp. 904–927
- [150] Gerhard H Fischer “The linear logistic test model as an instrument in educational research” In Acta Psychologica 37.6 Elsevier, 1973, pp. 359–374
- [151] Donald W Fiske and Laura Rice “Intra-individual response variability.” In Psychological Bulletin 52.3 American Psychological Association, 1955, pp. 217
- [152] Jennifer K Gilbert, Donald L Compton and Devin M Kearns “Word and person effects on decoding accuracy: A new look at an old question.” In Journal of Educational Psychology 103.2 American Psychological Association, 2011, pp. 489
- [153] Joshua B Gilbert “Estimating treatment effects with the explanatory item response model” In Journal of Research on Educational Effectiveness Taylor & Francis, 2024, pp. 1–19
- [154] Joshua B Gilbert, Fredrik Hieronymus, Elias Eriksson and Benjamin W Domingue “Item-Level Heterogeneous Treatment Effects of Selective Serotonin Reuptake Inhibitors (SSRIs) on Depression: Implications for Inference, Generalizability, and Identification” In arXiv preprint arXiv:2402.04487, 2024
- [155] Joshua B Gilbert et al. “Estimating Heterogeneous Treatment Effects with Item-Level Outcome Data: Insights from Item Response Theory” In arXiv preprint arXiv:2405.00161, 2024
- [156] Joshua B Gilbert, James S Kim and Luke W Miratrix “Modeling item-level heterogeneous treatment effects with the explanatory item response model: Leveraging large-scale online assessments to pinpoint the impact of educational interventions” In Journal of Educational and Behavioral Statistics SAGE Publications, 2023, pp. 889–913
- [157] Joshua B Gilbert, James S Kim and Luke W Miratrix “Leveraging item parameter drift to assess transfer effects in vocabulary learning” In Applied Measurement in Education Taylor & Francis, 2024
- [158] Joshua B Gilbert, Luke W Miratrix, Mridul Joshi and Benjamin W Domingue “Disentangling person-dependent and item-dependent causal effects: Applications of item response theory to the estimation of treatment effect heterogeneity” In Journal of Educational and Behavioral Statistics, 2024
- [159] Amanda P Goodwin, Jennifer K Gilbert and Sun-Joo Cho “Morphological contributions to adolescent word reading: An item response approach” In Reading Research Quarterly 48.1 Wiley Online Library, 2013, pp. 39–60
- [160] Ellen Greenberger, Chuansheng Chen, Julia Dmitrieva and Susan P Farruggia “Item-wording and the dimensionality of the Rosenberg Self-Esteem Scale: Do they matter?” In Personality and individual differences 35.6 Elsevier, 2003, pp. 1241–1254
- [161] Frank Gresham and Stephen N Elliott “Social skills improvement system (SSIS) rating scales” Bloomington, MN: Pearson Assessments, 2008
- [162] Honglei Gu, Zhonglin Wen and Xitao Fan “The impact of wording effect on reliability and validity of the Core Self-Evaluation Scale (CSES): A bi-factor perspective” In Personality and Individual Differences 83 Elsevier, 2015, pp. 142–147
- [163] Jinyong Hahn, Petra Todd and Wilbert Van der Klaauw “Identification and estimation of treatment effects with a regression-discontinuity design” In Econometrica 69.1 JSTOR, 2001, pp. 201–209
- [164] Kilian Hasselhorn, Charlotte Ottenstein, Thorsten Meiser and Tanja Lischetzke “The Effects of Questionnaire Length on the Relative Impact of Response Styles in Ambulatory Assessment” In Multivariate Behavioral Research Taylor & Francis, 2024, pp. 1–15
- [165] Paul W Holland “On the sampling theory roundations of item response theory models” In Psychometrika 55 Springer, 1990, pp. 577–601
- [166] Patrick M Horan, Christine DiStefano and Robert W Motl “Wording effects in self-esteem scales: Methodological artifact or response style?” In Structural Equation Modeling 10.3 Taylor & Francis, 2003, pp. 435–455
- [167] Sijia Huang, Jinwen Luo and Li Cai “An explanatory multidimensional random item effects rating scale model” In Educational and Psychological Measurement 83.6 Sage Publications Sage CA: Los Angeles, CA, 2023, pp. 1229–1248
- [168] Stephen M Humphry “The role of the unit in physics and psychometrics” In Measurement 9.1 Taylor & Francis, 2011, pp. 1–24
- [169] Adela-Maria Isvoranu, Sacha Epskamp, Lourens Waldorp and Denny Borsboom “Network psychometrics with R: A guide for behavioral and social scientists” Routledge, 2022
- [170] Brittany A Jaso, Noah I Kraus and Aaron S Heller “Identification of careless responding in ecological momentary assessment research: From posthoc analyses to real-time data monitoring.” In Psychological Methods 27.6 American Psychological Association, 2022, pp. 958
- [171] Minjeong Jeon and Frank Rijmen “A modular approach for item response theory modeling with the R package flirt” In Behavior Research Methods 48 Springer, 2016, pp. 742–755
- [172] Pascal Jordan and Martin Spiess “Rethinking the interpretation of item discrimination and factor loadings” In Educational and Psychological Measurement 79.6 SAGE Publications Sage CA: Los Angeles, CA, 2019, pp. 1103–1132
- [173] Krisztián Józsa and George A Morgan “Reversed items in Likert scales: Filtering out invalid responders” In Journal of Psychological and Educational Research 25.1 University of Oradea, Faculty of SocialHumanistic Sciences, 2017, pp. 7
- [174] Chester Chun Seng Kam “Why do we still have an impoverished understanding of the item wording effect? An empirical examination” In Sociological Methods & Research 47.3 Sage Publications Sage CA: Los Angeles, CA, 2018, pp. 574–597
- [175] Chester Chun Seng Kam and Shu Fai Cheung “A constrained factor mixture model for detecting careless responses that is simple to implement” In Organizational Research Methods SAGE Publications Sage CA: Los Angeles, CA, 2023, pp. 10944281231195298
- [176] Jinho Kim and Mark Wilson “Polytomous item explanatory IRT models with random item effects: Concepts and an application” In Measurement 151 Elsevier, 2020, pp. 107062
- [177] Young-Suk Grace Kim and Yaacov Petscher “Influences of individual, text, and assessment factors on text/discourse comprehension in oral language (listening comprehension)” In Annals of Dyslexia 71.2 Springer, 2021, pp. 218–237
- [178] Neal M Kingston and Neil J Dorans “The effect of the position of an item within a test on item responding behavior: An analysis based on item response theory” In ETS Research Report Series 1982.1 Wiley Online Library, 1982, pp. i–26
- [179] Neal M Kingston and Neil J Dorans “Item location effects and their implications for IRT equating and adaptive testing” In Applied Psychological Measurement 8.2 Sage Publications Sage CA: Thousand Oaks, CA, 1984, pp. 147–154
- [180] Rinke H Klein Entink, Jörg-Tobias Kuhn, Lutz F Hornke and Jean-Paul Fox “Evaluating cognitive theory: A joint modeling approach using responses and response times.” In Psychological Methods 14.1, 2009, pp. 54 DOI: 10.1037/a0014877
- [181] Christoph Koenig, Benjamin Becker and Esther Ulitzsch “Bayesian hierarchical response time modelling—A tutorial” In British Journal of Mathematical and Statistical Psychology 76.3, 2023, pp. 623–645 DOI: 10.1111/bmsp.12302
- [182] Peter J LaFreniere and Jean E Dumas “Social competence and behavior evaluation in children ages 3 to 6 years: the short form (SCBE-30).” In Psychological Assessment 8.4 American Psychological Association, 1996, pp. 369
- [183] Jing Lu, Chun Wang and Ningzhong Shi “A mixture response time process model for aberrant behaviors and item nonresponses” In Multivariate Behavioral Research 58.1 Taylor & Francis, 2023, pp. 71–89
- [184] Geofferey N Masters “Item discrimination: When more is worse” In Journal of Educational Measurement 25.1 Wiley Online Library, 1988, pp. 15–29
- [185] Paul A McDermott, Nanette M Leigh and Marlo A Perry “Development and validation of the preschool learning behaviors scale” In Psychology in the Schools 39.4 Wiley Online Library, 2002, pp. 353–365
- [186] Hanyi Min, Michael Zickar and Georgi Yankov “Understanding item parameters in personality scales: An explanatory item response modeling approach” In Personality and Individual Differences 128 Elsevier, 2018, pp. 1–6
- [187] Eiji Muraki “Fitting a polytomous item response model to Likert-type data” In Applied Psychological Measurement 14.1 Sage Publications Sage CA: Thousand Oaks, CA, 1990, pp. 59–71
- [188] Bengt Muthén and Tihomir Asparouhov “Recent methods for the study of measurement invariance with many groups: Alignment and random effects” In Sociological Methods & Research 47.4 Sage Publications Sage CA: Los Angeles, CA, 2018, pp. 637–664
- [189] Bengt Muthén and Linda Muthén “Mplus: A general latent variable modeling program” In Muthén & Muthén, 2019
- [190] Gabriel Nagy et al. “Item position effects in a reading comprehension test: An IRT study of individual differences and individual correlates” In Psychological Test and Assessment Modeling 60.2 PABST Science Publishers, 2018, pp. 165–187
- [191] Gabriel Nagy and Esther Ulitzsch “A multilevel mixture IRT framework for modeling response times as predictors or indicators of response engagement in IRT models” In Educational and Psychological Measurement 82.5 Sage Publications Sage CA: Los Angeles, CA, 2022, pp. 845–879
- [192] Pankaja Narayanon and Hariharan Swaminathan “Identification of items that show nonuniform DIF” In Applied Psychological Measurement 20.3 Sage Publications Sage CA: Thousand Oaks, CA, 1996, pp. 257–274
- [193] Irina Pandarova et al. “Predicting the difficulty of exercise items for dynamic difficulty adaptation in adaptive language tutoring” In International Journal of Artificial Intelligence in Education 29 Springer, 2019, pp. 342–367
- [194] Yaacov Petscher, Donald L Compton, Laura Steacy and Hannah Kinnon “Past perspectives and new opportunities for the explanatory item response model” In Annals of Dyslexia 70.2 Springer, 2020, pp. 160–179
- [195] Sophia Rabe-Hesketh, Anders Skrondal and Andrew Pickles “Maximum likelihood estimation of generalized linear models with covariate measurement error” In The Stata Journal 3.4 SAGE Publications Sage CA: Los Angeles, CA, 2003, pp. 386–411
- [196] Jennifer Randall, Yuk Fai Cheong and George Engelhard Jr “Using explanatory item response theory modeling to investigate context effects of differential item functioning for students with disabilities” In Educational and Psychological Measurement 71.1 SAGE Publications Sage CA: Los Angeles, CA, 2011, pp. 129–147
- [197] Bryce B Reeve et al. “Psychometric evaluation of the PROMIS® fatigue measure in an ethnically and racially diverse population-based sample of cancer patients” In Psychological Test and Assessment Modeling 58.1 PABST Science Publishers, 2016, pp. 119
- [198] Frank Rijmen, Paul De Boeck and KU Leuven “The random weights linear logistic test model” In Applied Psychological Measurement 26.3 Sage Publications Sage CA: Thousand Oaks, CA, 2002, pp. 271–285
- [199] Frank Rijmen, Francis Tuerlinckx, Paul De Boeck and Peter Kuppens “A nonlinear mixed model framework for item response theory” In Psychological Methods 8.2 American Psychological Association, 2003, pp. 185
- [200] Brian Ripley et al. “Package ‘mass”’ In Cran r 538, 2013, pp. 113–120
- [201] Nicholas J Rockwood and Minjeong Jeon “Estimating complex measurement and growth models using the R package PLmixed” In Multivariate Behavioral Research 54.2 Taylor & Francis, 2019, pp. 288–306
- [202] Yves Rosseel “lavaan: An R package for structural equation modeling” In Journal of statistical software 48, 2012, pp. 1–36
- [203] Bonnie R Rush, David C Rankin and Brad J White “The impact of item-writing flaws and item complexity on examination item difficulty and discrimination value” In BMC medical education 16 Springer, 2016, pp. 1–10
- [204] Ulrich Schroeders, Christoph Schmidt and Timo Gnambs “Detecting careless responding in survey data using stochastic gradient boosting” In Educational and psychological measurement 82.1 Sage Publications Sage CA: Los Angeles, CA, 2022, pp. 29–56
- [205] Ann Shields and Dante Cicchetti “Emotion regulation checklist” In Developmental Psychology, 1997
- [206] Katherine A Sliter and Michael J Zickar “An IRT examination of the psychometric functioning of negatively worded personality items” In Educational and Psychological Measurement 74.2 Sage Publications Sage CA: Los Angeles, CA, 2014, pp. 214–226
- [207] Øystein Sørensen “Multilevel semiparametric latent variable modeling in R with “galamm””, 2024
- [208] Luke Stanke and Okan Bulut “Explanatory item response models for polytomous item responses” In International Journal of Assessment Tools in Education 6.2 İzzet Kara, 2019, pp. 259–278
- [209] A Jackson Stenner, William P Fisher Jr, Mark H Stone and Donald S Burdick “Causal Rasch models” In Frontiers in psychology 4 Frontiers Media SA, 2013, pp. 536
- [210] Lubomír Štěpánek, Jana Dlouhá and Patrícia Martinková “Item difficulty prediction using item text features: Comparison of predictive performance across machine-learning algorithms” In Mathematics 11.19 MDPI, 2023, pp. 4104
- [211] Javier Suárez Álvarez et al. “Using reversed items in Likert scales: A questionable practice” In Psicothema 30, 2018
- [212] Changjiang Tang, Borui Yang and Hao Tian “Examination of the wording effect in the new ecological paradigm scale in China: a bi-factor modeling approach” In Current Psychology 43.7 Springer, 2024, pp. 5887–5900
- [213] Francis Tuerlinckx and Paul De Boeck “Two interpretations of the discrimination parameter” In Psychometrika 70 Springer, 2005, pp. 629–650
- [214] Esther Ulitzsch et al. “A response-time-based latent response mixture model for identifying and modeling careless and insufficient effort responding in survey data” In Psychometrika 87.2, 2022, pp. 593–619 DOI: 10.1007/s11336-021-09817-7
- [215] Esther Ulitzsch, Matthias Davier and Steffi Pohl “A hierarchical latent response model for inferences about examinee engagement in terms of guessing and item-level non-response” In British Journal of Mathematical and Statistical Psychology 73, 2020, pp. 83–112 DOI: 10.1111/bmsp.12188
- [216] Esther Ulitzsch, Seyma Nur Yildirim-Erbasli, Guher Gorgun and Okan Bulut “An explanatory mixture IRT model for careless and insufficient effort responding in self-report measures” In British Journal of Mathematical and Statistical Psychology 75.3 Wiley Online Library, 2022, pp. 668–698
- [217] Wim J Van der Linden “Handbook of Item Response Theory: Volume 1: Models” CRC press, 2017
- [218] Amanda Venta et al. “Reverse-coded items do not work in Spanish: Data from four samples using established measures” In Frontiers in Psychology 13 Frontiers Media SA, 2022, pp. 828037
- [219] Yue Wang and Hong Lu “Validating items of different modalities to assess the educational technology competency of pre-service teachers” In Computers & Education 162 Elsevier, 2021, pp. 104081
- [220] Gail H Weems and Anthony J Onwuegbuzie “The impact of midpoint responses and reverse coding on survey data” In Measurement and Evaluation in Counseling and Development 34.3 Taylor & Francis, 2001, pp. 166–176
- [221] Bert Weijters and Hans Baumgartner “Misresponse to reversed and negated items in surveys: A review” In Journal of Marketing Research 49.5 SAGE Publications Sage CA: Los Angeles, CA, 2012, pp. 737–747
- [222] Richard Williams “Generalized ordered logit/partial proportional odds models for ordinal dependent variables” In The stata journal 6.1 SAGE Publications Sage CA: Los Angeles, CA, 2006, pp. 58–82
- [223] Mark Wilson, Paul De Boeck and Claus H Carstensen “Explanatory item response models: A brief introduction” In Assessment of Competencies in Educational Contexts, 2008, pp. 91–120
- [224] Richard Dean Yentes “In search of best practices for the identification and removal of careless responders” North Carolina State University, 2020
- [225] Hongyun Liu Yue Liu and Xiaofeng You “The Impact of Non-Effortful Responding on Item and Person Parameters in Item-Pool Scaling Linking” In Applied Measurement in Education Routledge, 2024 DOI: 10.1080/08957347.2024.2345598
- [226] Samuel Zorowitz, Gabriele Chierchia, Sarah-Jayne Blakemore and Nathaniel D Daw “An item response theory analysis of the Matrix Reasoning Item Bank (MaRs-IB)” In Behavior Research Methods 56.3 Springer, 2024, pp. 1104–1122
Appendix
A Sample brms code
The code below shows how to fit our basic ordinal model and some simple extensions in brms, where resp is a positive integer representing the item response, neg is an indicator variable for whether the item is negatively framed, id is a person identifier, and item is an item identifier. disc is a convenience parameter in brms that allows for easy specification of a model for item discrimination. The |i| syntax allows for a correlation between the location and discrimination random effects. Note that for the priors on standard deviation parameters, normal indicates a half-normal distribution. See [130] for a full tutorial on fitting IRT models with brms, including dichotomous 1PL, 2PL, and 3PL models and their ordinal extensions.
# declare model
mod <- bf(
  resp ~ 1 + neg + (1|id) + (1|i|item),
  disc ~ 1 + neg + (1|i|item)
)

# set weakly informative priors
prior <-
  prior("normal(0, 3)", class = "sd", group = "item") +
  prior("constant(1)", class = "sd", group = "id") +
  prior("normal(0, .5)", class = "sd", group = "item", dpar = "disc")

# fit model
fit <- brm(
   formula = mod,
   data = dataset_name,
   family = brmsfamily("cumulative", "logit"),
   prior = prior,
   chains = 4,
   iter = 2000,
   cores = 4,
   refresh = 10
   )

# code to fit fixed thresholds and random discriminations
mod <- bf(
  resp | thres(gr = item) ~ 1 + (1|id),
  disc ~ 1 + neg + (1|item)
)

# person predictor Xj can be included in the equation
# for the response, to represent differences in theta
# or in the discrimination, to represent non-uniform DIF:
# (assuming no location shift beyond the average effect on theta)
mod <- bf(
  resp ~ 1 + neg + Xj + (1|id) + (1|i|item),
  disc ~ 1 + neg + Xj + (1|i|item)
)

# we can allow for both location and discrimination shifts
# for all items as follows:
mod <- bf(
  resp ~ 1 + neg + Xj + (1|id) + (Xj|i|item),
  disc ~ 1 + neg + Xj + (Xj|i|item)
)

# random slopes can be included in the random effects terms
# for example, to allow differences in agreeability by framing
# to vary by person:
mod <- bf(
  resp ~ 1 + neg + (neg|id) + (1|i|item),
  disc ~ 1 + neg + (1|i|item)
)

# code to fit a dichotomous 2PL model
# here, we declare the discrimination explicitly
# rather than use the disc parameter
# and resp is a 0/1 variable
mod <- bf(
  resp ~ exp(logalpha)*eta,
  eta ~ 1 + neg + (1|id) + (1|i|item),
  logalpha ~ 1 + neg + (1|i|item),
  nl = TRUE
)

# when fitting the model, the argument below uses
# standard dichotomous logit rather than cumulative logit
family = brmsfamily("bernoulli", "logit")
B Directed Acyclic Graph of Equation 11
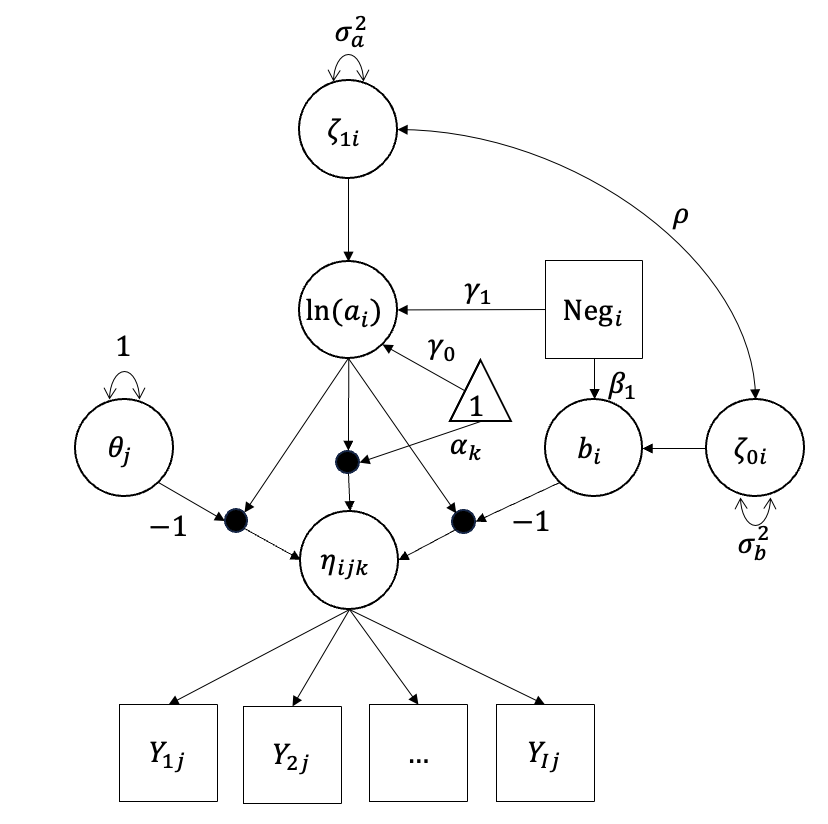
Notes: Squares indicate observed variables, hollow circles indicate latent variables, and black circles indicate cross-product terms. are item responses, is the total number of items, and is the indicator for a negatively-framed item. Path coefficients are fixed at 1 unless otherwise indicated. The terms represent residual variances.
C Replication of Descriptive Analyses on Followup Survey Data
The graphs below replicate the descriptive analyses on the followup survey data in a sample of 470 children. The results are quite consistent across time points.
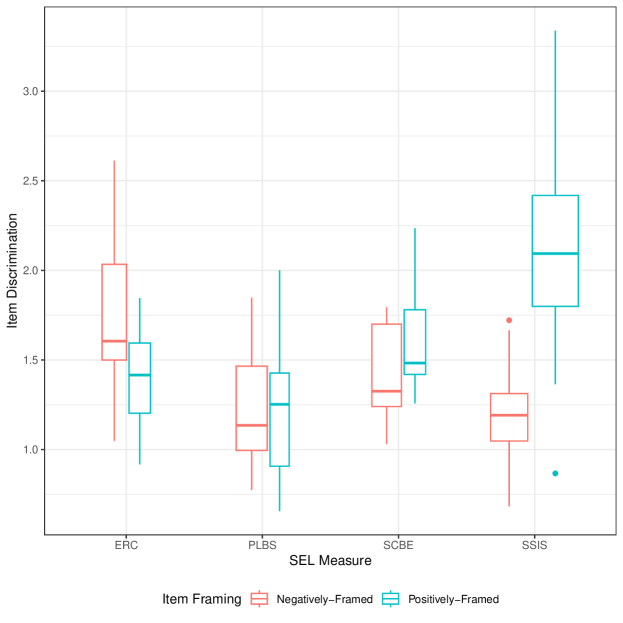
Notes: ERC = emotion regulation checklist; PLBS = preschool learning behavior scale; SCBE = social competence and behavior evaluation; SSIS = social skills improvement system. The width of each box is proportional to the number of items.
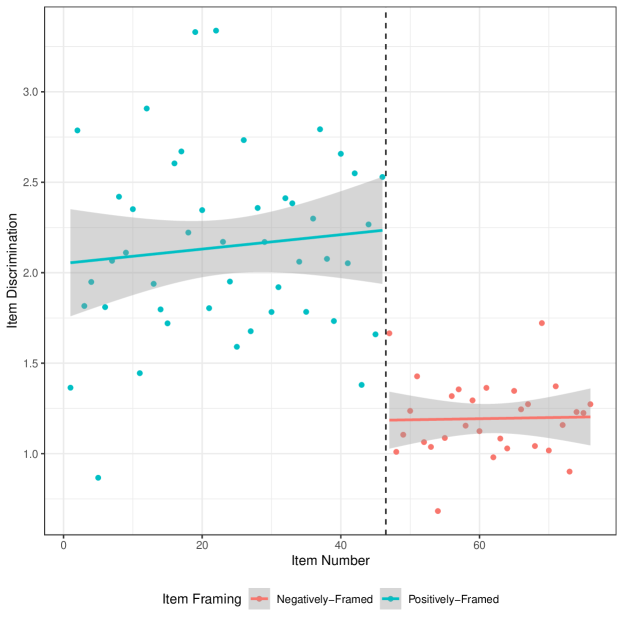
Notes: SSIS = social skills improvement system.
D Readability Scatter Plot
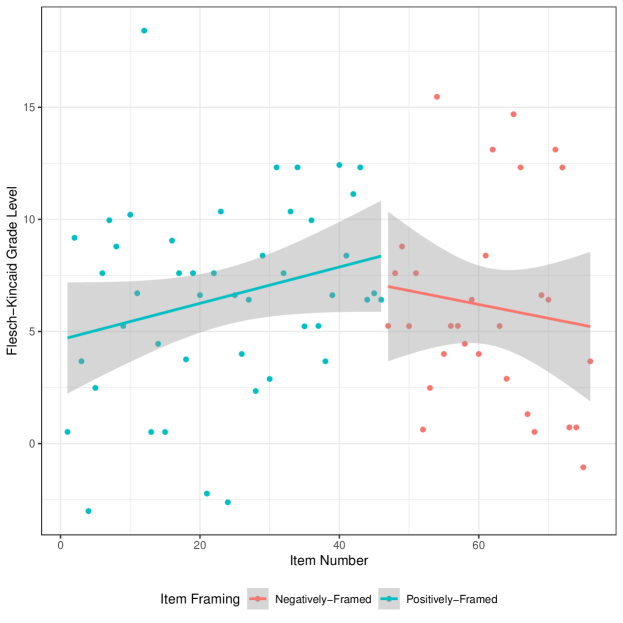
Notes: SSIS = social skills improvement system. Lower values indicate simpler text.