A thermo-hygro computational model to determine the factors dictating cold joint formation in 3D printed concrete
Abstract
Cold joints in extruded concrete structures form once the exposed surface of a deposited filament dries prematurely and gets sequentially covered by a layer of fresh concrete. This creates a material heterogeneity which lowers the structural durability and shortens the designed service life. Many factors concurrently affect cold joint formation, yet a suitable tool for their categorization is missing. Here, we present a computational model that simulates the drying kinetics at the exposed structural surface, accounting for cement hydration and the resulting microstructural development. The model provides a time estimate for cold joint formation as a result. It allows us to assess the drying severity for a given structure’s geometry, its interaction with the environment, and ambient conditions. We evaluate the assessed factors and provide generalized recommendations for cold joint mitigation.
Keywords
3D printed concrete; Additive manufacturing; Cold joint; Hydration modeling; Multiphysics modeling
1 Introduction
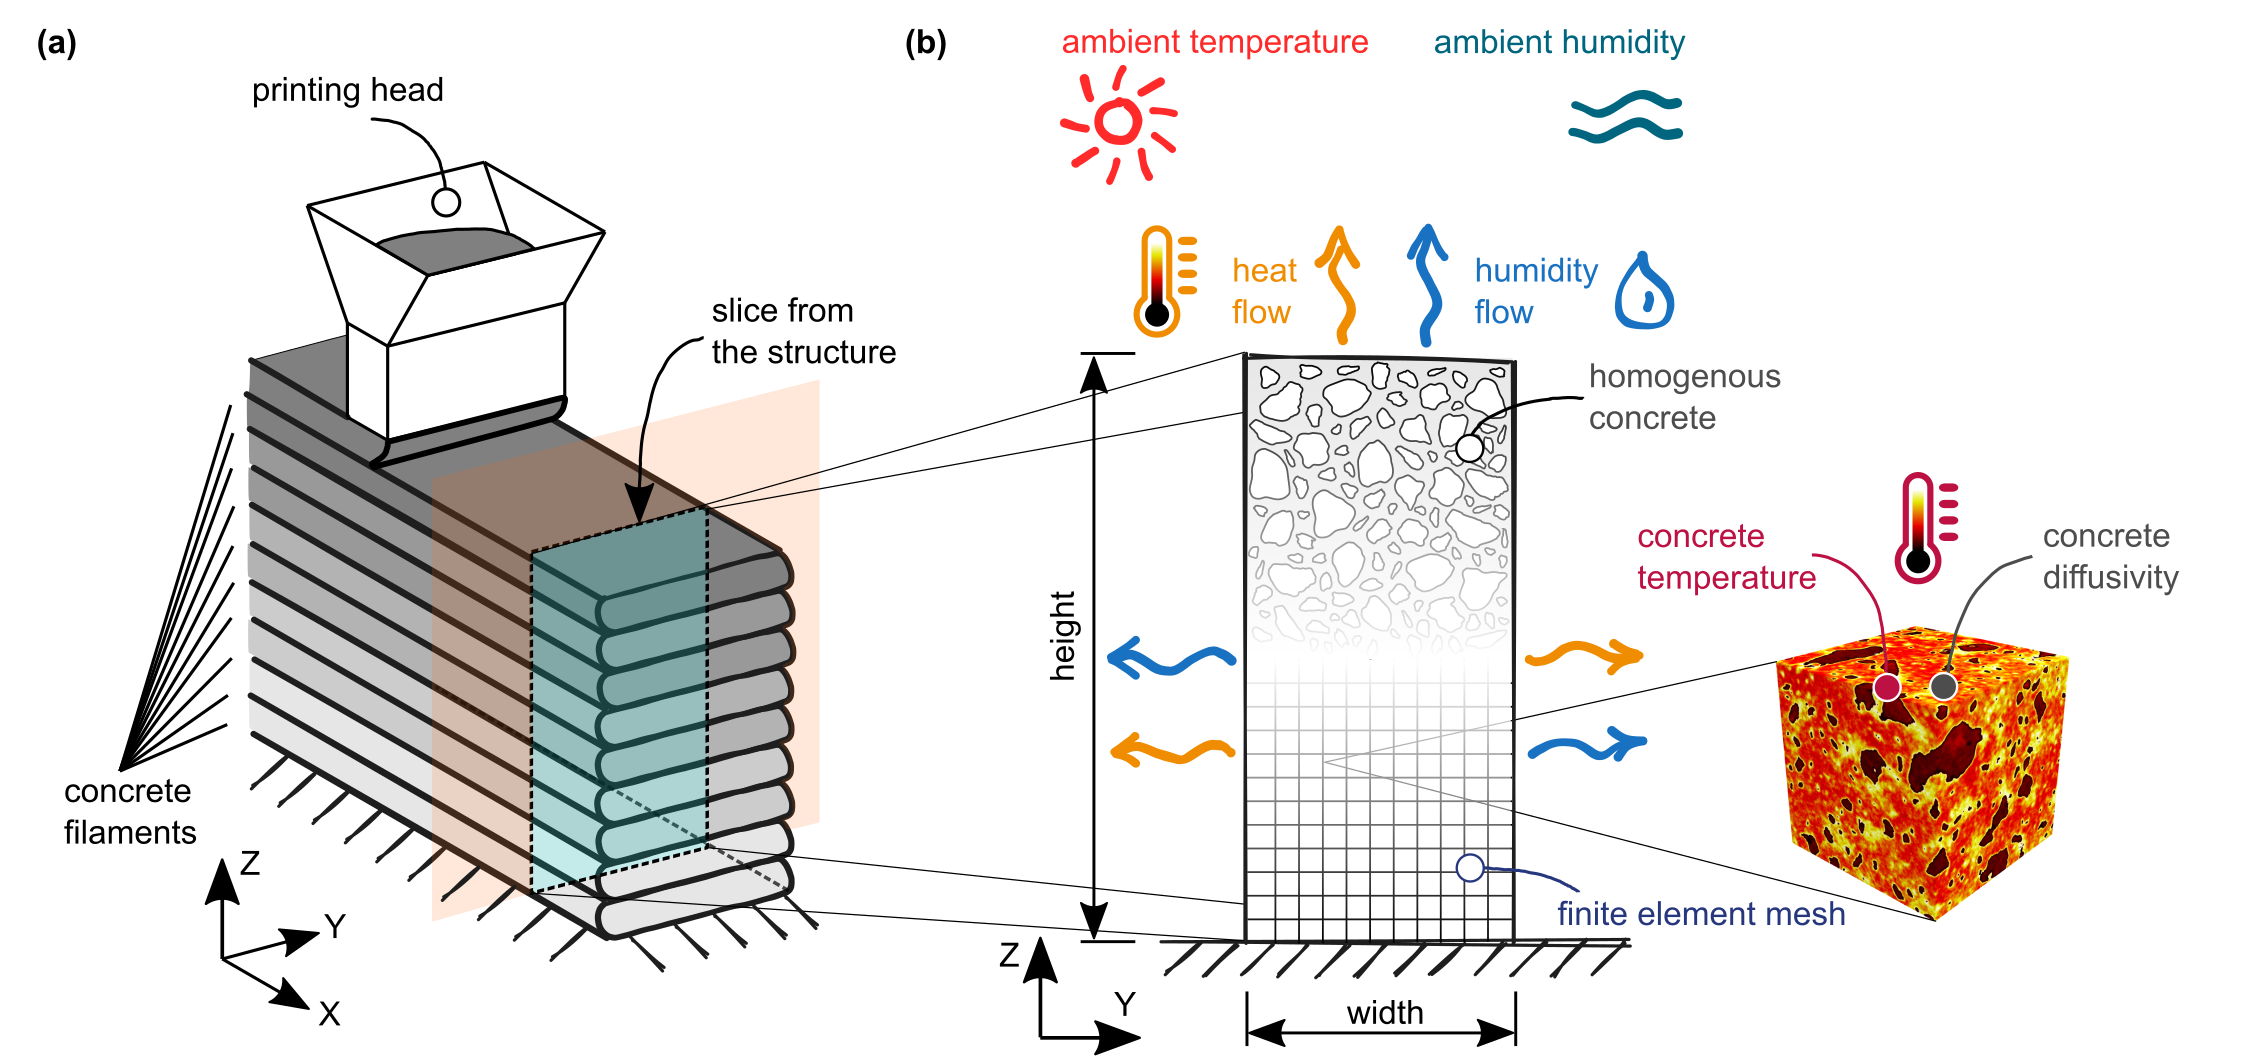
The adoption of extrusion-based additive manufacturing opened new possibilities for producing concrete structures. This technology draws from the synergy between computer-aided design, robotics, and material usage optimization [1, 2, 3]. Utilizing additive manufacturing, structural elements are produced by successively stacking thin layers, or filaments, of rapidly reacting concrete, which are extruded from a robotically-controlled printing head [4], see Figure 1(a). This technique facilitates the production of shape-optimized elements with complex structural geometries [5, 6, 7], avoiding traditional formwork. However, successfully implementing this technology into common practice faces several challenges, both on the structural and material design fronts [8, 9].
The material prerequisites for printable concrete call for designing an initially fluid and pumpable mixture that rapidly hardens upon deposition, developing both stiffness and strength. This ensures the structural stability of the thin-walled extruded structure and sufficient load-bearing capacity to withstand the dead weight of the successively added layers. However, while rapid strength development of the concrete mix is necessary for 3D printing, it may also negatively affect the bond between two neighboring filaments [10, 11, 12].
After the extruded filament is deposited, its exposed surface dries, forming a solid crust over time [13]. Unless the top filament surface is promptly covered with new concrete, the crust thickens and results in a porous region that weakens the interface between the already dry filament and the sequentially added and fully water-saturated filament [14]. The presence of this inhomogeneity in the stack of extruded filaments leads to an internal structural defect, commonly denoted as a “cold joint” which compromises the long-term durability of the extruded structural element [15, 16, 17, 18].
The origins of crust formation are related to material drying, which inherently arises from two sources. Water is consumed internally by cement hydration but also evaporates through the unprotected structural surface [19], see Figure 1(b). As the microstructure develops, the smallest pores will be emptied first, leaving voids in the material, which results in self-desiccation. In addition, cement contact with water triggers a series of spontaneous and highly exothermic reactions, liberating over 500 J as heat per gram of cement over the whole reaction [20], as schematically shown in Figure 1(c). The released thermal energy leads to a progressive temperature increase within the concrete structure [21]. Since the cement paste matrix exhibits rather low thermal conductivity, a high-temperature gradient forms between the heating structural core and the exposed outer surface of the concrete filament, accelerating water transport through the pore network. While all unprotected sides of the extruded structure facilitate water evaporation, the drying of the top surface of the uppermost filament is critical, creating a potential risk for cold joint formation.
Cold joint formation challenges the durability of extruded concrete structures. Hence, understanding their formation and subsequent mitigation is of great interest. As shown by Mechtcherine et al. [19], multiple input factors influence cold joint formation. While their experimental quantification is challenging, computational models provide a feasible alternative to studying their magnitude. Several multiphysics models have been developed, focusing on predicting the temperature increase in massive concrete structures [22, 23, 24] and simulating early-age cracking [25, 26]. However, predictive models focusing on drying kinetics of hydrating concrete for extruded structures, which lie at the core of the cold joint formation, are yet missing.
Here, we formulate a computational model to investigate the factors that lead to cold joint formation in extruded concrete structures. The model is based on solving a coupled thermo-hydro conduction phenomenon over a planar domain, representing a full cross-section of an extruded structure, see Figure 1(b). The proposed approach captures the kinetics of cold joint formation, accounting for concrete composition, structural dimensions, and interaction with the ambient environment. We analyze the effect of different factors quantitatively, allowing us to determine the most important ones for cold joint formation, which aids with the material design in practice.
2 Model formulation
Origins of cold joint formation point to premature surface drying of hydrating concrete. This physical phenomenon can be mathematically described by a set of differential equations, formulated here as a coupled thermo-hydro transport problem (the theoretical derivation can be found in Appendix A). The governing equations take the form of
| (1a) | ||||
| (1b) | ||||
where denotes the degree of cement hydration, described in Section 2.1, and , and the concrete temperature and relative humidity, respectively. All three unknown quantities then act as field variables. In Eq. (1a), , , and denote the heat conductivity, mass density, and heat capacity of concrete, respectively, and the rate of hydration heat released, see Section 2.1. In Eq. (1b), represents the diffusivity coefficient and the hygrothermic coefficient ensuring a weak coupling between temperature and humidity, see Appendix A.2. The sink term accounts for the self-desiccation of the material due to hydration.
While Eq. (1) describe a general transient heat and humidity conduction over a domain and thus form a backbone of the computational model, we will now introduce three aspects to focus its broad applicability to early-age hydrating concrete. In particular, we focus on i) the rate of hydration heat, which acts as an internal heat source in the concrete structure, followed by ii) the description of an analytical model to characterize microstructural development, and finally arriving at iii) the description of thermophysical properties of concrete and their link to microstructural evolution.
2.1 Internal heat source from cement hydration
Upon contact with water, cement particles undergo hydration reactions resulting in a measurable heat release. Isothermal calorimetry permits continuous measurements of the cumulative heat of hydration in [J/kg] released for a given time [s]. Heat production depends on ambient temperature [∘C] and relative humidity [-] history, and can be expressed as
| (2) |
where [-] denotes the achieved state of microstructural development, described here as the degree of cement hydration, and in [J/kg] denotes the latent hydration heat of cement. The latter is unique for each cement as it depends on its mineralogical composition. It can, however, be estimated as a weighted average of enthalpies of the main clinker constituents at complete hydration [27, p. 232].
Focusing on the rate of hydration heat originating from cement dissolution in [J/(s m3)], we find
| (3) |
where the rate of microstructural development
| (4) |
is described by in [s-1], the chemical affinity, and is defined as the change of microstructural development in time. This term was introduced by Ulm and Coussy [28] and conjugates the gradient of free enthalpy between the reactants and products of the chemical reactions occurring during hydration [29, 30]. Consequently, is a time-, temperature-, and humidity-dependent quantity. The time specification will be replaced by in , recalling that defines the resultant state of the microstructural evolution, regardless of when and under which conditions it was achieved.
The rate of hydration heat defined by Eq. (3) physically represents an internal heat source within the concrete structure. This term, therefore, appears in the governing equation for transient heat conduction, see Eq. (1a). Eq. (4) describing microstructural development serves as the final governing equation, together with Eq. (1).
2.2 Affinity-based hydration model
Experimental determination of the hydration heat rate for a given cement type, mixture composition, and variable temperature requires repeated measurements, which are time-intensive and, hence, impractical for modeling purposes. In addition, fluctuations in curing temperature and/or ambient humidity affect the reaction kinetics of cement hydration. To account for both phenomena separately, we use dimensionless correction factors and [30]. These will be used to scale the cement hydration kinetics from a reference state defined by as follows
| (5) |
Both scaling factors are discussed separately below.
For a computational implementation, we consider a phenomenological affinity-based hydration model that provides an analytical relationship between microstructural development in a hydrating paste and concurrent hydration heat. This model was initially formulated by Cervera et al. [29] and later modified by Jendele et al. [31]. We adopt the latter formulation, which defines as
| (6) |
where needs to be determined at a reference temperature, in [s-1], [-] and [-] are best-fit parameters characterizing the kinetics of cement hydration and represents the maximum-reachable degree of hydration of the cement paste. The initial three parameters need to be first calibrated for the specific cement. In this paper, we use isothermal calorimetry measurements for calibration, but if such results are not available, suitable hydration models can be used instead (e.g., CEMHYD3D [32, 20]). The term then depends on the fresh mix design and curing conditions [33], see Appendix B for details.
As cement hydration is a thermally activated process, an Arrhenius-type equation can be used to correct for temperature fluctuation in Eq. (5). Consequently, we consider the coefficient [-] as
| (7) |
where K represents the reference ambient temperature for which is determined, J/(mol K) is the universal gas constant, and kJ/mol is the apparent activation energy based on measurements from Kada-Benameur et al. [34]. The latter quantity is a mixture- and temperature-dependent parameter that characterizes the binder’s integrated and simultaneous chemical reactions.
Cement hydration encompasses a series of chemical processes, all requiring a constant supply of liquid water from the capillary pore network. This facilitates the transport of ionic species and the subsequent formation of reaction products. However, the rate of hydration progressively decreases with the dropping of pore relative humidity and eventually stops upon reaching [35]. As a remedy, we recall the coefficient [-] coined in [36] into Eq. (5), which accounts for the reduction of hydration rate for decreasing the capillary humidity as
| (8) |
where [-] is a material parameter introduced in [36].
2.3 Thermophysical properties of concrete constituents
The parameters , , and postulated in Eq. (1) characterize the physical and thermal properties of concrete. For the development of the model, we consider as constant, unaffected by ongoing hydration or water evaporation from the exposed structural surface. However, and evolve in time, reflecting the temperature- and humidity-dependent microstructural development.
The specific heat capacity of a material, , is defined as the amount of heat necessary to change the temperature of the material by one degree, normalized per mass of the material. An expression for the heat capacity of hydrating cement paste, , should account for the initial paste composition given by the water-to-cement mass ratio , ongoing microstructural development, and curing conditions [37]. We here consider
| (9) |
where J/(g K) and J/(g K) stand for the heat capacities of water [38] and anhydrous cement [39] measured at room temperature, respectively.
The heat capacity of concrete, , analogously depends on the properties of both cement paste and aggregates and can be estimated [37] using a simple rule of mixtures as
| (10) |
where stands for a mass fraction of the given phase, and J/(g K) [40].
The heat conductivity is defined as the ratio of heat flux to the temperature gradient [41]. For cement paste, W/(m K) remains virtually unchanged throughout hydration regardless of the mix composition and curing conditions. This has been experimentally verified in [37, 42] and computationally corroborated in [43, 44]. A virtually constant W/(m K) can be anticipated based on a comparison of heat conductivities of constituting solid phases in the paste and their envisioned relative proportions throughout hydration ( [37], , (both from [43]), W/(m K) [37]). While a minor decrease of with ratio was observed in [45], the differences may be deemed practically negligible for the considered range of [-].
The initial concrete conductivity is largely governed by the relative proportions of aggregates and paste in the mixture. Bentz [37] proposed an estimate to evaluate the initial of fresh concrete using a Hashin-Shtrikman homogenization scheme, with as an arithmetic mean from the upper and lower bounds given as
| (11) | |||||
| (12) | |||||
| (13) |
where and denote the heat conductivity and volume fraction of a given component (paste or aggregates); here, we consider W/(m K) [46]. Note that Eq. (13) assumes that , which is valid for most siliceous and calcitic aggregates but excludes lightweight aggregates.
Experimental measurements by Chen et al. [47] indicate that concrete heat conductivity further evolves with ongoing cement hydration and is strongly affected by curing conditions. Based on their experimental results, we consider the evolution of under sealed conditions as
| (14) |
Note that while the experimentally measured concrete conductivity increases under sealed conditions in time, the opposite trend was observed for saturated conditions. Chen et al. [47] attribute this observation to the differences in the microstructural development during hydration, particularly in the presence of water within the overall pore network, from capillary pores to the interfacial transition zone around aggregates. During sealed curing, the material experiences self-desiccation as capillary pores are progressively emptied. As the solid phase fraction increases, the moisture content decreases, so the overall conductivity of the material becomes proportional to the conductivity of the solid skeleton matrix. In comparison, water remains omnipresent within the pore network during the saturated curing, thus effectively lowering the overall conductivity. However, the only former curing regime applies in realistic conditions for extruded concrete structures.
3 Numerical implementation
Surface drying of hydrating concrete can be described by a set of governing Equations given by Eq. (1) and (4). To find an approximate solution, we employ the Finite Element Method implemented in the open-source FEniCS package [48]. First, we spatially discretize a rectangular domain representing a 2D slice of the extruded concrete structure. To this end, we consider a full structural cross-section, grouping individual filaments into a materially homogeneous domain as shown in Figure 1(b). Next, we resolve the coupled transient conduction phenomena over the entire domain by discretizing the time derivatives using a finite difference approximation with a backward difference quotient, yielding an implicit Euler method. We solve for the sought , , and fields, which act as field variables.
Solving the set of governing equations given in Eq. (1) and (4) requires suitable initial and boundary conditions, reflecting the interaction of the extruded structure with the surrounding environment. The initial condition (IC) denotes the starting value of the degree of hydration, temperature, and humidity fields, assumed herein as [-], ∘C , and [-] over the entire domain. We model the heat exchange between the structural surface and its environment with Robin’s boundary condition (BC) as , where the heat transfer coefficient in [W/(m2 K)], the surface temperature of the material, and ∘C is the remote (ambient) temperature. An analogous form of Robin BC is also used for humidity transport with with as the hygric exchange coefficient in [m/s], the surface humidity of the material, and [–] as the remote (ambient) humidity. The listed values represent the default settings used for model evaluation and are applied unless noted otherwise.
4 Model verification
4.1 Calibration of the affinity-based hydration model
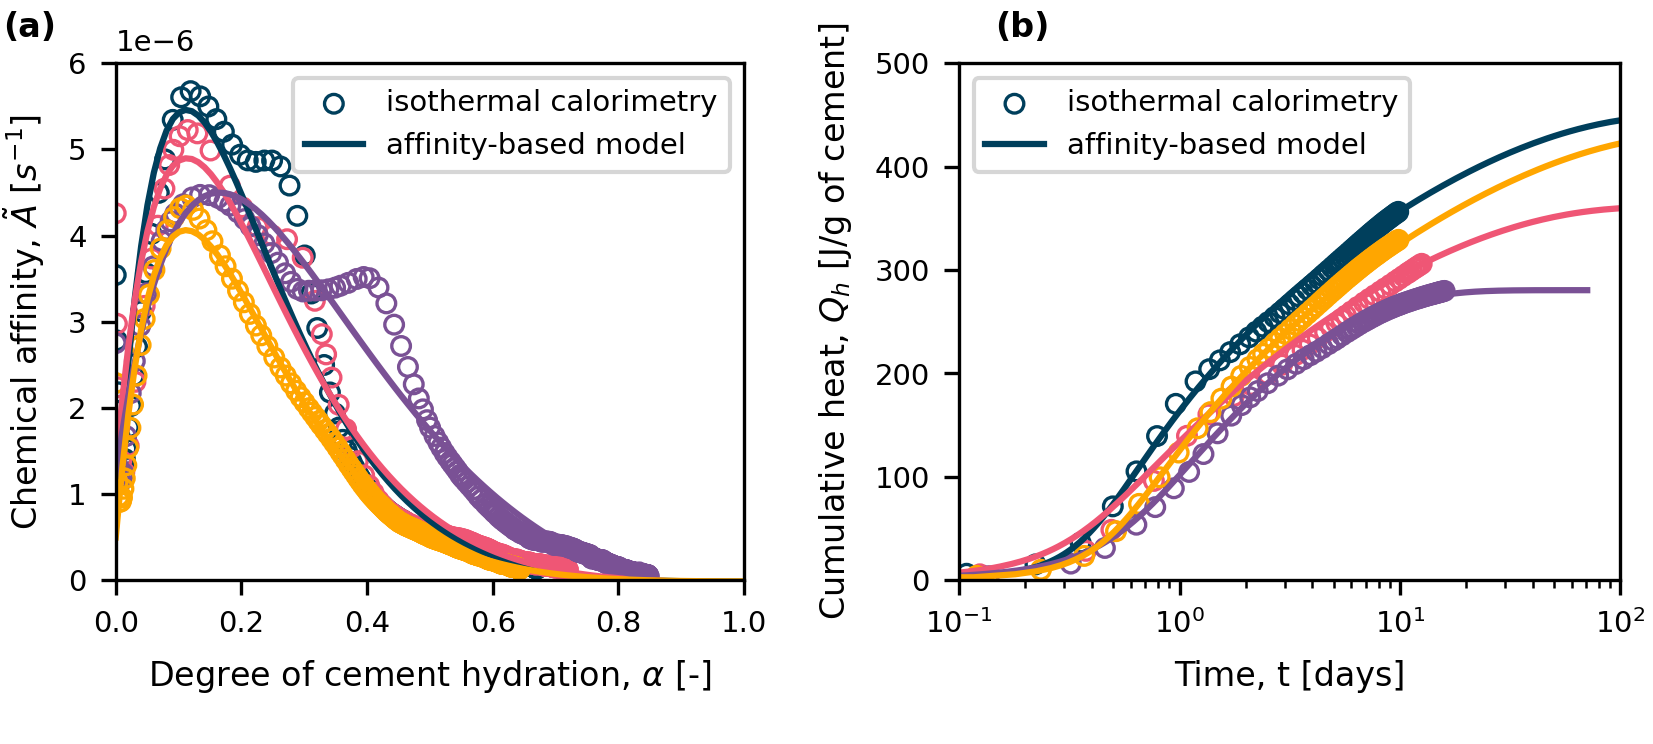
Here, we demonstrate the affinity-based model’s descriptive capability for assessing the hydration kinetics of various cement pastes. To this end, we consider experimental results [20] from isothermal calorimetry tests of pastes, which differ in cement type and ratio used. Notably, all considered pastes were free from chemical admixtures that could alter the hydration kinetics. We plot the experimental results, interpreted by as a function of the achieved microstructural development , and fit the analytical form from Eq. (6) using a damped least-squares algorithm. This method provides the sought set of parameters , , and , summarized in Appendix B, which are independent for each paste tested and characterize their hydration kinetics.
The affinity-based hydration model captures the main hydration peak and subsequent decrease of reaction kinetics with acceptable accuracy, as shown in Figure 2(a). We then use Eq. (2) to calculate the time-evolution of cumulative heat for each paste and compare the calculated results to experiments in Figure 2(b). The analytical model shows a satisfactory agreement with the measured data regardless of the cement paste composition. Thus, it provides an analytical link between microstructural formation and corresponding heat release. This achievement enables us to evaluate the temperature increase in concrete structures caused by cement hydration, as discussed next.
4.2 Temperature increase in hardening concrete
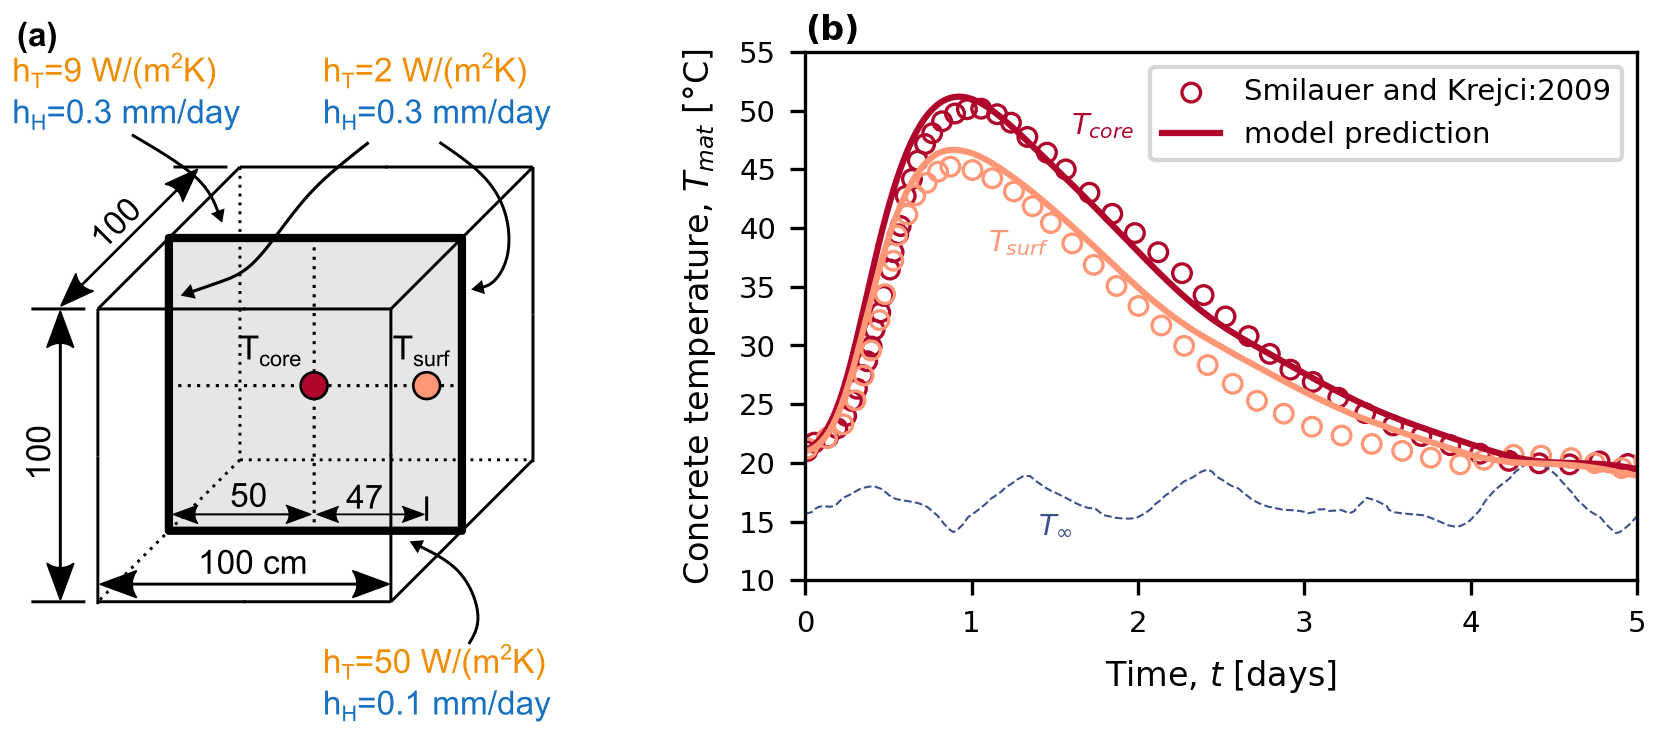
We analyze the effect of hydration heat on the temperature increase within a massive concrete block, as recorded by Šmilauer and Krejčí [23]. In this experiment, a cubic block with a side length of 1 m was cast from self-compacting concrete and kept in a protective shelter, shielding it from direct sun radiation and rain. Monitoring gauges were embedded into the block, recording the temperature evolution at the core and 3 cm from its outer surface, as well as ambient temperature, see Figure 3(a). The block was separated from a solid concrete foundation by a 2 mm thick impregnated paper. A 15-mm-thick plywood formwork protected its sides, whereas the top surface was exposed to the ambient environment.
We simulate the experiment as a coupled temperature and humidity problem within a 2D cross-section, representing a central slice of the specimen as shown in Figure 3(a). We considered the kinetics of a generic cement with a common mineralogical composition, see Appendix C, since the reported data in [23] lacked the necessary inputs for precise calibration of the hydration model. We prescribe a variable heat and humidity flow to each block boundary, as shown in Figure 3(a), to account for the fluctuating but suppose [-] since it was not reported.
Computed results show a satisfying prediction of temperature evolution, correctly capturing the main peak, as well as an acceptable cooling regime, see Figure 3(b). The discrepancy in surface temperature observed after 2 days from casting can probably be attributed to the removal of formwork, which would affect the chosen value of the prescribed transfer coefficients. However, such an event was not explicitly documented in [23], and therefore, we kept and constant throughout the simulation. Nonetheless, we consider the simulation results satisfactory and emphasize the correctly calculated peak temperature and initial cooling stage.
We note that the computed results were based solely on empirical knowledge of the specimen (geometry, material composition) and its interaction with the environment (surface treatment and ambient temperature). We chose the values for the transfer coefficients ( and ) and ambient humidity in line with common considerations for modeling transport phenomena in concrete in a protected environment [21, 26, 23, 49]. While a mathematical optimization of the used values could provide an even closer agreement with the measured data, such analysis is beyond the scope of this paper.
4.3 Drying of concrete elements
We verify the suitability of the presented model for predicting concrete drying by analyzing experimental measurements carried out by Vinker and Vítek [50, 51]. Their data contains measured short-term self-desiccation of a standardized concrete cube over 2 months and long-term relative humidity measurements in a massive concrete element over 3 years. We will use our model to simulate the humidity evolution in each specimen separately to account for the differences in specimen size, curing regime, and at different depths from the specimen surface and compare with the experimental data.
The first specimen assessed was a standardized concrete cube with a side of 150 mm that was wrapped in foil and sealed in a protected environment upon demolding. The internal humidity decrease from self-desiccation was recorded at the cube’s core at irregular intervals over two months; see points in Figure 4(a). To model this experiment, we considered a coupled temperature and humidity simulation over a 2D domain representing the central slice of the cube. We prescribed a constant ambient humidity as to account for the sealed conditions and transport coefficients as shown in Figure 4(a), as well as the cement kinetics parameters summarized in Appendix C.
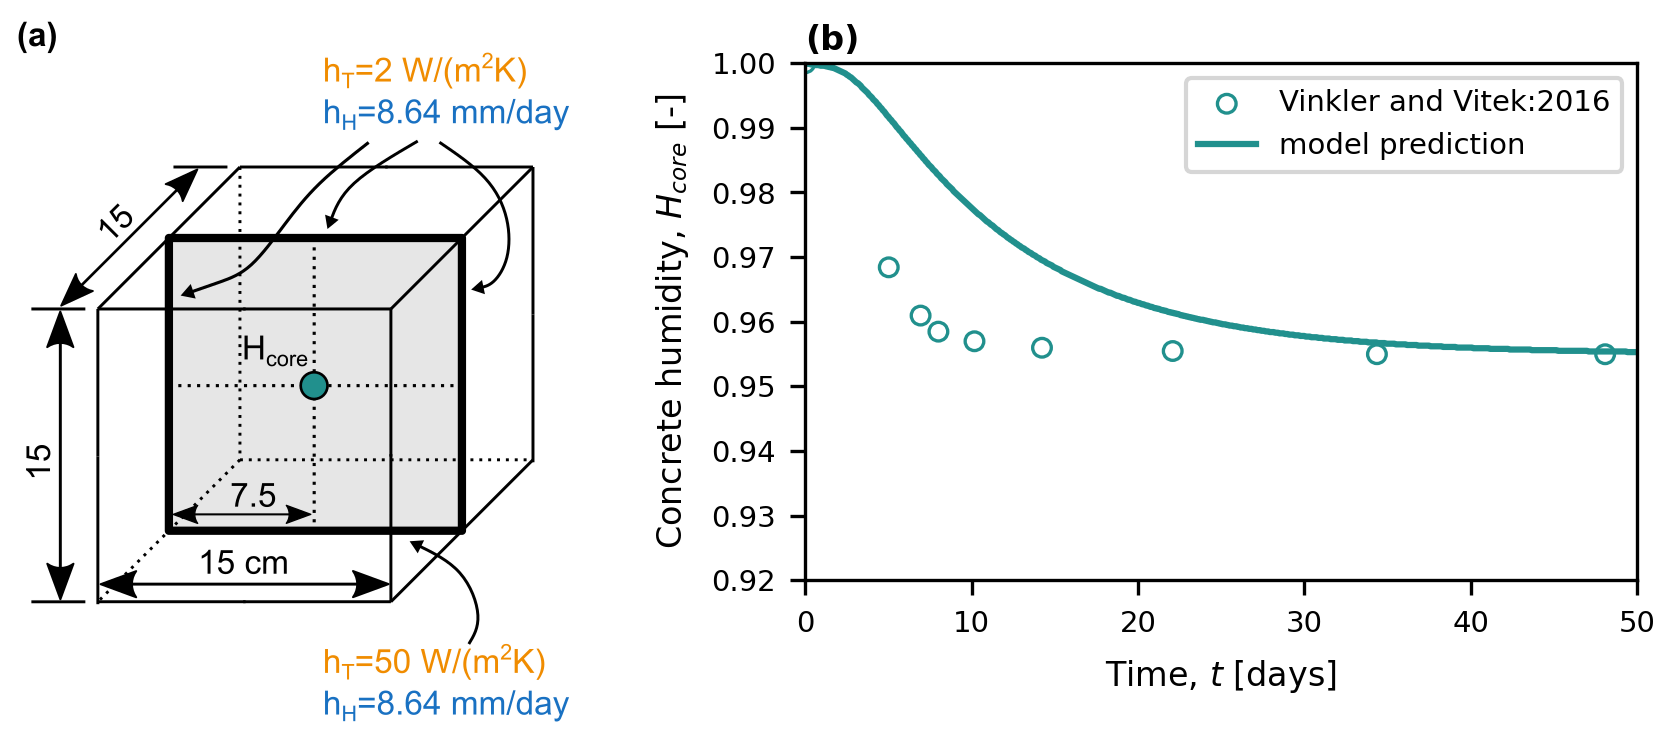
Simulation results capture the drop in internal relative humidity at the cube core with acceptable accuracy for engineering purposes, differing only by single units of % from experiments. We attribute the measured rapid drop in humidity down to [-] during the first week to specimen demolding and subsequent short-term exposure to low ambient humidity before wrapping; refer to early measured values of in Figure 5(b). We will show in Section 6.1 that even a short exposure to dry ambient conditions leads to a rapid acceleration of material drying. Deplorably, the demolding event is not explicitly documented in [50, 51], yet it plays a crucial role in development. As a conclusion, exposure to a sub-saturated ambient environment accelerates the humidity exchange with the environment, leading to material drying.
The second experiment involved continuous humidity measurements within a massive concrete cube with a side length of 800 mm [50, 51]. The material composition was identical to the standardized cube described above, but the element’s surface was kept uncovered and thus exposed to a variable ; see Figure 5(C). Internal humidity measurements were continuously recorded over 800 days at different depths within the specimen. We simulated the experimental setup by considering a 2D planar cross-section representing the central slice of the element. Given the measurement duration of over 800 days, any temperature-induced hydration effects and microstructural development in such material become negligible after the first few weeks. Consequently, we carried out only a transient humidity simulation. To simulate the drying of a mature concrete element, we set the initial material humidity as [-] in line with the self-desiccation measurements of concrete reported above. We then applied a fluctuating as the BC on the top and sides of the model; the rest of the numerical inputs are summarized in Figure 5(a).
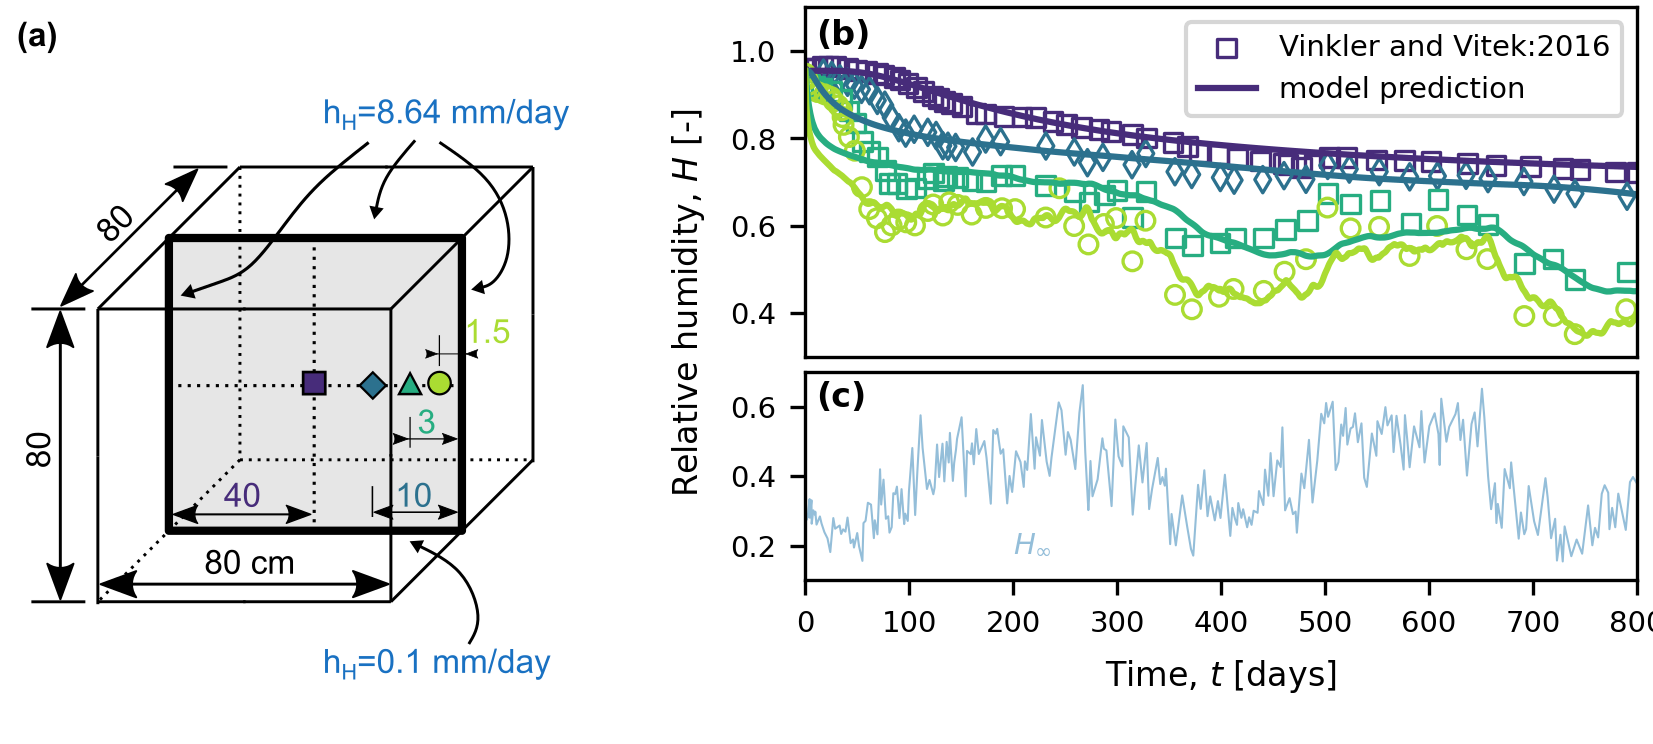
Simulation results shown in Figure 5(b) indicate that the fluctuation of ambient humidity affects the internal humidity within the concrete element. At shallow depths from the surface (here depths of 15 and 30 mm), evolution mirrors the fluctuation of . For depths below 100 mm, the influence of on vanishes, as experimentally measured in [50, 51] and obtained computationally herein. As a general observation, the continuous drying of the entire specimen follows from the long-term exposure to a sub-saturated ambient environment, as accurately simulated by the computational model. This successful model verification serves as a stepping stone to quantify a surface humidity threshold potentially leading to cold joint quantification, as described below.
5 Surface humidity threshold for cold joint formation
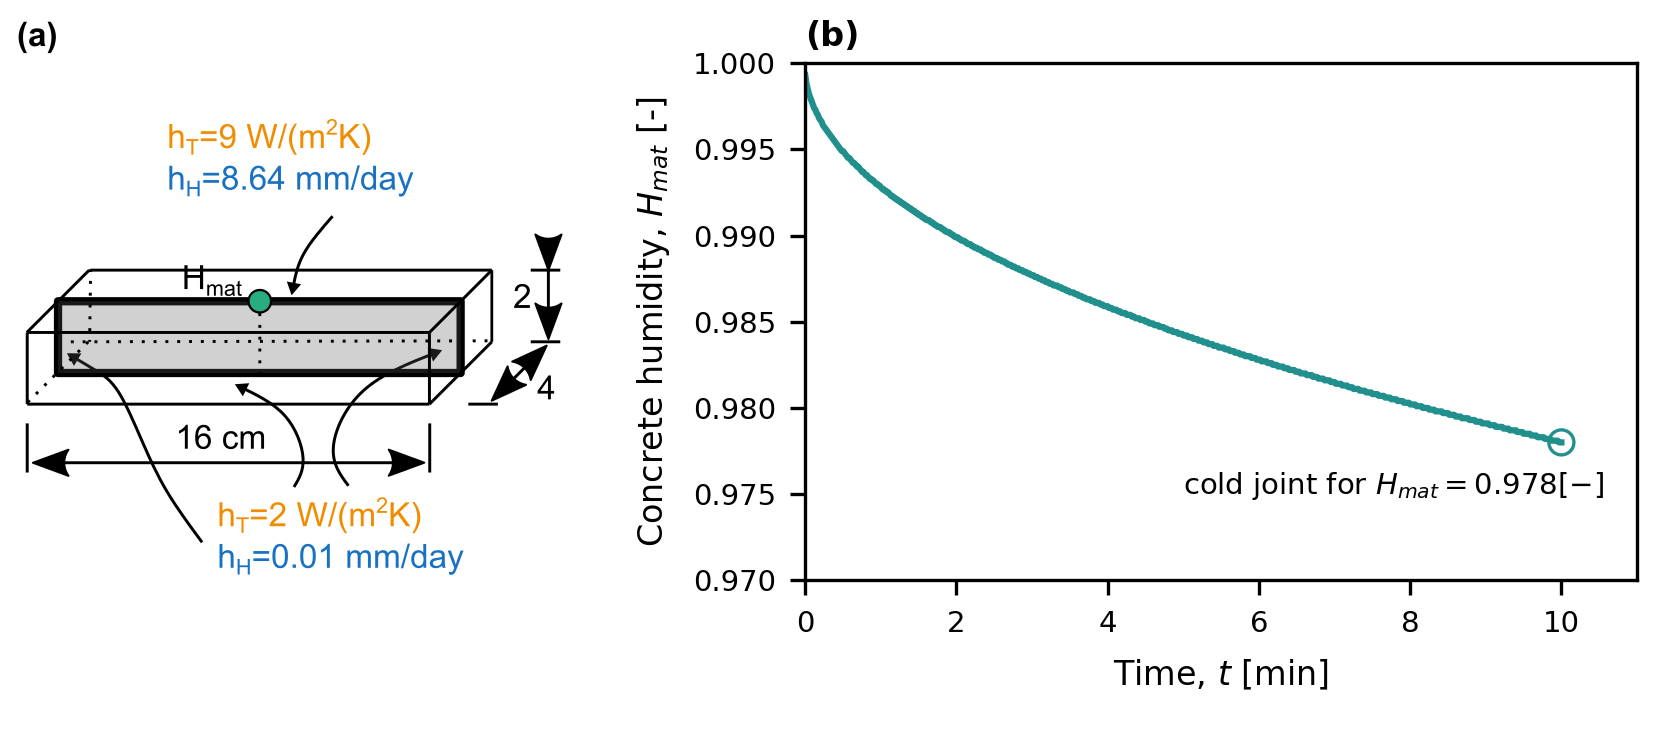
While concrete surfaces naturally dry over time, we focus on identifying a humidity threshold that would indicate a potential threat of cold joint formation. To this end, we consider the experimental data measured by Keita et al. [11], who quantified the drying rate of fresh concrete under controlled conditions. In their work, they exposed freshly cast specimens to a forced airflow in a climatic chamber and recorded the exposure time. Measured results indicate that surface drying after 10 minutes of exposure had detrimental consequences on the material’s mechanical performance.
We simulate the aforementioned drying experiment from Keita et al. [11] to determine a surface humidity value leading to a potential cold joint formation. For model evaluation, we consider a central 2D slice of the tested specimen, see Figure 6(a), and perform a coupled temperature and humidity simulation with cement kinetics parameters summarized in Appendix C. The specimen geometry and considered BC are shown in Figure 6(a). The computed relative humidity at the top specimen surface after 10 minutes of forced drying amounted to [-], see result in Figure 6(b). From now on, we will consider this value as a humidity threshold in Section 6 to consistently compare the factors affecting surface drying and assess their severity under given exposure conditions.
Given the lack of experimental data on surface humidity measurements leading to cold joint formation, we simulate the well-defined drying experiment from [11] and obtain a calculated humidity threshold value. We acknowledge that our assessment will rely on a single data point and thus cannot be proclaimed a universally applicable criterion for cold joint formation. Nonetheless, it allows for a qualitative assessment of the various input factors. More experimental data on surface humidity evolution should be collected before any concluding recommendation can be made.
6 Factors affecting cold joint formation
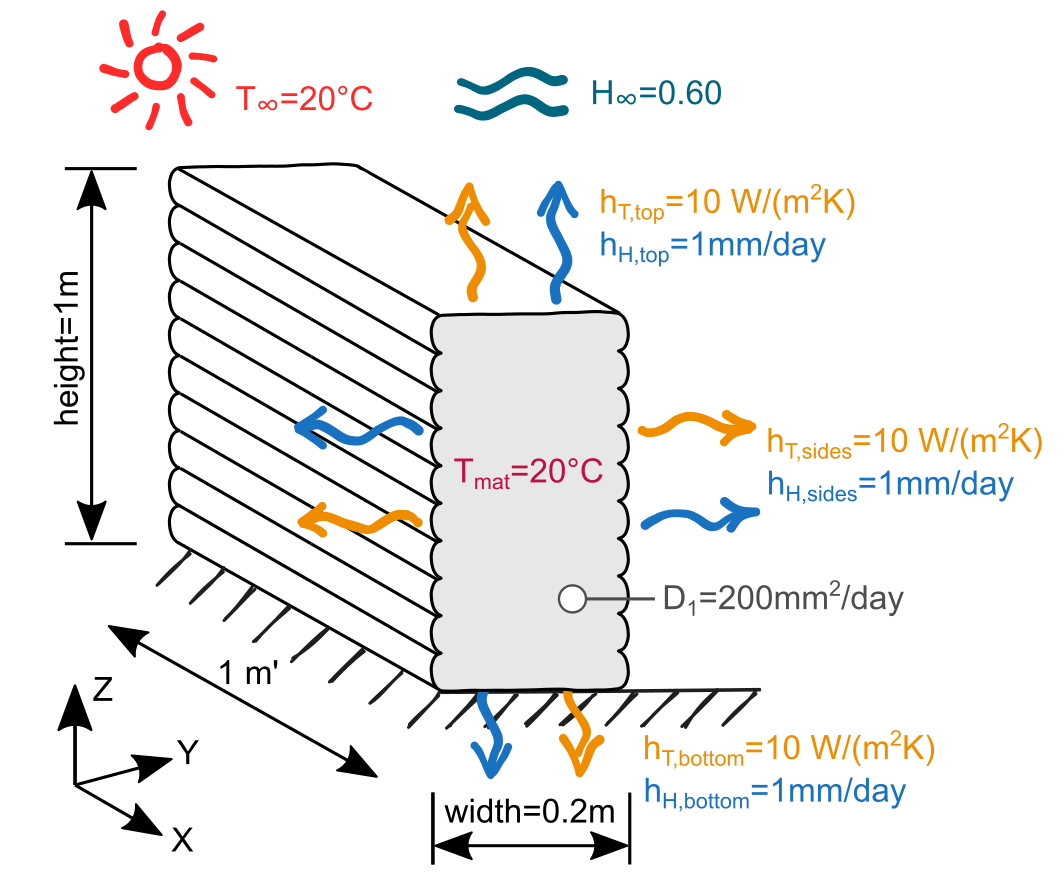
Various factors potentially influence the surface drying of extruded concrete. To evaluate the risk of cold joint formation, we first envision a fictitious concrete structure with a realistic geometry, extruded within a common ambient environment, as schematically shown in Figure 7. Next, we perform a coupled heat and humidity transport simulation and evaluate the time necessary for the humidity on the top surface of the structure to reach the threshold, potentially leading to a cold joint formation. For the listed combination of inputs, the computed time amounts to min. While such duration may seem excessive and far from threatening in a typical use case, a combination of the factors listed below can drastically reduce the time to units of minutes, raising concerns in all but the fastest extrusions of structures.
To assess the severity of drying for each factor separately, from the state of material development to structural geometry over to the influence of the ambient environment, we sequentially vary the value for each factor within experimentally achievable bounds and compare the resulting times. To this end, we introduce
| (15) |
with denoting the simulated time to reach the threshold humidity for a given variation in the input factor. Eq. (15) provides a relative scaling factor that indicates either accelerated () or hindered () time for cold joint formation and allows the assessment of the severity of surface drying. In the following subsections, we discuss each factor’s influence and provide recommendations for possible cold joint mitigation.
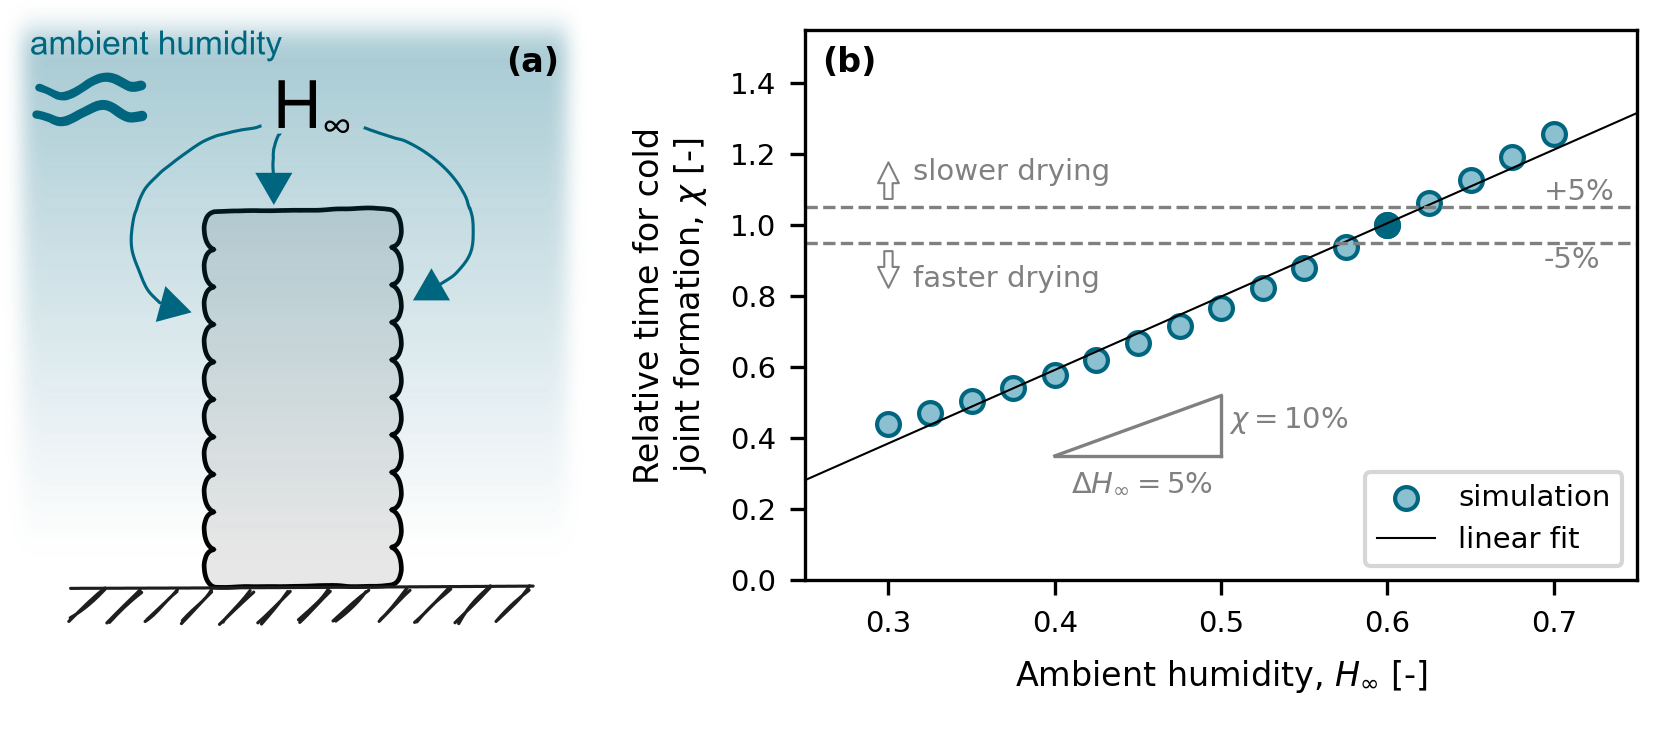
6.1 Ambient conditions
The influence of the surrounding environment on the concrete structure comprises the contributions of ambient temperature and humidity, both of which fluctuate jointly throughout the day and season. While their effects on the structure are coupled in real-life scenarios, the computational model enables us to dissect their impact and consequences separately, see Figure 8 and 9.
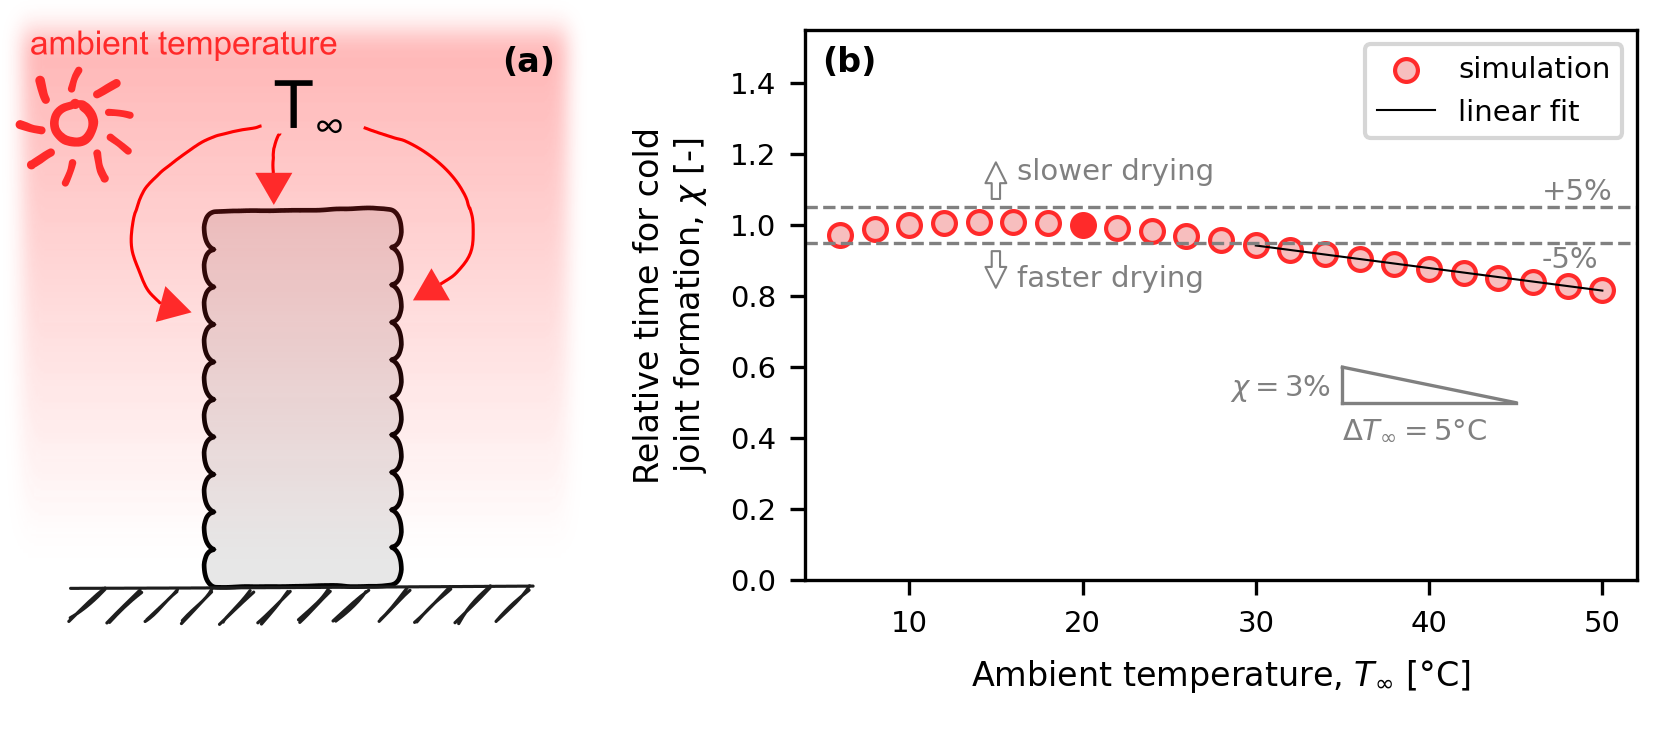
We consider an ambient temperature fluctuation in the range C, corresponding to globally foreseeable extreme temperatures encountered during 3D concrete printing. Calculated results for indicate two drying regimes, see Figure 8(b). For typical temperatures in the range between 6 to 30∘C, we observe no influence on the surface drying rate within of . Such temperatures are commonly present if the structure is shielded from direct sun exposure, as is usual in production halls and laboratories. For ambient temperatures above C, we observe , denoting an accelerated cold joint formation rate. In particular, decreases by per C. In summary, calculated results demonstrate that isolated temperature fluctuation within common temperature limits does not impact the kinetics of cold joint formation.
Ambient humidity has a strong effect on surface drying kinetics. The considered humidity range covers the common limits encountered throughout the year. Calculated results shown in Figure 9(C) indicate a linear dependence between and , namely per 5% . As a consequence, 3D printing in a dry ambient poses a significant challenge regarding accelerated surface drying, effectively shortening the time to cold joint formation.
Summarizing the effect of the ambient environment, low ambient humidity and high ambient temperature accelerate surface drying and increase the risk of cold joint formation. While shielding the structure from the sun helps to lower the environmental temperature, active control of ambient humidity on the building site or laboratory is probably just reserved for niche applications.
6.2 Humidity and heat exchange with environment
The uncovered surface of extruded concrete structures facilitates the transfer of heat and humidity from the structure to the environment, see illustration in Figure 10. Similar to Section 6.1, we here separately investigate the contribution of each phenomenon to the surface drying rate.
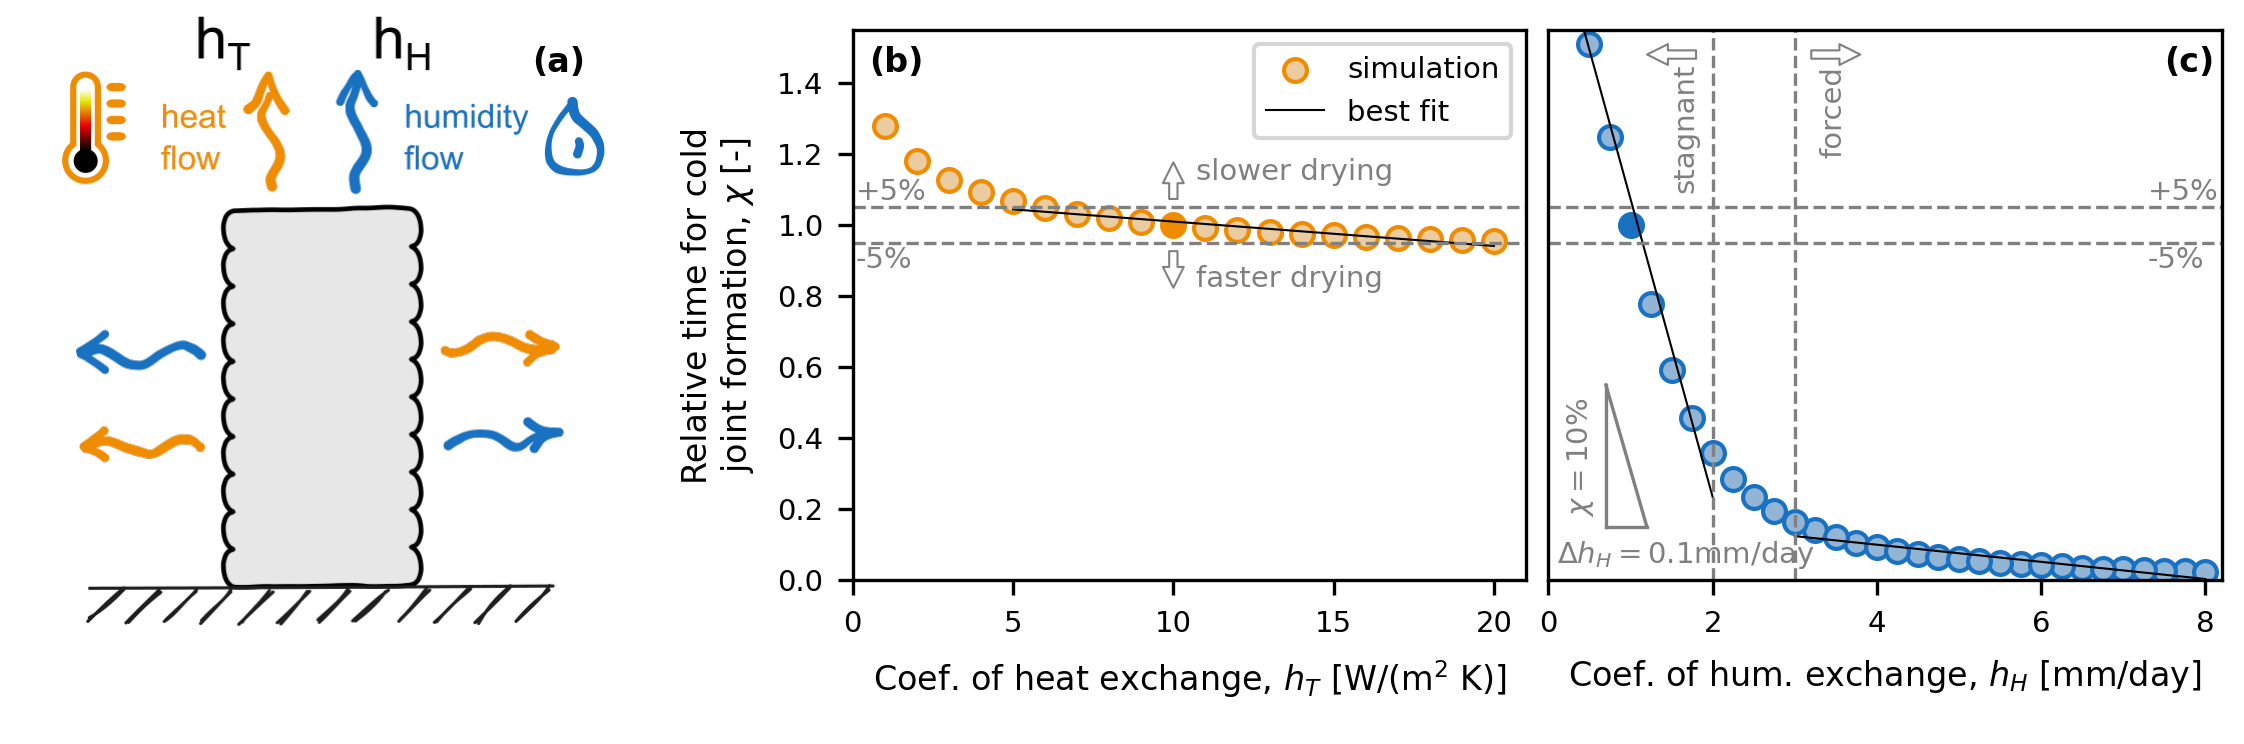
We characterize the temperature exchange between the structure and its environment using the heat transfer coefficient , see Figure 10(a). For exposed sides, W/(m2 K), which represent typical values used for unshielded concrete freely exposed to the environment [22, 23, 31, 24]. Calculated results of shown in Figure 10(b) indicate no noticeable influence on the surface drying rate for W/(m2 K), implying that heat exchange from an uninsulated concrete surface does not accelerate cold joint formation. A time prolongation in their formation can be effectively achieved by a reduction of below 5 W/(m2 K), indicating that the addition of a heat-insulating layer atop the extruded filament surface would help slow down surface drying. Assuming W/(m2 K) to represent the heat exchange between the naked concrete structure and the ambient environment, the addition of at least 4 mm of polystyrene ( W/(m K)) would be sufficient to delay their formation.
For humidity exchange, we consider a transfer coefficient mm/day. The lower end of the range corresponds to gradual drying under stagnant conditions, e.g. structures positioned in a protected environment. The upper range of the interval describes a surface exposed to a moving airflow. Results of drying simulations shown in Figure 10(C) indicate a bilinear drying regime with a transition around mm/day. Under stagnant environmental conditions ( mm/day), the rate of surface drying is strongly affected by the chosen with per 0.1 mm/day. For extrusion with structures exposed to forced airflow, rapid drying rate becomes a major threat. In such conditions, a stable denotes a very fast cold joint formation. We therefore emphasize that precise quantification of is crucial for accurate modeling surface drying rate.
As a practical recommendation, our modeling results indicate that any protective measure applied to the exposed concrete surface strongly affects its drying rate. Sealing the open surface with an impenetrable foil or spraying an evaporation retardant will efficiently increase , prolonging the time before a cold joint forms. 3D printing under ambient conditions with active air circulation should be avoided or, if imperative, the extrusion should be carried out rapidly, minimizing the time between deposition of individual layers.
6.3 Material state
Hydrating concrete generates measurable heat from the reacting binder, which is concurrently accompanied by the development of a pore network on the microstructural scale. Here we investigate how the material temperature and the humidity diffusivity through the porous microstructure influence the surface drying rate, see Figure 11(a).
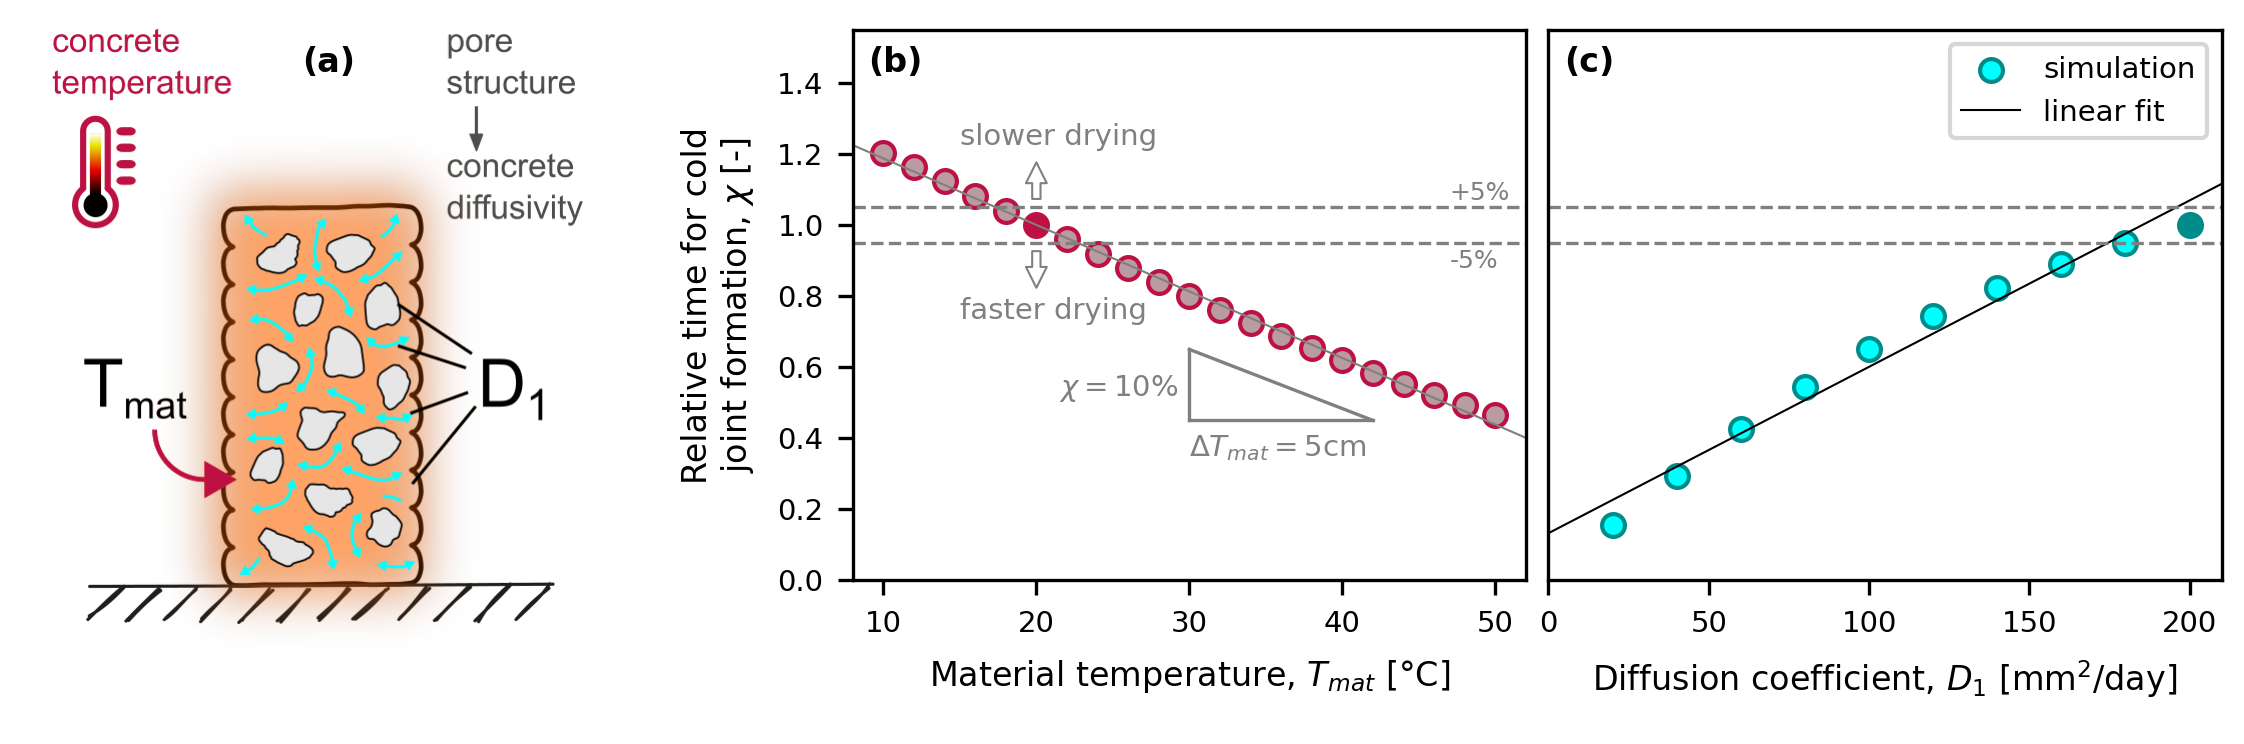
In our fictitious concrete structure, the initial material temperature corresponds to a temperature resulting from raw material mixing, pumping, extrusion, and partial cement hydration. This processing history results in an increase of , offsetting it from at the model evaluation time. We vary C in our drying simulations while maintaining C. Calculated results indicate a linear relationship between and , see Figure 11(b), with for every 5∘C in . Notably, it is interesting to point out that if the concrete temperature is cooler than the ambient environment, this effectively prolongs the time necessary for cold joint formation. This can be conveniently achieved by cooling down water with ice before mixing, rendering this recommendation easily applicable to every building site or laboratory.
The exposed concrete surface can be re-saturated by water diffusion through the internal pore network. To account for this phenomenon, we use the coefficient , which describes the rate of humidity diffusion through the complex pore structure. We note that depends on the cement fineness distribution and w/c ratio used [20, 52] and is affected by the ongoing microstructural development, but consider a constant value for simplicity in the simulations.
For the model evaluation, we assume a value mm/day. Low values of indicate a dense microstructure with unconnected fine pores, hindering humidity transport from the structural core to the exposed outer surface. This characterizes a microstructure of mature concrete. The opposite spectrum of values corresponds to a highly porous medium with interconnected pores, i.e. a fresh concrete state, whose microstructure facilitates humidity transport within the material. Simulated results indicate an almost linear relationship between and . Low values of result in a rapid formation of a dry, thin surface layer as the material cannot transport the internal humidity, shortening the time to cold joint formation. High values of denote a highly permeable material that allows for a steady redistribution of internal water to the drying surface, effectively prolonging the time to cold joint formation. However, providing recommendations for selecting a unique value of for a particular generic extruded structure is beyond the scope of this manuscript.
In summary, the chosen value for material diffusivity has a pronounced effect on the rate of surface drying. However, since many factors influence the diffusivity through the pore network, it becomes impossible to set a recommendable initial value for model predictions. The chosen value of serves only for qualitative assessment of the cold joint formation but can be adapted if a specific value becomes obtainable by other means.
6.4 Structural geometry
Extruded concrete structures typically exhibit a wall-like geometry with a very large height-to-thickness ratio. While the extrusion nozzle typically determines the cross-sectional width (i.e., wall thickness), the structural height gradually increases following the sequential deposition of individual filaments. We present the results of simulated drying kinetics for variable structural geometry below, see Figure 12.
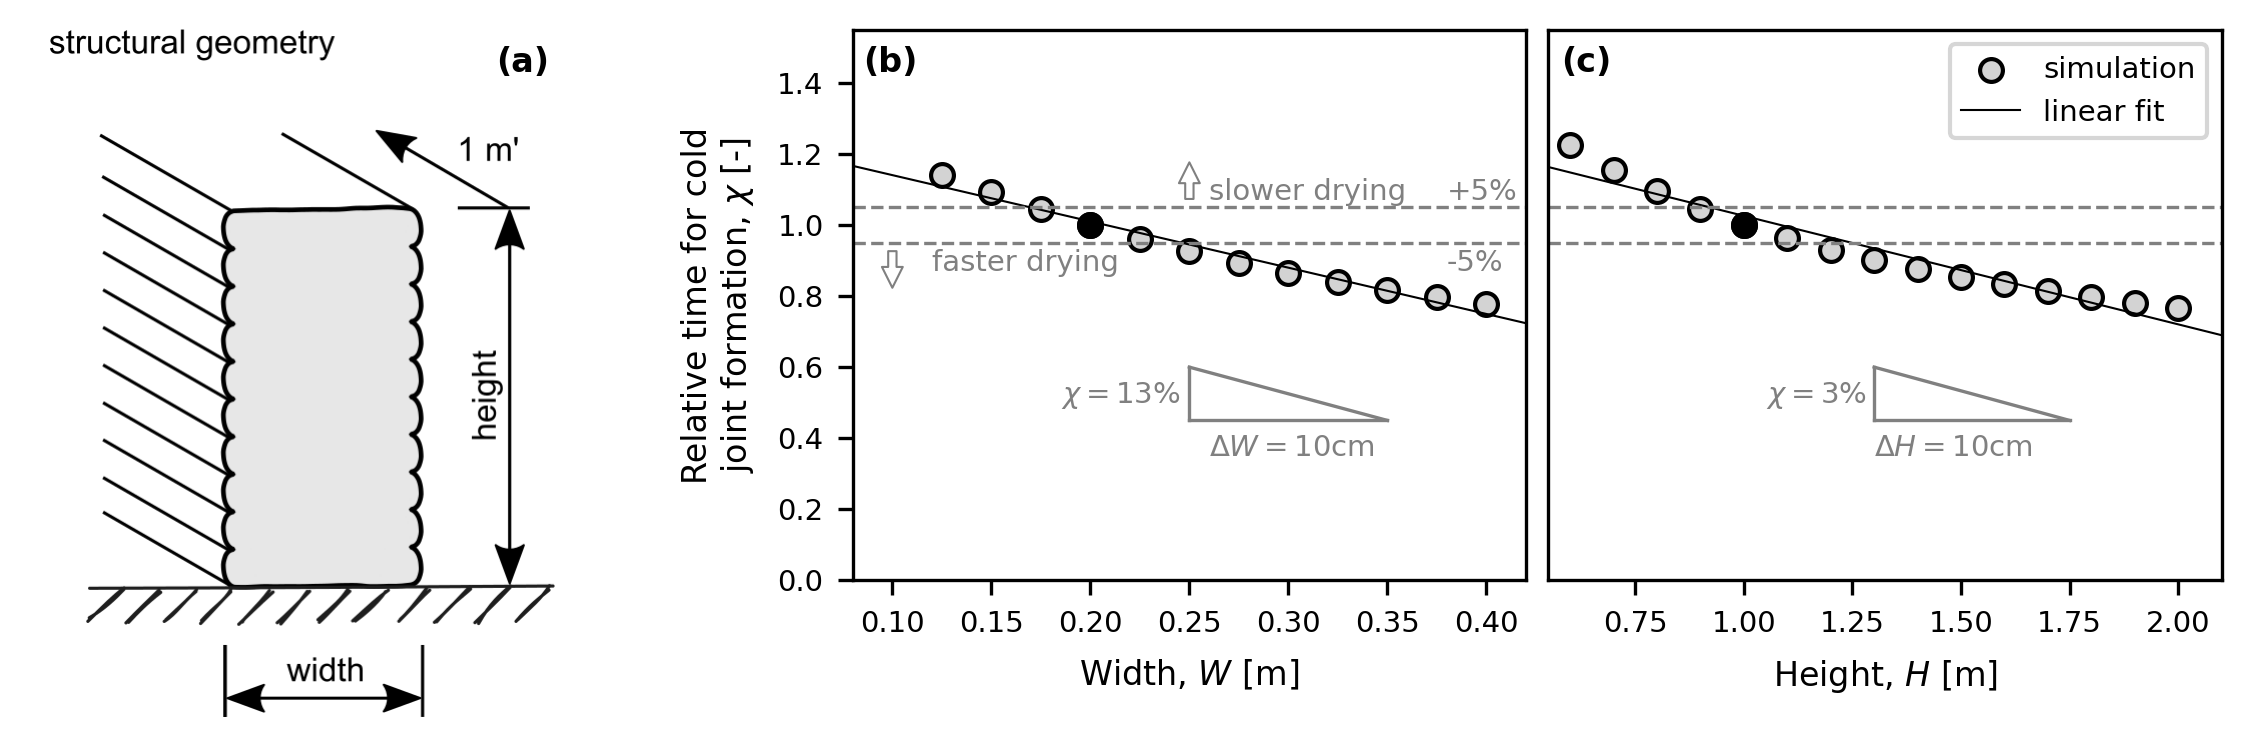
In our numerical study on the fictitious concrete structure, we varied both structural dimensions over expectable ranges achievable in the construction practice, i.e. m and m. Calculated results show an approximately linear dependency of both structural dimensions with , in particular, for m and for m. Based on purely geometric considerations, an increase in any structural dimension proportionally increases the exposed surface area and cement content within the bulk concrete; see discussion in Sections 6.2, 6.3. Both these factors shorten the time to form a cold joint.
In summary, the effect of structural geometry on the drying rate is non-negligible. However, we acknowledge that the geometry of extruded structures is typically constrained by civil engineering and architectural requirements or technological limitations. The presented model, however, allows a rapid assessment of any arbitrary structure with a wall-like geometry, making it a suitable tool for assessing the threat of cold joint formation for a given design.
7 Conclusions
Cold joints in extruded concrete structures form once the exposed surface of a deposited filament dries prematurely and gets sequentially covered by a layer of fresh concrete. This creates a material heterogeneity which lowers the structural durability and shortens the designed service life.
This paper introduces a computational model for assessing the risk of cold joint formation that accounts for the extruded structural geometry, structural interaction with the environment, and ambient conditions. The model provides, as an output, the time for cold joint formation, which allows us to assess the severity of surface drying for a given combination of input parameters.
The main conclusions from our study can be summarized as follows:
-
•
Ambient conditions: Low ambient humidity and high ambient temperature shorten the time to cold joint formation at a rate of for and for C if C, respectively. While shielding the structure from direct sun exposure helps to control the ambient temperature, a regulated increase of ambient humidity on the building site or laboratory is probably reserved for niche applications.
-
•
Heat exchange with environment: Isolated heat exchange between a naked concrete structure and its environment does not accelerate the surface drying rate. Adding a thermal insulation layer (e.g., at least 4 mm of polystyrene) atop the exposed surface effectively delays the time for cold joint formation.
-
•
Humidity exchange with environment: Surface drying is strongly affected by humidity exchange between the structure and the environment. The humidity coefficient increases the drying rate by 10% for mm/day in a stagnant environment. Sealing the open concrete surface with water vapor barriers, temporarily adding impenetrable foils, or regular spraying with water provides an effective means for keeping the concrete surface from prematurely drying. 3D printing outdoors (under “open air” conditions) should be avoided or, if imperative, carried out at least uninterrupted, minimizing the time between the extrusion of individual layers.
-
•
Material temperature: Concrete temperature strongly affects the surface drying and shortens the time to cold joint formation at a rate of for C. Cooling the mixing water before extrusion provides a very efficient and effective means of prolonging the time for cold joint formation.
-
•
Material pore structure: The material diffusivity remains an outcome of the microstructural development rather than an input parameter for a concrete mix design. Concretes with a denser microstructure exhibit a lower diffusivity, translating into a faster cold joint formation due to the constrained water supply from the structural interior onto the drying surface.
-
•
Structural geometry: Structural geometry affects the drying rate as for m and for m. The presented model allows the user to verify and compare the time for cold joint formation for any wall-like structural geometry and provides a relative time to cold joint formation.
8 CRediT authorship contribution statement
Michal Hlobil: Conceptualization, Methodology, Formal analysis, Investigation, Data curation, Writing - Original Draft, Visualization; Luca Michel: Data curation, Formal analysis, Writing - Review & Editing; Mohit Pundir: Software, Writing - Review & Editing; David S. Kammer: Writing - Review & Editing, Resources, Supervision, Project administration, Funding acquisition
9 Declaration of Competing Interests
The authors declare that they have no known competing financial interests or personal relationships that could have appeared to influence the work reported in this paper.
10 Data availability
The code used for the numerical simulations is available on ETHGitlab and the generated simulation data has been deposited in the ETH Research Collection database under accession code 10.3929/ethz-b-000675875.
11 Acknowledgement
D. S. K., M. H., and L. M. acknowledge support by the Swiss National Science Foundation under grant 200021_200343. We are thankful to Yaqi Zhao and Dr. Antoine Sanner for the helpful discussion and to Mikey Ronen for his feedback on the manuscript.
Appendix A Derivation of governing equations
A.1 Transient heat conduction in concrete
The temperature field within a hydrating concrete structure is highly non-uniform. While cement hydration internally generates heat throughout the structure, the exposed surface is cooled down by heat exchange with the ambient environment. This phenomenon may be conveniently modeled by formulating a transient heat conduction problem with an internal heat source over a given domain. The governing equation for the thermodynamic equilibrium defined for a differential element of the structure requires
| (16) |
where is the heat flux emerging from heat conduction in [J/(s m and is the heat accumulated within a unit volume of concrete in [J/m3].
For statistically homogeneous and isotropic materials, such as plain concrete investigated in the present study, the heat flux vector can be expressed using Fourier’s law of heat conduction as a negative vector gradient of temperature, namely as
| (17) |
where represents the heat conductivity of concrete in [J/(s m K)], reflecting the microstructural development described by .
The total heat accumulated within a unit volume comprises two heat rate contributions: accumulated from conduction and released from hydration , both given in [J/m3], given as
| (18) |
where stands for the volumetric heat capacity of concrete in [J/(m3 K)]. This follows from multiplying the specific heat capacity of the material in [J/(kg K)] by its volumetric mass density in [kg/m3].
A.2 Transient humidity conduction in concrete
Free (chemically unbound) water in the capillary pore network plays a central role in microstructural formation. Here, we consider the relative humidity as an equilibrated humidity of the gaseous phase and the interstitial liquid phase present within the pore network of the cementitious microstructure. After the initial stages of cement hydration, the ongoing microstructural development becomes controlled by water availability from mutually unconnected pores, with water diffusion serving as a driving force for the supply of ionic species. Thus, we formulate the conduction of humidity as a transient diffusion problem with acting as the driving potential for the moisture field and with negligible moisture convection through pores, given as
| (19) |
where represents the humidity flux in [m2/s], the sink term accounts for self-desiccation of the material, and is the hygrothermic coefficient. Bažant and Najjar [36] propose
| (20) |
The self-desiccation follows as a drop in moisture content due to ongoing cement hydration, given by
| (21) |
where stands for the amount of chemically-bound water necessary for complete cement hydration, expressed as kg of water per kg of cement used [41], and stands for the mass of cement used in 1 m3 of concrete. The corresponding decrease of relative humidity due to self-desiccation amounts
| (22) |
where stands for the moisture capacity of the material in [kg/m3] determined as the slope of the desorption isotherm, assumed here as kg/m3.
The constitutive law defines the humidity flux as a negative vector gradient of relative humidity given as
| (23) |
where represents the diffusivity coefficient in [m2/s]. Several formulations for have been proposed, as summarized by the fib Model Code 2010 [53]. Here, we consider the formulation proposed by Bažant and Najjar [36] in the form of
| (24) |
with parameters taken from [54] as mm2/day as the value of diffusivity at full pore saturation (), [–] with as the minimum for , as the relative pore humidity for , and characterizing the drop in spread of . The value of can be estimated for mature concrete as a function of its average strength [53] as
| (25) |
which provides an effective range of between mm2/day for typical concrete strengths between MPa. The impact of on simulation results is shown in detail in Section 6.
Appendix B Parameters for the affinity-based hydration model
The analytical expression for the affinity-based hydration model given in Eq. (6) uses as the maximum-reachable degree of hydration in cement paste. This parameter depends on the initial water-to-cement ratio and the curing regime considered [55]. As such, takes the form of
| (26) |
However, the practically reachable limit for for ordinary Portland cements under common curing conditions and in reasonable time-scales (up to years of hydration under normal temperature) amounts to [-], which will be used for model evaluation.
Table 1 summarizes the parameters of the affinity-based hydration model that best fit the experimental data from isothermal calorimetry, as shown in Figure 2.
| CEM I Ladce | CEM I Ladce | CEM II B/LL | CEM I Ladce | |
| (391 m2/kg) | (391 m2/kg) + 20% quartz | 32.5 R Hranice | (273 m2/kg) | |
| 0.85 | 0.85 | 0.85 | 0.85 | |
| 532 | 426 | 330 | 512 |
Appendix C Parameters for computational model evaluation
References
- Lloret-Fritschi et al. [2020] Ena Lloret-Fritschi, Timothy Wangler, Lukas Gebhard, Jaime Mata-Falcón, Sara Mantellato, Fabio Scotto, Joris Burger, Anna Szabo, Nicholas Ruffray, Lex Reiter, Federica Boscaro, Walter Kaufmann, Matthias Kohler, Fabio Gramazio, and Robert Flatt. From smart dynamic casting to a growing family of digital casting systems. Cement and Concrete Research, 134:106071, 2020. ISSN 0008-8846. doi: 10.1016/j.cemconres.2020.106071.
- Buswell et al. [2020] R.A. Buswell, W.R. Leal da Silva, F.P. Bos, H.R. Schipper, D. Lowke, N. Hack, H. Kloft, V. Mechtcherine, T. Wangler, and N. Roussel. A process classification framework for defining and describing digital fabrication with concrete. Cement and Concrete Research, 134:106068, 2020. ISSN 0008-8846. doi: 10.1016/j.cemconres.2020.106068.
- Vantyghem et al. [2020] Gieljan Vantyghem, Wouter De Corte, Emad Shakour, and Oded Amir. 3d printing of a post-tensioned concrete girder designed by topology optimization. Automation in Construction, 112:103084, 2020. ISSN 0926-5805. doi: 10.1016/j.autcon.2020.103084.
- Buswell et al. [2007] R.A. Buswell, R.C. Soar, A.G.F. Gibb, and A. Thorpe. Freeform construction: Mega-scale rapid manufacturing for construction. Automation in Construction, 16(2):224–231, 2007. ISSN 0926-5805. doi: 10.1016/j.autcon.2006.05.002.
- Agustí-Juan et al. [2017] Isolda Agustí-Juan, Florian Müller, Norman Hack, Timothy Wangler, and Guillaume Habert. Potential benefits of digital fabrication for complex structures: Environmental assessment of a robotically fabricated concrete wall. Journal of Cleaner Production, 154:330–340, 2017. ISSN 0959-6526. doi: 10.1016/j.jclepro.2017.04.002.
- Schwartz [2018] Joseph Schwartz. Graphic statics and their potential for digital design and fabrication with concrete. Cement and Concrete Research, 112:122–135, 2018. ISSN 0008-8846. doi: 10.1016/j.cemconres.2018.06.015.
- Hack et al. [2020] Norman Hack, Kathrin Dörfler, Alexander Nikolas Walzer, Timothy Wangler, Jaime Mata-Falcón, Nitish Kumar, Jonas Buchli, Walter Kaufmann, Robert J. Flatt, Fabio Gramazio, and Matthias Kohler. Structural stay-in-place formwork for robotic in situ fabrication of non-standard concrete structures: A real scale architectural demonstrator. Automation in Construction, 115:103197, 2020. ISSN 0926-5805. doi: 10.1016/j.autcon.2020.103197.
- Khan et al. [2020] Mohammad S. Khan, Florence Sanchez, and Hongyu Zhou. 3-d printing of concrete: Beyond horizons. Cement and Concrete Research, 133:106070, 2020. ISSN 0008-8846. doi: 10.1016/j.cemconres.2020.106070.
- Bos et al. [2022] F.P. Bos, C. Menna, M. Pradena, E. Kreiger, W.R. Leal da Silva, A.U. Rehman, D. Weger, R.J.M. Wolfs, Y. Zhang, L. Ferrara, and V. Mechtcherine. The realities of additively manufactured concrete structures in practice. Cement and Concrete Research, 156:106746, 2022. ISSN 0008-8846. doi: 10.1016/j.cemconres.2022.106746.
- García de Soto et al. [2018] Borja García de Soto, Isolda Agustí-Juan, Jens Hunhevicz, Samuel Joss, Konrad Graser, Guillaume Habert, and Bryan T. Adey. Productivity of digital fabrication in construction: Cost and time analysis of a robotically built wall. Automation in Construction, 92:297–311, 2018. ISSN 0926-5805. doi: 10.1016/j.autcon.2018.04.004.
- Keita et al. [2019] Emmanuel Keita, Hela Bessaies-Bey, Wenqiang Zuo, Patrick Belin, and Nicolas Roussel. Weak bond strength between successive layers in extrusion-based additive manufacturing: measurement and physical origin. Cement and Concrete Research, 123:105787, 2019. ISSN 0008-8846. doi: 10.1016/j.cemconres.2019.105787.
- Wolfs et al. [2019] R.J.M. Wolfs, F.P. Bos, and T.A.M. Salet. Hardened properties of 3d printed concrete: The influence of process parameters on interlayer adhesion. Cement and Concrete Research, 119:132–140, 2019. ISSN 0008-8846. doi: 10.1016/j.cemconres.2019.02.017.
- Tay et al. [2019] Yi Wei Daniel Tay, Guan Heng Andrew Ting, Ye Qian, Biranchi Panda, Lewei He, and Ming Jen Tan. Time gap effect on bond strength of 3D-printed concrete. Virtual and Physical Prototyping, 14(1):104–113, 2019. doi: 10.1080/17452759.2018.1500420.
- Nerella et al. [2019] Venkatesh Naidu Nerella, Simone Hempel, and Viktor Mechtcherine. Effects of layer-interface properties on mechanical performance of concrete elements produced by extrusion-based 3d-printing. Construction and Building Materials, 205:586–601, 2019. ISSN 0950-0618. doi: 10.1016/j.conbuildmat.2019.01.235.
- Kruger and van Zijl [2021] Jacques Kruger and Gideon van Zijl. A compendious review on lack-of-fusion in digital concrete fabrication. Additive Manufacturing, 37:101654, 2021. ISSN 2214-8604. doi: 10.1016/j.addma.2020.101654.
- Van Der Putten et al. [2020] J. Van Der Putten, M. Azima, P. Van den Heede, T. Van Mullem, D. Snoeck, C. Carminati, J. Hovind, P. Trtik, G. De Schutter, and K. Van Tittelboom. Neutron radiography to study the water ingress via the interlayer of 3D printed cementitious materials for continuous layering. Construction and Building Materials, 258:119587, 2020. ISSN 0950-0618. doi: 10.1016/j.conbuildmat.2020.119587.
- Zhang et al. [2021] Yu Zhang, Yunsheng Zhang, Lin Yang, Guojian Liu, Yidong Chen, Shiwei Yu, and Hongjian Du. Hardened properties and durability of large-scale 3D printed cement-based materials. Materials and Structures, 54, 2021. doi: 10.1617/s11527-021-01632-x.
- Van Der Putten et al. [2022] J. Van Der Putten, M. De Volder, P. Van den Heede, M. Deprez, V. Cnudde, G. De Schutter, and K. Van Tittelboom. Transport properties of 3D printed cementitious materials with prolonged time gap between successive layers. Cement and Concrete Research, 155:106777, 2022. ISSN 0008-8846. doi: 10.1016/j.cemconres.2022.106777.
- Mechtcherine et al. [2020] V. Mechtcherine, F.P. Bos, A. Perrot, W.R. Leal da Silva, V.N. Nerella, S. Fataei, R.J.M. Wolfs, M. Sonebi, and N. Roussel. Extrusion-based additive manufacturing with cement-based materials – production steps, processes, and their underlying physics: A review. Cement and Concrete Research, 132:106037, 2020. ISSN 0008-8846. doi: 10.1016/j.cemconres.2020.106037.
- Hlobil et al. [2022] Michal Hlobil, Ivana Kumpová, and Adéla Hlobilová. Surface area and size distribution of cement particles in hydrating paste as indicators for the conceptualization of a cement paste representative volume element. Cement and Concrete Composites, 134:104798, 2022. ISSN 0958-9465. doi: 10.1016/j.cemconcomp.2022.104798.
- Azenha et al. [2021] Miguel Azenha, Fragkoulis Kanavaris, Dirk Schlicke, Agnieszka Jedrzejewska, Farid Benboudjema, Tulio Honorio, and Vít Šmilauer. Recommendations of rilem tc 287-ccs: thermo-chemo-mechanical modelling of massive concrete structures towards cracking risk assessment. Materials and Structures/Materiaux et Constructions, 54(4), 2021. doi: 10.1617/s11527-021-01732-8.
- Faria et al. [2006] Rui Faria, Miguel Azenha, and Joaquim A. Figueiras. Modelling of concrete at early ages: Application to an externally restrained slab. Cement and Concrete Composites, 28(6):572–585, 2006. ISSN 0958-9465. doi: 10.1016/j.cemconcomp.2006.02.012.
- Šmilauer and Krejčí [2009] V Šmilauer and T. Krejčí. Multiscale Model for Temperature Distribution in Hydrating Concrete. International Journal for Multiscale Computational Engineering, 7(2):135–151, 2009. doi: 10.1615/IntJMultCompEng.v7.i2.50.
- da Silva et al. [2015] Wilson Ricardo Leal da Silva, Vít Šmilauer, and Petr Štemberk. Upscaling semi-adiabatic measurements for simulating temperature evolution of mass concrete structures. Materials and Structures/Materiaux et Constructions, 48(4):1031 – 1041, 2015. doi: 10.1617/s11527-013-0213-3.
- Jedrzejewska et al. [2018] Agnieszka Jedrzejewska, Farid Benboudjema, Laurie Lacarrière, Miguel Azenha, Dirk Schlicke, Stefano Dal Pont, and Arnaud Delaplace. Cost tu1404 benchmark on macroscopic modelling of concrete and concrete structures at early age: Proof-of-concept stage. Construction and Building Materials, 174:173–189, 2018. ISSN 0950-0618. doi: https://doi.org/10.1016/j.conbuildmat.2018.04.088.
- Šmilauer et al. [2019] Vít Šmilauer, Petr Havlásek, Tobias Gasch, Arnaud Delaplace, David E.-M. Bouhjiti, Farid Benboudjema, Matthieu Briffaut, Fragkoulis Kanavaris, and Miguel Azenha. Hygro-mechanical modeling of restrained ring test: Cost tu1404 benchmark. Construction and Building Materials, 229:116543, 2019. ISSN 0950-0618. doi: 10.1016/j.conbuildmat.2019.07.269.
- Taylor [1997] H. F. W. Taylor. Cement chemistry. Thomas Telford Publishing, 2nd edition, 1997. ISBN 0-7277-2592-0. URL https://www.icevirtuallibrary.com/isbn/9780727739452.
- Ulm and Coussy [1995] Franz-Josef Ulm and Olivier Coussy. Modeling of thermochemomechanical couplings of concrete at early ages. Journal of Engineering Mechanics, 121(7):785–794, 1995. doi: 10.1061/(ASCE)0733-9399(1995)121:7(785).
- Cervera et al. [1999] Miguel Cervera, Javier Oliver, and Tomás Prato. Thermo-chemo-mechanical model for concrete. I: Hydration and aging. Journal of Engineering Mechanics, 125(9):1018–1027, 1999. doi: 10.1061/(ASCE)0733-9399(1999)125:9(1018).
- Gawin et al. [2006] Dariusz Gawin, Francesco Pesavento, and Bernhard A. Schrefler. Hygro-thermo-chemo-mechanical modelling of concrete at early ages and beyond. Part I: Hydration and hygro-thermal phenomena. International Journal for Numerical Methods in Engineering, 67(3):299–331, 2006. doi: 10.1002/nme.1615.
- Jendele et al. [2014] Libor Jendele, Vít Šmilauer, and Jan Červenka. Multiscale hydro-thermo-mechanical model for early-age and mature concrete structures. Advances in Engineering Software, 72:134–146, 2014. ISSN 0965-9978. doi: 10.1016/j.advengsoft.2013.05.002.
- Bentz [1997] D. P. Bentz. Three-Dimensional Computer Simulation of Portland Cement Hydration and Microstructure Development. Journal of the American Ceramic Society, 80(1):3–21, 1997. doi: 10.1111/j.1151-2916.1997.tb02785.x.
- Hansen [1986] T. C. Hansen. Physical structure of hardened cement paste. A classical approach. Matèriaux et Constructions, 114(19):423–436, 1986. doi: 10.1007/BF02472146.
- Kada-Benameur et al. [2000] H. Kada-Benameur, E. Wirquin, and B. Duthoit. Determination of apparent activation energy of concrete by isothermal calorimetry. Cement and Concrete Research, 30(2):301–305, 2000. ISSN 0008-8846. doi: 10.1016/S0008-8846(99)00250-1.
- Jensen et al. [1999] O.Mejlhede Jensen, P.Freiesleben Hansen, E.E. Lachowski, and F.P. Glasser. Clinker mineral hydration at reduced relative humidities. Cement and Concrete Research, 29(9):1505–1512, 1999. ISSN 0008-8846. doi: 10.1016/S0008-8846(99)00132-5.
- Bazant and Najjar [1972] Z. P. Bazant and L. J. Najjar. Nonlinear water diffusion in nonsaturated concrete. Materials and Structures, 5(1), 1972. doi: 10.1007/BF02479073.
- Bentz [2007] Dale P. Bentz. Transient plane source measurements of the thermal properties of hydrating cement pastes. Materials and Structures, 40(10):1073–1080, 2007. ISSN 1871-6873. doi: 10.1617/s11527-006-9206-9.
- Holman [1981] J. P. Holman. Heat transfer. McGraw-Hill, New York, 1981.
- Todd [1951] S. S. Todd. Low-temperature heat capacities and entropies at 298.16°K. of crystalline calcium orthosilicate, zinc orthosilicate and tricalcium silicate. Journal of the American Chemical Society, 73(7):3277–3278, 1951. doi: 10.1021/ja01151a084.
- Gli [2015] Investigation of Thermal Properties of Shielding Concrete, 09 2015. doi: 10.13140/RG.2.1.1045.0403.
- Neville [1997] A. M. Neville. Properties of Concrete. John Wiley & Sons, Inc., 1997.
- Mounanga et al. [2004] P. Mounanga, A. Khelidj, and G. Bastian. Experimental study and modelling approaches for the thermal conductivity evolution of hydrating cement paste. Advances in Cement Research, 16(3):95–103, 2004. doi: 10.1680/adcr.2004.16.3.95.
- Abdolhosseini Qomi et al. [2015] Mohammad Javad Abdolhosseini Qomi, Franz-Josef Ulm, and Roland J.-M. Pellenq. Physical origins of thermal properties of cement paste. Phys. Rev. Applied, 3, 2015. doi: 10.1103/PhysRevApplied.3.064010.
- Honorio et al. [2018] Tulio Honorio, Benoit Bary, and Farid Benboudjema. Thermal properties of cement-based materials: Multiscale estimations at early-age. Cement and Concrete Composites, 87:205–219, 2018. ISSN 0958-9465. doi: 10.1016/j.cemconcomp.2018.01.003.
- Mounanga [2003] Pierre Mounanga. Étude expérimentale du comportement de pâtes de ciment au très jeune âge: hydratation, retraits, propriétés thermophysiques. PhD thesis, Universite de Nantes, 2003. URL http://www.theses.fr/2003NANT2100.
- Fei and Narsilio [2022] Wenbin Fei and Guillermo A. Narsilio. Estimation of thermal conductivity of cemented sands using thermal network models. Journal of Rock Mechanics and Geotechnical Engineering, 14(1):210–218, 2022. ISSN 1674-7755. doi: 10.1016/j.jrmge.2021.08.008.
- Chen et al. [2022] Bofu Chen, Bin Guan, Xiaochun Lu, Bin Tian, and Yangbo Li. Thermal conductivity evolution of early-age concrete under variable curing temperature: Effect mechanism and prediction model. Construction and Building Materials, 319:126078, 2022. ISSN 0950-0618. doi: 10.1016/j.conbuildmat.2021.126078.
- Logg et al. [2012] A. Logg, K.-A. Mardal, and G. N. Wells, editors. Automated Solution of Differential Equations by the Finite Element Method. Springer, 2012. doi: 10.1007/978-3-642-23099-8.
- Havlásek et al. [2021] Petr Havlásek, Vít Šmilauer, Lenka Dohnalová, and Radoslav Sovják. Shrinkage-induced deformations and creep of structural concrete: 1-year measurements and numerical prediction. Cement and Concrete Research, 144:106402, 2021. ISSN 0008-8846. doi: 10.1016/j.cemconres.2021.106402.
- Vinkler and Vítek [2017] Marek Vinkler and Jan L. Vítek. Drying shrinkage of concrete elements. Structural Concrete, 18(1):92–103, 2017. doi: 10.1002/suco.201500208.
- Vinkler and Vítek [2019] Marek Vinkler and Jan L. Vítek. Drying and shrinkage of massive concrete wall segments - 3 years experiment and analytical observations. Materials and Structures, 52(2), 2019. doi: 10.1617/s11527-019-1329-x.
- Hlobil and Kumpová [2023] Michal Hlobil and Ivana Kumpová. A collection of three-dimensional datasets of hydrating cement paste. Data in Brief, 46:108903, 2023. ISSN 2352-3409. doi: 10.1016/j.dib.2023.108903.
- Walraven et al. [2013] Joost Walraven, Agnieszka Bigaj van Vliet, et al. fib Model Code for Concrete Structures 2010. Ernst & Sohn, 2013. ISBN 978-3-433-03061-5.
- Sovják et al. [2018] Radoslav Sovják, Petr Havlásek, and Jan Vítek. Long-term behavior of concrete slabs prestressed with cfrp rebars subjected to four-point bending. Construction and Building Materials, 188:781–792, 2018. ISSN 0950-0618. doi: 10.1016/j.conbuildmat.2018.08.084.
- Brouwers [2004] H. J. H. Brouwers. The work of Powers and Brownyard revisited: Part 1. Cement and Concrete Research, 34(9):1697–1716, 2004. doi: 10.1016/j.cemconres.2004.05.031. URL https://www.sciencedirect.com/science/article/abs/pii/S0008884604002352.