Crystal Structure Prediction and Phase Stability in Highly Anharmonic Silver-Based Chalcohalide Anti-Perovskites
Abstract
Silver-based chalcohalide anti-perovskites (CAP), Ag3BC (B = S, Se; C = Cl, Br, I), represent an emerging family of energy materials with intriguing optoelectronic, vibrational and ionic transport properties. However, the structural features and phase stability of CAP remain poorly investigated to date, hindering their fundamental understanding and potential integration into technological applications. Here we employ theoretical first-principles methods based on density functional theory to fill this knowledge gap. Through crystal structure prediction techniques, ab initio molecular dynamics simulations, and quasi-harmonic free energy calculations, we unveil a series of previously overlooked energetically competitive phases and temperature-induced phase transitions for all CAP. Specifically, we identify a new cubic structure as the stable phase of all CAP containing S both at zero temperature and K conditions. Consequently, our calculations suggest that the cubic phase identified in room-temperature X-ray diffraction experiments is likely to be metastable. Furthermore, for CAP containing Se, we propose different orthorhombic ( and ) and cubic () structures as the ground-state phases and reveal several phase transformations induced by temperature. This theoretical investigation not only identifies new candidate ground-state phases and solid-solid phase transformations for all CAP but also provides insights into potential stability issues affecting these highly anharmonic superionic materials.
I Introduction
Silver-based chalcohalide anti-perovskites (CAP) with chemical formula Ag3BC (B = S, Se; C = Cl, Br, I) are structurally similar to the lead halide perovskites (e.g., CsPbI3), with the “anti” designation indicating the exchange of anions and cations compared to the typical ionic perovskite arrangement. Analogous to lead halide perovksites, CAP are highly promising materials for energy and optoelectronic applications, boasting low toxicity due to their lead-free composition palazon22 ; ghorpade23 . The two most extensively studied CAP compounds, Ag3SBr and Ag3SI, possess experimentally determined band gaps of approximately eV luna23 ; cano24 , rendering them favorable for photovoltaic applications. These have been also recognized as room-temperature superionic conductors takahashi66 ; hull04 . Owing to their substantial vibrational anharmonicity and intriguing transport properties wakamura90 ; sakuma85 , CAP have been also investigated as potential thermoelectric materials kawamura80 ; magistris72 .
The current surge in interest in CAP is evident from the recent publication of several experimental works detailing improved synthesis methods. The pioneering synthesis of the archetypal CAP Ag3SI and Ag3SBr dates back to , credited to Reuter and Hardel reuter60 . However, the majority of early CAP synthesis techniques required vacuum conditions, elevated temperatures ( K), and prolonged synthesis durations, often spanning during days or even months. More recently, rapid synthesis routes have emerged, enabling the production of high-purity Ag3SI and Ag3SBr powders at temperatures below K through mechanochemistry methods luna23 . Furthermore, advancements have also led to the synthesis of CAP solid solutions, such as Ag3SBrxI1-x (), employing a rapid solution-based chemical approach at moderate temperatures ( K) cano24 .

Despite these recent experimental advances in synthesis, the phase stability and structural properties of CAP remain inadequately investigated and understood to date. For both Ag3SBr and Ag3SI, three distinct polymorphs have been consistently reported: a low-temperature phase (– K), a room-temperature phase denoted as with low ionic conductivity, and an phase at high temperatures ( K) exhibiting high ionic Ag+ conductivity and S-/I- or S-/Br- chemical disorder hoshino78 ; sakuma80 ; hoshino81 . Regarding Ag3SCl and other CAP compounds containing Se, to the best of our knowledge, there is no experimental data available concerning their structural and phase stability properties.
In the original reports by Hoshino et al. hoshino78 ; sakuma80 ; hoshino81 , the low-temperature phase was described as trigonal with space group for Ag3SI and orthorhombic with space group for Ag3SBr. The room-temperature phase for both Ag3SI and Ag3SBr was identified as cubic with space group and the high-temperature disordered phase as cubic with space group hull04 ; cho94 ; yin20 . Additionally, a metastable room-temperature phase exhibiting high ionic conductivity, denoted as and obtained through quenching of the phase, has been reported for Ag3SI hull04 ; cho94 . However, subsequent studies on Ag3SBr suggested that the crystal symmetry of the low-temperature phase could be more accurately described as monoclinic or triclinic, rather than orthorhombic honda07 . Furthermore, investigations into several Ag3SBrxI1-x solid solutions revealed that for a range of mixed compositions, the low-temperature phase was orthorhombic with space group or honda07 .
Since all existing CAP synthesis methods involve temperatures above ambient conditions, temperatures at which Ag3SI and Ag3SBr exhibit ionic conductivity, it is highly probable that upon annealing the samples remain dynamically arrested in metastable states characterized by ionic disorder. This phenomenon is originated by the existence of significant energy barriers that hinder the transition towards energetically more favorable and ordered phases. A similar behavior has been recently demonstrated for halide hybrid perovskites shahrokhi22 . This tendency poses a significant challenge in identifying truly stable low-temperature phases in CAP. Systematic studies able to precisely evaluate the relative stability among different CAP polymorphs are therefore urgently needed. Such investigations are crucial for improving our fundamental understanding of CAP and to properly assess their potential for possible technological applications.
In this study, we employ theoretical first-principles methods based on density functional theory to discern candidate stable phases for all CAP compounds at both zero-temperature and conditions. Notably, the predicted lowest-energy CAP phases, systematically identified through crystal structure prediction, ab initio molecular dynamics, and quasi-harmonic free energy techniques, differ from those previously reported in experimental studies. Therefore, besides providing original and valuable data for Ag3SCl and other CAP compounds containing Se, the present study prompts a reassessment of the established phase diagrams for Ag3SI and Ag3SBr, urging further experimental investigations into CAP.

II Results
II.1 Zero-temperature crystal structure prediction
We conducted zero-temperature crystal structure prediction (CSP) calculations for the two archetypal CAP compounds, Ag3SBr and Ag3SI, using the MAGUS software magus and considering a maximum of atoms per unit cell (Methods). MAGUS employs an evolutionary algorithm augmented with machine learning techniques and graph theory. The initial structures proposed by MAGUS were subsequently relaxed using first-principles methods based on density functional theory (DFT, Methods). Figure 1 illustrates some of the energetically most favorable phases identified in the rankings resulting from our CSP-DFT calculations (additional structural representations can be found in Supplementary Fig.1). Notable among them are two distinct cubic structures with space group , an orthorhombic phase, a monoclinic phase and a trigonal phase.
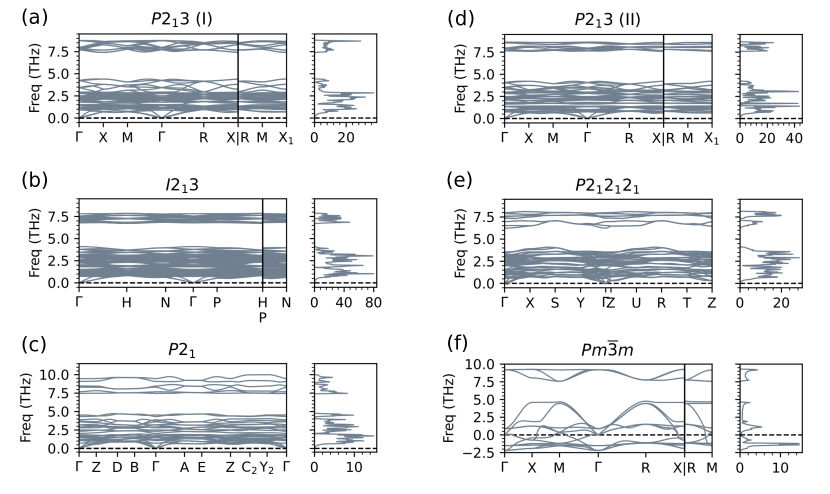
Figure 2 presents the structure energy rankings obtained for Ag3SBr and Ag3SI using various DFT semilocal exchange-correlation energy functionals, including LDA lda , PBE pbe , PBEsol pbesol and SCAN scan . For Ag3SBr, all the examined DFT functionals consistently identify the cubic (I) structure as the ground-state phase (Fig.2a). At K conditions, the second energetically most favorable structure is an orthorhombic phase, followed by a cubic (II) and a trigonal phase. Notably, the PBE functional is the sole functional predicting the cubic (II) phase to be marginally more favorable than the orthorhombic phase. Incorporating spin-orbit coupling (SOC) effects in the DFT calculations appears inconsequential for determining the most energetically competitive phases, as indicated by the similarity between the PBEsol and PBEsol+SOC curves.
Remarkably, our crystal CSP-DFT calculations do not classify the orthorhombic or the cubic phases as energetically competitive, despite their proposal as the and phases of Ag3SBr from experiments hoshino78 ; sakuma80 ; hoshino81 . Consistently, across all the examined DFT functionals, the energy of these two phases is several hundreds of meV per formula unit (f.u.) higher than that of the theoretical ground state, the cubic (I) phase (Fig.2a).
For Ag3SI, the energy ranking is also dominated by the cubic (I) phase, closely followed by a monoclinic phase (Fig.2b). However, the PBE functional deviates from the other energy functionals, suggesting an orthorhombic phase as the ground state. In this case, accounting for SOC effects in the DFT calculations neither poses a significant variation in the energy difference results, as evidenced by the nearly identical curves for PBEsol and PBEsol+SOC. Another cubic (II) phase emerges as energetically competitive across all surveyed DFT functionals.
Likewise to Ag3SBr, the energy of the experimentally observed low-temperature trigonal and room-temperature cubic phases of Ag3SI is estimated to be substantially higher than that of the corresponding ground-state phase ( eV/f.u.) by all the examined functionals. It is worth noting the similarity in energy among the trigonal and phases identified in our CSP-DFT calculations and the experimentally identified trigonal phase, which stems from their structural resemblance.
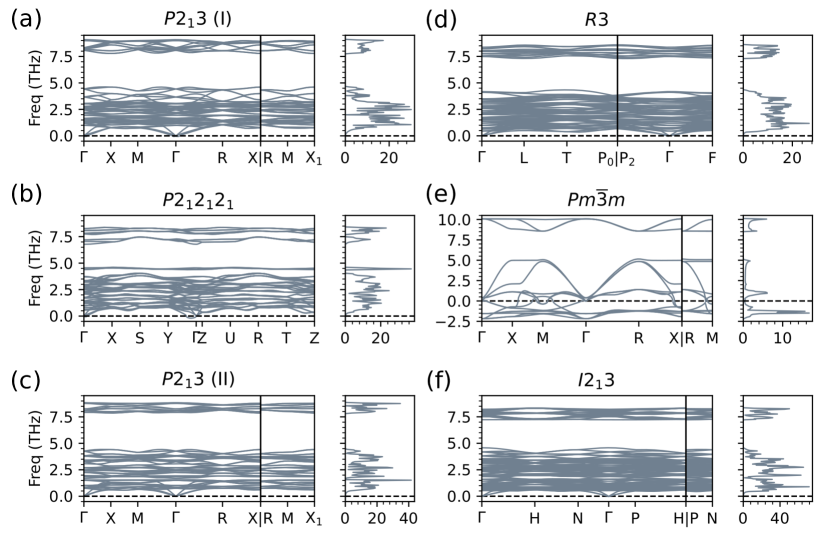
Figures 3–4 show the vibrational phonon spectra calculated for the four most energetically favorable structures determined for Ag3SBr and Ag3SI at zero temperature, respectively, along with those of the cubic phase and another cubic phase introduced in the next section. Across the four predicted stable polymorphs, we observe no imaginary phonon frequencies along their high-symmetry reciprocal space paths, indicating their vibrational stability. Notably, all these phases exhibit a wide frequency band gap spanning approximately from to THz, with the exception of the orthorhombic phase that displays slightly lower frequencies in the high-frequency regime.
Conversely, the cubic phase, proposed as the room-temperature phase of both Ag3SBr and Ag3SI sakuma80 ; hoshino81 , exhibits numerous imaginary phonon frequencies along all high-symmetry reciprocal space paths, indicating its vibrational instability at K conditions. A possible -induced stabilization of this cubic phase will be discussed further in Sec.III. Additionally, the orthorhombic phase, suggested as the low-temperature phase of Ag3SBr sakuma80 ; hoshino81 , exhibits also abundant imaginary phonon frequencies (Supplementary Fig.2). Consequently, this phase is vibrationally unstable at low temperatures and, even ignoring its highly unfavourable energy, cannot be regarded as the ground-state phase. On the contrary, the trigonal phase, proposed as the low-temperature phase of Ag3SI sakuma80 ; hoshino81 , appears to be vibrationally stable at K conditions (Supplementary Fig.2); however, in view of its high energy (Fig.2b), this phase should be regarded as metastable in the low-temperature regime.
As demonstrated in this section, our CSP-DFT calculations yield a significantly different set of candidate ground-state phases compared to those experimentally suggested for Ag3SBr and Ag3SI. Specifically, a cubic phase consistently emerges as the most energetically favorable phase at low temperatures in our calculations, closely followed by an orthorhombic and a monoclinic phase, depending on the material. Importanly, these new candidate ground-state phases are all shown to be vibrationally stable, contrasting with, for example, the orthorhombic phase proposed as the lowest energy structure of Ag3SBr. Consequently, our theoretical findings call for a reevaluation of previous experimental characterizations of CAP conducted at low temperatures.
II.2 Finite-temperature crystal structure prediction
The observed low-temperature vibrational instability of the cubic phase (Figs.3–4), proposed as the room-temperature phase of both Ag3SBr and Ag3SI sakuma80 ; hoshino81 , prompted us to perform comprehensive ab initio molecular dynamics (AIMD) simulations at K conditions (Methods). The primary objective of these dynamical simulations was to assess the vibrational stability of this phase at finite temperatures as well as to evaluate its ionic transport properties. All the results presented in what follows, if not stated otherwise, were obtained with the semilocal PBEsol exchange-correlation energy functional pbesol .
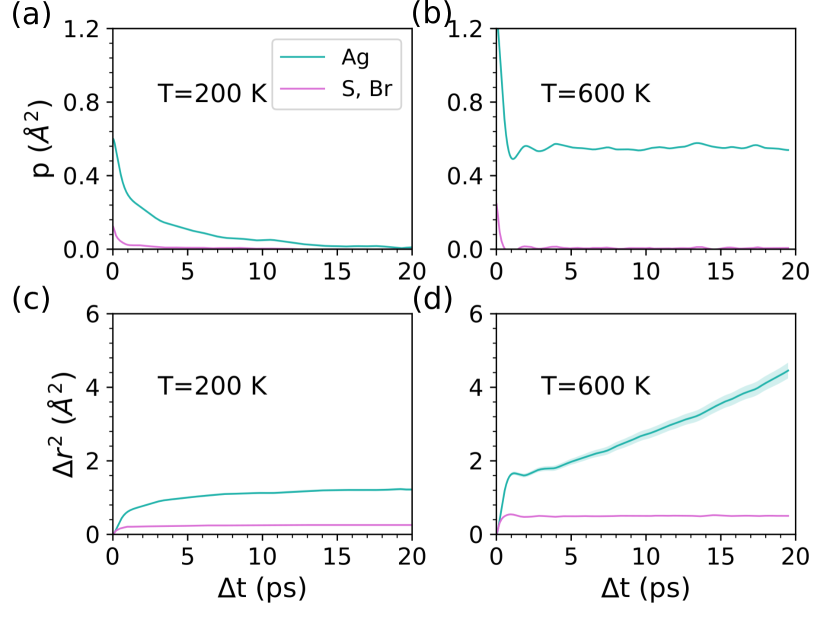
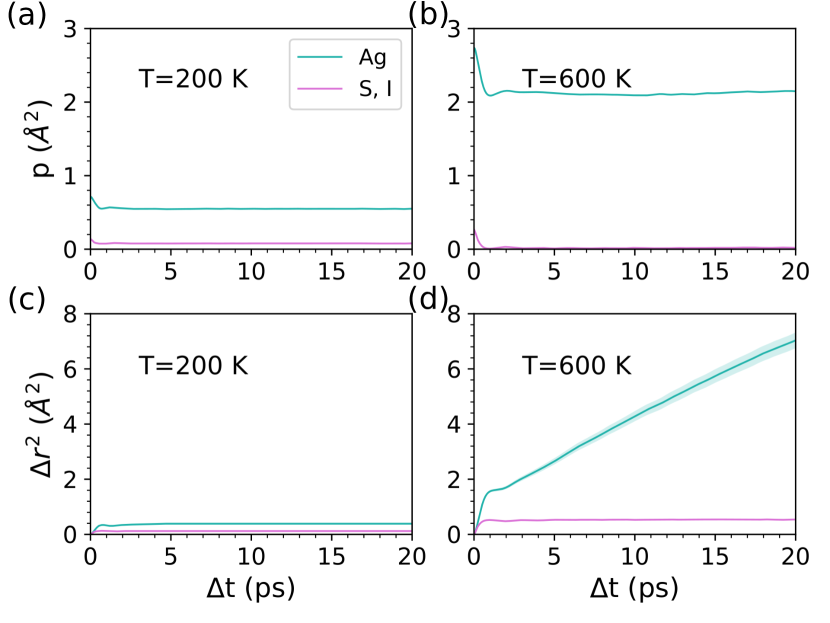
Figure 5 shows the position correlation function, , and mean square displacement, , estimated for Ag3SBr at and K. These time-dependent functions are defined as cazorla12 ; cazorla14 :
| (1) | |||
| (2) |
where represents the position vector of atom , an arbitrary time origin, the position vector of the equilibrium lattice site for atom , and thermal average performed over particles and time origins.
At , is simply the vibrational mean square displacement. The crystal is vibrationally stable if , because the vibrational displacements at widely separated times become uncorrelated. Conversely, if the atoms acquire a permanent vibrational displacement, becomes nonzero. On the other hand, in the absence of ionic diffusion, converges to a constant equal to twice the vibrational mean square displacement in the limit . Contrarily, in the presence of ionic diffusion, exhibits a linear dependence on with a positively defined slope at sufficiently long times.
The and results presented in Fig.5 indicate that Ag3SBr in the cubic phase is vibrationally stable at K and exhibits significant Ag ionic diffusion at K. The slow decay of and large asymptotic value of estimated for Ag ions at K indicate high anharmonicity, despite of the low temperature. In contrast, the and results presented in Fig.6 indicate a markedly different behavior for Ag3SI. Specifically, the vibrational centers of Ag ions somewhat change throughout the K simulation, , since for these atoms. Furthermore at high temperatures, the Ag ionic diffusion is appreciably higher in Ag3SI than in Ag3SBr.
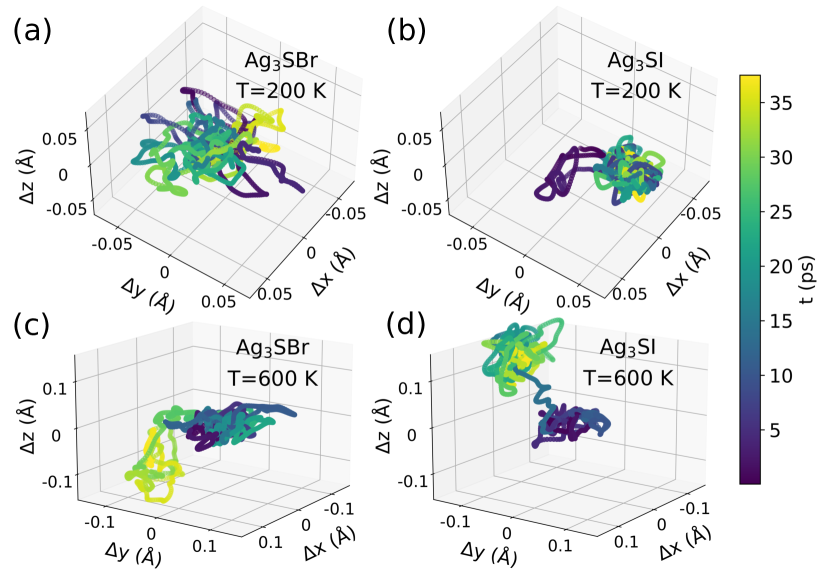
Figure 7 shows the simulated trajectory of an arbitrary silver ion in Ag3SBr and Ag3SI at different temperatures. At K, the map of position points is more anisotropic for Ag3SI than for Ag3SBr. Specifically, multiple vibrational centers can be identified for Ag3SI (Fig.7b), whereas they are not observed for Ag3SBr (Fig.7a). Notably, the amplitude of the ionic vibrations in Ag3SBr is very wide, thus denoting high anharmonicity. These observations are consistent with the results presented in Figs.5–6 for Ag ions. At K, on the other hand, silver ionic hoppings are clearly observed in both compounds, illustrating their superionic character at high temperatures.
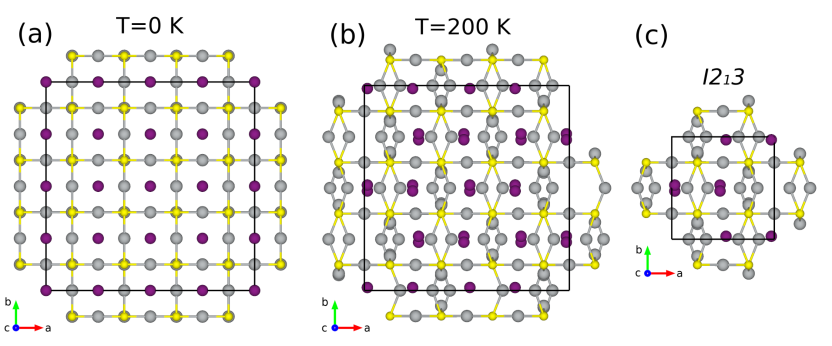
In an attempt to identify the crystal structure towards which Ag3SI appears to transform from the cubic phase, we performed annealing (i.e., zero-temperature geometry relaxation) on a series of supercell configurations extracted from the AIMD runs (Fig.8). Figure 8b shows the lowest-energy configuration obtained through this process, which contains a total of atoms. Using the FINDSYM software findsym , this supercell was efficiently reduced to a cubic -atom primitive cell with space group (Fig.8c). Interestingly, this new cubic phase was found to be vibrationally stable at low temperatures for both Ag3SBr and Ag3SI (Figs.3–4). As discussed in the next section, this new cubic phase was also found to be energetically competitive with respect to the ground-state phases determined for most silver chalcohalide anti-perovskite (CAP).
| Compound | Structure | Symmetry | (Å) | (Å) | (Å) | (meV/f.u.) | (meV/f.u.) | |||
|---|---|---|---|---|---|---|---|---|---|---|
| Ag3SCl | Cubic | (I) | 7.478 | 7.478 | 7.478 | 90.000 | 90.000 | 90.000 | 0 | 0 |
| Orthorhombic | 4.502 | 4.455 | 20.715 | 90.000 | 90.000 | 90.000 | 65 | 64 | ||
| Orthorhombic | 5.872 | 9.757 | 6.877 | 90.000 | 90.000 | 90.000 | 79 | 78 | ||
| Cubic | (II) | 7.499 | 7.499 | 7.499 | 90.000 | 90.000 | 90.000 | 89 | 89 | |
| Cubic | 9.389 | 9.389 | 9.389 | 90.000 | 90.000 | 90.000 | 181 | – | ||
| Cubic | 4.750 | 4.750 | 4.750 | 90.000 | 90.000 | 90.000 | 627 | – | ||
| Ag3SBr | Cubic | (I) | 7.586 | 7.586 | 7.586 | 90.000 | 90.000 | 90.000 | 0 | 0 |
| Orthorhombic | 4.518 | 4.531 | 21.152 | 90.000 | 90.000 | 90.000 | 79 | 77 | ||
| Cubic | (II) | 7.602 | 7.602 | 7.602 | 90.000 | 90.000 | 90.000 | 91 | 90 | |
| Cubic | 9.446 | 9.446 | 9.446 | 90.000 | 90.000 | 90.000 | 117 | 109 | ||
| Trigonal | 8.140 | 8.140 | 8.140 | 109.075 | 109.075 | 109.075 | 121 | 115 | ||
| Cubic | 4.793 | 4.793 | 4.793 | 90.000 | 90.000 | 90.000 | 538 | – | ||
| Ag3SI | Cubic | (I) | 7.734 | 7.734 | 7.734 | 90.000 | 90.000 | 90.000 | 0 | 0 |
| Cubic | 9.568 | 9.568 | 9.568 | 90.000 | 90.000 | 90.000 | 53 | 47 | ||
| Monoclinic | 6.176 | 6.984 | 5.656 | 90.000 | 90.000 | 93.869 | 55 | 55 | ||
| Cubic | (II) | 7.739 | 7.739 | 7.739 | 90.000 | 90.000 | 90.000 | 67 | 73 | |
| Orthorhombic | 4.563 | 4.612 | 21.767 | 90.000 | 90.000 | 90.000 | 79 | 77 | ||
| Cubic | 4.869 | 4.869 | 4.869 | 90.000 | 90.000 | 90.000 | 516 | – | ||
| Ag3SeCl | Orthorhombic | 5.879 | 10.014 | 6.980 | 90.000 | 90.000 | 90.000 | 0 | 0 | |
| Orthorhombic | (I) | 4.688 | 4.475 | 21.053 | 90.000 | 90.000 | 90.000 | 4 | 4 | |
| Orthorhombic | (II) | 5.761 | 5.743 | 12.651 | 90.000 | 90.000 | 90.000 | 38 | 39 | |
| Orthorhombic | 6.347 | 6.450 | 9.966 | 90.000 | 90.000 | 90.000 | 43 | 38 | ||
| Cubic | 9.626 | 9.626 | 9.626 | 90.000 | 90.000 | 90.000 | 117 | – | ||
| Cubic | 4.930 | 4.930 | 4.930 | 90.000 | 90.000 | 90.000 | 1072 | – | ||
| Ag3SeBr | Orthorhombic | (I) | 4.706 | 4.562 | 21.452 | 90.000 | 90.000 | 90.000 | 0 | 0 |
| Orthorhombic | (II) | 7.530 | 14.614 | 4.365 | 90.000 | 90.000 | 90.000 | 10 | 9 | |
| Cubic | 9.678 | 9.678 | 9.678 | 90.000 | 90.000 | 90.000 | 41 | 37 | ||
| Cubic | (I) | 7.739 | 7.739 | 7.739 | 90.000 | 90.000 | 90.000 | 47 | 46 | |
| Cubic | (II) | 7.737 | 7.737 | 7.737 | 90.000 | 90.000 | 90.000 | 49 | 48 | |
| Cubic | 4.962 | 4.962 | 4.962 | 90.000 | 90.000 | 90.000 | 916 | – | ||
| Ag3SeI | Cubic | 9.782 | 9.782 | 9.782 | 90.000 | 90.000 | 90.000 | 0 | 0 | |
| Orthorhombic | 4.761 | 4.653 | 21.970 | 90.000 | 90.000 | 90.000 | 19 | 22 | ||
| Trigonal | 6.949 | 6.949 | 8.388 | 90.000 | 90.000 | 120.000 | 52 | 51 | ||
| Monoclinic | 7.708 | 7.225 | 15.533 | 90.000 | 90.000 | 144.418 | 66 | 70 | ||
| Cubic | (I) | 7.978 | 7.978 | 7.978 | 90.000 | 90.000 | 90.000 | 69 | 68 | |
| Cubic | 5.022 | 5.022 | 5.022 | 90.000 | 90.000 | 90.000 | 842 | – |
II.3 Zero-temperature phase competition
After the detailed study of the structural and vibrational properties of Ag3SBr and Ag3SI, we extended our investigation to other materials in the CAP family, namely, Ag3SCl, Ag3SeCl, Ag3SeBr and Ag3SeI. It is worth noting that, to the best of our knowledge, there are not experimental reports on these compounds in the literature. For each new CAP, we began by relaxing the lowest-energy phases identified for the archetypal compounds Ag3SBr and Ag3SI, using the semilocal PBEsol exchange-correlation energy functional pbesol . The cubic phase discovered from the AIMD simulations performed for Ag3SI and the experimental room-temperature cubic phase, were additionally considered in our pool of candidate ground-state phases.
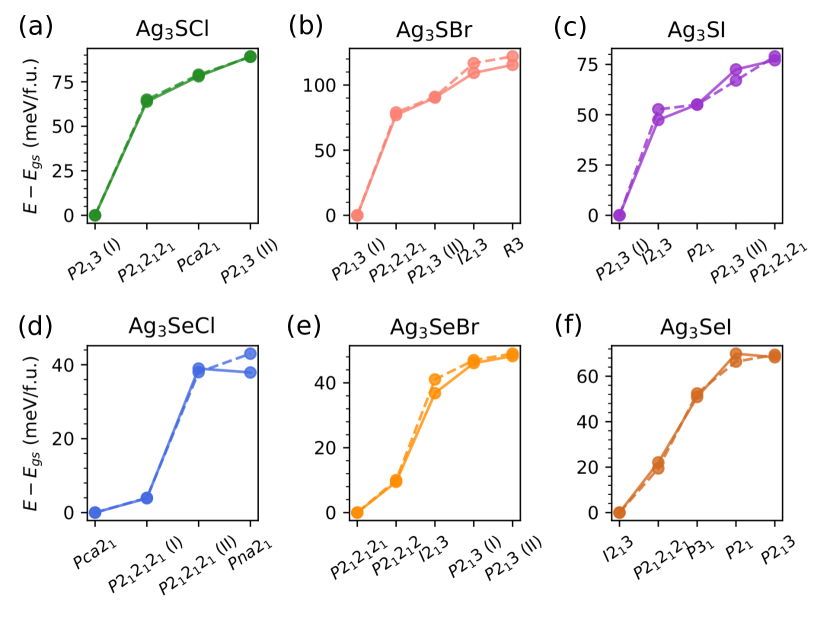
Figure 9 and Table 1 summarize our zero-temperature DFT structure energy rankings obtained for the CAP family. For Ag3SBr and Ag3SI, the primary difference compared to the results in Fig.2 is the inclusion of the new cubic phase. This phase has an energy only meV/f.u. higher than the cubic (I) ground-state phase in Ag3SI, and approximately meV/f.u. higher than the same ground-state phase in Ag3SBr. For the analogous Se-based CAP, the cubic phase is even more relevant; it has the lowest energy for Ag3SeI, and for Ag3SeBr its energy is only about meV/f.u. higher than that of the orthorhombic ground-state phase (Fig.9).
The ground-state phase of all analyzed S-based CAP corresponds to the cubic (I) phase, which in the Ag3SCl system is closely followed by two orthorhombic phases with symmetries and . Regarding the Se-based CAP, in Ag3SeCl and Ag3SeBr, the lowest-energy phases are dominated by orthorhombic phases (e.g., and ), the cubic phase being the most significant energy competitor presenting a different crystal symmetry. In the specific case of Ag3SeI, a trigonal and a monoclinic phase were also ranked among the lowest-energy structures.
We computed the lattice phonon spectrum of the experimental room-temperature cubic phase and the five energetically most favourable structures found for Ag3SCl, Ag3SeCl, Ag3SeBr and Ag3SeI (Supplementary Figs.3–6). Without any exception, we found that the cubic phase always exhibits abundant imaginary phonon frequencies. The cubic phase is also vibrationally unstable for Ag3SCl and Ag3SeCl at low temperatures (Supplementary Figs.3–4). However, the remaining phases are perfectly vibrationally stable for all the targeted CAP (Supplementary Figs.3–6).
For the structures that exclusively exhibited real and positively defined phonon frequencies, we corrected their zero-temperature energies to account for likely quantum zero-point effects (ZPE) cazorla17 ; cazorla09 ; cazorla22 . It is worth noting that applying quasi-harmonic (QH) approaches to materials that exhibit imaginary phonon frequencies is neither physically nor mathematically well-justified cazorla17 . Thus, any QH result obtained for phases that exhibit imaginary phonon frequencies (e.g., the cubic phase for all CAP compounds) cannot be rigorously trusted as quantitatively correct yin20 . As shown in Fig.9 and Table 1, accounting for quantum ZPE has a practically negligible effect on the energy rankings obtained using classical mechanics. Only in the specific cases of Ag3SeCl and Ag3SeI, quantum ZPE exchange the ordering between the third and fourth and the fourth and fifth most energetically favourable phases, respectively.
II.4 Finite-temperature phase competition
To predict likely -induced phase transitions across the CAP family, we applied the QH free-energy formalism cazorla17 ; cazorla09 ; cazorla22 to all the phases reported in Fig.9 that were vibrationally stable at low temperatures. It is worth emphasizing that applying QH approaches to phases that exhibit imaginary phonon frequencies is neither physically nor mathematically well-justified cazorla17 . Consequently, phases like the cubic and orthorhombic in Ag3SBr, for example, were excluded from our phase competition analysis conducted at K conditions.
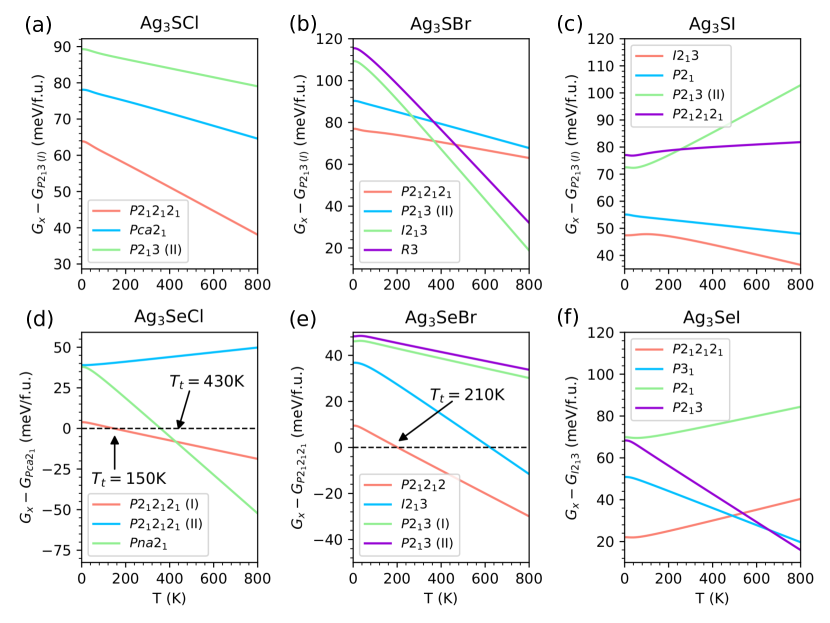
Figure 10 shows the QH (Helmholtz) free-energy differences estimated as a function of temperature for the six CAP compounds targeted in this study. At a given temperature, the phase exhibiting the lowest free energy () is the equilibrium, or stable, phase. The remaining phases, which are vibrationally stable in principle, are considered metastable. A -induced phase transition occurs when the free-energy curve of the equilibrium phase crosses the free-energy curve of a metastable phase. The temperature at which this crossing occurs defines the corresponding phase transition temperature.
For the S-based CAP, we did not find any -induced phase transition up to K as evidenced by the lack of curve crossings involving the cubic (I) phase. Considering higher temperatures probably is not physically meaningful due to the imminent stabilization of the liquid phase luna23 ; cano24 . Several curve crossings involving pairs of metastable phases are observed in Figs.10b–c; however, such metastable phase transitions are not of interest in this study. Consequently, according to our QH free-energy DFT calculations, the cubic (I) phase, rather than the cubic phase, is the equilibrium, or stable, phase of Ag3SCl, Ag3SBr and Ag3SI at room temperature.
For the Se-based CAP, the equilibrium between different phases is appreciably affected by temperature. Specifically, we predict two phase transitions for Ag3SeCl: the first occurrs between the two orthorhombic phases and (I) at K, and the second between the two orthorhombic phases (I) and at K (Fig.10d). For Ag3SeBr, another phase transition is predicted to occur between the two orthorhombic phases (I) and (II) at K (Fig.10e). Finally, for Ag3SeI no -induced phase transition is observed (Fig.10f). Consequently, according to our QH free-energy DFT calculations, the equilibrium room-temperature phase is orthorhombic for Ag3SeCl and Ag3SeBr, and cubic for Ag3SeI.
III Discussion
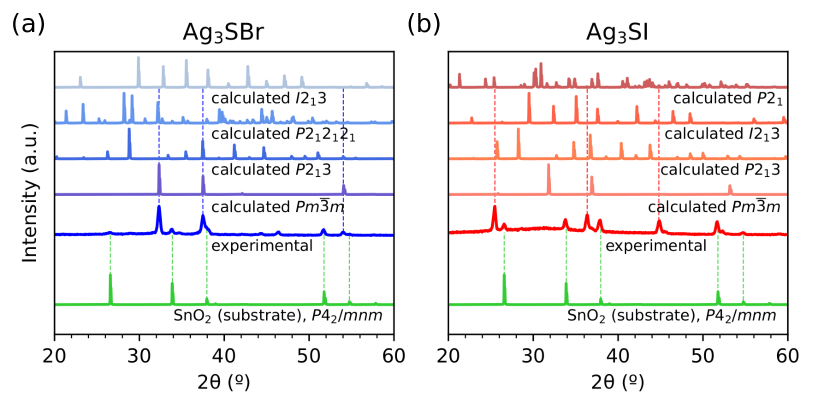
Figure 11 shows the experimental X-ray diffraction patterns obtained for two Ag3SBr and Ag3SI samples synthesized through the chemical route detailed in work cano24 (Methods). At room temperature, based on phase identification protocols using Rietveld fits, the Ag3SBr polycrystal was optimally indexed as cubic and the Ag3SI polycrystal as cubic (due to the presence of ionic disorder). In the same plot, the theoretical X-ray diffraction patterns of several phases obtained from our DFT simulations are included for comparison. The experimental X-ray diffraction pattern of the Ag3SBr sample perfectly agrees with the theoretical X-ray diffraction pattern of the simulated cubic phase (Fig.11a). On the other hand, the experimental X-ray diffraction pattern of the Ag3SI sample cannot be assigned to the theoretical X-ray diffraction pattern of any single ordered structure (Fig.11b).
The experimental X-ray diffraction patterns enclosed in Fig.11, along with the computational ab initio findings presented in the preceding sections, raise the following question: why is the cubic phase, or a similar disordered phase, experimentally observed in Ag3SBr and Ag3SI at room temperature, instead of the theoretically predicted equilibrium cubic phase? Although we cannot provide a definitive answer to this question, we can offer some reasonable hypotheses.
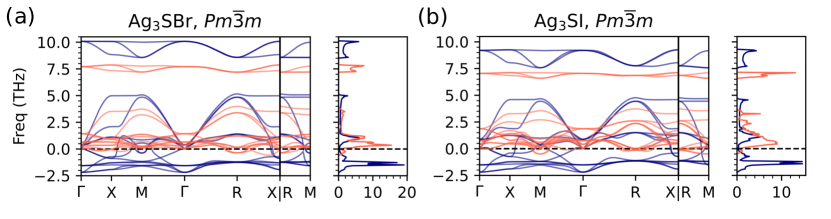
First, it is noted that despite the cubic phase being vibrationally unstable at very low temperatures (Figs.3–4), it could be stabilized by increasing temperature, similar to what is observed in archetypal oxide perovkites ehsan22 ; cazorla24 . To evaluate this possibility, we computed the -renormalized phonon spectrum of this phase for Ag3SBr and Ag3SI following a dynamical normal-mode-decomposition technique (Methods) dynaphopy . Using a relatively small supercell for the AIMD simulations ( K) involved in this phonon renormalization process to maintain high numerical accuracy (Supplementary Discussion and Supplementary Fig.7), we found that the cubic phase is practically vibrationally stabilized by thermal effects (Fig.12).
Importantly, a few imaginary phonon frequencies are still present in the -renormalized vibrational spectra shown in Fig.12, which precluded us from estimating the QH free energy of the cubic phase and compare it with those of other phases. It is noted that when performing -renormalized phonon calculations at temperatures higher than K, the number of imaginary phonon frequencies increased due to the appearance of ionic diffusion in the AIMD simulations. Nevertheless, despite all these technical complexities and possible numerical artifacts (Supplementary Discussion), it seems reasonable to think that the highly anharmonic cubic phase can be fully vibrationally stabilized by effect of temperature.
Based on the presented theoretical findings, our main hypothesis is that current synthesis methods, all of which involve temperatures significantly higher than K, inevitably trap CAP compounds into metastable states. A key feature, possibly explaining the room-temperature metastability of the synthesized CAP compounds, may be superionicity. According to our AIMD simulations (Supplementary Figs.8–9), Ag3SBr in the cubic phase becomes superionic at K. On other hand, the equibrium cubic phase exhibits no ionic diffusivity at room temperature. Consequently, it is likely that at temperatures higher than K, such as those involved in CAP synthesis methods, the cubic phase is further stabilized due to the entropy gain that accompanies ionic diffusion, eventually becoming the equilibrium phase. (Unfortunately, this type of entropy enhancement currently cannot be reproduced by our QH free-energy DFT calculations.) In that hypothetical case, it seems plausible that upon annealing the system becomes trapped in the cubic phase with little possibility to nucleate the equilibrium ordered phase corresponding to lower temperatures.
IV Conclusions
For the highly anharmonic and archetypal CAP compounds Ag3SBr and Ag3SI, our systematic, comprehensive and technically sound first-principles study suggest a completely different set of stable phases, both at zero temperature and K conditions, compared to what has been proposed from experiments. Specifically, a new cubic phase is found to exhibit the lowest energy at K and the lowest free energy at finite temperatures, being several hundreds of meV per formula unit lower than the experimentally proposed trigonal and orthorhombic phases. Additionally, we propose different ground-state phases and -induced phase transitions for the less investigated CAP compounds Ag3SCl, Ag3SeCl, Ag3SeBr and Ag3SeI.
An interesting consequence of our theoretical findings is that the cubic phase experimentally observed at room temperature may be metastable. The relatively high temperatures involved in current synthesis methods and the significant superionicity of CAP above room temperature may be key factors in understanding this metastability. It is worth noting that metastable phases have a natural tendency to fluctuate between different energy states, which may pose stability issues for practical technological applications. Thus, the present computational study calls for a revision of the assumed phase diagram of CAP compounds and motivates new structural characterization experiments conducted under varying temperature conditions, particularly in the low-temperature regime.
Methods
First-principles calculations outline. Ab initio calculations based on density functional theory (DFT)
cazorla17 were performed to analyse the structural and phase stability properties of CAP. We performed these
calculations with the VASP code vasp using different approximations to the exchange-correlation energy, namely,
the semi-local functionals LDA lda , PBE pbe , PBEsol pbesol and SCAN scan . The projector
augmented-wave method was used to represent the ionic cores bloch94 and the following electronic states were
considered as valence: Ag , S , Se , Cl , Br , I . Wave functions
were represented in a plane-wave basis typically truncated at eV. By using these parameters and dense -point
grids for reciprocal-space integration (e.g., of for the cubic phase), the
resulting zero-temperature energies were converged to within meV per formula unit. In the geometry relaxations, a
force tolerance of eVÅ-1 was imposed.
Harmonic and anharmonic phonon and free-energy calculations. The second-order interatomic force constant of all CAP and resulting harmonic phonon spectrum were calculated with the finite-differences method as is implemented in the PhonoPy software phonopy . Large supercells (e.g., for the cubic phase containing atoms) were employed for all the targeted structures. Zero-point energy (ZPE) corrections and finite-temperature Helmholtz free energies () were calculated within the quasi-harmonic approximation cazorla17 ; cazorla09 ; cazorla22 . Due to the large number of materials and phases analyzed in this study, thermal expansion effects were disregarded in our ZPE and calculations.
The DynaPhoPy code dynaphopy was used to calculate the anharmonic lattice dynamics (i.e., -renormalized phonons) of Ag3SBr and Ag3SI in the cubic phase from ab initio molecular dynamics (AIMD) simulations. In this case, a reduced supercell and k-point grid for reciprocal-space sampling were employed in the AIMD simulations to maintain high numerical accuracy (Supplementary Discussion).
A normal-mode-decomposition technique was employed in which the atomic velocities ( and represent particle and Cartesian direction indexes) generated during fixed-temperature AIMD simulation runs were expressed like:
| (3) |
where is the number of particles, the mass of particle , a phonon mode eigenvector (q and stand for the wave vector and phonon branch), the equilibrium position of particle , and the velocity of the corresponding phonon quasiparticle.
The Fourier transform of the autocorrelation function of then was calculated, yielding the power spectrum:
| (4) |
Finally, this power spectrum was approximated by a Lorentzian function of the form:
| (5) |
from which a -renormalized quasiparticle phonon frequency, , was determined as the peak position,
and the corresponding phonon linewidth, , as the full width at half maximum.
First-principles molecular dynamics simulations. Ab initio molecular dynamics simulations based on DFT were
performed in the canonical ensemble (i.e., constant number of particles, volume and temperature). The selected
volumes were those determined at zero temperature hence thermal expansion effects were neglected. The temperature in the AIMD
simulations was kept fluctuating around a set-point value by using Nose-Hoover thermostats. Large simulation boxes containing
– atoms were employed (e.g., for the cubic phase we adopted a
supercell contaning atoms) and periodic boundary conditions were applied along the three supercell lattice vectors.
Newton’s equations of motion were integrated using the customary Verlet’s algorithm with a time step of ps.
-point sampling for reciprocal-space integration was employed in most of the AIMD simulations, which comprised long
simulation times of – ps.
Crystal structure searches. We used the MAGUS software (Machine learning And Graph theory assisted Universal
structure Searcher) magus to find new candidate stable and metastable phases for the archetypal CAP Ag3SBr
and Ag3SI. This crystal structure prediction software employs an evolutionary algorithm augmented with machine learning
and graph theory to reduce the cost of the geometry optimizations. The crystal phase searches were conducted for structures
containing a maximum of formula units (i.e., atoms per unit cell).
Experimental procedure. Ag3SBr and Ag3SI were synthesized following the chemical route described in work
cano24 . The samples were analyzed through X-ray diffraction using a Bruker D8 advanced diffractometer equipped with
a Cu-based tube ( kV, mA) and a Sol-X detector with discriminator for the line and fluorescence effect
reduction. The measurements were made using grazing incidence configuration.
Data availability
The data that support the findings of this study are freely available at the NOMAD data management platform for
materials science nomad1 . These data include the VASP input files of our first-principles DFT calculations
as well as some key output files (e.g., relaxed atomic positions of all relevant crystal structures) nomad2 .
Acknowledgements
C.C. acknowledges support from the Spanish Ministry of Science, Innovation and Universities under the fellowship
RYC2018-024947-I and grants PID2020-112975GB-I00 and grant TED2021-130265B-C22. The authors also thankfully acknowledge
technical support the computational resources at MareNostrum4 provided by Barcelona Supercomputing Center (FI-2023-1-0002,
FI-2023-2-0004, FI-2023-3-0004 and FI-2024-1-0005). P.B. acknowledges support from the Generalitat de Catalunya under
a FI grant. C.L. acknowledges support from the Spanish Ministry of Science, Innovation and Universities under a FPU grant.
References
- (1) Palazon, F. Metal chalcohalides: Next generation photovoltaic materials? Sol. RRL 6, 2100829 (2022).
- (2) Ghorpade, U.V., Suryawanshi, M. P., Green, M. A., Wu, T., Hao, X. and Ryan, K. M. Emerging chalcohalide materials for energy applications. Chem. Rev. 123, 327 (2023).
- (3) Sebastiá-Luna, L., Rodkey, N., Mirza, A. S., Mertens, S., Lal, Melchor, A., Carranza, G., Calbo, J., Righetto, M., Sessolo, M., Herz, L. M., Vandewal, K., Ortí, E., Morales-Masis, M., Bolink, H. J. and Palazon, F. Chalcohalide antiperovskite thin films with visible light absorption and high charge-carrier mobility processed by solvent-free and low-temperature methods. Chem. Mater. 35, 6482 (2023).
- (4) Caño, I., Turnley, J. W., Benítez, P., López-Álvarez, C., Asensi, J.-M., Payno, D., Puigdollers, J., Placidi, M., Cazorla, C., Agrawal, R. and Saucedo, E. Novel synthesis of semiconductor chalcohalide anti-perovskites by low-temperature molecular precursor ink deposition methodologies. J. Chem. Mater. C 12, 3154 (2024).
- (5) Takahashi, T. and Yamamoto, O. The Ag/Ag3SI/I2 solid-electrolyte cell. Electrochim. Acta 11, 779 (1966).
- (6) Hull, S. Superionics: crystal structures and conduction processes. Rep. Prog. Phys. 67, 1233 (2004).
- (7) Wakamura, K., Miura, F., Kojima, A. and Kanashiro, T. Observation of anomalously increasing phonon damping constant in the phase of the fast-ionic conductor Ag3SI. Phys. Rev. B 41, 2758 (1990).
- (8) Sakuma, T. Treatment of anharmonic thermal vibration by using transformation of scattering vector. J. Phys. Soc. Jpn. 54, 4188 (1985).
- (9) Kawamura, J., Shimoji, M. and Hoshino, H. The ionic conductivity and thermoelectric power of the superionic conductor Ag3SBr. J. Phys. Soc. Jpn. 50, 194 (1981).
- (10) Magistris, A., Pezzati, E. and Sinistri, C. Thermoelectric properties of high-conductivity solid electrolytes. Z. Naturforsch. 27a, 1379 (1972).
- (11) Reuter, B. and Hardel, K. Silbersulfidbromid und silbersulfidjodid. Angew. Chem. 72, 138 (1960).
- (12) Hoshino, S., Sakuma, T. and Fujii, Y. The existence of the order phase in superionic conductor Ag3SI. J. Phys. Soc. Jpn. 45, 705 (1978).
- (13) Sakuma, T. and Hoshino, S. The phase transition and the structures of superionic conductor Ag3SBr. J. Phys. Soc. Jpn. 49, 678 (1980).
- (14) Hoshino, S., Fujishita, H., Takashige, M. and Sakuma, T. Phase transition of Ag3SX (X= I, Br). Solid State Ion. 3, 35 (1981).
- (15) Cho, N., Kikkawa, S., Kanamaru, F. and Yoshiasa, A. Structural refinement of Ag3SI by single crystal X-ray diffraction method. Solid State Ion. 68, 57 (1994).
- (16) Yin, L., Murphy, M., Kim, K., Hu, L., Cabana, J., Siegel, D. J. and Lapidus, S. H. Synthesis of antiperovskite solid electrolytes: comparing Li3SI,Na3SI, and Ag3SI. Inorg. Chem. 59, 11244 (2020).
- (17) Honda, H., Basar, K., Siagian, S., Sakuma, T., Takahashi, H., Kawaji, H. and Atake, T. Low-temperature phase in superionic conductor Ag3SBrxI1-x. J. Phys. Soc. Jpn. 76, 114603 (2007).
- (18) Shahrokhi, S., Dubajic, M., Dai, Z.-Z., Bhattacharyya, S., Mole, R. A., Rule, K. C., Bhadbhade, M., Tian, R., Mussakhanuly, N., Guan, X., Yin, Y., Nielsen, M. P., Hu, L., Lin, C.-H., Chang, S. L. Y., Wang, D., Kabakova, I. V., Conibeer, G., Bremner, S., Li, X.-Y., Cazorla, C. and Wu, T. Anomalous structural evolution and glassy lattice in mixed-halide hybrid perovskites. Small 18, 2200847 (2022).
- (19) Wang, J., Gao, H., Han, Y., Ding, C., Pan, S., Wang, Y., Jia, Q., Wang, H.-T., Xing, D. and Sun, J. MAGUS: machine learning and graph theory assisted universal structure searcher. Nat. Sci. Rev. 10, nwad128 (2023).
- (20) Ceperley, D. M. and Alder, B. J. Ground state of the electron gas by a stochastic method. Phys. Rev. Lett. 45, 566 (1980).
- (21) Perdew, J. P., Burke, K. and Ernzerhof, M. Generalized gradient approximation made simple. Phys. Rev. Lett. 77, 3865 (1996).
- (22) Perdew, J. P., Ruzsinszky, A., Csonka, G. I., Vydrov, O. A., Scuseria, G. E., Constantin, L. A., Zhou, X. and Burke, K. Restoring the density-gradient expansion for exchange in solids and surfaces. Phys. Rev. Lett. 100, 136406 (2008).
- (23) Sun, J., Ruzsinszky, A. and Perdew, J. P. Strongly constrained and appropriately normed semilocal density functional. Phys. Rev. Lett. 115, 036402 (2015).
- (24) Cazorla, C., D. Alfè and Gillan, M. J. Constraints on the phase diagram of molybdenum from first-principles free-energy calculations. Phys. Rev. B 85, 064113 (2012).
- (25) Cazorla, C. and Errandonea, D. Superionicity and polymorphism in calcium fluoride at high pressure. Phys. Rev. Lett. 113, 235902 (2014).
- (26) Stokes, H. T. and Hatch, D. M. FINDSYM: program for identifying the space-group symmetry of a crystal. J. Appl. Cryst. 38, 237 (2005).
- (27) Cazorla, C. and Boronat, J. Simulation and understanding of atomic and molecular quantum crystals. Rev. Mod. Phys. 89, 035003 (2017).
- (28) Cazorla, C., Errandonea, D. and Sola, E. High-pressure phases, vibrational properties, and electronic structure of Ne(He)2 and Ar(He)2: A first-principles study. Phys. Rev. B 80, 064105 (2009).
- (29) Cazorla, C. and Rurali, R. Dynamical tuning of the thermal conductivity via magnetophononic effects. Phys. Rev. B 105, 104401 (2022).
- (30) Ehsan, S., Arrigoni, M., Madsen, G. K. H., Blaha, P. and Tröster, A. First-principles self-consistent phonon approach to the study of the vibrational properties and structural phase transition of BaTiO3. Phys. Rev. B 103, 094108 (2022).
- (31) Cazorla, C., Bichelmaier, S., Escorihuela-Sayalero, C., Íñiguez J., Carrete, J. and Rurali, R. Light-driven dynamical tuning of the thermal conductivity in ferroelectrics. Nanoscale 16, 8335 (2024).
- (32) Carreras, A., Togo, A. and Tanaka, I. DynaPhoPy: A code for extracting phonon quasiparticles from molecular dynamics simulations. Comput. Phys. Commun. 221, 221 (2017).
- (33) Kresse, G. and Furthmüller, J. Efficient iterative schemes for ab initio total-energy calculations using a plane-wave basis set. Phys. Rev. B 54, 11169 (1996).
- (34) Blöchl, P. E. Projector augmented-wave method. Phys. Rev. B 50, 17953 (1994).
- (35) Togo, A. and Tanaka, I. First principles phonon calculations in materials science. Scr. Mater 108, 1 (2015).
- (36) Scheidgen, M., Himanen, L., Ladines, A. N. et al. NOMAD: A distributed web-based platform for managing materials science research data. J. Open Source Softw. 8, 5388 (2023).
- (37) DOI:10.17172/NOMAD/2024.05.17-2