Discrepancies Between JWST Observations and Simulations of Quenched Massive Galaxies at : A Comparative Study With IllustrisTNG and ASTRID
Abstract
Recent JWST observations have uncovered an unexpectedly large population of massive quiescent galaxies at . Using the cosmological simulations IllustrisTNG and ASTRID, we identify analogous galaxies and investigate their abundance, formation, quenching mechanisms, and post-quenching evolution for stellar masses . We apply three different quenching definitions and find that both simulations significantly underestimate the comoving number density of quenched massive galaxies at compared to JWST observations by up to dex. This fact highlights the necessity for improved physical models of AGN feedback in galaxy formation simulations. In both simulations, the high- quenched massive galaxies often host overmassive central black holes above the standard relation, implying that the AGN feedback plays a crucial role in quenching galaxies in the early Universe. The typical quenching timescales for these galaxies are Myr. IllustrisTNG primarily employs AGN kinetic feedback, while ASTRID relies on AGN thermal feedback, which is less effective and has a longer quenching timescale. We also study the post-quenching evolution of the high- massive quiescent galaxies and find that many experience subsequent reactivation of star formation, evolving into primary progenitors of brightest cluster galaxies.
1 Introduction
The James Webb Space Telescope (JWST) has revealed several unexpected properties of high-redshift galaxies and their population of supermassive black holes.
First, overmassive black holes have been detected at (see, e.g., Harikane et al. 2023; Maiolino et al. 2023; Yue et al. 2024; Kocevski et al. 2024; Natarajan et al. 2024; Juodžbalis et al. 2024), with masses times higher than what is predicted from the standard relation. These observations challenged standard scaling relations at high redshift and implied the important role played by AGN feedback in quenching galaxies at , especially because their hosts are compact (Pacucci et al., 2023, 2024).
Second, and possibly connected (Pacucci & Loeb, 2024), JWST observations have revealed a surprisingly large population of quenched (i.e., not star-forming) massive galaxies at (e.g. Carnall et al. 2023; Long et al. 2023; Valentino et al. 2023). Some of these quiescent galaxies, at , have an estimated stellar mass of (Carnall et al., 2024). Remarkably, these galaxies can form half their stars as early as (Glazebrook et al., 2024; Park et al., 2024).
Various classes of quenching mechanisms can be identified. First, AGN and stellar feedback (see, e.g., Silk & Rees 1998; Di Matteo et al. 2005; Springel et al. 2005; Hopkins et al. 2006; Schaye et al. 2015; Feldmann & Mayer 2015) are mechanisms in which the energy output of the central black hole and supernova explosions can prevent the formation of new stars. Second, “dry mergers” between galaxies containing little or no cold gas (see, e.g., Barnes & Hernquist 1996; Hopkins et al. 2006; Zolotov et al. 2015; Belli et al. 2019) can also lead to the formation of quiescent galaxies. Lastly, environmental quenching is characteristic of galaxies embedded in large clusters where the galactic halo is too hot to be penetrated by cold streams of gas (see, e.g., Gunn & Gott 1972; Dressler 1980; Mihos & Hernquist 1996; Kawata & Mulchaey 2008; van den Bosch et al. 2008; Peng et al. 2010).
Quenching of massive galaxies can be roughly classified into two categories: “rapid” quenching, occurring on the order of a few hundred million years, and “slow” quenching, taking place on timescales longer than 1 billion years (see, e.g., Wu et al. 2018; Belli et al. 2019). For , when the Universe is only Gyr old, quiescent galaxies must have undergone quenching in relatively short timescales. However, models and simulations struggle to match the observed number density of high- quenched massive galaxies (see, e.g., Schreiber et al. 2018; Cecchi et al. 2019; Girelli et al. 2019), indicating that the employed physical mechanisms for quenching are insufficient. Recent simulation suites (see, e.g., Kimmig et al. 2023; Remus & Kimmig 2023) are becoming increasingly successful in reproducing quenched fractions similar to those observed.
AGN feedback is considered one of the most important mechanisms for the rapid quenching of high- massive quiescent galaxies (e.g., Weinberger et al. 2018; Hartley et al. 2023). In this study, we use two different simulations, IllustrisTNG (Weinberger et al., 2017; Pillepich et al., 2018a) and ASTRID (Bird et al., 2022; Ni et al., 2022), with different mechanisms of AGN feedback, to understand the formation, quenching process, and post-quenching evolution of quenched massive galaxies at .
Our paper is organized as follows. In Section 2, we describe the simulations used; in Sec. 3, we describe the abundance of quenched galaxies and compare them with JWST observations. Sec. 4 describes the redshift evolution of the quenched massive galaxy population investigated in the simulations. Sec. 5 provides a broader discussion of our results and concludes our paper.
2 Simulations
This Section briefly summarizes the cosmological simulations used: IllustrisTNG (the TNG100 and TNG300 volumes) and ASTRID. More details can be found in the original papers referenced below.
IllustrisTNG (Weinberger et al., 2017; Marinacci et al., 2018; Naiman et al., 2018; Nelson et al., 2018; Pillepich et al., 2018b, a; Springel et al., 2018) includes physical models for galaxy formation based on sub-grid models for star formation, stellar evolution and galactic winds, as well as supermassive black hole (SMBH) seeding, merging, accretion, and feedback. Feedback from galactic winds is kinetic and implemented via hydrodynamically decoupled wind particles. Energy and mass loading factors are prescribed based on local velocity dispersion and metallicity. AGN feedback operates in quasar and radio modes, depending on the SMBH mass and the Eddington ratio (Weinberger et al., 2017). The high-Eddington quasar mode acts as thermal feedback that deposits thermal energy into the surroundings. The low-Eddington radio mode acts as kinetic feedback, injecting momentum into the surrounding gas. The low-Eddington radio mode, sometimes called the jet mode, is more efficient at ejecting gas and quenching star formation in massive galaxies (Weinberger et al., 2017; Nelson et al., 2018). The two simulations used, i.e., TNG100 and TNG300, have box sizes of and , respectively.
ASTRID (Bird et al., 2022; Ni et al., 2022) is a large-volume cosmological hydrodynamic simulation of box size and particle load , currently run to . In the ASTRID simulation, the gas cools via primordial radiative cooling (Katz et al., 1996) and metal line cooling. The evolution of gas and stellar metallicities follows the prescriptions by Vogelsberger et al. (2014). The simulation adopts patchy re-ionization (Battaglia et al., 2013), with the ionizing UV background from Faucher-Giguère (2020) employed along with gas self-shielding (Rahmati et al., 2013). Star formation is based on a multi-phase model as described in Springel & Hernquist (2003), accounting for the influence of molecular hydrogen (Krumholz & Gnedin, 2011). Type II supernova wind feedback is incorporated into the simulation following Okamoto et al. (2010), with wind speeds proportional to the local one-dimensional dark matter velocity dispersion. ASTRID models black hole seeding, accretion, feedback, and dynamics as detailed in Ni et al. (2022). Specifically, at , the AGN feedback operates purely in a quasar mode as thermal feedback. The differences in AGN feedback prescriptions between IllustrisTNG and ASTRID allow us to explore the role of AGN feedback in high-redshift quiescent galaxies.
3 Abundance of quenched massive galaxies
In this Section, we present our definitions of quenched massive galaxies, compare the comoving number densities of these galaxies in simulations to recent observational results, and study the stellar mass distribution of quenched versus star-forming massive galaxies.
3.1 Definitions
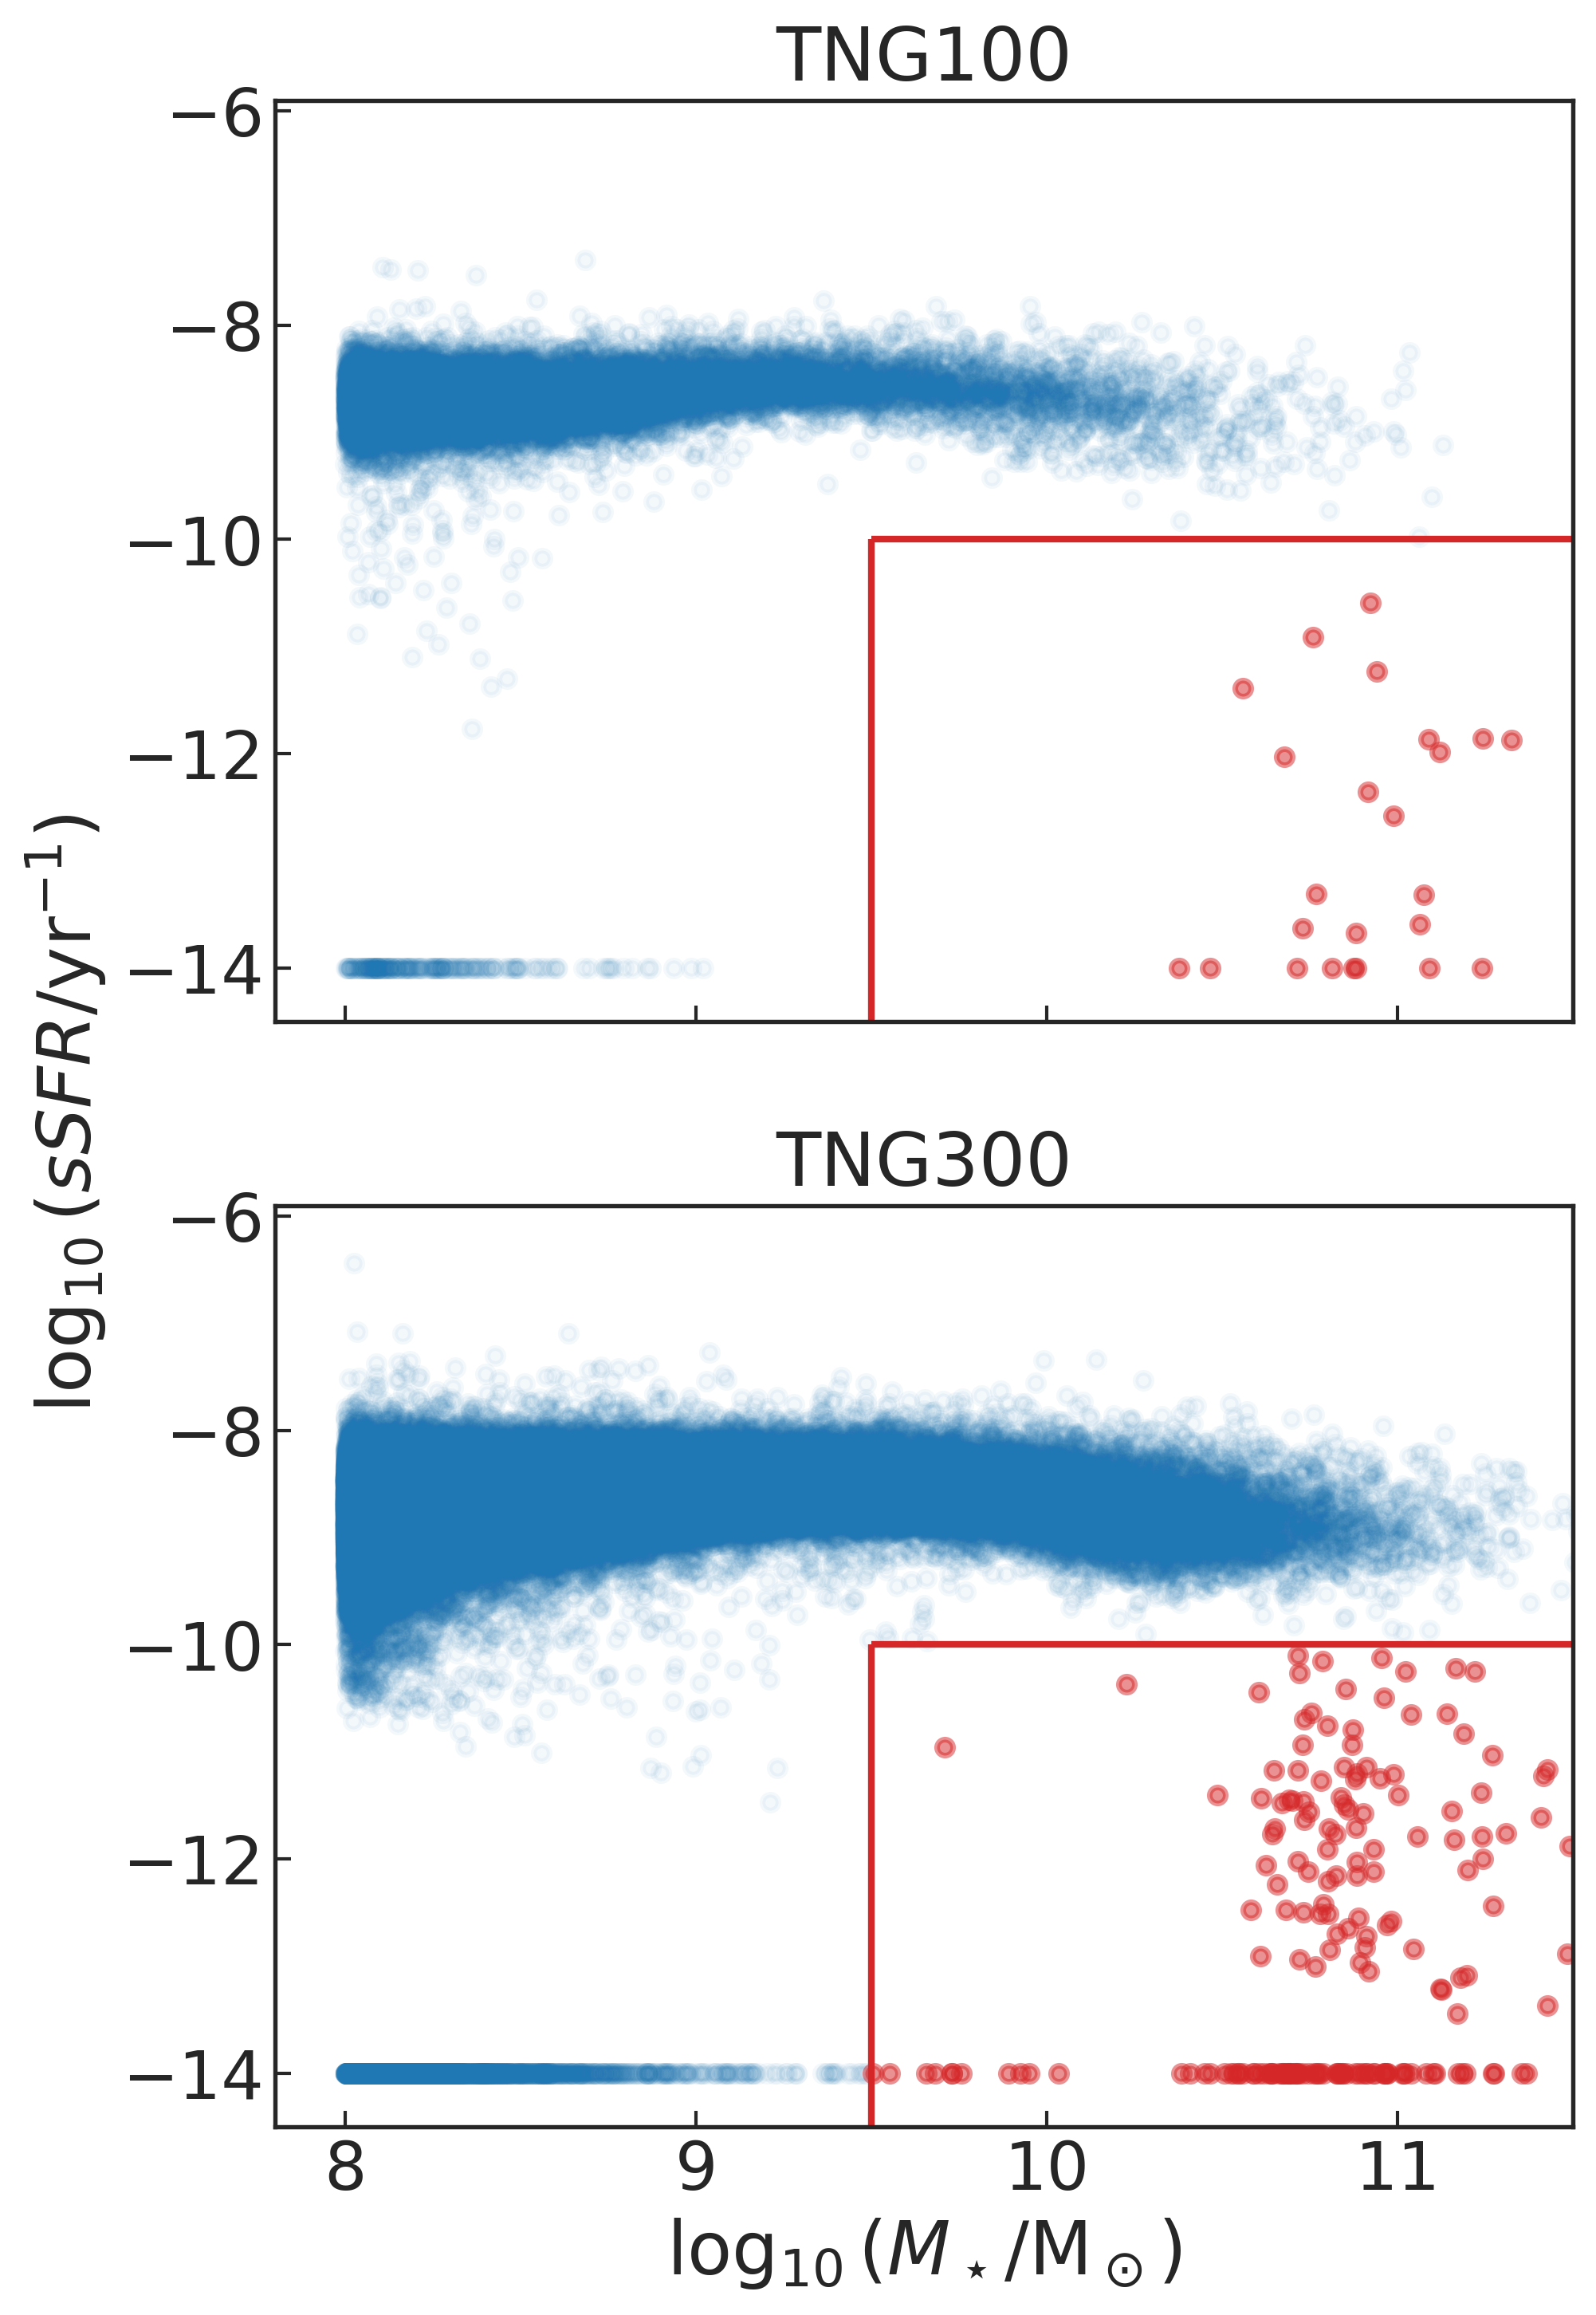
We focus on massive galaxies with stellar masses ; the stellar mass and star formation rate (SFR) are calculated within twice the stellar half-mass radius of the galaxy. We apply three different definitions of quenched galaxies:
- •
-
•
Main sequence: We divided the stellar mass range into bins of and calculated the median SFR for each bin. The bin medians define the “main sequence” of star formation. A galaxy is quenched if its SFR lies more than 1 dex below the median for its stellar mass bin (see, e.g., Donnari et al. 2021; Nelson et al. 2021).
-
•
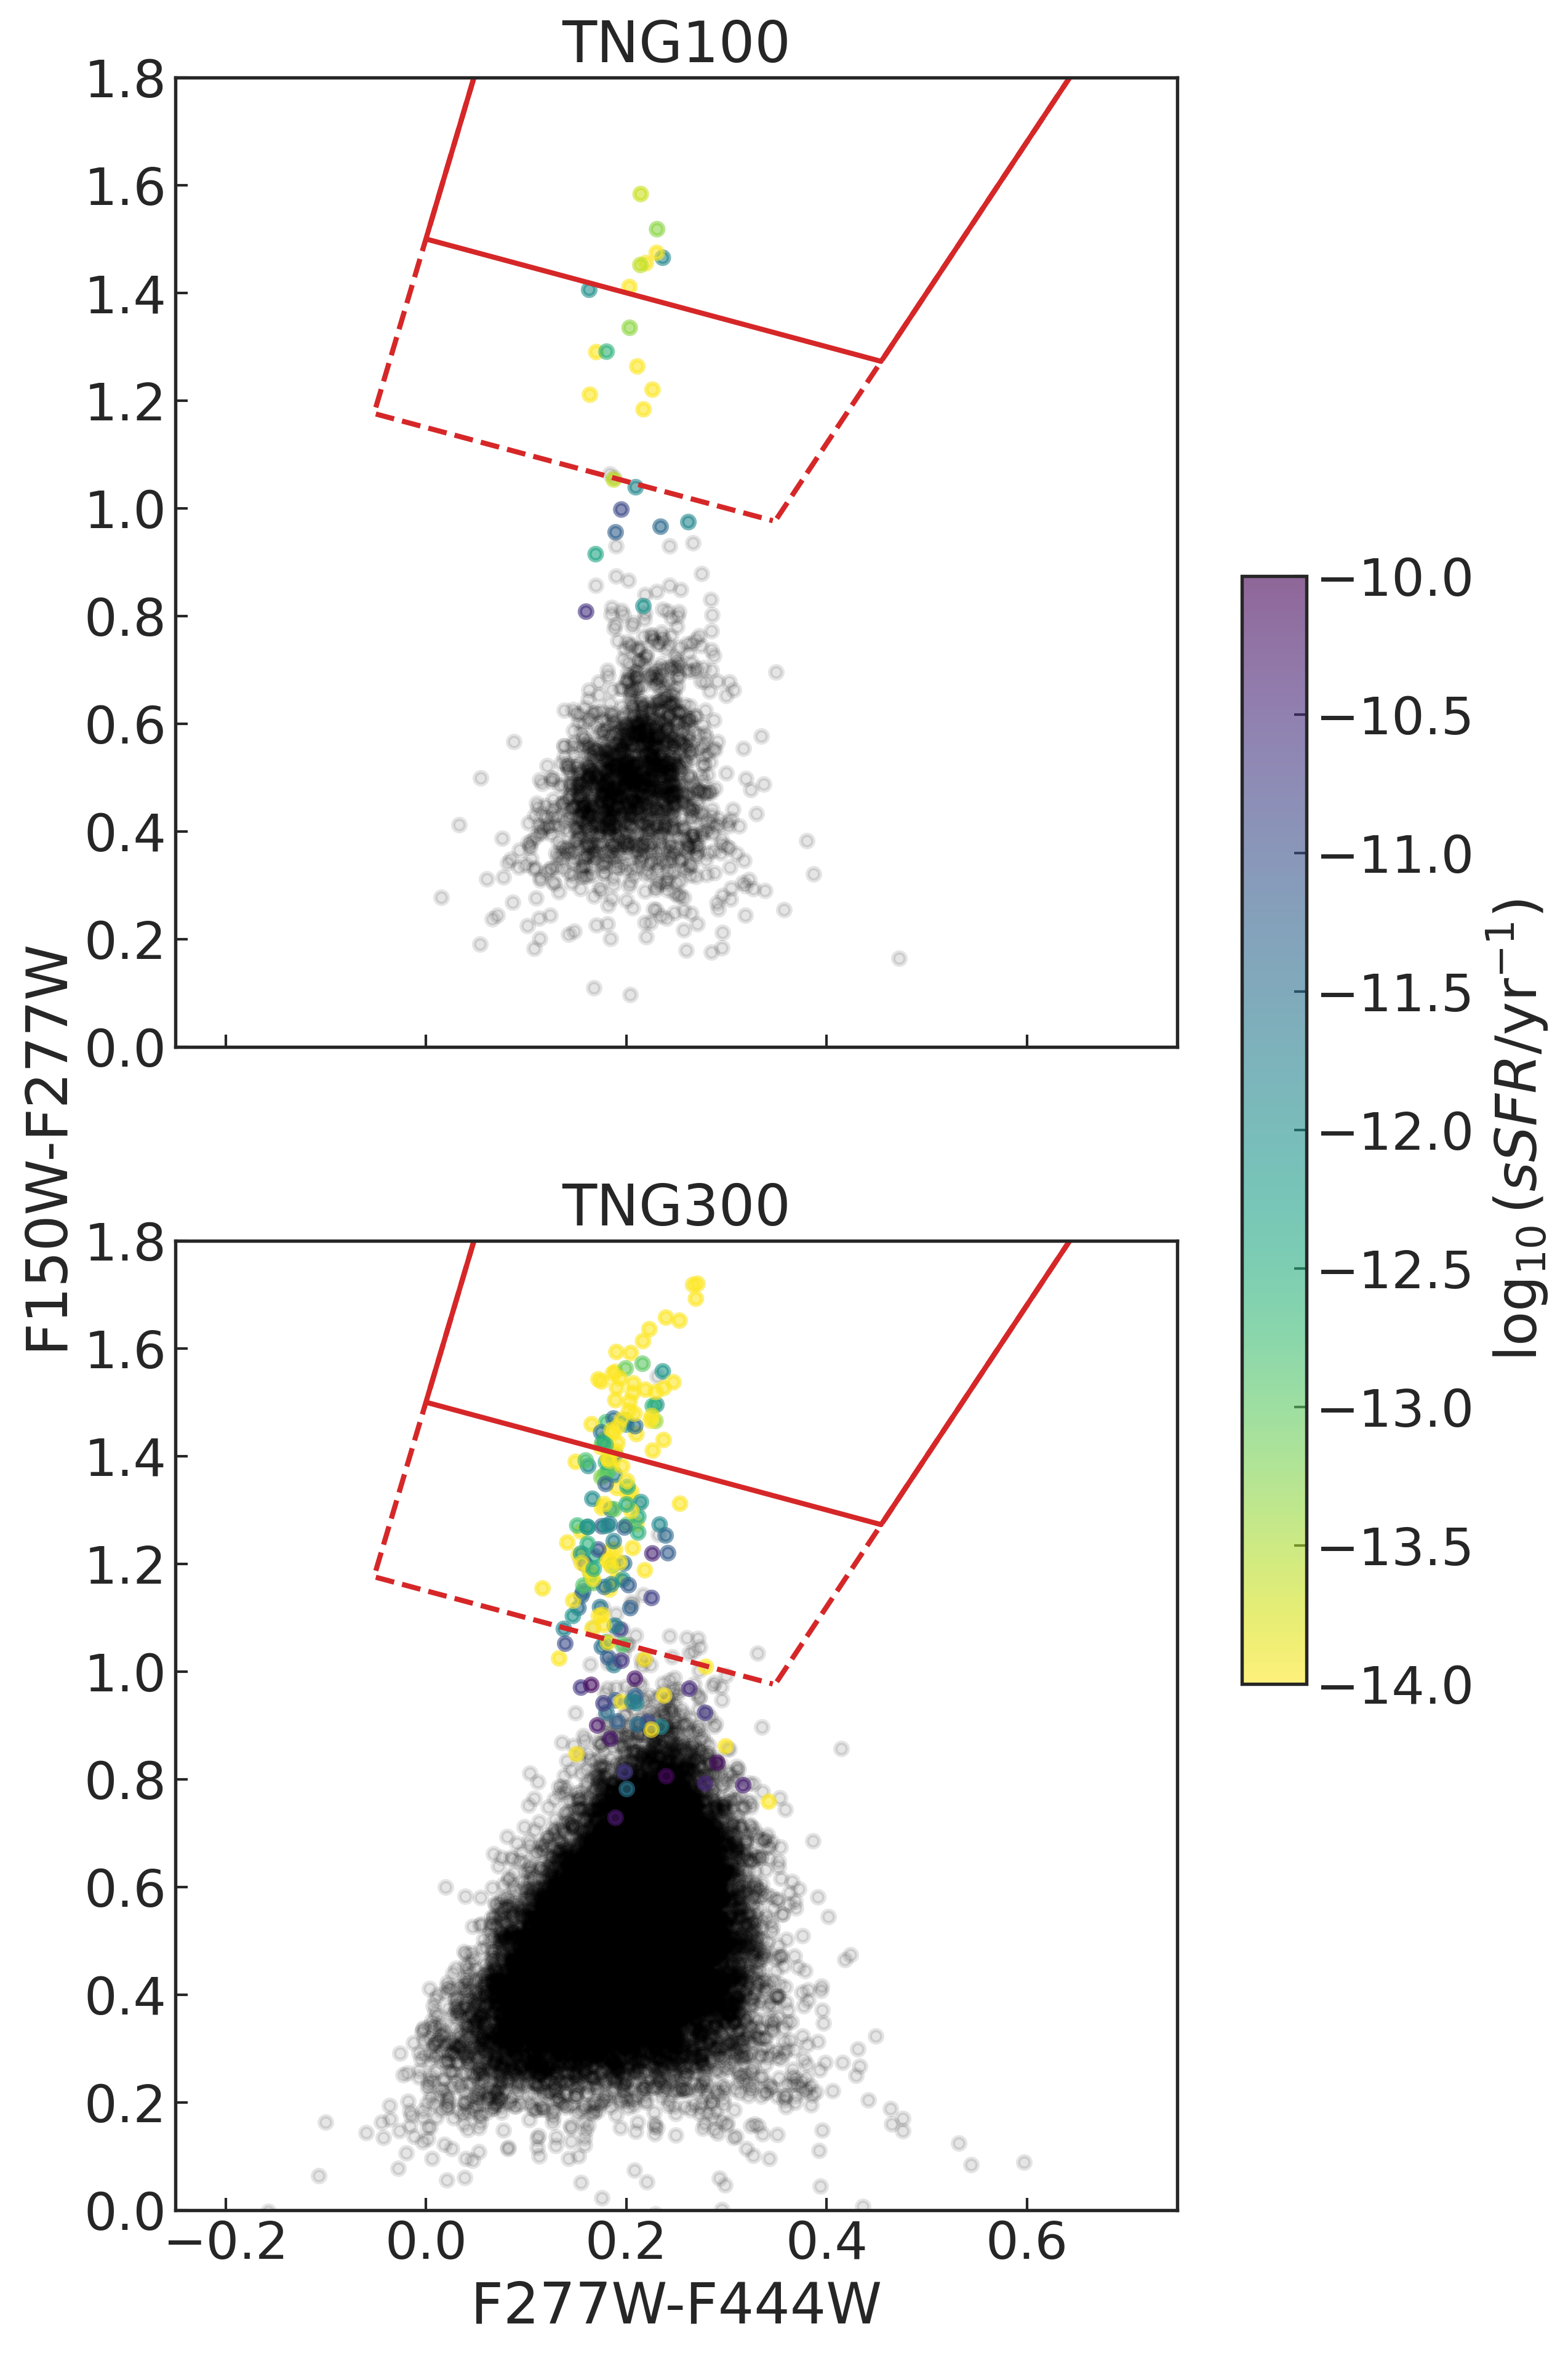
Color selection: We used the Flexible Stellar Population Synthesis (FSPS) Python library (Conroy et al., 2009; Conroy & Gunn, 2010) to calculate the magnitude of the galaxies in the JWST Near Infrared Camera (NIRCam) photometric bands , , and . Note that we did not account for dust attenuation. We then computed the and colors and identified quenched galaxies using the “long wedge” selection criteria from Long et al. (2023):
(1) (2) (3) Figure 2 shows an example of the short and long wedge selection criteria, with massive galaxies at in TNG100 and TNG300. The color selection definition of quenched galaxies agrees well with the sSFR limit definition. Note that, unlike the other two definitions, this color selection method uses all the stars in the galaxy rather than calculating values within twice the stellar half-mass radius.
3.2 Number density
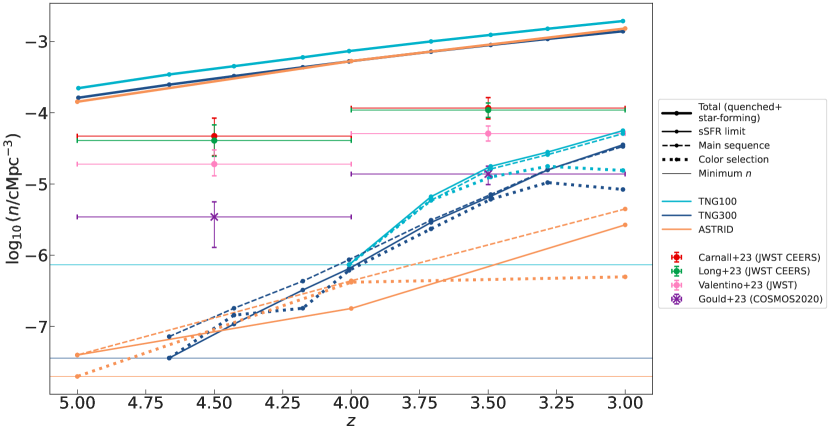
We calculate the comoving number density of galaxies at each snapshot between and in TNG100, TNG300, and ASTRID. We limit our study to due to the limited volumes of the simulations, as they contain essentially no earlier quenched massive galaxies. We begin by counting the number of quenched massive galaxies using each of the three definitions described in Sec. 3.1. We also count the total number of massive galaxies. We then convert to comoving number densities using the volumes of the simulation boxes: , , and for TNG100, TNG300, and ASTRID, respectively. The results are shown in Fig. 3, compared to observational comoving number densities from four recent studies using JWST and COSMOS2020 (Carnall et al., 2023; Long et al., 2023; Valentino et al., 2023; Gould et al., 2023). Note that our number density for TNG300 at is lower than the estimate from Hartley et al. (2023) because they use physical rather than comoving number density. The following paragraph summarizes the methods that the four observational studies used to select their samples of candidate quenched massive galaxies at .
Carnall et al. (2023) used Near Infrared Camera (NIRCam) photometric data from the JWST Cosmic Evolution Early Release Science (CEERS) survey (Finkelstein et al., 2023). This study found 15 quenched massive galaxies with . They consider a galaxy to be quenched if , where is the age of the Universe at the redshift of the galaxy (note that at , so this is similar to our sSFR limit definition over the studied redshifts). Long et al. (2023) selected 36 quenched galaxies with by applying their new empirical color selection method to NIRCam data from CEERS. Valentino et al. (2023) applied color selection to identify quenched massive galaxies with . They used 11 fields imaged by NIRCam, the Slitless Spectrograph (NIRISS), and the Mid-Infrared Instrument (MIRI). Gould et al. (2023) used color selection to identify a sample of 230 quenched massive galaxies with in the Cosmic Evolution Survey 2020 catalog (COSMOS2020).
Figure 3 shows that the simulations significantly underestimate the number density of quenched massive galaxies compared to the observational results, especially the JWST results. The difference is more extreme for ASTRID and at higher redshifts. We also note that our three definitions of quenched galaxies agree well, especially in IllustrisTNG.
3.3 Stellar mass distribution
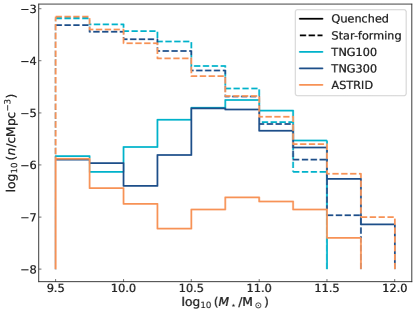
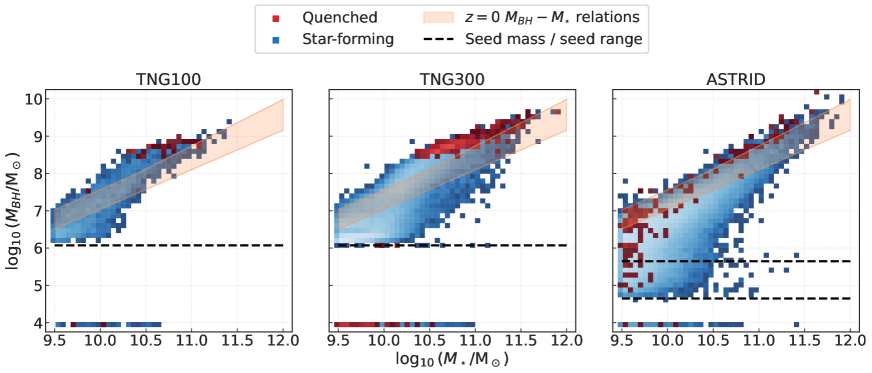
Figure 1 showed that quenched galaxies tend to occupy the parameter space with . Figure 4 now displays the distribution of stellar masses for quenched and star-forming massive galaxies in all three simulations at . Note that here and throughout the remainder of the paper, “quenched” refers to galaxies that meet the sSFR limit definition.
The star-forming comoving number densities are similar in all three simulations and decrease with stellar mass. The quenched comoving number density, on the other hand, peaks at in TNG100 and TNG300. In ASTRID, there appear to be two populations of quenched galaxies, split around . The lower-mass population follows a similar distribution to the star-forming galaxies, while the higher-mass population follows a similar distribution to the quenched galaxies in IllustrisTNG. We will discuss these two populations in Sec. 4.2.
When comparing quenched and star-forming galaxies, we must consider that the quenched galaxies have higher average stellar mass. We use binning to separate effects that only depend on stellar mass.
3.4 - relation
Figure 5 displays the relation for quenched and star-forming massive galaxies at in all three simulations. In IllustrisTNG, SMBHs are pinned to the centers of their host halos, so we take the most massive black hole in the galaxy as the central black hole. In ASTRID, because there are wandering massive black holes (see, e.g., Di Matteo et al. 2022; Weller et al. 2023), we use the most massive SMBH within twice the stellar half-mass radius. In all three simulations, we see that at the high end of the stellar mass range, quenched galaxies lie on the upper edge of the distribution. At the lower end of the stellar mass range, many galaxies have smaller central SMBHs or none at all. This suggests that AGN feedback may drive quenching at the highest stellar masses, while at lower masses, other mechanisms (e.g., environmental quenching, see Sec. 4.2) are in place.
4 Evolution of quenched massive galaxies
In this Section, we study the evolution of high-redshift quenched massive galaxies compared to their star-forming counterparts.
4.1 Formation
We studied the formation of quenched massive galaxies in IllustrisTNG by tracing them through time via their merger trees. We define the formation time of a galaxy as the time at which its stellar mass exceeds (i.e., when the galaxy becomes resolved in the simulation). We use this definition because we are primarily interested in tracking when galaxies begin to build up their stellar mass. Note that other works use a different definition of formation time, i.e., the time when half of the final stellar mass is formed or the age of the Universe corresponding to the age of the galaxy (Carnall et al., 2023).
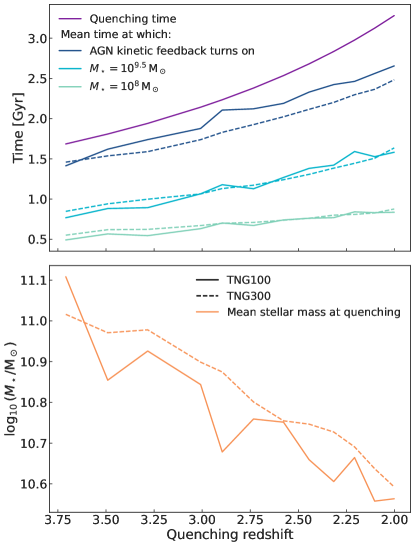
We took every quenched massive galaxy at in TNG100 and TNG300 and traced it back in time along the main progenitor branch to identify the formation time, the time at which it becomes massive (the first snapshot in which ), the quenching time (the first snapshot in which ), and the stellar mass at quenching. We also found the time when AGN kinetic feedback turns on (see Sec. 4.2). Note that time refers to the age of the Universe (e.g., at ).
We grouped the galaxies by their quenching snapshot and calculated the mean values of the quantities listed above for each snapshot. We plot these mean values as a function of the quenching redshift for TNG100 and TNG300 in Fig. 6. We also show the corresponding quenching time. Note that few galaxies have quenching redshifts .
On average, the galaxies that quench earlier grow from to more quickly, and they end up more massive at quenching. This fact indicates that massive galaxies that quench earlier tend to assemble stellar mass more quickly.
4.2 Quenching mechanisms
In this Section, we investigate how massive galaxies are quenched at high redshifts.
4.2.1 AGN kinetic feedback in IllustrisTNG
AGN kinetic feedback is needed to quench massive galaxies in IllustrisTNG (Weinberger et al., 2017, 2018; Nelson et al., 2018; Terrazas et al., 2020; Zinger et al., 2020). Returning to Fig. 6, the mean time at which AGN kinetic feedback turns on is closely correlated with the quenching time. This supports the idea that kinetic feedback is responsible for quenching massive galaxies. We also notice that faster stellar mass growth is correlated with an earlier onset of kinetic feedback.
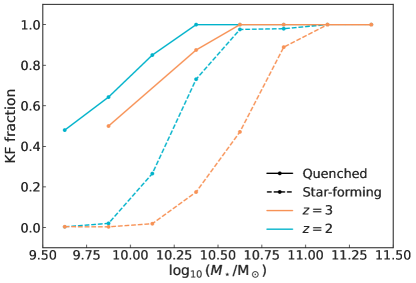
Next, we calculate the so-called “KF fraction” for quenched and star-forming massive galaxies in TNG100: the fraction of galaxies in which AGN kinetic feedback has turned on. We assume that AGN kinetic feedback has turned on if the main progenitor of the galaxy has contained a black hole with nonzero cumulative AGN kinetic feedback energy at some point in its history. This allows us to include galaxies quenched by AGN kinetic feedback but which later lost the SMBH (e.g., via interactions with another galaxy). We calculate the KF fraction in stellar mass bins of width , at and .
Figure 7 displays our results for the KF fraction, which is higher for larger stellar mass, lower redshift, and quenched galaxies. At the high end of the stellar mass range, AGN kinetic feedback has turned on in almost all galaxies. At the low mass end, AGN kinetic feedback has turned on in about half of the quenched galaxies and almost none of the star-forming ones.
Because we know that quenched massive galaxies fall primarily at the high end of the studied stellar mass range, and this is where kinetic feedback usually turns on, we can conclude that it is difficult to quench the most massive galaxies without AGN kinetic feedback. At lower masses, galaxies can be quenched via other mechanisms. Summing over the entire mass range, we find that of quenched galaxies and just of star-forming galaxies have AGN kinetic feedback turned on at . At , these values are and .
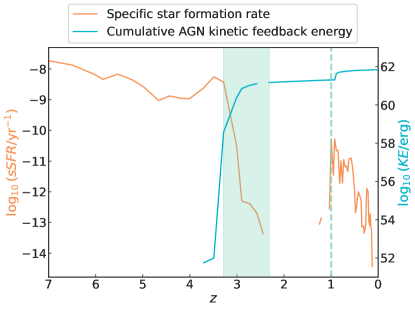
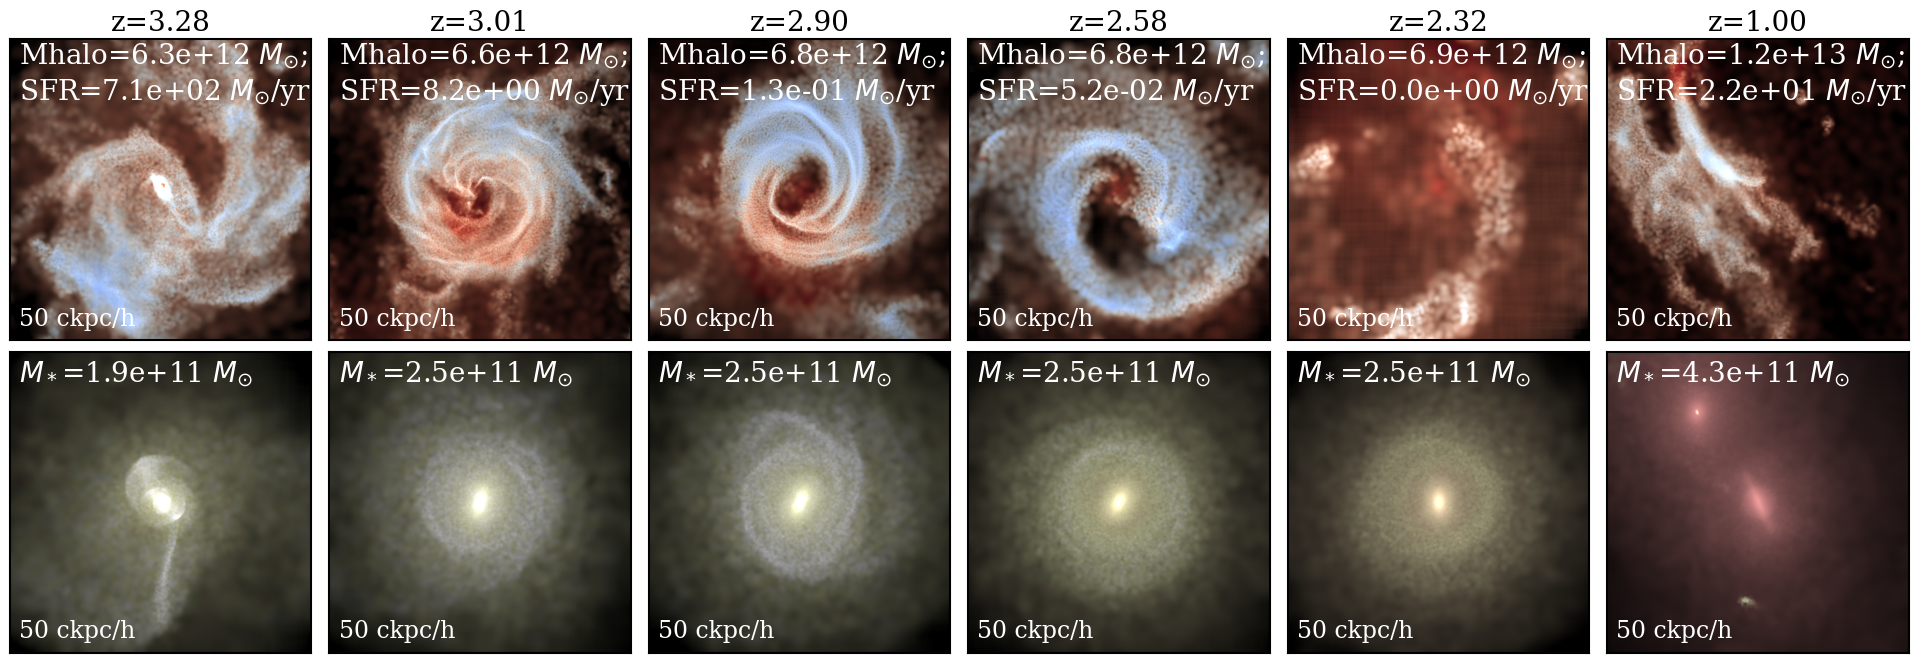
Figs. 8 and 9 illustrate the evolution of an example massive galaxy in TNG100 that quenches at . At the time of quenching, the mass of its central, most massive SMBH is . In Fig. 8, we display the sSFR and the cumulative AGN kinetic feedback energy of the central SMBH in the galaxy as a function of redshift, for . When AGN kinetic feedback turns on, the sSFR drops rapidly, and the galaxy becomes quenched later at .
In Fig. 9, we map the gas temperature and stellar age of this example galaxy at snapshots from to (a period of ). The gas is heated and ejected from the galaxy’s central region – a signature of AGN kinetic feedback. Quenching occurs at the second snapshot in the figure.
4.2.2 Quenching mechanism in ASTRID
At , ASTRID employs AGN feedback only in the thermal mode; hence, quenching is primarily driven by AGN thermal feedback and environmental effects.
Returning to the two populations of quenched ASTRID galaxies in Fig. 4, we first notice that the quenched number density in ASTRID approximately matches TNG100 and TNG300 at the low end of the stellar mass range. This suggests that these galaxies are not primarily quenched by AGN kinetic feedback, even in IllustrisTNG. Instead, they are more susceptible to mechanisms like environmental quenching in both IllustrisTNG and ASTRID. At higher stellar masses, we notice a small peak in the ASTRID quenched number density, but significantly smaller than in TNG100 and TNG300. This effect is likely because the AGN thermal feedback used in ASTRID is not as efficient as AGN kinetic feedback, which is the primary quenching mechanism at high stellar masses in IllustrisTNG. The massive galaxies quenched in ASTRID are likely a result of AGN feedback in its thermal form: more massive black holes are more effective at quenching massive galaxies (see Fig. 5).
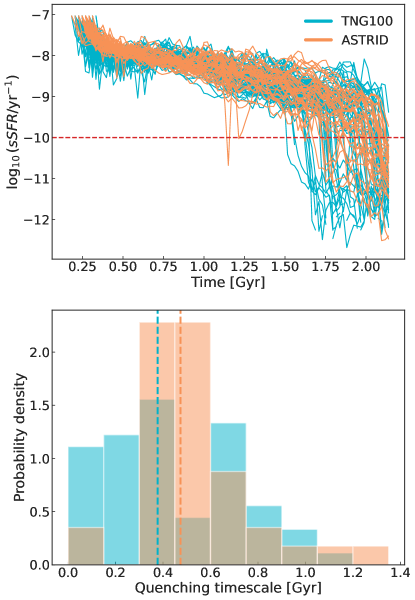
In ASTRID, we investigate the evolution of galaxies over time by reconstructing their star formation histories based on stellar age. We identify the formation time of all stars within twice the stellar half-mass radius at , divide the stars into 100 temporal bins, and use their masses to calculate the SFR and sSFR for each bin. In the upper panel of Fig. 10, we display the reconstructed sSFR for all galaxies in TNG100 and ASTRID that are quenched and have at (this mass cut selects a smaller sample of galaxies with comparable stellar masses). While the results are similar between the two simulations, at least up to (), the TNG100 galaxies often exhibit earlier and more abrupt drops in sSFR compared to the ASTRID galaxies. These sharp declines are likely driven by the efficient AGN kinetic feedback in IllustrisTNG.
The lower panel of Fig. 10 shows histograms of the quenching timescales for these galaxies, calculated as the time between quenching and peak SFR in the reconstructed star formation history. Note that the reconstructed sSFR is sometimes zero close to the formation, so we require the quenching time to be after . The quenching timescales are similar between the two simulations. However, there are more TNG100 galaxies at the shortest quenching timescales, leading to a slightly lower median timescale ( in TNG100 compared to in ASTRID). Interestingly, in both TNG100 and ASTRID, the quenching timescale has no significant correlation with the stellar mass.
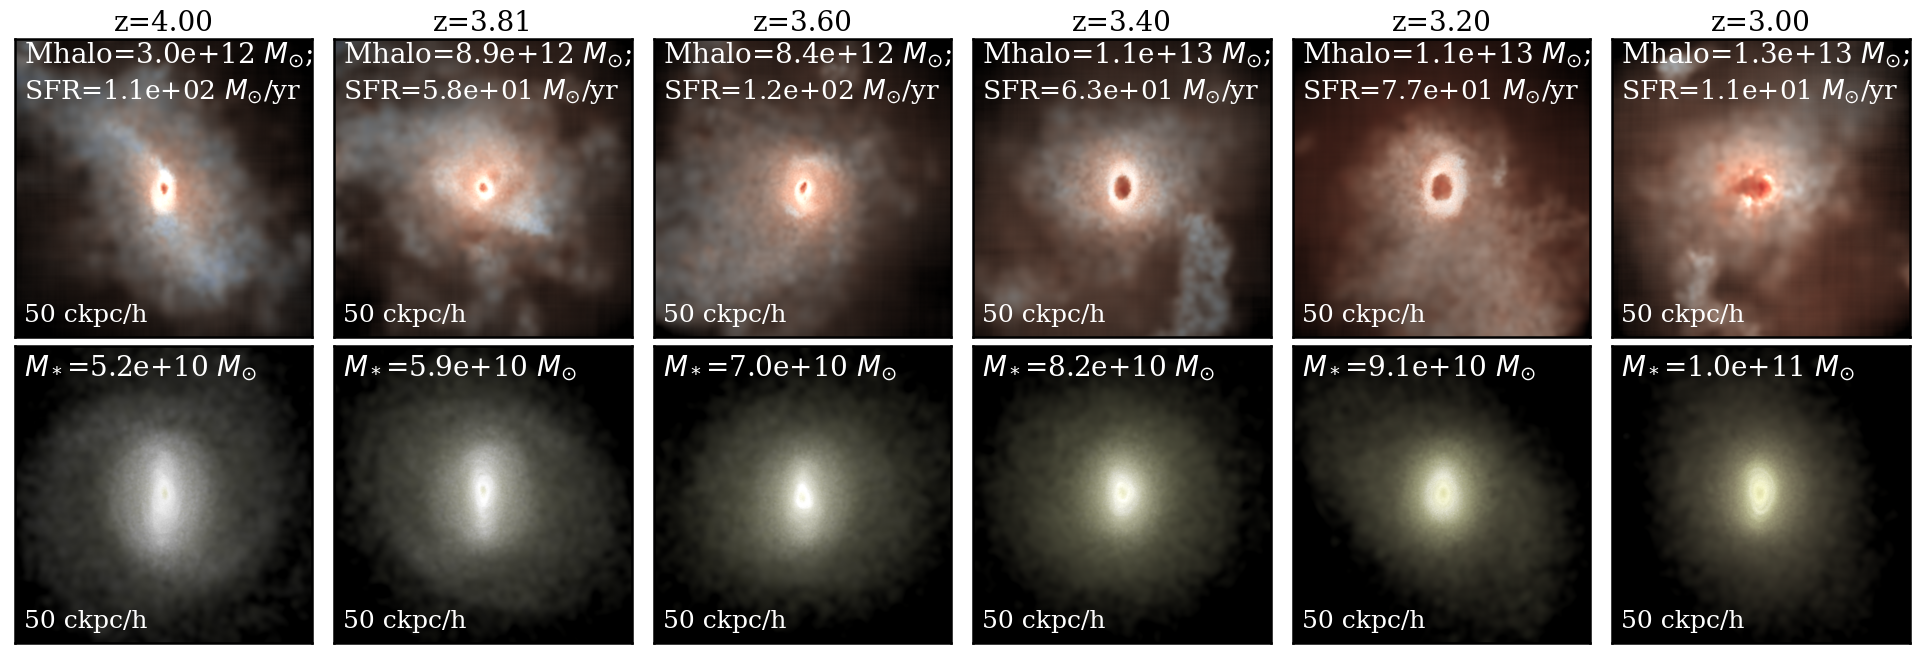
As an illustration of galaxy quenching in ASTRID, we present a massive galaxy that, similar to the TNG100 example galaxy, undergoes quenching at . The mass of its central SMBH at quenching is . In Fig. 11, we map this galaxy’s gas temperature and stellar age, similar to Fig. 9 for the TNG100 example galaxy. We display snapshots from to (a period of ). Quenching occurs at the final snapshot. At the galaxy’s center, we again observe that the gas is heated, but there are no significant gas cavities.
4.3 Post-quenching evolution
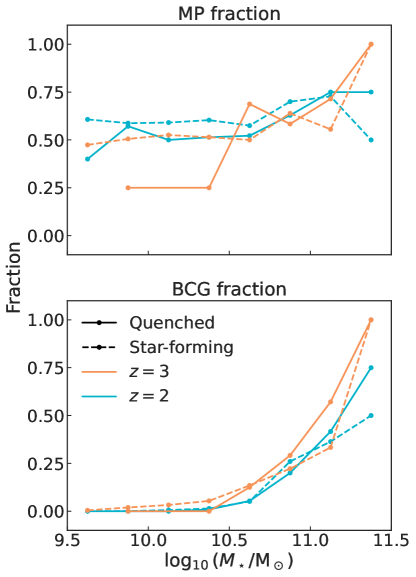
To investigate how galaxies evolve after quenching, we analyze the fraction of quenched and star-forming massive galaxies in TNG100 that serve as the main progenitors of their descendants and the fraction of galaxies that are the main progenitors of brightest cluster galaxies (BCGs). We refer to the first quantity as the MP fraction and the second as the BCG fraction. We define a galaxy to be a BCG if it meets the following criteria: (i) it is the “primary” subhalo in its group; (ii) it has the largest stellar mass in the group; (iii) the group has more than 100 subhalos with nonzero stellar mass. As in Fig. 7, we compute the fractions at and within stellar mass bins of width . Our results are presented in Fig. 12.
The MP fraction shows no clear trend between quenched and star-forming galaxies and between redshifts, but there does appear to be a stellar mass dependence, especially at . The BCG fraction is similar for both quenched and star-forming galaxies but is higher at than at for the largest stellar masses. Most noticeably, the BCG fraction strongly depends on stellar mass: more massive galaxies are significantly more likely to be the main progenitor of a BCG. We note that our MP fractions in Fig. 12 are in contrast with the finding in Hartley et al. (2023) that only 1 of the 5 earliest quenched massive galaxies in TNG300 () is the main progenitor of its descendant. However, we note the following differences between our work and Hartley et al. (2023): (i) they use TNG300, while we use TNG100; (ii) they use a small number of galaxies that quench by , whereas we are studying a larger number of galaxies that quench at lower redshifts, i.e., by or .
We also find that more massive galaxies have a higher local overdensity, measured on scales using Eqn. 4 in Kimmig et al. 2023. For example, in TNG100 at , the mean deviation from the mean density within is for galaxies with , and for galaxies with . This implies that more massive galaxies also have more nearby galaxies. When considering massive galaxies of comparable stellar mass, there is no significant difference in between quenched and star-forming galaxies. Interestingly, in contradiction with our IllustrisTNG results, Kimmig et al. (2023) find that quenched galaxies in the Magneticum Pathfinder simulation suite tend to lie in local under-densities compared to star-forming galaxies with comparable masses ().
While we do not see any significant difference in the local overdensity or the BCG fraction between quenched and star-forming massive galaxies in TNG100 when accounting for stellar mass differences, we note that because the quenched galaxies have larger average stellar masses within the studied mass range, they have a higher overall average local overdensity and BCG fraction. At , the MP and BCG fractions for quenched galaxies are and at , respectively, compared to and for star-forming galaxies. At , these values are and for quenched galaxies and and for star-forming galaxies.
Many of the galaxy main progenitors that are quenched at high redshift are later re-activated: their sSFR rises back above (or near) . Returning to Fig. 8, we see that the TNG100 example galaxy re-activates at ; this galaxy is the main progenitor of a BCG. In the last column of Fig. 9, we observe surrounding galaxies merging onto the central example galaxy at , bringing in new gas and re-activating star formation.
5 Summary and Conclusions
This study is motivated by recent JWST observations providing demographic estimates for the population of quenched massive galaxies at (see, e.g., Carnall et al. 2023; Long et al. 2023; Valentino et al. 2023; Gould et al. 2023). We used the cosmological simulations IllustrisTNG and ASTRID to investigate the rise of these galaxies. Our primary findings are summarized below:
-
•
Abundance of quenched galaxies in simulations: IllustrisTNG and ASTRID significantly underestimate the comoving number density of quenched massive galaxies at compared to JWST data; this discrepancy reaches orders of magnitude at the high end of the redshift range that we investigated.
-
•
Role of AGN feedback: AGN feedback is identified as the key quenching mechanism for massive galaxies in both simulations. In IllustrisTNG, the kinetic mode of AGN feedback is predominant, rapidly quenching massive galaxies. In contrast, ASTRID relies on AGN thermal feedback, which, although less effective, still plays a significant role in quenching on a slightly longer timescale.
-
•
Quenching timescales: Massive galaxies at have typical quenching timescales of Myr.
-
•
Characteristics of quenched galaxies in simulations: In both IllustrisTNG and ASTRID, black holes in quenched massive galaxies are over-massive compared to the average scaling relation. This suggests that AGN feedback is more pronounced in these galaxies, contributing to their quiescence. Additionally, galaxies that quench earlier tend to be more massive and accumulate stellar mass more rapidly.
-
•
Post-quenching evolution: A notable fraction of quenched massive galaxies experience reactivation of star formation at later stages, primarily due to interactions and mergers that bring fresh gas into the galaxy. These galaxies often evolve to become the primary progenitors of BCGs, indicating a significant evolutionary pathway from high-redshift quiescence to present-day galaxy clusters.
Our results emphasize the need for enhanced physical models of AGN feedback to better match observational data, particularly at high redshifts. Future observations from JWST, combined with improved simulations, are expected to refine our understanding of the formation and evolution of massive galaxies in the early Universe.
Acknowledgments: The Authors acknowledge fruitful discussions with Erica Nelson. E.W. acknowledges undergraduate research support provided by the Harvard College Research Program (HCRP). This work was completed in part as a class project for Astronomy 91R, taught at Harvard College by Charles Alcock. F.P. acknowledges support from a Clay Fellowship administered by the Smithsonian Astrophysical Observatory. Y.N. acknowledges support from an ITC postdoctoral fellowship by Harvard University. L.H. acknowledges support by the Simons Collaboration on “Learning the Universe.”
References
- Barnes & Hernquist (1996) Barnes, J. E., & Hernquist, L. 1996, ApJ, 471, 115, doi: 10.1086/177957
- Battaglia et al. (2013) Battaglia, N., Trac, H., Cen, R., & Loeb, A. 2013, ApJ, 776, 81, doi: 10.1088/0004-637X/776/2/81
- Belli et al. (2019) Belli, S., Newman, A. B., & Ellis, R. S. 2019, ApJ, 874, 17, doi: 10.3847/1538-4357/ab07af
- Bird et al. (2022) Bird, S., Ni, Y., Di Matteo, T., et al. 2022, MNRAS, 512, 3703, doi: 10.1093/mnras/stac648
- Carnall et al. (2023) Carnall, A. C., McLeod, D. J., McLure, R. J., et al. 2023, MNRAS, 520, 3974, doi: 10.1093/mnras/stad369
- Carnall et al. (2024) Carnall, A. C., Cullen, F., McLure, R. J., et al. 2024, arXiv e-prints, arXiv:2405.02242, doi: 10.48550/arXiv.2405.02242
- Cecchi et al. (2019) Cecchi, R., Bolzonella, M., Cimatti, A., & Girelli, G. 2019, ApJ, 880, L14, doi: 10.3847/2041-8213/ab2c80
- Conroy & Gunn (2010) Conroy, C., & Gunn, J. E. 2010, ApJ, 712, 833, doi: 10.1088/0004-637X/712/2/833
- Conroy et al. (2009) Conroy, C., Gunn, J. E., & White, M. 2009, ApJ, 699, 486, doi: 10.1088/0004-637X/699/1/486
- Di Matteo et al. (2022) Di Matteo, T., Ni, Y., Chen, N., et al. 2022, arXiv e-prints, arXiv:2210.14960, doi: 10.48550/arXiv.2210.14960
- Di Matteo et al. (2005) Di Matteo, T., Springel, V., & Hernquist, L. 2005, Nature, 433, 604, doi: 10.1038/nature03335
- Donnari et al. (2021) Donnari, M., Pillepich, A., Nelson, D., et al. 2021, MNRAS, 506, 4760, doi: 10.1093/mnras/stab1950
- Dressler (1980) Dressler, A. 1980, ApJ, 236, 351, doi: 10.1086/157753
- Faucher-Giguère (2020) Faucher-Giguère, C.-A. 2020, MNRAS, 493, 1614, doi: 10.1093/mnras/staa302
- Feldmann & Mayer (2015) Feldmann, R., & Mayer, L. 2015, MNRAS, 446, 1939, doi: 10.1093/mnras/stu2207
- Finkelstein et al. (2023) Finkelstein, S. L., Bagley, M. B., Ferguson, H. C., et al. 2023, ApJ, 946, L13, doi: 10.3847/2041-8213/acade4
- Girelli et al. (2019) Girelli, G., Bolzonella, M., & Cimatti, A. 2019, A&A, 632, A80, doi: 10.1051/0004-6361/201834547
- Glazebrook et al. (2024) Glazebrook, K., Nanayakkara, T., Schreiber, C., et al. 2024, Nature, 628, 277, doi: 10.1038/s41586-024-07191-9
- Gould et al. (2023) Gould, K. M. L., Brammer, G., Valentino, F., et al. 2023, AJ, 165, 248, doi: 10.3847/1538-3881/accadc
- Gunn & Gott (1972) Gunn, J. E., & Gott, J. Richard, I. 1972, ApJ, 176, 1, doi: 10.1086/151605
- Harikane et al. (2023) Harikane, Y., Zhang, Y., Nakajima, K., et al. 2023, ApJ, 959, 39, doi: 10.3847/1538-4357/ad029e
- Häring & Rix (2004) Häring, N., & Rix, H.-W. 2004, ApJ, 604, L89, doi: 10.1086/383567
- Hartley et al. (2023) Hartley, A. I., Nelson, E. J., Suess, K. A., et al. 2023, MNRAS, 522, 3138, doi: 10.1093/mnras/stad1162
- Hopkins et al. (2006) Hopkins, P. F., Somerville, R. S., Hernquist, L., et al. 2006, ApJ, 652, 864, doi: 10.1086/508503
- Juodžbalis et al. (2024) Juodžbalis, I., Maiolino, R., Baker, W. M., et al. 2024, arXiv e-prints, arXiv:2403.03872, doi: 10.48550/arXiv.2403.03872
- Katz et al. (1996) Katz, N., Weinberg, D. H., & Hernquist, L. 1996, ApJS, 105, 19, doi: 10.1086/192305
- Kawata & Mulchaey (2008) Kawata, D., & Mulchaey, J. S. 2008, ApJ, 672, L103, doi: 10.1086/526544
- Kimmig et al. (2023) Kimmig, L. C., Remus, R.-S., Seidel, B., et al. 2023, arXiv e-prints, arXiv:2310.16085, doi: 10.48550/arXiv.2310.16085
- Kocevski et al. (2024) Kocevski, D. D., Finkelstein, S. L., Barro, G., et al. 2024, arXiv e-prints, arXiv:2404.03576, doi: 10.48550/arXiv.2404.03576
- Kormendy & Ho (2013) Kormendy, J., & Ho, L. C. 2013, Annual Review of Astronomy and Astrophysics, 51, 511, doi: 10.1146/annurev-astro-082708-101811
- Krumholz & Gnedin (2011) Krumholz, M. R., & Gnedin, N. Y. 2011, ApJ, 729, 36, doi: 10.1088/0004-637X/729/1/36
- Long et al. (2023) Long, A. S., Antwi-Danso, J., Lambrides, E. L., et al. 2023, arXiv e-prints, arXiv:2305.04662, doi: 10.48550/arXiv.2305.04662
- Maiolino et al. (2023) Maiolino, R., Scholtz, J., Curtis-Lake, E., et al. 2023, arXiv e-prints, arXiv:2308.01230. https://arxiv.org/abs/2308.01230
- Marinacci et al. (2018) Marinacci, F., Vogelsberger, M., Pakmor, R., et al. 2018, MNRAS, 480, 5113, doi: 10.1093/mnras/sty2206
- McConnell & Ma (2013) McConnell, N. J., & Ma, C.-P. 2013, ApJ, 764, 184, doi: 10.1088/0004-637X/764/2/184
- Mihos & Hernquist (1996) Mihos, J. C., & Hernquist, L. 1996, ApJ, 464, 641, doi: 10.1086/177353
- Naiman et al. (2018) Naiman, J. P., Pillepich, A., Springel, V., et al. 2018, MNRAS, 477, 1206, doi: 10.1093/mnras/sty618
- Natarajan et al. (2024) Natarajan, P., Pacucci, F., Ricarte, A., et al. 2024, ApJ, 960, L1, doi: 10.3847/2041-8213/ad0e76
- Nelson et al. (2018) Nelson, D., Pillepich, A., Springel, V., et al. 2018, MNRAS, 475, 624, doi: 10.1093/mnras/stx3040
- Nelson et al. (2021) Nelson, E. J., Tacchella, S., Diemer, B., et al. 2021, MNRAS, 508, 219, doi: 10.1093/mnras/stab2131
- Ni et al. (2022) Ni, Y., Di Matteo, T., Bird, S., et al. 2022, MNRAS, 513, 670, doi: 10.1093/mnras/stac351
- Okamoto et al. (2010) Okamoto, T., Frenk, C. S., Jenkins, A., & Theuns, T. 2010, MNRAS, 406, 208, doi: 10.1111/j.1365-2966.2010.16690.x
- Pacucci & Loeb (2024) Pacucci, F., & Loeb, A. 2024, ApJ, 964, 154, doi: 10.3847/1538-4357/ad3044
- Pacucci et al. (2024) Pacucci, F., Loeb, A., & Juodžbalis, I. 2024, Research Notes of the American Astronomical Society, 8, 105, doi: 10.3847/2515-5172/ad3fb8
- Pacucci et al. (2023) Pacucci, F., Nguyen, B., Carniani, S., Maiolino, R., & Fan, X. 2023, ApJ, 957, L3, doi: 10.3847/2041-8213/ad0158
- Park et al. (2024) Park, M., Belli, S., Conroy, C., et al. 2024, arXiv e-prints, arXiv:2404.17945, doi: 10.48550/arXiv.2404.17945
- Peng et al. (2010) Peng, Y.-j., Lilly, S. J., Kovač, K., et al. 2010, ApJ, 721, 193, doi: 10.1088/0004-637X/721/1/193
- Pillepich et al. (2018a) Pillepich, A., Springel, V., Nelson, D., et al. 2018a, MNRAS, 473, 4077, doi: 10.1093/mnras/stx2656
- Pillepich et al. (2018b) Pillepich, A., Nelson, D., Hernquist, L., et al. 2018b, MNRAS, 475, 648, doi: 10.1093/mnras/stx3112
- Rahmati et al. (2013) Rahmati, A., Pawlik, A. H., Raičević, M., & Schaye, J. 2013, MNRAS, 430, 2427, doi: 10.1093/mnras/stt066
- Remus & Kimmig (2023) Remus, R.-S., & Kimmig, L. C. 2023, arXiv e-prints, arXiv:2310.16089, doi: 10.48550/arXiv.2310.16089
- Schaye et al. (2015) Schaye, J., Crain, R. A., Bower, R. G., et al. 2015, MNRAS, 446, 521, doi: 10.1093/mnras/stu2058
- Schreiber et al. (2018) Schreiber, C., Glazebrook, K., Nanayakkara, T., et al. 2018, A&A, 618, A85, doi: 10.1051/0004-6361/201833070
- Silk & Rees (1998) Silk, J., & Rees, M. J. 1998, A&A, 331, L1, doi: 10.48550/arXiv.astro-ph/9801013
- Springel & Hernquist (2003) Springel, V., & Hernquist, L. 2003, MNRAS, 339, 289, doi: 10.1046/j.1365-8711.2003.06206.x
- Springel et al. (2005) Springel, V., White, S. D. M., Jenkins, A., et al. 2005, Nature, 435, 629, doi: 10.1038/nature03597
- Springel et al. (2018) Springel, V., Pakmor, R., Pillepich, A., et al. 2018, MNRAS, 475, 676, doi: 10.1093/mnras/stx3304
- Terrazas et al. (2020) Terrazas, B. A., Bell, E. F., Pillepich, A., et al. 2020, MNRAS, 493, 1888, doi: 10.1093/mnras/staa374
- Valentino et al. (2023) Valentino, F., Brammer, G., Gould, K. M. L., et al. 2023, ApJ, 947, 20, doi: 10.3847/1538-4357/acbefa
- van den Bosch et al. (2008) van den Bosch, F. C., Aquino, D., Yang, X., et al. 2008, MNRAS, 387, 79, doi: 10.1111/j.1365-2966.2008.13230.x
- Vogelsberger et al. (2014) Vogelsberger, M., Genel, S., Springel, V., et al. 2014, MNRAS, 444, 1518, doi: 10.1093/mnras/stu1536
- Weinberger et al. (2017) Weinberger, R., Springel, V., Hernquist, L., et al. 2017, MNRAS, 465, 3291, doi: 10.1093/mnras/stw2944
- Weinberger et al. (2018) Weinberger, R., Springel, V., Pakmor, R., et al. 2018, MNRAS, 479, 4056, doi: 10.1093/mnras/sty1733
- Weller et al. (2023) Weller, E. J., Pacucci, F., Natarajan, P., & Di Matteo, T. 2023, MNRAS, 522, 4963, doi: 10.1093/mnras/stad1362
- Wu et al. (2018) Wu, P.-F., van der Wel, A., Bezanson, R., et al. 2018, ApJ, 868, 37, doi: 10.3847/1538-4357/aae822
- Yue et al. (2024) Yue, M., Eilers, A.-C., Simcoe, R. A., et al. 2024, ApJ, 966, 176, doi: 10.3847/1538-4357/ad3914
- Zinger et al. (2020) Zinger, E., Pillepich, A., Nelson, D., et al. 2020, MNRAS, 499, 768, doi: 10.1093/mnras/staa2607
- Zolotov et al. (2015) Zolotov, A., Dekel, A., Mandelker, N., et al. 2015, MNRAS, 450, 2327, doi: 10.1093/mnras/stv740